Neighbourhood & Home Watch Network (England & Wales) Registered Charity No: 1133637.
1

i
Registered Charity No: 1042611
Background
The Bill Sargent Trust carries out research on housing and related issues. It seeks to
influence policy with the outcomes of the research. The Trust was established to
commemorate one of the founders of Portsmouth Housing Association, the late Reverend
Bill Sargent.
Previous research projects have covered:
• Counting the Cost: Advice Services and the Public Spending reductions
• Forces For Good: local benefits from surplus military land
• The Impact of Welfare Reform and Public Spending Reductions on Low Income
Households in Hampshire
• In the Public Interest ? Community Benefits from Ministry of Defence Land Disposals
• The role of Housing Associations in supporting their residents to find employment
and training
• The Impact of Credit on the Financially Excluded.
• Living in Temporary Accommodation in Portsmouth;
• Hidden Deprivation in Southsea;
• The Extent of Youth Homelessness in SE Hants;
• Community Development on Rowner Estate Gosport;
• The SE Hants Housing Market;
• The Needs of Asylum Seekers in Portsmouth;
• Financial Exclusion among Housing Association Tenants.
The Trust operates with close support from First Wessex Housing Association. The
Trustees are Mark Mitchell (Chair), Kirsty Rowlinson, Nigel Baldwin, Dina Gojcovic and John
Mohan.
The Trust welcomes proposals for local research projects on housing, homelessness,
poverty and related issues. The Trust is also grateful for financial contributions to its funds.
For further information on BST events and copies of this and other reports please go onto
our website www.bstrust.org.uk , for more information contact the Secretary:
Geoff Phillpotts, The Bill Sargent Trust c/o First Wessex
Peninsular House
Wharf Road
Portsmouth PO8 9HB
E-mail: [email protected] Tel: 023 9289 6793
ii
Glossary
AA Attendance Allowance
BME Black and minority ethnic
BRMA Broad Rental Market Area
CB Child Benefit
CIH Chartered Institute of Housing
CPI Consumer Price Index
CRESR Centre for Regional Economic and Social Research
CTB Council Tax Benefit
CTC Child Tax Credit
CTR Council Tax Reduction
DCLG (Department of) Communities and Local Government
DDA Disability Discrimination Act
DHPs Discretionary Housing Payments
DLA Disability Living Allowance
DPDPs Direct Payment Demonstration Projects
DWP Department for Work and Pensions
EA Equality Act 2000
ESA Employment and Support Allowance
HB Housing Benefit
HCC Housing Cost Contribution
HCP Healthcare Professional
HMO Housing of Multiple Occupation
HRP Household Reference Person
IB Incapacity Benefit
IMD Index of Multiple Deprivation
IS Income Support
JSA Jobseeker's Allowance
LAs Local Authorities
LHA Local Housing Allowance
LSOAs Lower Super Output Areas
LSVT Large scale voluntary transfer
NHF National Housing Federation
NDD Non-dependant deductions
NOMIS National Online Manpower Information System
NPI New Policy Institute
ONS Office for National Statistics
PIP Personal Independence Payment
PRS Private Rented Sector
RPI Retail Price Index
RSLs Registered Social Landlords

iii
RTB Right to Buy
SAR Shared Accommodation Rate
SDA Severe Disablement Allowance
S(E)A Supported exempt accommodation
SRS Social Rented Sector
TCs Tax Credits
UC Universal Credit
WCA Work Capability Assessment
WRAG Work Related Activity Group
WTC Working Tax Credit
iv
Contents
Executive Summary ............................................................................................................ 1
Introduction ......................................................................................................................... 7
Aims .................................................................................................................................. 7
The socio-economic context in Hampshire ........................................................................ 9
The welfare reform agenda .............................................................................................. 14
Universal Credit ............................................................................................................... 16
Scope of the reforms included in this report ..................................................................... 17
Housing Benefit – Local Housing Allowance .................................................................. 19
Introduction ..................................................................................................................... 19
The private rented sector in Hampshire ........................................................................... 20
Housing Benefit claimants in the private rented sector .................................................... 24
Local Housing Allowance................................................................................................. 28
Overview of the reforms to LHA ....................................................................................... 29
National impact of LHA reforms ....................................................................................... 30
Impact of LHA reforms in Hampshire ............................................................................... 32
Summary ......................................................................................................................... 39
Housing Benefit - Under-occupation ............................................................................... 40
Introduction ..................................................................................................................... 40
Housing Benefit claimants in the social rented sector ...................................................... 41
Overview of the under-occupation of social housing reforms ........................................... 43
National impact of under-occupation of social housing reforms ....................................... 45
Impact of under-occupation of social housing reforms in Hampshire ............................... 47
Direct Payments to tenants .............................................................................................. 50
v
Summary ......................................................................................................................... 51
Non-dependant deductions .............................................................................................. 52
Introduction ..................................................................................................................... 52
Overview of non-dependant deduction reforms ............................................................... 53
National impact of up-rating non-dependant deductions .................................................. 54
Impact of up-rating non-dependent deductions in Hampshire .......................................... 55
Summary ......................................................................................................................... 57
Household benefit cap ...................................................................................................... 58
Introduction ..................................................................................................................... 58
Overview of the benefit cap ............................................................................................. 59
National impact of benefit cap ......................................................................................... 60
Impact of benefit cap in Hampshire ................................................................................. 61
Council Tax Benefit........................................................................................................... 64
Introduction ..................................................................................................................... 64
National impact of Council Tax Benefit reforms ............................................................... 65
Impact of Council Tax Benefit reforms in Hampshire ....................................................... 66
Summary ......................................................................................................................... 67
Incapacity benefits ............................................................................................................ 68
Introduction ..................................................................................................................... 68
Overview of the reforms to incapacity benefits ................................................................. 69
National impact of incapacity benefits reforms ................................................................. 70
Impact of incapacity benefits reforms in Hampshire ......................................................... 71
Summary ......................................................................................................................... 73
Disability Living Allowance .............................................................................................. 75
Introduction ..................................................................................................................... 75
Overview of the replacement of DLA by PIP .................................................................... 76
National impact of the DLA reforms ................................................................................. 76
vi
Impact of DLA reforms in Hampshire ............................................................................... 77
Summary ......................................................................................................................... 80
HMRC reforms and up-rating of benefits ........................................................................ 81
Introduction ..................................................................................................................... 81
Overview of Tax Credit reforms ....................................................................................... 81
Impact of Tax Credit reforms in Hampshire ..................................................................... 82
Overview of Child Benefit reforms ................................................................................... 85
Impact of Child Benefit reforms in Hampshire .................................................................. 86
The one per cent up-rating of working age welfare benefits ............................................. 89
Summary ......................................................................................................................... 91
The overall impact of welfare reforms in Hampshire ...................................................... 92
Summary ......................................................................................................................... 98
Appendix: .......................................................................................................................... 99
vii
Tables
Table 1.1: Local authority level summary of IMD ranks ....................................................... 11
Table 1.2: Percentage of LSOAs in Hampshire districts within 20 per cent most deprived
LSOAs in England, IMD 2010 ............................................................................................. 13
Table 2.1: Tenure in Hampshire districts, 2011 ................................................................... 21
Table 2.2: Private rented sector households by household type - numbers ......................... 22
Table 2.3: Private rented sector households by household type - per cent .......................... 23
Table 2.4: Private rented sector ethnicity by Household Reference Person ........................ 24
Table 2.5: Housing Benefit claims by tenure, February 2013 .............................................. 25
Table 2.6: Housing Benefit claimants as a percentage of all households in each tenure,
February 2013..................................................................................................................... 26
Table 2.7: Housing Benefit claimants in Hampshire by tenure, November 2008 - February
2013 .................................................................................................................................... 27
Table 2.8: PRS HB Claimants in Hampshire, February 2013 .............................................. 28
Table 2.9: BRMAs covering Hampshire districts .................................................................. 33
Table 2.10: Change in LHA rates for BRMAs covering Hampshire, March 2011-August 2013
........................................................................................................................................... 34
Table 2.11: Impact of reforms to Housing Benefit: Local Housing Allowance ...................... 36
Table 3.1: Social rented sector households by household type - numbers .......................... 41
Table 3.2: Social rented sector households by household type - per cent ........................... 42
Table 3.3: Social rented sector ethnicity by Household Reference Person .......................... 43
Table 3.4: Impact of reforms to Housing Benefit: Under-occupation ('bedroom tax') ........... 48
Table 4.1: Impact of reforms to non-dependant deductions in Hampshire ........................... 56
Table 5.1: Impact of the household benefit cap in Hampshire ............................................. 62
Table 6.1: Impact of reforms to Council Tax Benefit in Hampshire ...................................... 66
Table 7.1: Impact of reforms to Incapacity benefits in Hampshire ....................................... 71
viii
Table 7.2: Economic activity and inactivity in Hampshire, percentage of 16-74 year olds .... 72
Table 8.1: Impact of reforms to Disability Living Allowance in Hampshire ........................... 78
Table 9.1: Impact of reforms to Tax Credits in Hampshire ................................................... 83
Table 9.2: Impact of reforms to Child Benefit in Hampshire ................................................. 87
Table 9.3: Impact of one per cent up-rating in Hampshire ................................................... 90
Table 10.1: Overall impact of welfare reforms in Hampshire ............................................... 93
Table 10.2: Distribution of financial loss across LSOAs in Hampshire ................................. 95
Table 10.3: Percentage of overall impact for each welfare reform measure, districts in
Hampshire .......................................................................................................................... 96
Table A.1: Overall impact of welfare reform, districts in Hampshire, £million per annum ..... 99
Table A.2: Overall impact of welfare reform, districts in Hampshire, £ per working age adult
per annum ......................................................................................................................... 100
Figures
Figure 1.1: Hampshire: City Councils and Shire Districts ...................................................... 8
Figure 1.2: Distribution of IMD in Hampshire, by LSOA ....................................................... 10
Figure 1.3: Index of Deprivation ranks, LSOAs in Hampshire, 2010 .................................... 12
Figure 2.1: DWP Housing Benefit expenditure, 1997/98 to 2011/12 ................................... 20
Figure 2.2: Impact of Housing Benefit reform to the LHA system in Hampshire, by LSOA .. 38
Figure 3.1: Impact of Housing Benefit under-occupation reform in the SRS in Hampshire, by
LSOA .................................................................................................................................. 49
Figure 7.1: Claimants of incapacity benefits in Hampshire, 1999-2013 ............................... 69
Figure 7.2: Impact of the incapacity benefits reforms in Hampshire, by LSOA..................... 74
Figure 8.1: Impact of DLA reforms in Hampshire, by LSOA................................................. 79
Figure 9.1: Impact of Tax Credits reforms in Hampshire, by LSOA ..................................... 84
Figure 9.2: Impact of Child Benefit reforms in Hampshire, by LSOA ................................... 88
Figure 10.1: The overall impact of welfare reform in Hampshire, by LSOA .......................... 94
1
Executive Summary
Overview
Britain is undergoing a major overhaul of its welfare system. The scale and pace of change
is substantial and rapid. Welfare reform is central to the coalition government's deficit
reduction plan and was established as a key policy area in the early stages of the coalition
coming into being. Primarily, the focus of welfare reform is on those of working age and
affects those in work, especially those in low-paid work, as well as those who are claiming
out-of-work benefits. When the present welfare reforms have come into full effect it is
estimated that they will take nearly £19bn a year out of the national economy, equivalent to
£470 a year for every adult of working age in the country.
The Bill Sargent Trust commissioned this research to understand the extent to which the
welfare reforms currently underway will impact on low income households and those in
housing need across Hampshire, including Portsmouth and Southampton. The estimates
are based on government national impact assessments, Treasury estimates of savings
made and the distribution of claimants across Hampshire. This report makes no attempt to
comment on the merits of each of the reforms but it does provide an overview of government
documentation on ten key elements of the benefit changes underway. The report
provides evidence as to the scale of financial loss across all districts in Hampshire, how this
varies significantly by place, and estimates the numbers of individuals or households
affected by each of the welfare reforms by the time they have been fully implemented. The
financial loss in Hampshire of the reforms will be just over £400 million a year when the
reforms are fully implemented, equivalent to £360 a year for every working age adult in
Hampshire.
The cumulative impact of the reforms will have severe consequences for many low income
households in Hampshire in terms of their ability to meet essential costs such as those
related to housing, energy and food. For individuals least able to gain a foothold in the
labour market, often due to compounding issues such as long-term health problems; lack of
skills, qualifications or recent experience in the workforce; their ability to adjust to the new
regime may be more limited than those who are closer to the jobs market.
It is important to remember that it is not just the households directly affected by the welfare
reforms that will be impacted upon by the changes. The loss of benefit income, which is
often large, will have knock-on consequences for local spending and thus for local
employment. The greatest impact is likely to be in the most deprived local areas and a key
effect of welfare reform will therefore be to widen the gaps in prosperity between the more
affluent and relatively deprived local areas within Hampshire.
2
Summary of the overall impacts
The financial loss in Hampshire as a result of the reforms is substantially less than some of
the hardest hit parts of the country. However, there are significant variations in impacts
within Hampshire with certain local authorities and local areas within districts hit much harder
than others. There will be local neighbourhoods with concentrations of benefit claimants
where the financial loss to individuals, families and the local community will be substantial.
• When the present welfare reforms have come into full effect they will take just over
£400 million a year out of the local economy.
• The financial loss is equivalent to £360 per year for every working age adult in
Hampshire which is substantially below the national average of £470 per year in
Great Britain.
• In the main, the loss of income for individuals directly affected by the changes will be
substantially larger especially for those affected by changes to incapacity benefits,
Disability Living Allowance and the benefit cap.
• Portsmouth has the greatest financial loss relative to the size of the working age
population, equivalent to £450 per working age adult per year; in Southampton,
Havant and Gosport the equivalent figure is between £430 and £440 per working age
adult per year.
• In absolute terms, Southampton is hit the hardest of all Hampshire districts with a
loss of £73 million a year, more than five times the amount in Hart, although the
working age population in Southampton is just over three times the size of Hart.
• The greatest impact is likely to be in the most deprived local areas within Hampshire
and welfare reform is likely to widen the gaps in prosperity between the best and
worst local areas within Hampshire.
• Over a quarter of all LSOAs in Portsmouth and Southampton will lose more than
£600,000 a year.
• The financial loss in nine LSOAs in Portsmouth, Southampton and Gosport will be
more than £1 million per year.
• Four benefit reforms account for over three quarters of the estimated financial losses
in Hampshire: incapacity benefits, Tax Credits, Child Benefit and the 1 per cent up-
rating of benefits.
• The loss of benefit income, which in certain neighbourhoods is very large, will have
knock on consequences for local spending and thus for local employment which in
turn will add a further twist to the downward spiral of some local neighbourhoods.
3
Summary of the impacts of individual benefit reforms
Housing Benefit: Local Housing Allowance
• The reforms to LHA involve changes to the rules governing assistance with the cost
of housing for low-income households in the private rented sector. The new rules
apply to rent levels, ‘excess’ payments, property size, age limits for sole occupancy,
and indexation for inflation.
• A third of all households living in the private rented sector in Hampshire receive
Housing Benefit. Therefore large numbers of households are affected by these
changes: just over 30,000 households in Hampshire.
• The reforms to LHA account for 8 per cent of the total impact of welfare reforms,
amounting to a loss to the local economy of over £32m per annum.
• Gosport, Portsmouth, Rushmoor and Southampton are the worst affected districts
within Hampshire in terms of financial loss per working age adult.
• Key considerations for Hampshire in the immediate future will be the availability of
affordable PRS accommodation across the county, and the willingness of landlords
to let to LHA tenants faced with a sizeable shortfall between their LHA entitlement
and the rent charged.
Housing Benefit: under occupation in social housing
• The under-occupation measure introduces new rules governing the size of properties
for which payments are made to working age claimants in the social rented sector
(widely known as the ‘bedroom tax’). These rules already apply to Housing Benefit
(LHA) tenants in the PRS.
• The measure affects over 9,000 households representing a total loss to the
Hampshire economy of £7m per annum.
• The overall impact of the bedroom tax is less significant than most of the other
welfare reforms accounting for just 2 per cent of the total impact of all welfare reforms
in Hampshire.
• Havant, Portsmouth and Southampton are the worst affected districts within
Hampshire in terms of the relative loss per working age adult, a reflection of the
distribution and concentration of social housing within the county.
• A key challenge in mitigating the effects of under-occupation will be the ability of
social housing providers to place affected tenants in suitable alternative
accommodation.
Non-dependant deductions
• Non-dependant deductions refers to increases in the deductions from Housing
Benefit, Council Tax Benefit and other income-based benefits to reflect the
contribution that non-dependant household members are expected to make towards
the household’s housing costs.
• The impact of these changes is twofold with 6,400 households affected and 7,500
non-dependants living in those households.
• The financial impact in Hampshire is broadly comparable in scale to that of the under-
occupation measure: the changes account for 2 per cent of the total impact of all
4
welfare reforms and amount to an estimated financial loss of just over £7m per
annum.
• The rise in non-dependant deduction rates for Housing Benefit is equivalent to an 84
per cent increase between 2010/11 and 2013/14.
• In terms of non-dependents those affected are more likely to be single, to be men
and to be on an income of less than £180 per week.
Benefit cap
• The household benefit cap introduces a new ceiling on total payments per household,
applying to the sum of a wide range of benefits for working age claimants. This is
equivalent to £350 for a single person households without children or £500 per week
for couples or lone parent households.
• Although the benefit cap has attracted significant media attention it affects a relatively
small number of households in Hampshire: 670 households in all.
• This measure has the least financial impact of all the different reforms introduced
amounting to a loss of £3m per year to the local Hampshire economy.
• While the numbers affected are small the impacts can be quite severe, especially for
households with large numbers of dependants. With this in mind BME groups which,
for various cultural and religious reasons, tend to have larger families are likely to be
disproportionately affected.
• Over half of the affected households are estimated to be resident in the districts of
Havant, Portsmouth or Southampton.
Council Tax Benefit
• Council Tax Benefit reform involves reductions in the entitlement of working age
claimants arising from a 10 per cent reduction in total payments to local authorities
from central government. The benefit new localised system introduced is called
Council Tax Reduction.
• This measure only affects claimants in eight of Hampshire's 13 local authority
districts. The other five authorities - Basingstoke and Deane, East Hampshire, Hart,
Test Valley and Winchester - have chosen not to pass the ten per cent reduction on
to claimants.
• The localisation of Council Tax support accounts for two per cent of the total impact
of all welfare reforms, a loss of £6m per year to the Hampshire economy.
• The worst affected districts in Hampshire are Gosport and Portsmouth in terms of the
relative loss per working age adult.
Incapacity benefits
• Incapacity benefits reforms involve the replacement of IB and related benefits by
ESA, with more stringent medical tests, greater conditionality and time-limiting of
non-means tested entitlement for all but the most severely ill or disabled.
• The impacts of these measures are huge both in Hampshire and nationally. They
account for one fifth of the total impact of all welfare reforms in the county with over
21,000 claimants affected.

5
• Some of those claimants will lose all of their entitlement to any benefit; others will
lose a proportion.
• The reforms will amount to claimants in Hampshire collectively receiving £78m a
year less by 2015/16. Southampton alone will lose £16m and Portsmouth £13m.
• The characteristics of those affected - long-term ill health and labour market
detachment - mean that it will be extremely difficult for many to secure suitable and
sustainable employment in an increasingly competitive labour market.
Disability Living Allowance
• DLA reform involves its replacement by Personal Independence Payments (PIP) as
the basis for financial support to help offset the additional costs faced by individuals
with disabilities. PIP also entails more stringent and frequent medical tests for
claimants.
• The changes will a have a significant impact in Hampshire affecting 21,000
individuals and amount to a loss to the local economy of £33m a year by the time
the changes are fully implemented.
• The impact of DLA changes in the context of wider welfare reform accounts for 8 per
cent of the total financial loss to residents in Hampshire.
• The impact across Hampshire mirrors that of the IB reforms with concentrations in
districts with a greater legacy of heavy industry and manufacturing.
• DLA changes are particularly problematic given the cumulative impact of the range
of welfare reform measures. While DLA is meant for the additional costs of living and
mobility for individuals with disabilities, recent evidence suggests that it is often used
for other essential items in the face of financial pressures. DLA is increasingly used
by recipients for items such as food, heating and meeting rental payments as
incomes are squeezed. A reduction or loss in payment could therefore have dire
consequences for claimants on low-incomes.
Tax Credit reforms
• A raft of changes to Child Tax Credit and Working Families Tax Credit - paid to lower
and middle income households - were introduced including altering thresholds,
withdrawal rates, supplements, income disregards, backdating provisions, reductions
in the payable costs through the childcare element, indexation and up-rating from
2011/12 onwards.
• Over 100,000 households in Hampshire will be affected to some degree by the
reform of the Tax Credit system resulting in a financial loss to the Hampshire
economy is £82m a year.
• The financial loss in Hampshire due to Tax Credits reforms is equivalent to £72 per
working age adult per year.
• If families with children claiming WTCs were affected to the same extent as nationally
(12 per cent) by the change in the requirement to work at least 24 hours between
them, then approximately would be 4,800 families in Hampshire would be affected
by this measure alone.
6
• Tax Credits have played a key role in supplementing low income for many families
and households across Hampshire and the effects of their reform will to various
extents impact on all of those recipients.
Child Benefit reforms
• Child Benefit is subject to a three-year freeze, and withdrawal of benefit from
households including a higher earner.
• The removal of Child Benefit from households with a high earner has a higher than
average effect in more affluent parts of Hampshire contributing to an overall financial
loss of £82 million a year.
• All 212,700 CB recipients in Hampshire are affected to certain extent by the freezing
of CB rates.
• An estimated 35,000 or one in twenty of all households in Hampshire are likely to be
affected by the reduction or loss of CB from households with a higher earner and
approximately 25,000 of these will lose all their CB.
The one per cent up-rating of working age welfare benefits
• The annual up-rating of value of most working-age benefits will be restricted to one
per cent for three years from 2013.
• This reform accounts for 18 per cent of the overall financial loss to the local economy
from welfare reform, equivalent to £73m per year, or £65 per working age adult
per year.
• For those in the lowest ten per cent income bracket the reduction will be equivalent to
a two per cent reduction in their overall net income.
7
1Introduction
Aims
Britain is undergoing a major overhaul of its welfare system. The scale and pace of change
is substantial and rapid. Welfare reform is central to the coalition government's deficit
reduction plan and was established as a key policy area in the early stages of the coalition
coming into being. The stated aims of the government are to provide a 'fairer', affordable
welfare system fit for the 21st century which provides long term support for the most
vulnerable and a transitional support system for individuals and families during temporary
periods of hardship. Primarily, the focus of welfare reform is on those of working age and
affects those in work, especially those in low-paid work, as well as those who are claiming
out-of-work benefits. The proposed changes are therefore going to have a very real impact
upon a wide range of benefit claimants, including Housing Benefit recipients, across Great
Britain.
The Bill Sargent Trust has commissioned this research to understand the extent to which the
welfare reforms currently underway will impact on low income households and those in
housing need across Hampshire, including Portsmouth and Southampton. Whilst
Hampshire is located in one of the wealthiest parts of the country, and will not experience
the scale of financial loss seen in some of the older industrial regions of Britain, there will be
local neighbourhoods within Hampshire with concentrations of benefit claimants where the
financial loss to individuals, families and the local community will be substantial.
The report makes no attempt to comment on the merits of each of the reforms but it does
provide an overview of government documentation on key elements of the changes
underway; and hard evidence as to the scale of individuals or households affected across
Hampshire. An assessment of the financial loss which will be incurred by those affected,
and the financial loss per local authority within Hampshire, is also provided. All the figures
presented in this report are estimates, but in every case they are deeply rooted in official
statistics - for example the Treasury's own estimates of the financial savings, the
government's Impact Assessments and benefit claimant data. When estimating the impacts
of welfare reforms this report holds all other factors constant. What this means in practice is
that it makes no assumptions about the growth of the economy or future levels of
employment and unemployment.
It needs to be remembered that the welfare reform agenda is not new and that reform of the
system was set in motion by the previous Labour government. Some of the incapacity
benefit reforms pre-date the 2010 general election but are only now taking full effect. They
have been included within this report, alongside the coalition reforms, to provide a
comprehensive assessment of the impact of the reforms currently underway.
8
8
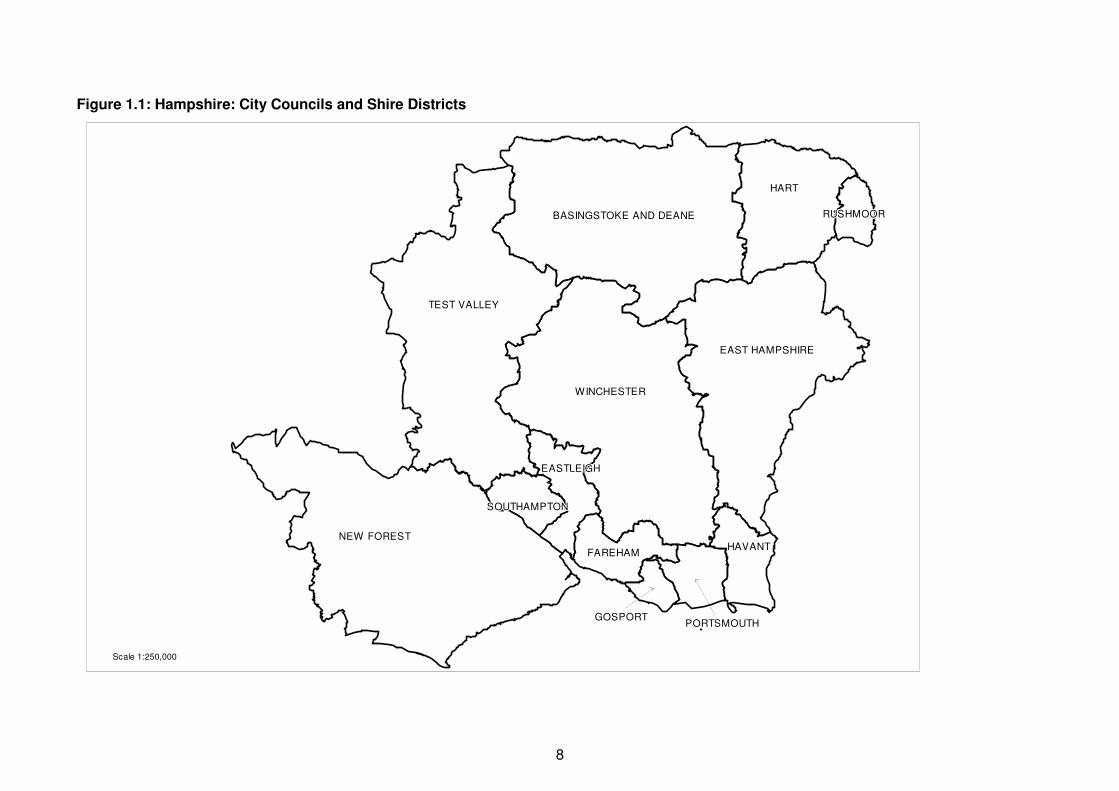
Figure 1.1: Hampshire: City Councils and Shire Districts
Scale 1:250,000
BASINGSTOKE AND DEANEBASINGSTOKE AND DEANEBASINGSTOKE AND DEANEBASINGSTOKE AND DEANEBASINGSTOKE AND DEANEBASINGSTOKE AND DEANEBASINGSTOKE AND DEANEBASINGSTOKE AND DEANEBASINGSTOKE AND DEANE
HARTHARTHARTHARTHARTHARTHARTHARTHART
RUSHMOORRUSHMOORRUSHMOORRUSHMOORRUSHMOORRUSHMOORRUSHMOORRUSHMOORRUSHMOOR
TEST VALLEYTEST VALLEYTEST VALLEYTEST VALLEYTEST VALLEYTEST VALLEYTEST VALLEYTEST VALLEYTEST VALLEY
WINCHESTERWINCHESTERWINCHESTERWINCHESTERWINCHESTERWINCHESTERWINCHESTERWINCHESTERWINCHESTER
EAST HAMPSHIREEAST HAMPSHIREEAST HAMPSHIREEAST HAMPSHIREEAST HAMPSHIREEAST HAMPSHIREEAST HAMPSHIREEAST HAMPSHIREEAST HAMPSHIRE
NEW FORESTNEW FORESTNEW FORESTNEW FORESTNEW FORESTNEW FORESTNEW FORESTNEW FORESTNEW FORESTHAVANTHAVANTHAVANTHAVANTHAVANTHAVANTHAVANTHAVANTHAVANT
PORTSMOUTHPORTSMOUTHPORTSMOUTHPORTSMOUTHPORTSMOUTHPORTSMOUTHPORTSMOUTHPORTSMOUTHPORTSMOUTHGOSPORTGOSPORTGOSPORTGOSPORTGOSPORTGOSPORTGOSPORTGOSPORTGOSPORT
FAREHAMFAREHAMFAREHAMFAREHAMFAREHAMFAREHAMFAREHAMFAREHAMFAREHAM
EASTLEIGHEASTLEIGHEASTLEIGHEASTLEIGHEASTLEIGHEASTLEIGHEASTLEIGHEASTLEIGHEASTLEIGH
SOUTHAMPTONSOUTHAMPTONSOUTHAMPTONSOUTHAMPTONSOUTHAMPTONSOUTHAMPTONSOUTHAMPTONSOUTHAMPTONSOUTHAMPTON
9
Local area data on the characteristics of residents and households across Hampshire, which
recently became available from the 2011 Census of Population outputs, is utilised alongside
small area DWP claimant statistics to illustrate where pockets of impact may be most
concentrated at a local level.
This is the second study undertaken by the research team from the Centre for Regional
Economic and Social Research (CRESR) at Sheffield Hallam University for the Bill Sargent
Trust. The original study1 provided a detailed profile of the geography of low income families,
benefit claimants and deprivation across all thirteen districts within Hampshire (see Figure
1.1). The first report also provided an assessment of the impacts of the initial welfare
reforms which had recently been announced alongside estimates of the scale of public
sector job losses in Hampshire. This report supersedes the first one and is based on the
best available knowledge and evidence presently available. It is worth noting however, that
such wide-ranging reforms can take time to filter through the system due to phased
implementation, transitional protection measures and households "muddling through". Time
lags in terms of the behavioural responses of individuals, households, landlords and other
groups affected also need to be borne in mind. This underscores the need to update such
assessments over time as more data and evidence becomes available.
The socio-economic context in Hampshire
Before setting out the welfare reform agenda in detail and considering each of the measures
in turn, it is first useful to consider the socio-economic context within Hampshire. As noted,
Hampshire is a relatively wealthy sub-region by national standards but it does contain
pockets of inequality and concentrations of deprivation which can be "hidden" when
considering the county as a whole.
In the previous report the 2007 English Indices of Multiple Deprivation (IMD) were used to
identify disadvantaged areas within Hampshire. This section uses the updated 2010 IMD2
data to pinpoint deprived areas across the county. The IMD combines 38 indicators across
seven "domains" of deprivation. These domains can either be considered separately or
combined into a single Index. These domains include the following indicators:
• income
• employment
• health and disability
• education, skills and training
• barriers to housing and services
• crime
• living environment.
1 Beatty, C., Gore, T. and Powell, R. (2011) The Impact of Welfare Reform and Public Sector Spending
Reductions on Low Income Households in Hampshire. Bill Sargent Trust: Hampshire.
http://www.shu.ac.uk/research/cresr/sites/shu.ac.uk/files/cresr-PublicSectorCutsHampshireFullReport.pdf 2 MacLennan, D. et al (2008) The English Indices of Deprivation 2010. CLG: London.
https://www.gov.uk/government/uploads/system/uploads/attachment_data/file/6320/1870718.pdf
10
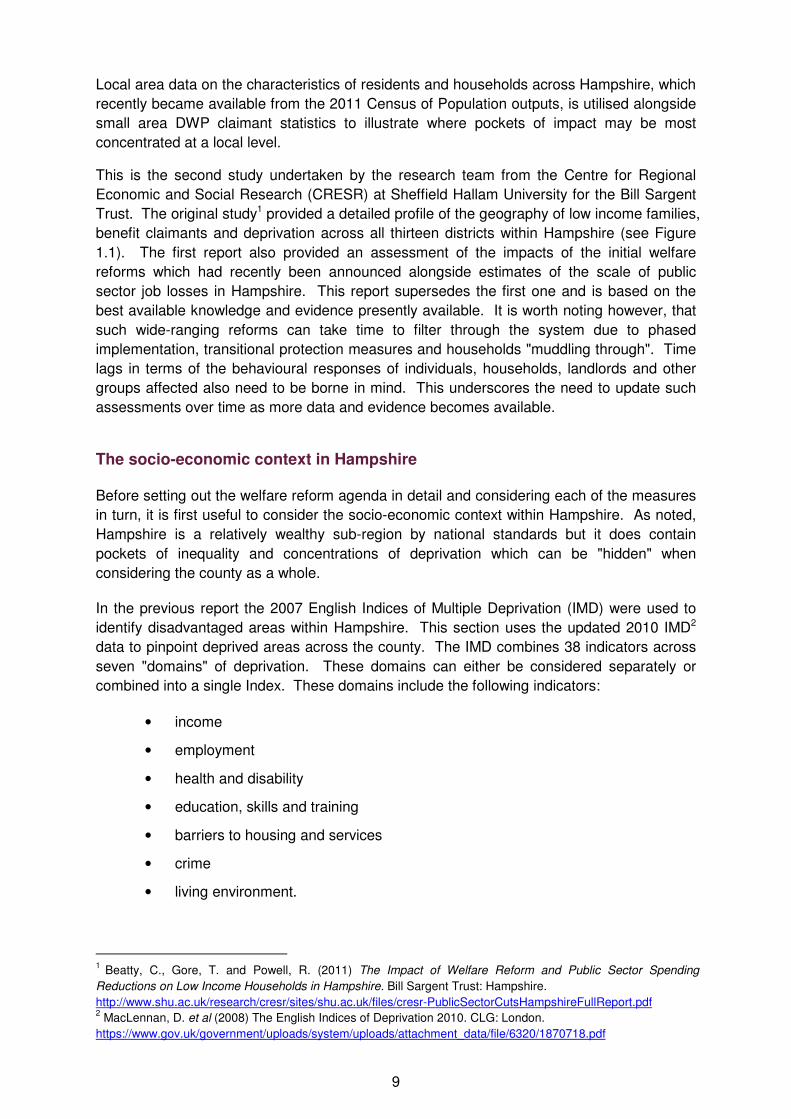
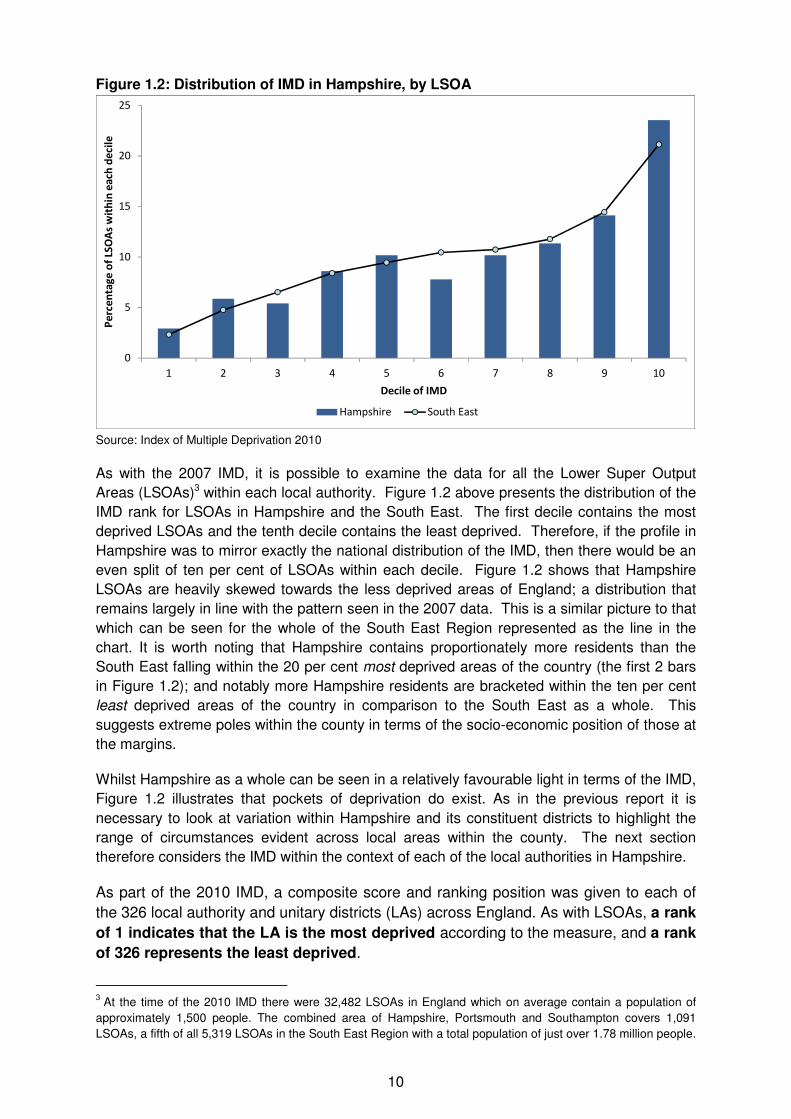
Figure 1.2: Distribution of IMD in Hampshire, by LSOA
Source: Index of Multiple Deprivation 2010
As with the 2007 IMD, it is possible to examine the data for all the Lower Super Output
Areas (LSOAs)3 within each local authority. Figure 1.2 above presents the distribution of the
IMD rank for LSOAs in Hampshire and the South East. The first decile contains the most
deprived LSOAs and the tenth decile contains the least deprived. Therefore, if the profile in
Hampshire was to mirror exactly the national distribution of the IMD, then there would be an
even split of ten per cent of LSOAs within each decile. Figure 1.2 shows that Hampshire
LSOAs are heavily skewed towards the less deprived areas of England; a distribution that
remains largely in line with the pattern seen in the 2007 data. This is a similar picture to that
which can be seen for the whole of the South East Region represented as the line in the
chart. It is worth noting that Hampshire contains proportionately more residents than the
South East falling within the 20 per cent most deprived areas of the country (the first 2 bars
in Figure 1.2); and notably more Hampshire residents are bracketed within the ten per cent
least deprived areas of the country in comparison to the South East as a whole. This
suggests extreme poles within the county in terms of the socio-economic position of those at
the margins.
Whilst Hampshire as a whole can be seen in a relatively favourable light in terms of the IMD,
Figure 1.2 illustrates that pockets of deprivation do exist. As in the previous report it is
necessary to look at variation within Hampshire and its constituent districts to highlight the
range of circumstances evident across local areas within the county. The next section
therefore considers the IMD within the context of each of the local authorities in Hampshire.
As part of the 2010 IMD, a composite score and ranking position was given to each of
the 326 local authority and unitary districts (LAs) across England. As with LSOAs, a rank
of 1 indicates that the LA is the most deprived according to the measure, and a rank
of 326 represents the least deprived.
3 At the time of the 2010 IMD there were 32,482 LSOAs in England which on average contain a population of
approximately 1,500 people. The combined area of Hampshire, Portsmouth and Southampton covers 1,091
LSOAs, a fifth of all 5,319 LSOAs in the South East Region with a total population of just over 1.78 million people.
0
5
10
15
20
25
1 2 3 4 5 6 7 8 9 10
Pe
rce
nta
ge
of
LSO
As
wit
hin
ea
ch
de
cil
e
Decile of IMD
Hampshire South East
11
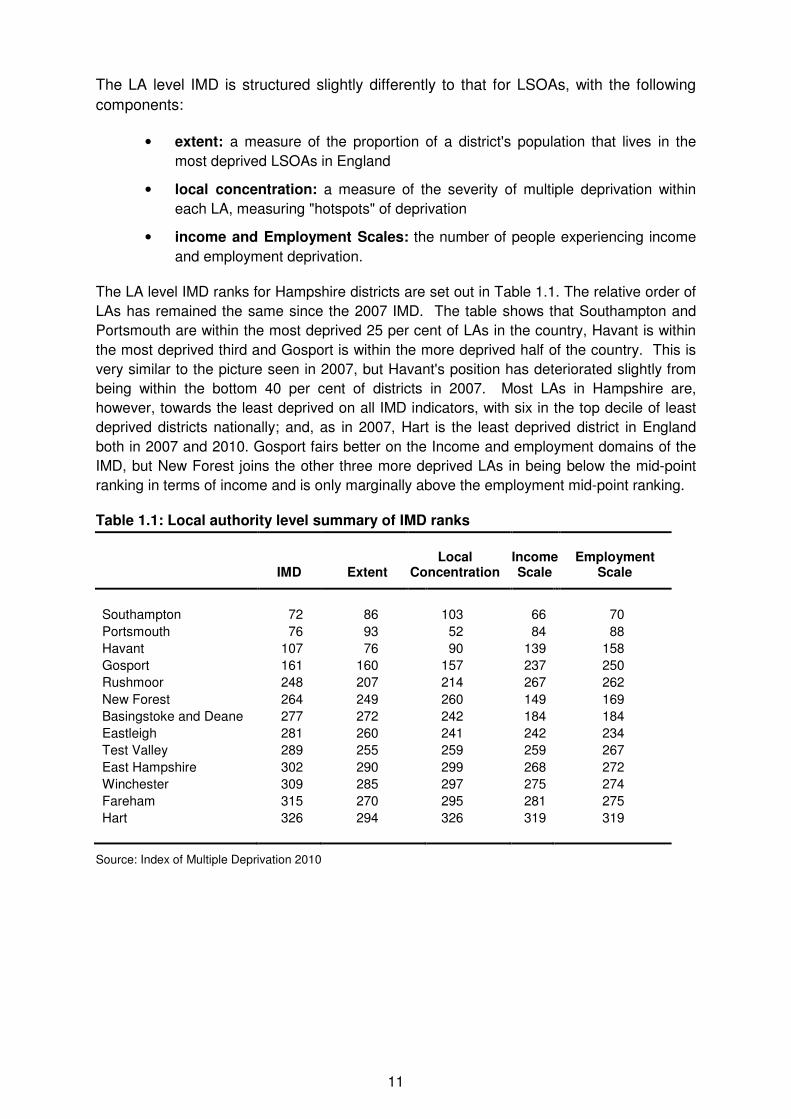
The LA level IMD is structured slightly differently to that for LSOAs, with the following
components:
• extent: a measure of the proportion of a district's population that lives in the
most deprived LSOAs in England
• local concentration: a measure of the severity of multiple deprivation within
each LA, measuring "hotspots" of deprivation
• income and Employment Scales: the number of people experiencing income
and employment deprivation.
The LA level IMD ranks for Hampshire districts are set out in Table 1.1. The relative order of
LAs has remained the same since the 2007 IMD. The table shows that Southampton and
Portsmouth are within the most deprived 25 per cent of LAs in the country, Havant is within
the most deprived third and Gosport is within the more deprived half of the country. This is
very similar to the picture seen in 2007, but Havant's position has deteriorated slightly from
being within the bottom 40 per cent of districts in 2007. Most LAs in Hampshire are,
however, towards the least deprived on all IMD indicators, with six in the top decile of least
deprived districts nationally; and, as in 2007, Hart is the least deprived district in England
both in 2007 and 2010. Gosport fairs better on the Income and employment domains of the
IMD, but New Forest joins the other three more deprived LAs in being below the mid-point
ranking in terms of income and is only marginally above the employment mid-point ranking.
Table 1.1: Local authority level summary of IMD ranks
IMD Extent Local
Concentration Income Scale
Employment Scale
Southampton 72 86 103 66 70
Portsmouth 76 93 52 84 88
Havant 107 76 90 139 158
Gosport 161 160 157 237 250
Rushmoor 248 207 214 267 262
New Forest 264 249 260 149 169
Basingstoke and Deane 277 272 242 184 184
Eastleigh 281 260 241 242 234
Test Valley 289 255 259 259 267
East Hampshire 302 290 299 268 272
Winchester 309 285 297 275 274
Fareham 315 270 295 281 275
Hart 326 294 326 319 319
Source: Index of Multiple Deprivation 2010
12
12
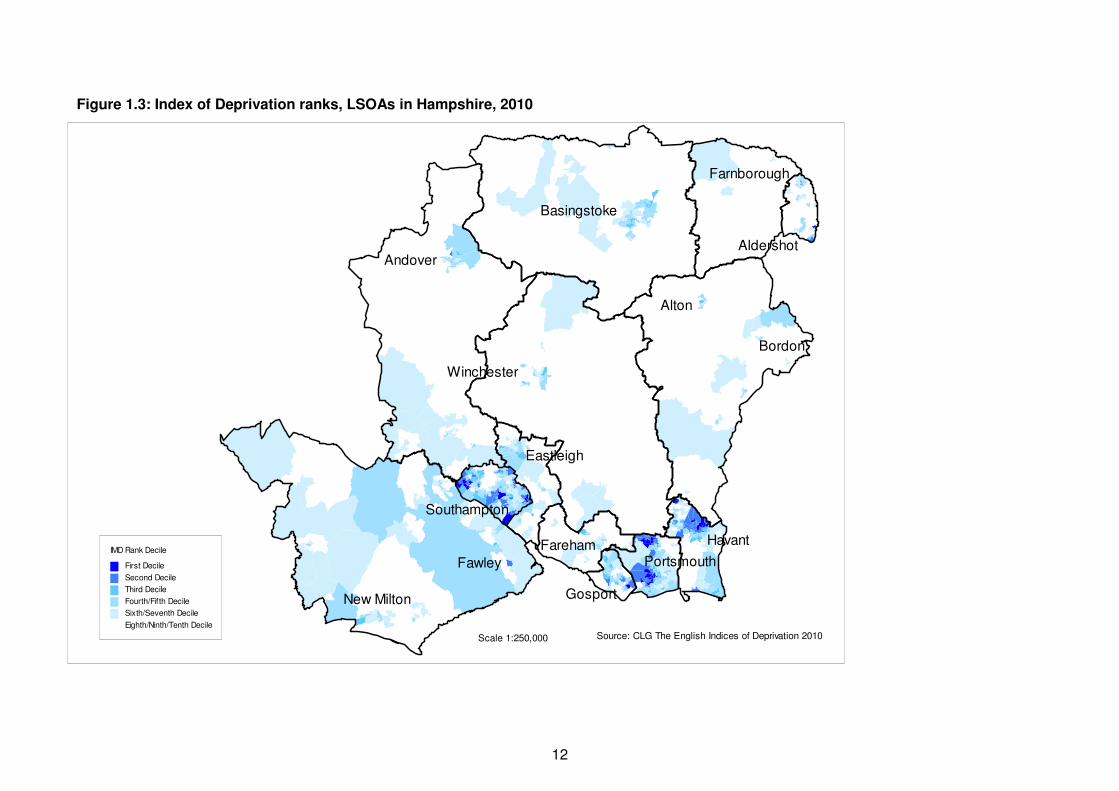
Figure 1.3: Index of Deprivation ranks, LSOAs in Hampshire, 2010
Portsmouth
Alton
Bordon
Havant
Farnborough
Basingstoke
Aldershot
Eastleigh
Fareham
Gosport
Andover
Winchester
New Milton
Fawley
Southampton
Scale 1:250,000 Source: CLG The English Indices of Deprivation 2010
IMD Rank Decile
First Decile
Second Decile
Third Decile
Fourth/Fifth Decile
Sixth/Seventh Decile
Eighth/Ninth/Tenth Decile
13
13
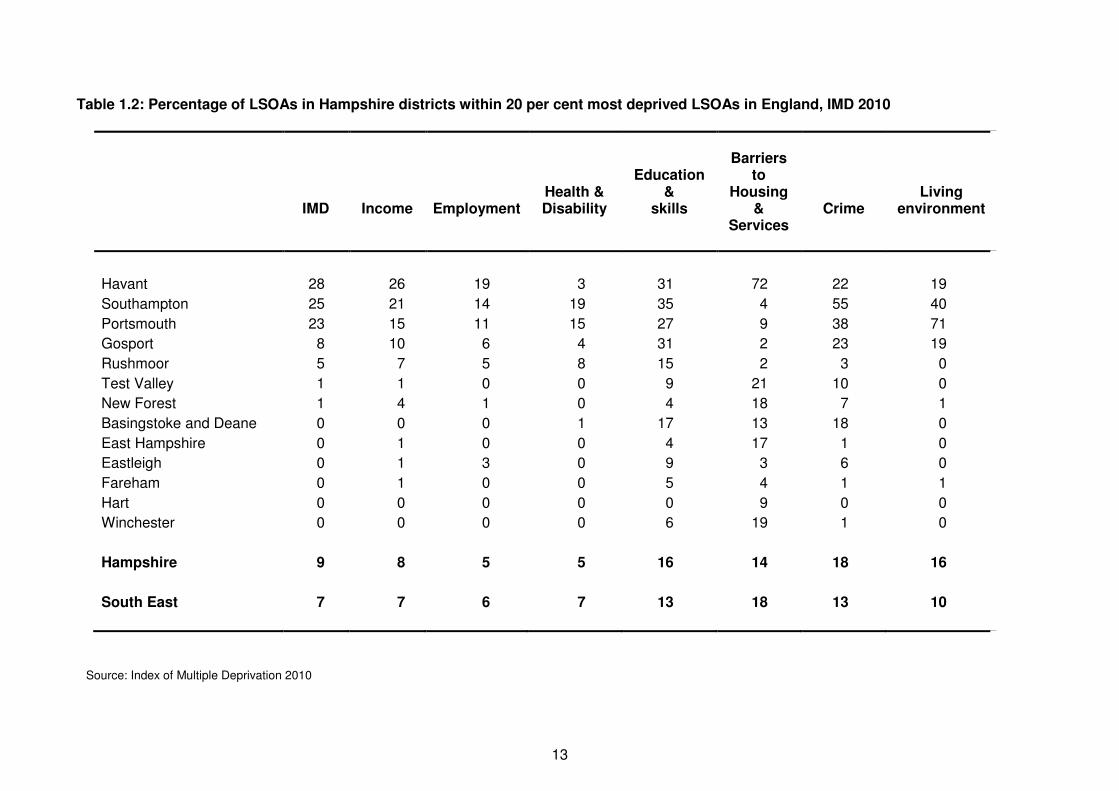
Table 1.2: Percentage of LSOAs in Hampshire districts within 20 per cent most deprived LSOAs in England, IMD 2010
IMD
Income
Employment
Health & Disability
Education &
skills
Barriers
to Housing
& Services
Crime
Living environment
Havant 28 26 19 3 31 72 22 19
Southampton 25 21 14 19 35 4 55 40
Portsmouth 23 15 11 15 27 9 38 71
Gosport 8 10 6 4 31 2 23 19
Rushmoor 5 7 5 8 15 2 3 0
Test Valley 1 1 0 0 9 21 10 0
New Forest 1 4 1 0 4 18 7 1
Basingstoke and Deane 0 0 0 1 17 13 18 0
East Hampshire 0 1 0 0 4 17 1 0
Eastleigh 0 1 3 0 9 3 6 0
Fareham 0 1 0 0 5 4 1 1
Hart 0 0 0 0 0 9 0 0
Winchester 0 0 0 0 6 19 1 0
Hampshire 9 8 5 5 16 14 18 16
South East 7 7 6 7 13 18 13 10
Source: Index of Multiple Deprivation 2010
14
14
The overall LAD indicators appear to mask quite marked local variations within their
boundaries. Figure 1.3 shows the geographical distribution across Hampshire of LSOAs
falling into national deciles as measured by the IMD 2010. The picture remains largely
similar to that presented by the previous 2007 IMD data. This shows heavy concentrations of
deprivation in particular parts of Portsmouth, Southampton, Gosport, Havant, Aldershot and
Farnborough, with isolated outliers in Basingstoke, Andover and Fawley. Apart from a
scattering of neighbourhoods in the third decile, the rest of the county is characterised by
relatively low levels of deprivation.
This variation within districts is supported by the figures in Table 1.2. There is a
concentration of deprivation in four of the Solent Local Economic Partnership districts
(Portsmouth, Southampton, Havant and Gosport), with isolated neighbourhoods elsewhere.
The proportion of LSOAs within Havant in 2010 which are within the most deprived 20 per
cent nationally (28 per cent) has actually over taken Southampton and Portsmouth since
2007, which were then top of the list with 24 per cent and 23 per cent respectively. In
addition, even in some of the wealthiest LSOA’s there will be small pockets of disadvantaged
residents in social housing, privately rented flats or houses in multiple occupation (HMOs)
that are less visible to policy makers or researchers but who face very real challenges.
The welfare reform agenda
The stated aims of the coalition government's welfare reform agenda are threefold:
• to introduce a greater degree of 'fairness' by reducing the burden of welfare
expenditure on the tax payer
• that all sections of society should contribute towards the reduction of the deficit:
reforms are designed to encourage people into employment
• to provide a safety net for the most vulnerable and a transitional support system
for those without work during temporary periods of hardship.
Current welfare reforms aim to tackle what has been characterised by the Government as
"dependency" on the benefits system. As such they are designed to incentivise work by:
• simplifying the complexity of the benefits system
• ensuring that work pays (i.e. that people are better off in work than they are on
benefits)
• increasing levels of conditionality and sanctions upon those in receipt of benefits
and compelling them to look for work.
The DWP press release accompanying the 2010 Emergency Budget4 states these aims
clearly and they have become recurrent themes throughout many of the government's policy
agendas:
'In keeping with the commitment to fairness and reform, the Department today
confirmed the details of its emergency budget settlement based around the key
principles of: protecting the most vulnerable, ensuring the best value for the taxpayer,
reforming the welfare and benefits system, creating real incentives to make work pay. At
4 HM Treasury (2010) Budget 2010, HC61. TSO, London. http://www.direct.gov.uk/prod_consum_dg/groups/
dg_digitalassets/@dg/@en/documents/digitalasset/dg_188581.pdf

15
15
its heart, is the commitment to help and support the poorest and most vulnerable in
society, whilst making almost £5 billion worth of savings for the taxpayer by 2014-15.'
DWP Press release for the Emergency Budget 22 June 2010
The initial plans announced in the Budget included reforming Housing Benefit (HB),
Disability Living Allowance (DLA), Tax Credits (TCs), Income Support (IS) for lone Parents
and changing the indexation of benefits to be in line with the Consumer Price Index (CPI).
From July 2010 to October 2010 the Government held a consultation - 21st Century Welfare5
- on "What steps should the Government consider to reduce the cost of the welfare system
and reduce welfare dependency and poverty?" This included their proposals for Universal
Credit (UC) designed to bring the majority of benefits all within one payment system:
'The Coalition Government is determined to reform the benefits system to make it
fairer, more affordable and better able to tackle poverty and reliance on welfare.
We want to deliver real change to the benefits system by making it simpler and
more efficient, with fewer benefits, fewer layers of bureaucracy and with financial
support firmly focused on making work pay.'
p1 paragraph 1, DWP (November 2010)
Welfare reform has remained prominent in the government's policy agenda, the media and
the public debate. The 2012 Autumn Statement, 6 released on 5th December 2012,
announced further cuts in the welfare system, primarily in the form of restricting indexation of
benefits to a below inflation flat rate increase of one per cent. This subsequently passed into
law through the Welfare Benefits Up-rating Act 2013.7
Whilst the ultimate aim of current welfare reform is to culminate in a simplifying of the
benefits system via the introduction of UC, this is still a long way off with UC coming under
increasing scrutiny and criticism.8 In the meantime, a raft of changes to an extensive list of
working age benefits have been implemented gradually since April 2011, with the latest
changes being implemented in April 2013. These changes are still on-going and the reforms
have led to reduced eligibility and entitlement for many claimants of in-work and out-of-work
benefits. This report will quantify the expected impact at the point they will have been fully
implemented, which in the majority of cases will be by 2014/15.9
5 DWP (November 2010) Consultation Responses to 21
st Century Welfare, Cm 7971.
http://www.dwp.gov.uk/docs/21st-century-welfare-response.pdf 6 HM Treasury (2012) Autumn Statement 2012, Cm8480. TSO: London. https://www.gov.uk/government/uploads/
system/uploads/attachment_data/file/221550/autumn_statement_2012_complete.pdf 7 Welfare Benefits Up-rating Act 2013 (c. 16). TSO: London.
http://www.legislation.gov.uk/ukpga/2013/16/pdfs/ukpga_20130016_en.pdf 8 National Audit Office (2013) Universal Credit: Early Progress. TSO: London.
9 Reforms to Disability Living Allowance will not be fully implemented until 2017/18, and the wider application of
means testing to Employment and support Allowance and the 1 per cent up-rating both of which do not fully
impact until 2015/16.
16
16
Universal Credit
Many respondents to the 21st Century Welfare consultation broadly agreed with the
principles of Universal Credit: simplifying the system and making work pay. However, many
also made the point that until the details for the development and implementation of the
system were released, they were not able to fully endorse the proposals. Concerns were
raised relating to:
• ensuring that the most vulnerable are protected
• whether there were sufficient jobs available within the economy to sustain the
reforms
• the fact that an immediate move into employment was not realistic for many
individuals faced with significant barriers to labour market entry
• the implications for tenants and landlords of housing costs being met from a
single award. It was feared that paying the housing element directly to the
Universal Credit recipient may have a negative impact on landlords’ rent
collection while causing individuals to fall into debt.
The White Paper providing details of UC - Universal Credit: welfare that works10 - was
released alongside the responses to the consultation. The subsequent 2011 Welfare
Reform Bill to implement these changes had its first reading in parliament in February 2011
and passed into law with only minor amendments in March 2012 as the Welfare Reform Act
2012.11
UC will ultimately replace just about all means-tested working age benefits under a single
benefits regime. This will simplify the benefits system and makes it more transparent as to
the total amount of in-work and out-of work benefits received by a claimant, including their
HB and TCs. The system will work in real-time, adjusting payments on a month by month
basis to take account of any earnings during each period. UC will bring about greater
convergence in elements of conditionality and sanctions across groups of claimants and will
also create a harsher sanctioning regime. The aim is for UC to be paid monthly and direct to
the claimant making the claimant "responsible" for payment of their rent and, in the main,
removing direct payment of HB to social landlords.
However, full implementation of UC is a long way off for all claimants. The initial stage of
implementation has also been slower than first anticipated. Originally it was planned to be
introduced in April 2013 in four pilot areas and in October 2013 for new claimants. It is likely
to be 2018 before UC is fully implemented.
Information on the finer details of how UC will be implemented is only just emerging.12 There
is still only limited information available in the impact assessment for UC on the extent to
which households will gain or lose under the new system, and no information on the
geographic spread of the beneficiaries or losers. Claimants who are actively moved over to
10
DWP (2010) Universal Credit: welfare that works. TSO: London. http://www.dwp.gov.uk/docs/universal-
creditfull-document.pdf 11
Welfare Reform Act 2012 (c. 5). TSO: London.
http://www.legislation.gov.uk/ukpga/2012/5/pdfs/ukpga_20120005_en.pdf 12
House of Commons Library (2013) Draft Universal Credit Regulations, Standard Note SN 06548.
http://www.parliament.uk/briefing-papers/SN06548; House of Commons Library (2013) The Housing Element of
Universal Credit, Standard Note SN 06547. http://www.parliament.uk/briefing-papers/SN06547
17
17
the new system will receive transitional protection to ensure they are "no worse off" than the
package of benefits they receive at the point of migration to the new system. Overall the
policy is held to be relatively fiscally neutral and in the long-run the net cost to the Exchequer
of UC will be £0.1bn per year. This represents an increase of £2.3bn due to changes in
entitlement and increased take-up and £2.2bn of savings due to reduced fraud, error and
overpayments.13 It is estimated that approximately 3.1 million households will benefit from a
higher entitlement under UC with an average gain of £168 per month; and that three
quarters of the households seeing a gain will be those in the bottom two quintiles of income
distribution for those in benefit receipt. It is further estimated that 2.8 million households will
have a lower entitlement as a result of the changes and will experience an average reduction
of £137 per month. A further 2.8 million households would experience no change in their
entitlement. Overall the average impact of UC across all households is estimated at £16 per
month. Given the limited detailed information available on the impact of UC when fully
implemented, the lack of local-level household data (which makes it extremely difficult to
model the local impact of UC), and the long time span before it is applicable to all claimants,
an assessment of the local impacts of UC are not included in this study. Suffice to say here
that at this very early stage of implementation one of the major points of contention and
criticism is the wholesale shift to paying HB direct to the tenant instead of the landlord in
both the PRS (where this happens already for many) and the SRS. These issues are
discussed in more depth in subsequent sections on HB reform.
Scope of the reforms included in this report
The figures presented in the report cover all the major welfare reforms that are currently
underway. In brief, these are:
Housing Benefit – Local Housing Allowance
Changes to the rules governing assistance with the cost of housing for low-income
households in the private rented sector. The new rules apply to rent levels, ‘excess’
payments, property size, age limits for sole occupancy, and indexation for inflation.
Housing Benefit – Under-occupation
New rules governing the size of properties for which payments are made to working age
claimants in the social rented sector (widely known as the ‘bedroom tax’).
Non-dependant deductions
Increases in the deductions from Housing Benefit, Council Tax Benefit and other
income-based benefits to reflect the contribution that non-dependant household
members are expected to make towards the household’s housing costs.
Household benefit cap
New ceiling on total payments per household, applying to the sum of a wide range of
benefits for working age claimants.
Council Tax Benefit
Reductions in entitlement of working age claimants arising from ten per cent reduction
in total payments to local authorities.
13
DWP (December 2012) Universal Credit Impact Assessment. https://www.gov.uk/government/uploads/system/
uploads/attachment_data/file/220177/universal-credit-wr2011-ia.pdf
18
18
Disability Living Allowance
Replacement of DLA by Personal Independence Payments (PIP), including more
stringent and frequent medical tests, as the basis for financial support to help offset the
additional costs faced by individuals with disabilities.
Incapacity benefits
Replacement of Incapacity Benefit and related benefits by Employment and Support
Allowance (ESA), with more stringent medical tests, greater conditionality and time-
limiting of non-means tested entitlement for all but the most severely ill or disabled.
Child Benefit
Three-year freeze, and withdrawal of benefit from households including a higher earner.
Tax Credits
Reductions in payment rates and eligibility for Child Tax Credit and Working Families
Tax Credit, paid to lower and middle income households.
1 per cent up-rating
Reduction in annual up-rating of value of most working-age benefits.
When fully implemented, the welfare reforms covered in this report are expected to save the
UK Treasury almost £19bn a year. The remainder of this report draws on a detailed
assessment of the local impacts of these welfare reforms for all local authorities in Britain.14
It evidences the scale of the financial loss which will fall upon households in Hampshire and
maps the spatial distribution of impact across the county.
14
Beatty, C. and Fothergill S. (2013) Hitting the Poorest Places Hardest: The local and regional impact of welfare
reform. CRESR, Sheffield Hallam University, Sheffield.
http://www.shu.ac.uk/research/cresr/sites/shu.ac.uk/files/hitting-poorest-places-hardest_0.pdf
19
2Housing Benefit – Local
Housing Allowance
Introduction
Housing Benefit (HB) is one of the key areas of concern for the government in terms of
welfare expenditure. After State Pensions, which accounted for 47 per cent of DWP benefits
expenditure in 2011/12,15 HB was the second largest single component. At £22.8billion in
2011/12 HB was double the level seen in 2000/01 and accounted for 14 per cent of the total
DWP benefits expenditure.16 Given the government has decided to protect pensions from
cuts in the current round of welfare reform, HB has been a key area of policy interest. This
chapter will consider the changes to the Local Housing Allowance (LHA) which is the way
HB is calculated for tenants in the deregulated private rented sector (PRS). Reforms to the
LHA system were amongst the first to be announced in the June 2010 Emergency Budget.
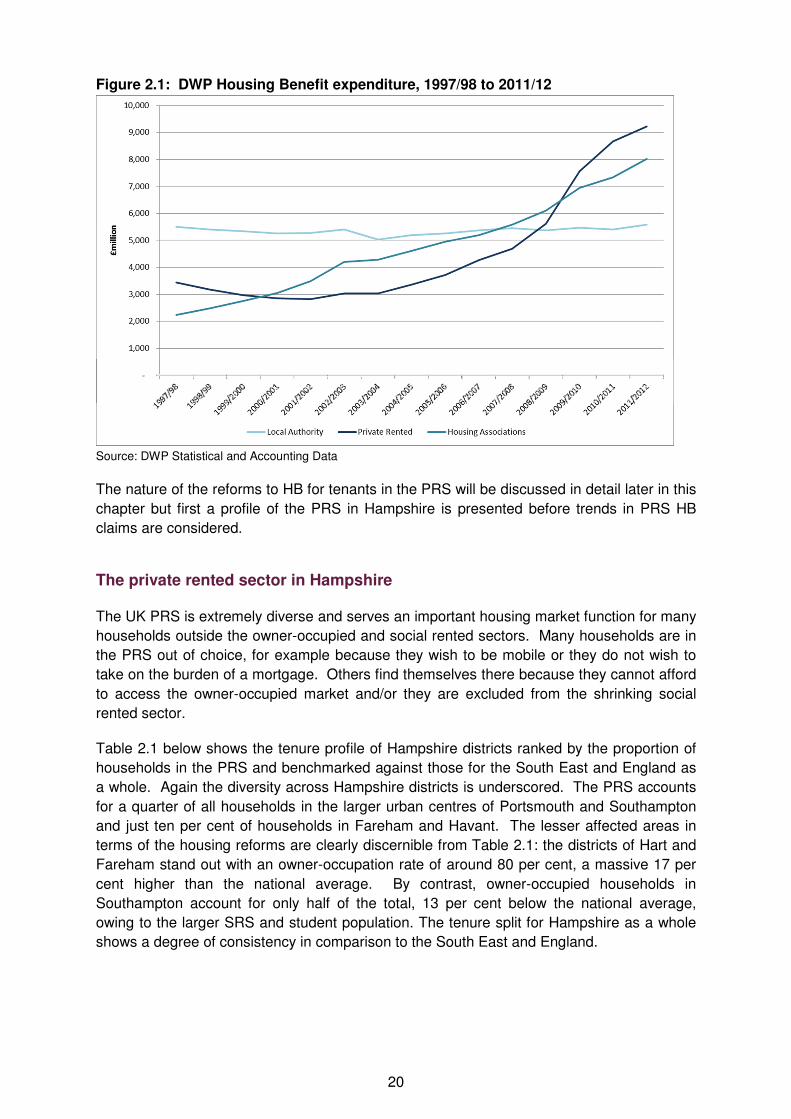
The government's basis for concern about the rising expenditure for HB, especially in the
PRS, can be seen in Figure 2.1. The growth in HB expenditure is due to a number of factors
including:
• the growth in claimants since 2008 due to the recession
• increasing numbers of in-work families on low incomes claiming HB
• a shift in the balance of claims from the Social Rented Sector (SRS) to the PRS
where rents are higher; for example, in February 2013, the average HB award
for Local Authority (LA) tenants in England was £78 a week, £88 a week for
tenants of Registered Landlords (RSLs) and £108 a week in the PRS.
Figure 2.1 shows the balance of HB expenditure in Great Britain across these tenures over
time. Though rents have increased across all tenures the steeper curve pertaining to the
PRS highlights a marked tenure shift as local authority housing continues to shrink through
the large scale voluntary transfer (LSVT) of stock and the Right to Buy (RTB). Reducing HB
expenditure in the PRS was therefore seen as a priority for the coalition government and key
elements of the reforms to LHA have been focused on reducing rents in the sector.
15
https://www.gov.uk/government/publications/benefit-expenditure-by-local-authority 16
Expenditure on Tax Credits is slightly higher but falls within the HMRC budget: £27.8billion in 2010/11. DWP
(2013) Tax Credit Expenditure in Great Britain. https://www.gov.uk/government/uploads/system/
uploads/attachment_data/file/223090/gb_tax_credit_estimates.pdf
20
Figure 2.1: DWP Housing Benefit expenditure, 1997/98 to 2011/12
Source: DWP Statistical and Accounting Data
The nature of the reforms to HB for tenants in the PRS will be discussed in detail later in this
chapter but first a profile of the PRS in Hampshire is presented before trends in PRS HB
claims are considered.
The private rented sector in Hampshire
The UK PRS is extremely diverse and serves an important housing market function for many
households outside the owner-occupied and social rented sectors. Many households are in
the PRS out of choice, for example because they wish to be mobile or they do not wish to
take on the burden of a mortgage. Others find themselves there because they cannot afford
to access the owner-occupied market and/or they are excluded from the shrinking social
rented sector.
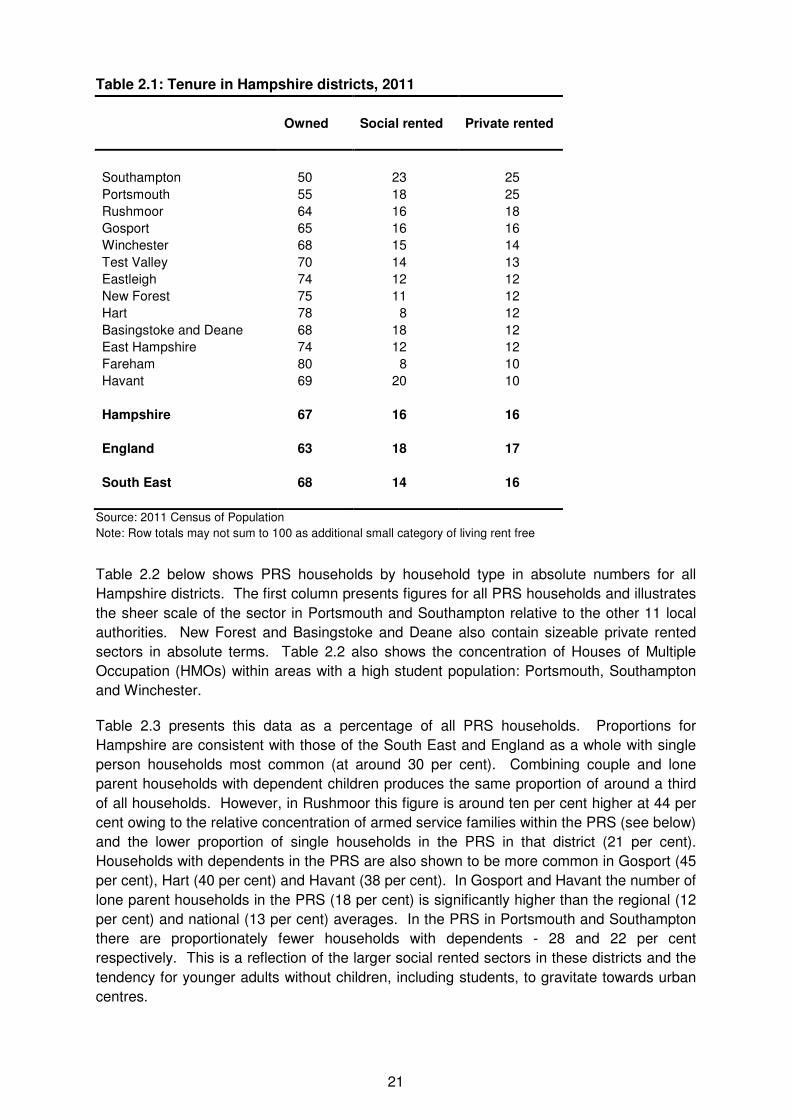
Table 2.1 below shows the tenure profile of Hampshire districts ranked by the proportion of
households in the PRS and benchmarked against those for the South East and England as
a whole. Again the diversity across Hampshire districts is underscored. The PRS accounts
for a quarter of all households in the larger urban centres of Portsmouth and Southampton
and just ten per cent of households in Fareham and Havant. The lesser affected areas in
terms of the housing reforms are clearly discernible from Table 2.1: the districts of Hart and
Fareham stand out with an owner-occupation rate of around 80 per cent, a massive 17 per
cent higher than the national average. By contrast, owner-occupied households in
Southampton account for only half of the total, 13 per cent below the national average,
owing to the larger SRS and student population. The tenure split for Hampshire as a whole
shows a degree of consistency in comparison to the South East and England.
21
Table 2.1: Tenure in Hampshire districts, 2011
Owned Social rented Private rented
Southampton 50 23 25
Portsmouth 55 18 25
Rushmoor 64 16 18
Gosport 65 16 16
Winchester 68 15 14
Test Valley 70 14 13
Eastleigh 74 12 12
New Forest 75 11 12
Hart 78 8 12
Basingstoke and Deane 68 18 12
East Hampshire 74 12 12
Fareham 80 8 10
Havant 69 20 10
Hampshire 67 16 16
England 63 18 17
South East 68 14 16
Source: 2011 Census of Population
Note: Row totals may not sum to 100 as additional small category of living rent free
Table 2.2 below shows PRS households by household type in absolute numbers for all
Hampshire districts. The first column presents figures for all PRS households and illustrates
the sheer scale of the sector in Portsmouth and Southampton relative to the other 11 local
authorities. New Forest and Basingstoke and Deane also contain sizeable private rented
sectors in absolute terms. Table 2.2 also shows the concentration of Houses of Multiple
Occupation (HMOs) within areas with a high student population: Portsmouth, Southampton
and Winchester.
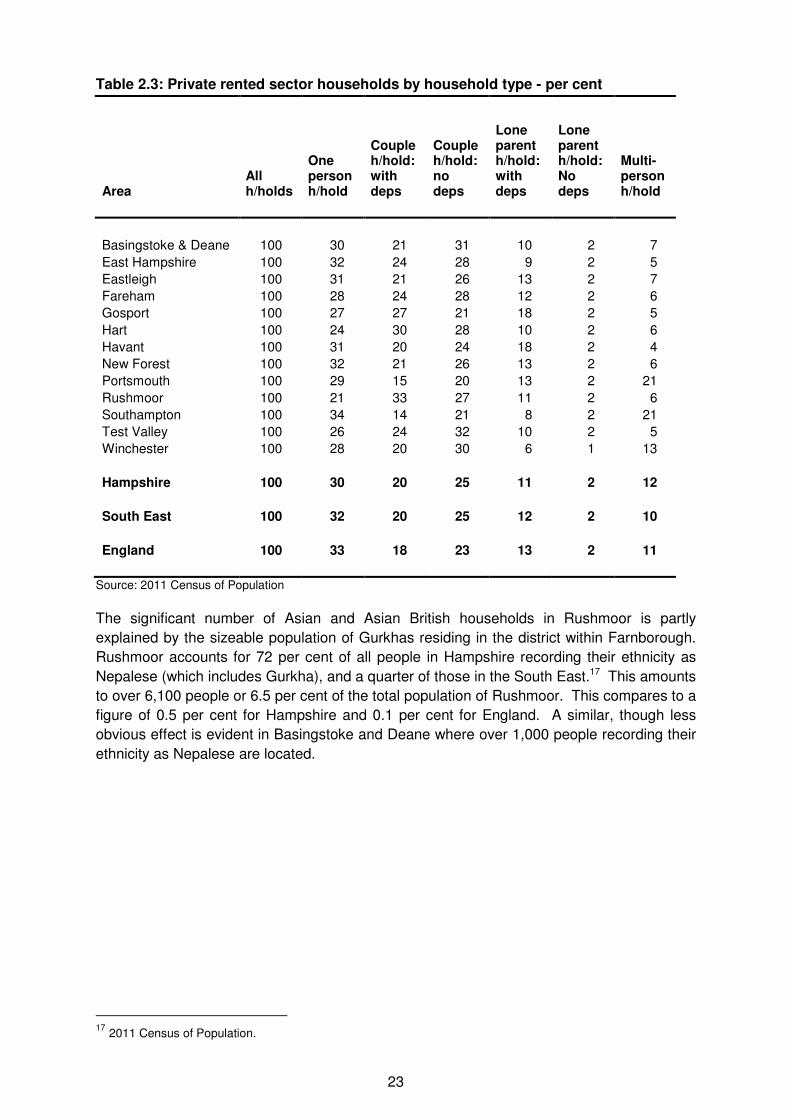
Table 2.3 presents this data as a percentage of all PRS households. Proportions for
Hampshire are consistent with those of the South East and England as a whole with single
person households most common (at around 30 per cent). Combining couple and lone
parent households with dependent children produces the same proportion of around a third
of all households. However, in Rushmoor this figure is around ten per cent higher at 44 per
cent owing to the relative concentration of armed service families within the PRS (see below)
and the lower proportion of single households in the PRS in that district (21 per cent).
Households with dependents in the PRS are also shown to be more common in Gosport (45
per cent), Hart (40 per cent) and Havant (38 per cent). In Gosport and Havant the number of
lone parent households in the PRS (18 per cent) is significantly higher than the regional (12
per cent) and national (13 per cent) averages. In the PRS in Portsmouth and Southampton
there are proportionately fewer households with dependents - 28 and 22 per cent
respectively. This is a reflection of the larger social rented sectors in these districts and the
tendency for younger adults without children, including students, to gravitate towards urban
centres.

22
Table 2.2: Private rented sector households by household type - numbers
Area All h/holds
One person h/hold
Couple h/hold: with deps
Couple h/hold: no deps
Lone parent h/hold: with deps
Lone parent h/hold: No deps
Multi-person h/hold
Basingstoke & Deane 9,075 2,701 1,917 2,827 863 156 611
East Hampshire 6,227 1,996 1,464 1,746 563 152 306
Eastleigh 6,852 2,132 1,409 1,796 904 147 464
Fareham 5,057 1,418 1,205 1,393 630 105 306
Gosport 6,119 1,678 1,641 1,285 1,085 140 290
Hart 4,639 1,110 1,376 1,322 451 95 285
Havant 5,606 1,765 1,127 1,354 1,029 113 218
New Forest 10,312 3,288 2,184 2,698 1,330 236 576
Portsmouth 22,140 6,340 3,333 4,481 2,960 376 4,650
Rushmoor 6,681 1,387 2,212 1,832 705 133 412
Southampton 25,501 8,560 3,658 5,412 2,140 392 5,339
Test Valley 6,960 1,797 1,699 2,222 727 150 365
Winchester 7,550 2,118 1,543 2,285 489 111 1,004
Hampshire 122,719 36,290 24,768 30,653 13,876 2,306 14,826
South East 624,193 197,872 126,601 152,943 72,455 13,104 61,218
England 4,011,034 1,316,913 722,544 918,288 515,452 89,444 448,393
Source: 2011 Census of Population
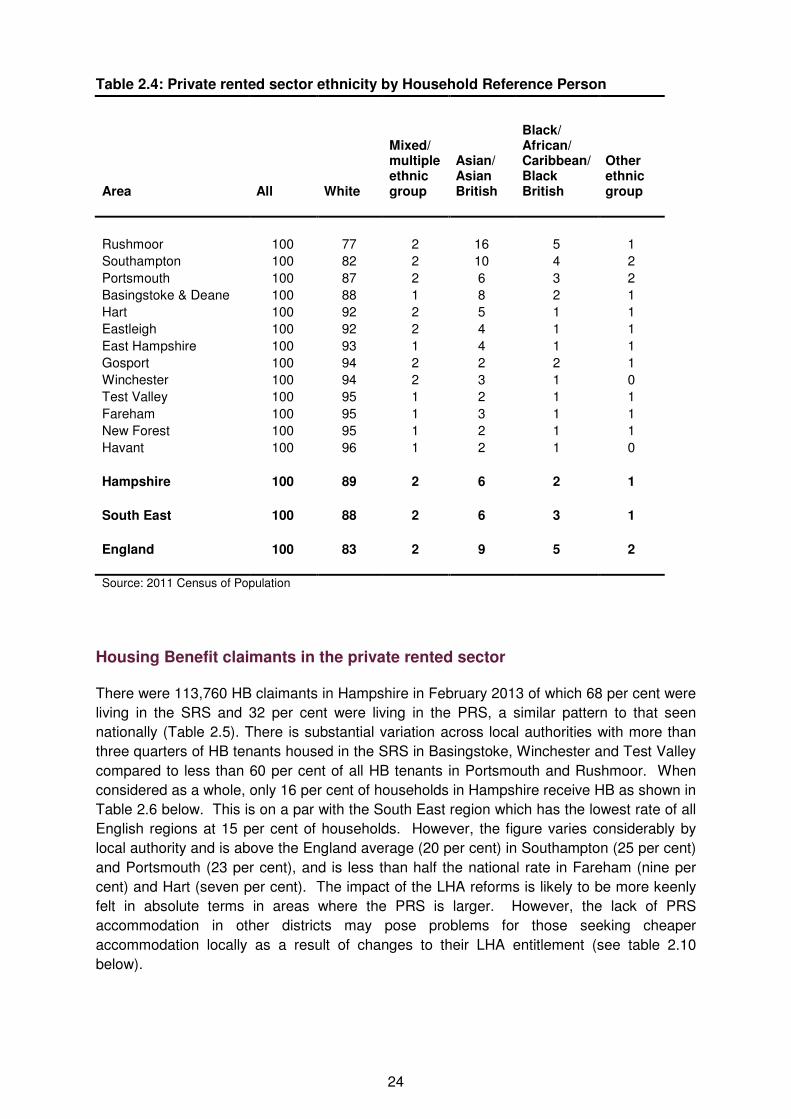
Table 2.4 below provides an indicator of the ethnic diversity within the PRS and shows the
proportion of households in the sector by the ethnicity of the Household Reference Person
(HRP), which broadly refers to the Head of the Household. The private rented sectors in
Hampshire and the South East are less diverse than that nationally with almost 90 per cent
of HRPs recording their ethnicity as White compared to 83 per cent for England overall. For
the majority of districts within Hampshire, this figure is even higher at around 92-96 per cent.
Only four districts record a PRS with more than ten per cent of households headed by a non-
White individual: Basingstoke and Deane, Portsmouth, Rushmoor and Southampton.
Households headed by Asian and Asian British HRPs show a relative concentration in
Rushmoor and Southampton.
23
Table 2.3: Private rented sector households by household type - per cent
Area All h/holds
One person h/hold
Couple h/hold: with deps
Couple h/hold: no deps
Lone parent h/hold: with deps
Lone parent h/hold: No deps
Multi-person h/hold
Basingstoke & Deane 100 30 21 31 10 2 7
East Hampshire 100 32 24 28 9 2 5
Eastleigh 100 31 21 26 13 2 7
Fareham 100 28 24 28 12 2 6
Gosport 100 27 27 21 18 2 5
Hart 100 24 30 28 10 2 6
Havant 100 31 20 24 18 2 4
New Forest 100 32 21 26 13 2 6
Portsmouth 100 29 15 20 13 2 21
Rushmoor 100 21 33 27 11 2 6
Southampton 100 34 14 21 8 2 21
Test Valley 100 26 24 32 10 2 5
Winchester 100 28 20 30 6 1 13
Hampshire 100 30 20 25 11 2 12
South East 100 32 20 25 12 2 10
England 100 33 18 23 13 2 11
Source: 2011 Census of Population
The significant number of Asian and Asian British households in Rushmoor is partly
explained by the sizeable population of Gurkhas residing in the district within Farnborough.
Rushmoor accounts for 72 per cent of all people in Hampshire recording their ethnicity as
Nepalese (which includes Gurkha), and a quarter of those in the South East.17 This amounts
to over 6,100 people or 6.5 per cent of the total population of Rushmoor. This compares to a
figure of 0.5 per cent for Hampshire and 0.1 per cent for England. A similar, though less
obvious effect is evident in Basingstoke and Deane where over 1,000 people recording their
ethnicity as Nepalese are located.
17
2011 Census of Population.
24
Table 2.4: Private rented sector ethnicity by Household Reference Person
Area All White
Mixed/ multiple ethnic group
Asian/ Asian British
Black/ African/ Caribbean/ Black British
Other ethnic group
Rushmoor 100 77 2 16 5 1
Southampton 100 82 2 10 4 2
Portsmouth 100 87 2 6 3 2
Basingstoke & Deane 100 88 1 8 2 1
Hart 100 92 2 5 1 1
Eastleigh 100 92 2 4 1 1
East Hampshire 100 93 1 4 1 1
Gosport 100 94 2 2 2 1
Winchester 100 94 2 3 1 0
Test Valley 100 95 1 2 1 1
Fareham 100 95 1 3 1 1
New Forest 100 95 1 2 1 1
Havant 100 96 1 2 1 0
Hampshire 100 89 2 6 2 1
South East 100 88 2 6 3 1
England 100 83 2 9 5 2
Source: 2011 Census of Population
Housing Benefit claimants in the private rented sector
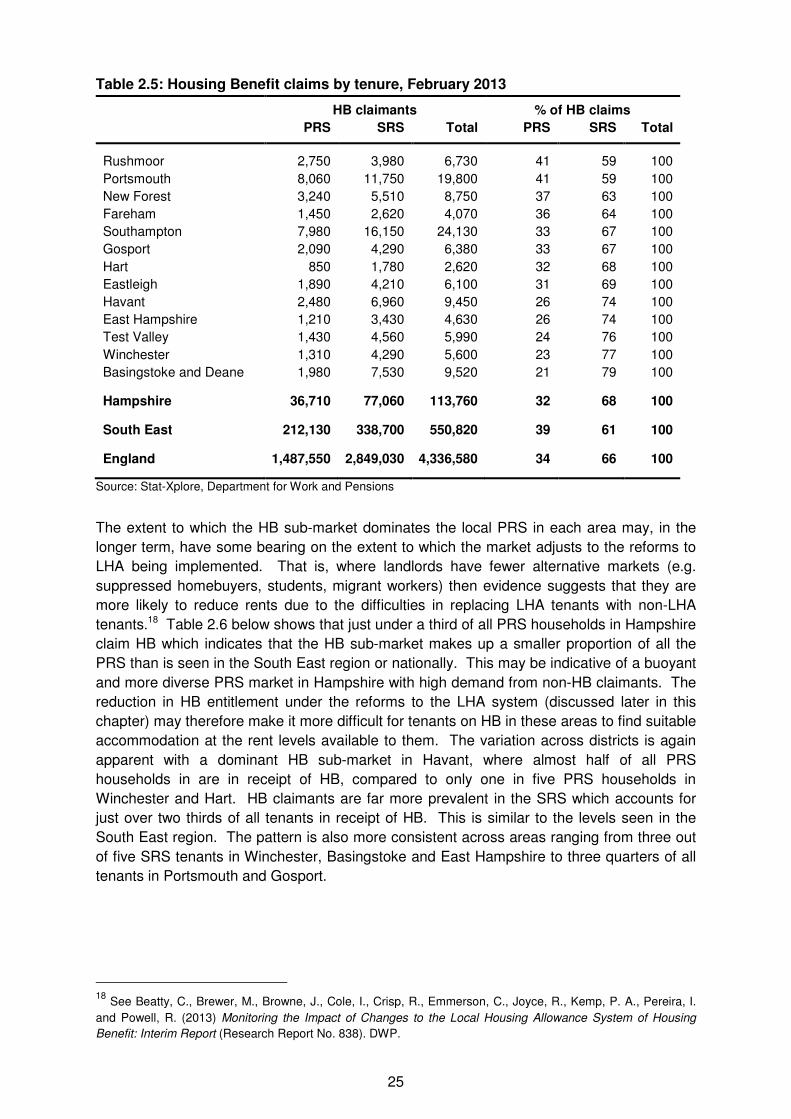
There were 113,760 HB claimants in Hampshire in February 2013 of which 68 per cent were
living in the SRS and 32 per cent were living in the PRS, a similar pattern to that seen
nationally (Table 2.5). There is substantial variation across local authorities with more than
three quarters of HB tenants housed in the SRS in Basingstoke, Winchester and Test Valley
compared to less than 60 per cent of all HB tenants in Portsmouth and Rushmoor. When
considered as a whole, only 16 per cent of households in Hampshire receive HB as shown in
Table 2.6 below. This is on a par with the South East region which has the lowest rate of all
English regions at 15 per cent of households. However, the figure varies considerably by
local authority and is above the England average (20 per cent) in Southampton (25 per cent)
and Portsmouth (23 per cent), and is less than half the national rate in Fareham (nine per
cent) and Hart (seven per cent). The impact of the LHA reforms is likely to be more keenly
felt in absolute terms in areas where the PRS is larger. However, the lack of PRS
accommodation in other districts may pose problems for those seeking cheaper
accommodation locally as a result of changes to their LHA entitlement (see table 2.10
below).
25
Table 2.5: Housing Benefit claims by tenure, February 2013
HB claimants % of HB claims
PRS SRS Total PRS SRS Total
Rushmoor 2,750 3,980 6,730 41 59 100
Portsmouth 8,060 11,750 19,800 41 59 100
New Forest 3,240 5,510 8,750 37 63 100
Fareham 1,450 2,620 4,070 36 64 100
Southampton 7,980 16,150 24,130 33 67 100
Gosport 2,090 4,290 6,380 33 67 100
Hart 850 1,780 2,620 32 68 100
Eastleigh 1,890 4,210 6,100 31 69 100
Havant 2,480 6,960 9,450 26 74 100
East Hampshire 1,210 3,430 4,630 26 74 100
Test Valley 1,430 4,560 5,990 24 76 100
Winchester 1,310 4,290 5,600 23 77 100
Basingstoke and Deane 1,980 7,530 9,520 21 79 100
Hampshire 36,710 77,060 113,760 32 68 100
South East 212,130 338,700 550,820 39 61 100
England 1,487,550 2,849,030 4,336,580 34 66 100
Source: Stat-Xplore, Department for Work and Pensions
The extent to which the HB sub-market dominates the local PRS in each area may, in the
longer term, have some bearing on the extent to which the market adjusts to the reforms to
LHA being implemented. That is, where landlords have fewer alternative markets (e.g.
suppressed homebuyers, students, migrant workers) then evidence suggests that they are
more likely to reduce rents due to the difficulties in replacing LHA tenants with non-LHA
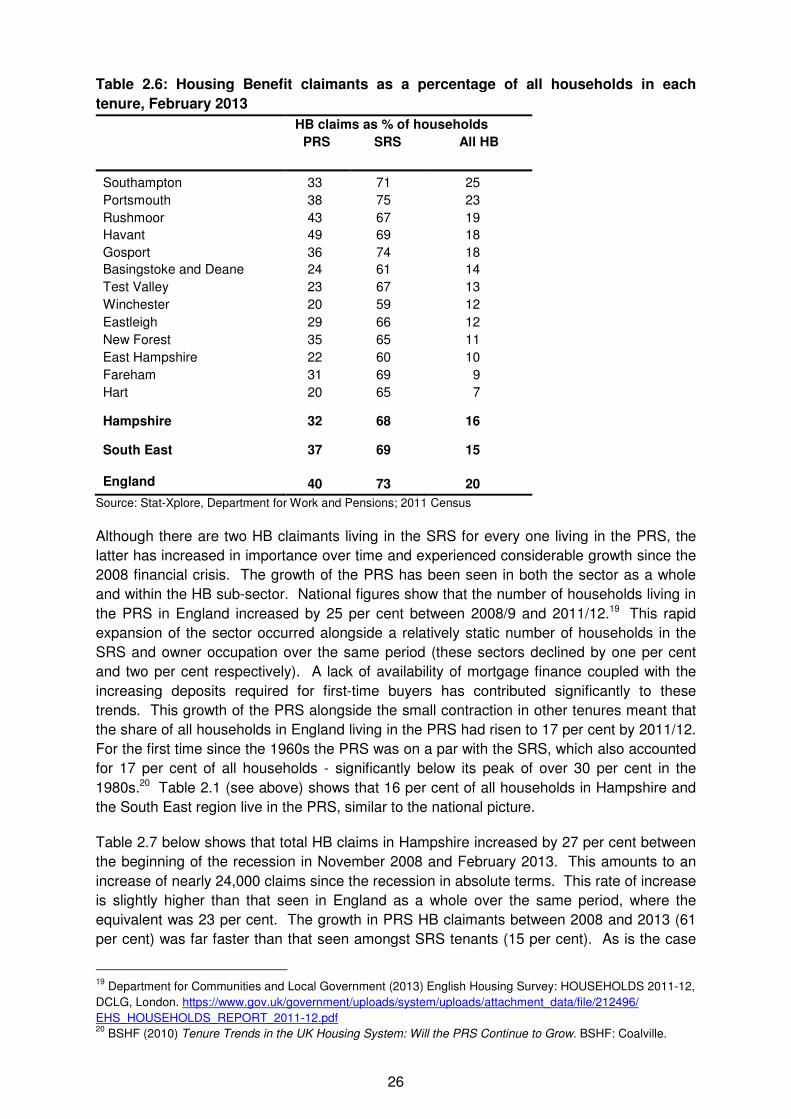
tenants.18 Table 2.6 below shows that just under a third of all PRS households in Hampshire
claim HB which indicates that the HB sub-market makes up a smaller proportion of all the
PRS than is seen in the South East region or nationally. This may be indicative of a buoyant
and more diverse PRS market in Hampshire with high demand from non-HB claimants. The
reduction in HB entitlement under the reforms to the LHA system (discussed later in this
chapter) may therefore make it more difficult for tenants on HB in these areas to find suitable
accommodation at the rent levels available to them. The variation across districts is again
apparent with a dominant HB sub-market in Havant, where almost half of all PRS
households in are in receipt of HB, compared to only one in five PRS households in
Winchester and Hart. HB claimants are far more prevalent in the SRS which accounts for
just over two thirds of all tenants in receipt of HB. This is similar to the levels seen in the
South East region. The pattern is also more consistent across areas ranging from three out
of five SRS tenants in Winchester, Basingstoke and East Hampshire to three quarters of all
tenants in Portsmouth and Gosport.
18 See Beatty, C., Brewer, M., Browne, J., Cole, I., Crisp, R., Emmerson, C., Joyce, R., Kemp, P. A., Pereira, I.
and Powell, R. (2013) Monitoring the Impact of Changes to the Local Housing Allowance System of Housing
Benefit: Interim Report (Research Report No. 838). DWP.
26
Table 2.6: Housing Benefit claimants as a percentage of all households in each
tenure, February 2013
HB claims as % of households
PRS SRS All HB
Southampton 33 71 25
Portsmouth 38 75 23
Rushmoor 43 67 19
Havant 49 69 18
Gosport 36 74 18
Basingstoke and Deane 24 61 14
Test Valley 23 67 13
Winchester 20 59 12
Eastleigh 29 66 12
New Forest 35 65 11
East Hampshire 22 60 10
Fareham 31 69 9
Hart 20 65 7
Hampshire 32 68 16
South East 37 69 15
England 40 73 20
Source: Stat-Xplore, Department for Work and Pensions; 2011 Census
Although there are two HB claimants living in the SRS for every one living in the PRS, the
latter has increased in importance over time and experienced considerable growth since the
2008 financial crisis. The growth of the PRS has been seen in both the sector as a whole
and within the HB sub-sector. National figures show that the number of households living in
the PRS in England increased by 25 per cent between 2008/9 and 2011/12.19 This rapid
expansion of the sector occurred alongside a relatively static number of households in the
SRS and owner occupation over the same period (these sectors declined by one per cent
and two per cent respectively). A lack of availability of mortgage finance coupled with the
increasing deposits required for first-time buyers has contributed significantly to these
trends. This growth of the PRS alongside the small contraction in other tenures meant that
the share of all households in England living in the PRS had risen to 17 per cent by 2011/12.
For the first time since the 1960s the PRS was on a par with the SRS, which also accounted
for 17 per cent of all households - significantly below its peak of over 30 per cent in the
1980s.20 Table 2.1 (see above) shows that 16 per cent of all households in Hampshire and
the South East region live in the PRS, similar to the national picture.
Table 2.7 below shows that total HB claims in Hampshire increased by 27 per cent between
the beginning of the recession in November 2008 and February 2013. This amounts to an
increase of nearly 24,000 claims since the recession in absolute terms. This rate of increase
is slightly higher than that seen in England as a whole over the same period, where the
equivalent was 23 per cent. The growth in PRS HB claimants between 2008 and 2013 (61
per cent) was far faster than that seen amongst SRS tenants (15 per cent). As is the case
19
Department for Communities and Local Government (2013) English Housing Survey: HOUSEHOLDS 2011-12,
DCLG, London. https://www.gov.uk/government/uploads/system/uploads/attachment_data/file/212496/
EHS_HOUSEHOLDS_REPORT_2011-12.pdf 20
BSHF (2010) Tenure Trends in the UK Housing System: Will the PRS Continue to Grow. BSHF: Coalville.
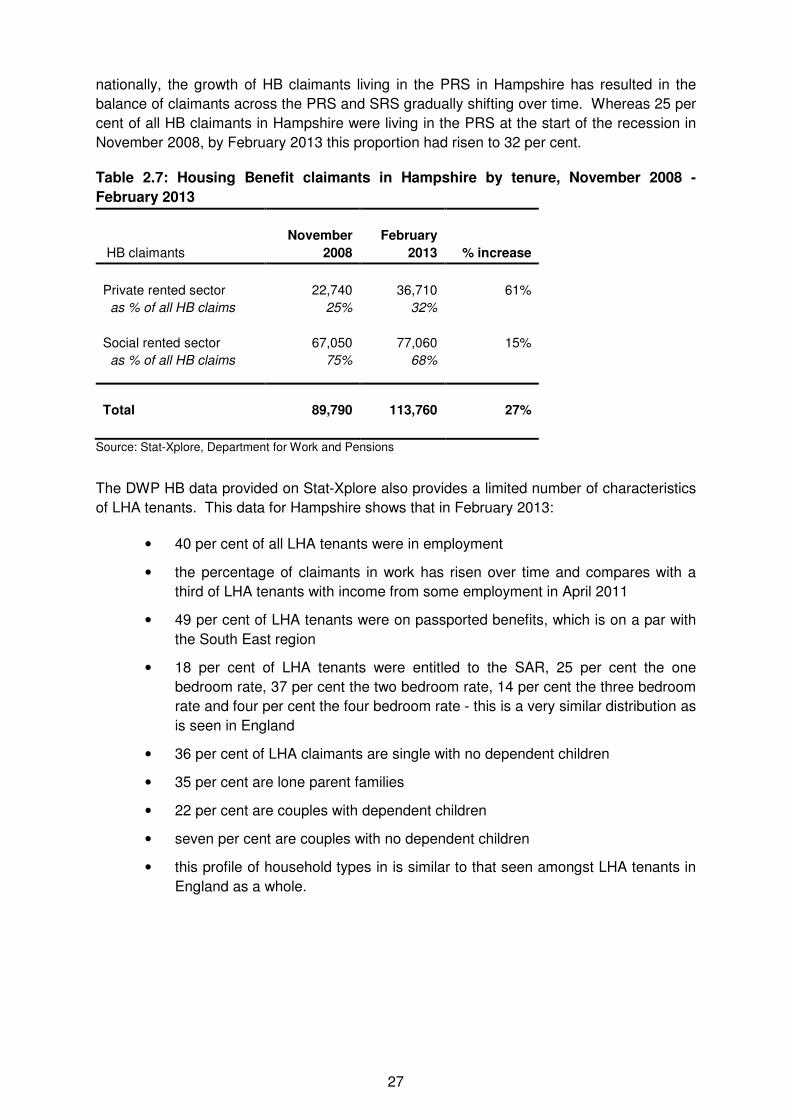
27
nationally, the growth of HB claimants living in the PRS in Hampshire has resulted in the
balance of claimants across the PRS and SRS gradually shifting over time. Whereas 25 per
cent of all HB claimants in Hampshire were living in the PRS at the start of the recession in
November 2008, by February 2013 this proportion had risen to 32 per cent.
Table 2.7: Housing Benefit claimants in Hampshire by tenure, November 2008 -
February 2013
HB claimants
November
2008
February
2013 % increase
Private rented sector 22,740 36,710 61%
as % of all HB claims 25% 32%
Social rented sector 67,050 77,060 15%
as % of all HB claims 75% 68%
Total 89,790 113,760 27%
Source: Stat-Xplore, Department for Work and Pensions
The DWP HB data provided on Stat-Xplore also provides a limited number of characteristics
of LHA tenants. This data for Hampshire shows that in February 2013:
• 40 per cent of all LHA tenants were in employment
• the percentage of claimants in work has risen over time and compares with a
third of LHA tenants with income from some employment in April 2011
• 49 per cent of LHA tenants were on passported benefits, which is on a par with
the South East region
• 18 per cent of LHA tenants were entitled to the SAR, 25 per cent the one
bedroom rate, 37 per cent the two bedroom rate, 14 per cent the three bedroom
rate and four per cent the four bedroom rate - this is a very similar distribution as
is seen in England
• 36 per cent of LHA claimants are single with no dependent children
• 35 per cent are lone parent families
• 22 per cent are couples with dependent children
• seven per cent are couples with no dependent children
• this profile of household types in is similar to that seen amongst LHA tenants in
England as a whole.
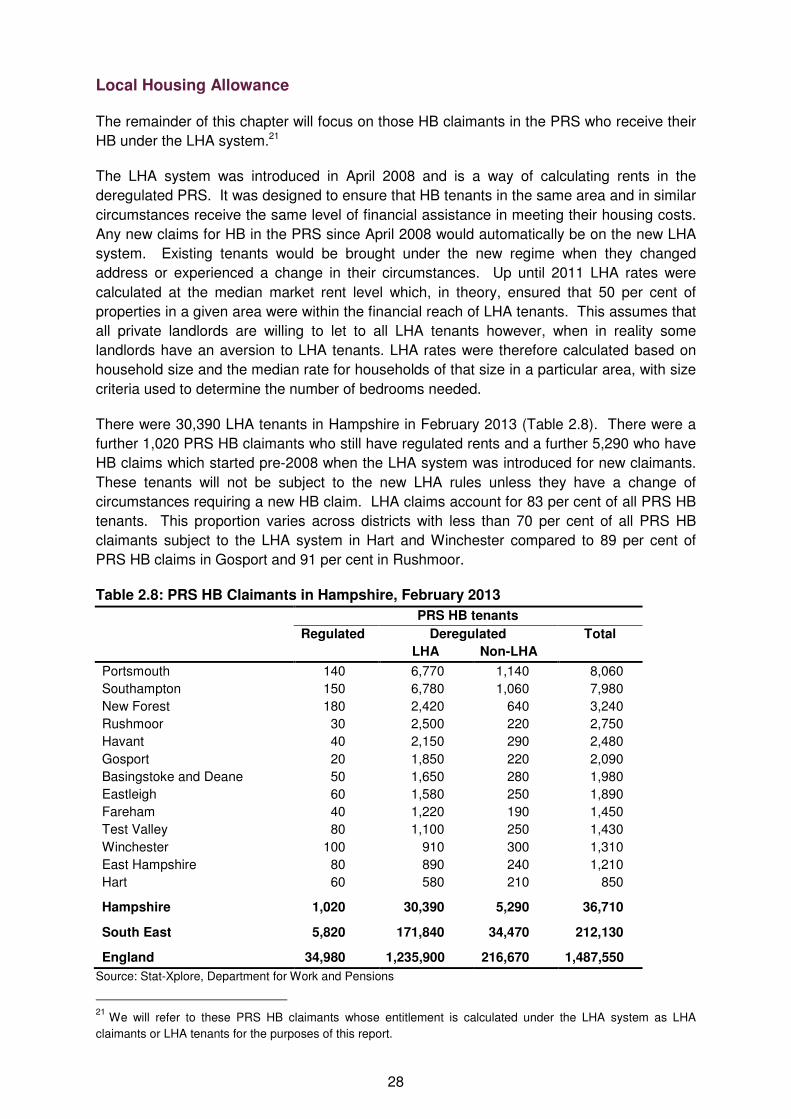
28
Local Housing Allowance
The remainder of this chapter will focus on those HB claimants in the PRS who receive their
HB under the LHA system.21
The LHA system was introduced in April 2008 and is a way of calculating rents in the
deregulated PRS. It was designed to ensure that HB tenants in the same area and in similar
circumstances receive the same level of financial assistance in meeting their housing costs.
Any new claims for HB in the PRS since April 2008 would automatically be on the new LHA
system. Existing tenants would be brought under the new regime when they changed
address or experienced a change in their circumstances. Up until 2011 LHA rates were
calculated at the median market rent level which, in theory, ensured that 50 per cent of
properties in a given area were within the financial reach of LHA tenants. This assumes that
all private landlords are willing to let to all LHA tenants however, when in reality some
landlords have an aversion to LHA tenants. LHA rates were therefore calculated based on
household size and the median rate for households of that size in a particular area, with size
criteria used to determine the number of bedrooms needed.
There were 30,390 LHA tenants in Hampshire in February 2013 (Table 2.8). There were a
further 1,020 PRS HB claimants who still have regulated rents and a further 5,290 who have
HB claims which started pre-2008 when the LHA system was introduced for new claimants.
These tenants will not be subject to the new LHA rules unless they have a change of
circumstances requiring a new HB claim. LHA claims account for 83 per cent of all PRS HB
tenants. This proportion varies across districts with less than 70 per cent of all PRS HB
claimants subject to the LHA system in Hart and Winchester compared to 89 per cent of
PRS HB claims in Gosport and 91 per cent in Rushmoor.
Table 2.8: PRS HB Claimants in Hampshire, February 2013
PRS HB tenants
Regulated Deregulated Total
LHA Non-LHA
Portsmouth 140 6,770 1,140 8,060
Southampton 150 6,780 1,060 7,980
New Forest 180 2,420 640 3,240
Rushmoor 30 2,500 220 2,750
Havant 40 2,150 290 2,480
Gosport 20 1,850 220 2,090
Basingstoke and Deane 50 1,650 280 1,980
Eastleigh 60 1,580 250 1,890
Fareham 40 1,220 190 1,450
Test Valley 80 1,100 250 1,430
Winchester 100 910 300 1,310
East Hampshire 80 890 240 1,210
Hart 60 580 210 850
Hampshire 1,020 30,390 5,290 36,710
South East 5,820 171,840 34,470 212,130
England 34,980 1,235,900 216,670 1,487,550
Source: Stat-Xplore, Department for Work and Pensions
21
We will refer to these PRS HB claimants whose entitlement is calculated under the LHA system as LHA
claimants or LHA tenants for the purposes of this report.

29
Overview of the reforms to LHA
Reforms to the LHA system were amongst the first to be announced in the June 2010
Emergency Budget. Details of the reforms can be found in a series of DWP Impact
Assessments22 and a Housing Commons Standard Note23 summarising the changes which
consist of:
• abolishing the 5-bedroom Local Housing Allowance (LHA) rate and thereby
restricting the maximum benefit entitlement to the 4-bedroom rate (from April
2011)
• capping maximum weekly LHA rates for different sizes of property (£250 per
week for 1 bedroom, £290 per week for two bedrooms, £340 per week for 3
bedrooms and 4 bedrooms a week for 4 bedrooms) (from April 2011)
• setting LHA rates based on the 30th percentile of private sector rents as opposed
to the median or 50th percentile (April 2011)
• removing the £15 weekly excess available to some claimants (April 2011) (i.e. in
cases where the contractual rent is below the LHA rate claimants were
previously allowed to retain a maximum of £15 per week)24
• increased expenditure on Discretionary Housing Payments (DHPs) of £10
million in 2011/12 and £40 million thereafter in acknowledgement of the potential
transitional costs for some households.
A second set of measures was introduced in the Comprehensive Spending Review in
October 2010:
• increasing the age limit for the shared room rate for PRS tenants from 25 to 35
(January 2012)
• basing future changes to LHA rates for PRS tenants on the Consumer Price
Index (CPI) rather than on the basis of local rents (April 2013).
As part of the measures there was also a temporary widening of the discretion of local
authorities (LAs) to direct payment of the rent to landlords in return for rent reductions. The
changes to the LHA system were amongst the first of all the welfare reforms to be
implemented in April 2011. In the first instance only new claimants were directly affected.
Existing tenants were given nine months transitional protection from the point of the annual
renewal of the HB claim, so all claimants under the LHA system were not subject to the new
rules until January 2012.
22
DWP (2010) Housing Benefit: Changes to the Local Housing Allowance Arrangements: Impact Assessment.
https://www.gov.uk/government/uploads/system/uploads/attachment_data/file/214327/lha-impact-nov10.pdf;
DWP (2010) Impacts of Housing Benefit proposals: Changes to the Local Housing Allowance to be introduced in
2011-12. http://www.dwp.gov.uk/docs/impacts-of-hb-proposals.pdf;
DWP (2012) Housing Benefit - Uprating Local Housing Allowance rates by CPI from April 2013: Impact
Assessment. http://www.parliament.uk/documents/impact-assessments/IA11-040H.pdf 23
House of Commons Library (2013) The reform of Housing Benefit (Local Housing Allowance) for tenants in
private rented housing, SN/SP/4957. http://www.parliament.uk/briefing-papers/SN04957/the-reform-of-housing-
benefit-(local-housing-allowance)-for-tenants-in-private-rented-housing 24
This was already planned by the previous Labour Government was introduced in April 2011 alongside the
measures announced in the 2010 Emergency Budget.
30
The government also announced that from April 2011 the size criteria used to assess HB for
people in the PRS would be increased to include an additional bedroom for those with a long
term health problem or disability and a proven need for overnight care from a non-residential
carer. The Government also announced that it would provide local authorities with additional
funding for Discretionary Housing Payments (DHPs) to help them to provide assistance to
those with shortfalls in their rent due to the introduction of the reforms. It is up to local
councils how they utilise this money to help those who need it most. Baseline funding for
DHPs was £20m a year. In 2011/12 an additional £10m was provided for the LHA reforms
rising to £40m a year from 2012/13 to 2014/15. However, it needs to be noted that an
additional £40m in DHPs will only offset approximately 2.5 per cent of the reduction in HB
payments due to the reforms. DHPs are therefore likely to be targeted at the most adversely
affected vulnerable households locally.
National impact of LHA reforms
The aims of the reforms to the LHA system are fourfold. As with all the welfare reforms
being implemented, the fundamental desire to reduce the overall welfare expenditure is core
to the reform, but only part of the picture. The second stated aim of the reforms to the LHA
system is to provide a fairer HB system by removing situations where individuals can
potentially receive large HB payments in areas of high market rents:
'From April 2011 the overall caps on Local Housing Allowance rates will address
excessively high rates of benefit paid to some customers'
DWP Impact Assessment p6
However, whilst much was made at the time in the press of examples of families living in
very high rent properties in central parts of London, in reality only a very small proportion of
all HB claims were above the level of the maximum caps. An analysis by DWP25 shows that
only 0.2 per cent, or just over 10,000 of the total 4.8m HB awards, were over £400 in
November 2010.
The third stated aim of the reforms reinforces the idea of "fairness" by stating that those
families on benefits cannot choose to live in properties that would be unaffordable to many
people in work and thereby remove work disincentives created by receiving high rates of
benefit:
'Importantly, the measures announced will provide a fairer and more sustainable
Housing Benefit scheme by taking steps to ensure that people on benefit are not living
in accommodation that would be out of reach of most people in work. This will also
begin to address the disincentives to work in the current system created by high rates of
benefit.'
DWP Impact Assessment p6
Finally the government also hopes to exert a downward pressure on private sector rent
levels through the break with the link to average PRS market rents and restricting growth in
LHA rates to CPI, or in later years a one per cent up-rating. The National Housing
25
DWP (2011) Housing Benefit by Level of Awards, https://www.gov.uk/government/uploads/system/
uploads/attachment_data/file/223081/hb_awards_march_2011.pdf

31
Federation,26 Shelter and the Chartered Institute of Housing (CIH) have been amongst those
trying to highlight the potential long term impact of such a break from market rates. They
estimate that in the last five years PRS market rents have increased by 37 per cent and that
increases of six per cent a year between 2015-18 were not unreasonable to expect, making
it more and more difficult for HB tenants in the PRS in high rent areas to access suitable
housing in the longer term.
The official DWP Equality Impact Assessment shows27 the cumulative impact of the first
measures announced for LHA. This includes the removal of the £15 excess, the caps on
LHA payments, the abolition of the 5-bedroom rate and the shift from setting LHA rates at
the 50th to the 30th percentile. In practice, however, the overall caps on entitlements do not
impact on Hampshire as the incidence of that measure is largely confined to areas of central
London with very high rents. This cumulative impact assessment does not account for the
changes to the SAR or the move to up-rating LHA based on the CPI rather than the RPI
which are discussed later.
Turning to the impact of these combined measures then it is estimated that, nationally:
• 92 per cent of claims affected will be of working age with the remaining 8 per
cent of claimants are of retirement age
• 19 per cent will have a disability (where this is measured as claimants with a HB
award with a Disability Premium or Severe Disability Premium or those
passported to full HB by an award of Employment and Support Allowance (ESA)
or Income Support with a Disability Premium
• 32 per cent will be lone parents (predominantly females)
• 15 per cent will be couples with children
• 5 per cent couples with no children
• 40 per cent will be single
• around 13 per cent will be non-white.
Therefore larger families, BME groups and women are more likely to be affected by the LHA
cuts. As the Equality Impact Assessment for these combined measures notes:
'The assessment of the impact by individual measure shows that families are likely to be
affected disproportionately by the overall caps in Local Housing Allowance rates and
the removal of the five bedroom rate. As some ethnic minority groups tend to have a
higher proportion of large families, these measures may impact on them
disproportionately. However, limitations in current data prevent the scope to draw on
quantitative evidence to establish the scale of this potential effect.'
p14 DWP Equality Impact Assessment
26
National Housing Federation (2012) Home Truths. 27
DWP (2010) Equality Impact Assessment Housing Benefit: Changes to the Local Housing Allowance
arrangements and Housing Benefit size criteria for people with non-resident overnight carers, November 2010.
https://www.gov.uk/government/uploads/system/uploads/attachment_data/file/214328/lha-eia-nov10.pdf
32
The Equality Impact Assessment28 for the up-rating of LHA by the CPI shows a similar
pattern in terms of gender and ethnicity as the combined measures above. However, the
assessment uses a different definition of Disability based on the Disability Discrimination Act
(DDA). When this measure is used half of all HB PRS renters affected by the measure are
estimated to have a DDA disability.
The Equality Impact Assessment29 for the increase in age threshold from 25 to 35 for the
Shared Accommodation Rate (SAR) indicates that approximately 10 per cent of all the LHA
caseload will be single without dependents, and aged 25 to 34 and thereby affected by the
new rules. However, approximately a third of these will already live in shared
accommodation so:
• six per cent of all LHA claimants will be affected by the reform
• up to another four per cent of LHA claimants already living in shared
accommodation could potentially be affected by the rules if they moved
properties before their 35th birthday as they would no longer be entitled to the
one bedroom LHA rate
• most of those affected are men (72 per cent); this reflects that whereas there
are more younger women than men on HB in general, many of these women
are lone parents and so are not affected by the policy
• 16 per cent of those aged 25-34 who are directly affected because they are
currently in a one bedroom property will be in work
• 44 per cent of those affected will be on income-related JSA
• eight per cent of those affected are on income-related ESA - this does not
include those on contribution-based ESA or IB
• 18 per cent of all single childless LHA recipients aged 25-34 will receive
disability elements to their HB (this excludes those with a Severe Disability
Premium as they are exempt from the new rules); about half of these will
come under the Equality Act 2010 (EA) definition of disability
• the ethnicity of those who are affected is not known, but it is known that 21
per cent of all single private renters aged 25-34 without children are from
BME groups.
Impact of LHA reforms in Hampshire
The LHA rate in any given locality is calculated at the Broad Rental Market Area (BRMA)
level which, in most cases, is inconsistent with conventional administrative geographies. As
a result BRMAs may straddle several local authorities; and different parts of the same local
authority may have different LHA rates. In Hampshire there are 11 BRMAs covering the 13
local authority districts and these are set out in Table 2.9 below.
28
DWP (2011) Housing Benefit: Uprating Local Housing Allowance by the Consumer Price Index: Determination
of Appropriate Maximum Housing Benefit in the Private Rented Sector: Equality Impact Assessment, March 2011.
http://www.parliament.uk/documents/impact-assessments/IA11-022AX.pdf 29
DWP (2011) Housing Benefit Equality Impact Assessment: Increasing the Shared Accommodation Rate age
threshold to 35, Revised August 2011. http://www.dwp.gov.uk/docs/eia-hb-shared-accommodation-age-
threshold.pdf
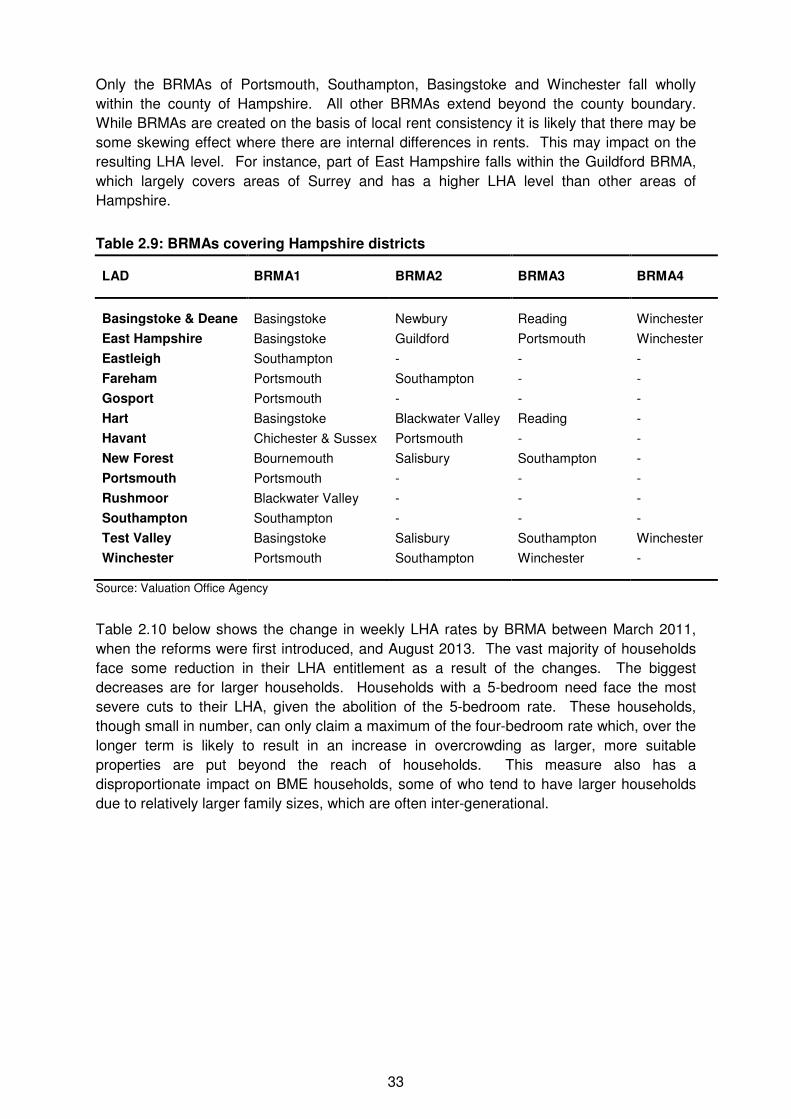
33
Only the BRMAs of Portsmouth, Southampton, Basingstoke and Winchester fall wholly
within the county of Hampshire. All other BRMAs extend beyond the county boundary.
While BRMAs are created on the basis of local rent consistency it is likely that there may be
some skewing effect where there are internal differences in rents. This may impact on the
resulting LHA level. For instance, part of East Hampshire falls within the Guildford BRMA,
which largely covers areas of Surrey and has a higher LHA level than other areas of
Hampshire.
Table 2.9: BRMAs covering Hampshire districts
LAD BRMA1 BRMA2 BRMA3 BRMA4
Basingstoke & Deane Basingstoke Newbury Reading Winchester
East Hampshire Basingstoke Guildford Portsmouth Winchester
Eastleigh Southampton - - -
Fareham Portsmouth Southampton - -
Gosport Portsmouth - - -
Hart Basingstoke Blackwater Valley Reading -
Havant Chichester & Sussex Portsmouth - -
New Forest Bournemouth Salisbury Southampton -
Portsmouth Portsmouth - - -
Rushmoor Blackwater Valley - - -
Southampton Southampton - - -
Test Valley Basingstoke Salisbury Southampton Winchester
Winchester Portsmouth Southampton Winchester -
Source: Valuation Office Agency
Table 2.10 below shows the change in weekly LHA rates by BRMA between March 2011,
when the reforms were first introduced, and August 2013. The vast majority of households
face some reduction in their LHA entitlement as a result of the changes. The biggest
decreases are for larger households. Households with a 5-bedroom need face the most
severe cuts to their LHA, given the abolition of the 5-bedroom rate. These households,
though small in number, can only claim a maximum of the four-bedroom rate which, over the
longer term is likely to result in an increase in overcrowding as larger, more suitable
properties are put beyond the reach of households. This measure also has a
disproportionate impact on BME households, some of who tend to have larger households
due to relatively larger family sizes, which are often inter-generational.
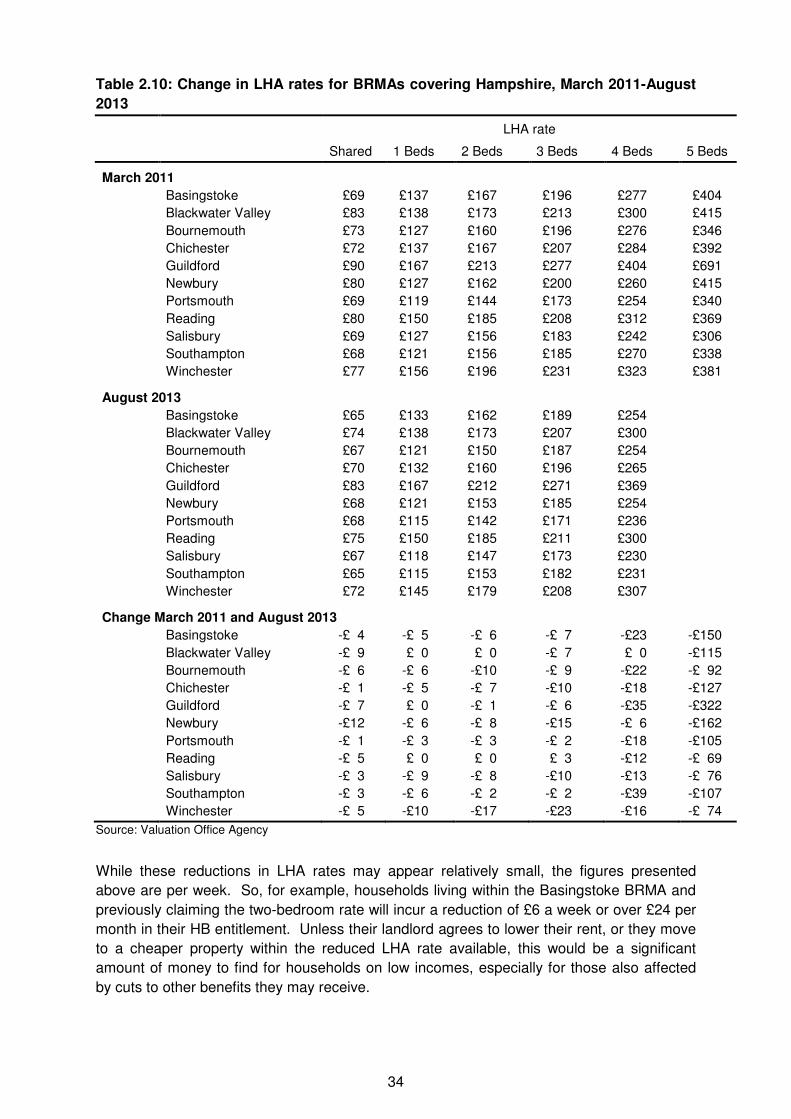
34
Table 2.10: Change in LHA rates for BRMAs covering Hampshire, March 2011-August
2013
LHA rate
Shared 1 Beds 2 Beds 3 Beds 4 Beds 5 Beds
March 2011
Basingstoke £69 £137 £167 £196 £277 £404
Blackwater Valley £83 £138 £173 £213 £300 £415
Bournemouth £73 £127 £160 £196 £276 £346
Chichester £72 £137 £167 £207 £284 £392
Guildford £90 £167 £213 £277 £404 £691
Newbury £80 £127 £162 £200 £260 £415
Portsmouth £69 £119 £144 £173 £254 £340
Reading £80 £150 £185 £208 £312 £369
Salisbury £69 £127 £156 £183 £242 £306
Southampton £68 £121 £156 £185 £270 £338
Winchester £77 £156 £196 £231 £323 £381
August 2013
Basingstoke £65 £133 £162 £189 £254
Blackwater Valley £74 £138 £173 £207 £300
Bournemouth £67 £121 £150 £187 £254
Chichester £70 £132 £160 £196 £265
Guildford £83 £167 £212 £271 £369
Newbury £68 £121 £153 £185 £254
Portsmouth £68 £115 £142 £171 £236
Reading £75 £150 £185 £211 £300
Salisbury £67 £118 £147 £173 £230
Southampton £65 £115 £153 £182 £231
Winchester £72 £145 £179 £208 £307
Change March 2011 and August 2013
Basingstoke -£ 4 -£ 5 -£ 6 -£ 7 -£23 -£150
Blackwater Valley -£ 9 £ 0 £ 0 -£ 7 £ 0 -£115
Bournemouth -£ 6 -£ 6 -£10 -£ 9 -£22 -£ 92
Chichester -£ 1 -£ 5 -£ 7 -£10 -£18 -£127
Guildford -£ 7 £ 0 -£ 1 -£ 6 -£35 -£322
Newbury -£12 -£ 6 -£ 8 -£15 -£ 6 -£162
Portsmouth -£ 1 -£ 3 -£ 3 -£ 2 -£18 -£105
Reading -£ 5 £ 0 £ 0 £ 3 -£12 -£ 69
Salisbury -£ 3 -£ 9 -£ 8 -£10 -£13 -£ 76
Southampton -£ 3 -£ 6 -£ 2 -£ 2 -£39 -£107
Winchester -£ 5 -£10 -£17 -£23 -£16 -£ 74
Source: Valuation Office Agency
While these reductions in LHA rates may appear relatively small, the figures presented
above are per week. So, for example, households living within the Basingstoke BRMA and
previously claiming the two-bedroom rate will incur a reduction of £6 a week or over £24 per
month in their HB entitlement. Unless their landlord agrees to lower their rent, or they move
to a cheaper property within the reduced LHA rate available, this would be a significant
amount of money to find for households on low incomes, especially for those also affected
by cuts to other benefits they may receive.
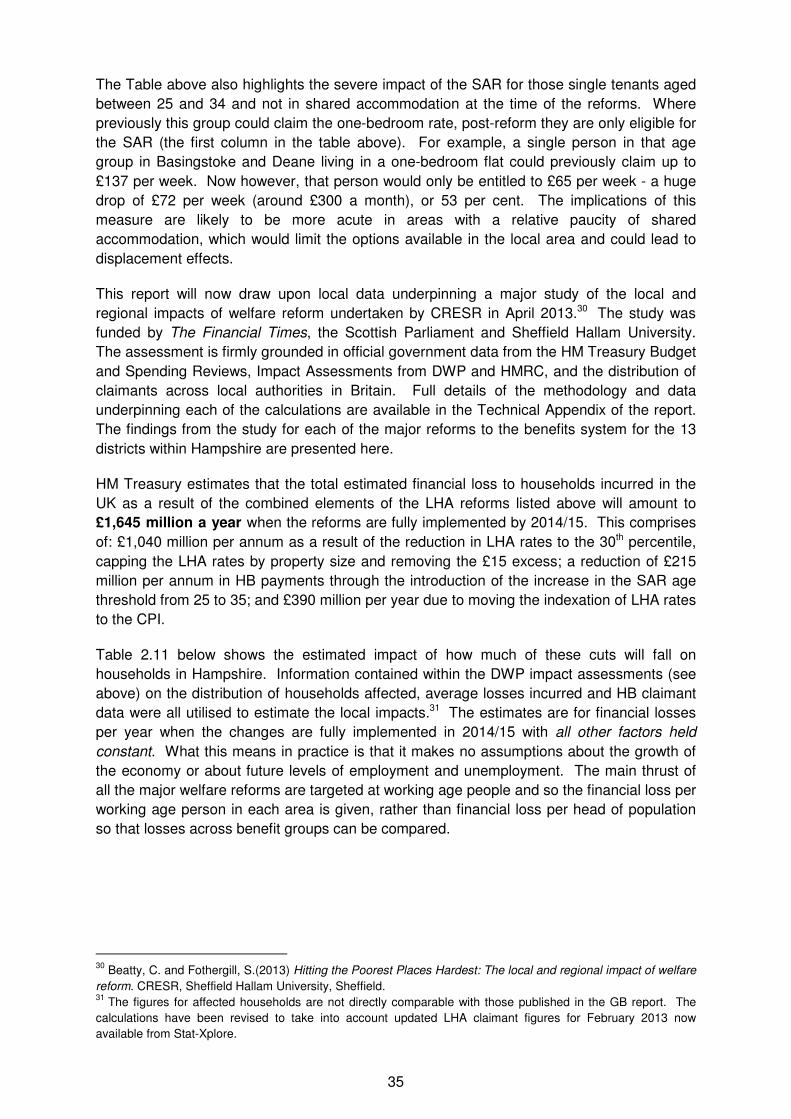
35
The Table above also highlights the severe impact of the SAR for those single tenants aged
between 25 and 34 and not in shared accommodation at the time of the reforms. Where
previously this group could claim the one-bedroom rate, post-reform they are only eligible for
the SAR (the first column in the table above). For example, a single person in that age
group in Basingstoke and Deane living in a one-bedroom flat could previously claim up to
£137 per week. Now however, that person would only be entitled to £65 per week - a huge
drop of £72 per week (around £300 a month), or 53 per cent. The implications of this
measure are likely to be more acute in areas with a relative paucity of shared
accommodation, which would limit the options available in the local area and could lead to
displacement effects.
This report will now draw upon local data underpinning a major study of the local and
regional impacts of welfare reform undertaken by CRESR in April 2013.30 The study was
funded by The Financial Times, the Scottish Parliament and Sheffield Hallam University.
The assessment is firmly grounded in official government data from the HM Treasury Budget
and Spending Reviews, Impact Assessments from DWP and HMRC, and the distribution of
claimants across local authorities in Britain. Full details of the methodology and data
underpinning each of the calculations are available in the Technical Appendix of the report.
The findings from the study for each of the major reforms to the benefits system for the 13
districts within Hampshire are presented here.
HM Treasury estimates that the total estimated financial loss to households incurred in the
UK as a result of the combined elements of the LHA reforms listed above will amount to
£1,645 million a year when the reforms are fully implemented by 2014/15. This comprises
of: £1,040 million per annum as a result of the reduction in LHA rates to the 30th percentile,
capping the LHA rates by property size and removing the £15 excess; a reduction of £215
million per annum in HB payments through the introduction of the increase in the SAR age
threshold from 25 to 35; and £390 million per year due to moving the indexation of LHA rates
to the CPI.
Table 2.11 below shows the estimated impact of how much of these cuts will fall on
households in Hampshire. Information contained within the DWP impact assessments (see
above) on the distribution of households affected, average losses incurred and HB claimant
data were all utilised to estimate the local impacts.31 The estimates are for financial losses
per year when the changes are fully implemented in 2014/15 with all other factors held
constant. What this means in practice is that it makes no assumptions about the growth of
the economy or about future levels of employment and unemployment. The main thrust of
all the major welfare reforms are targeted at working age people and so the financial loss per
working age person in each area is given, rather than financial loss per head of population
so that losses across benefit groups can be compared.
30
Beatty, C. and Fothergill, S.(2013) Hitting the Poorest Places Hardest: The local and regional impact of welfare
reform. CRESR, Sheffield Hallam University, Sheffield. 31
The figures for affected households are not directly comparable with those published in the GB report. The
calculations have been revised to take into account updated LHA claimant figures for February 2013 now
available from Stat-Xplore.
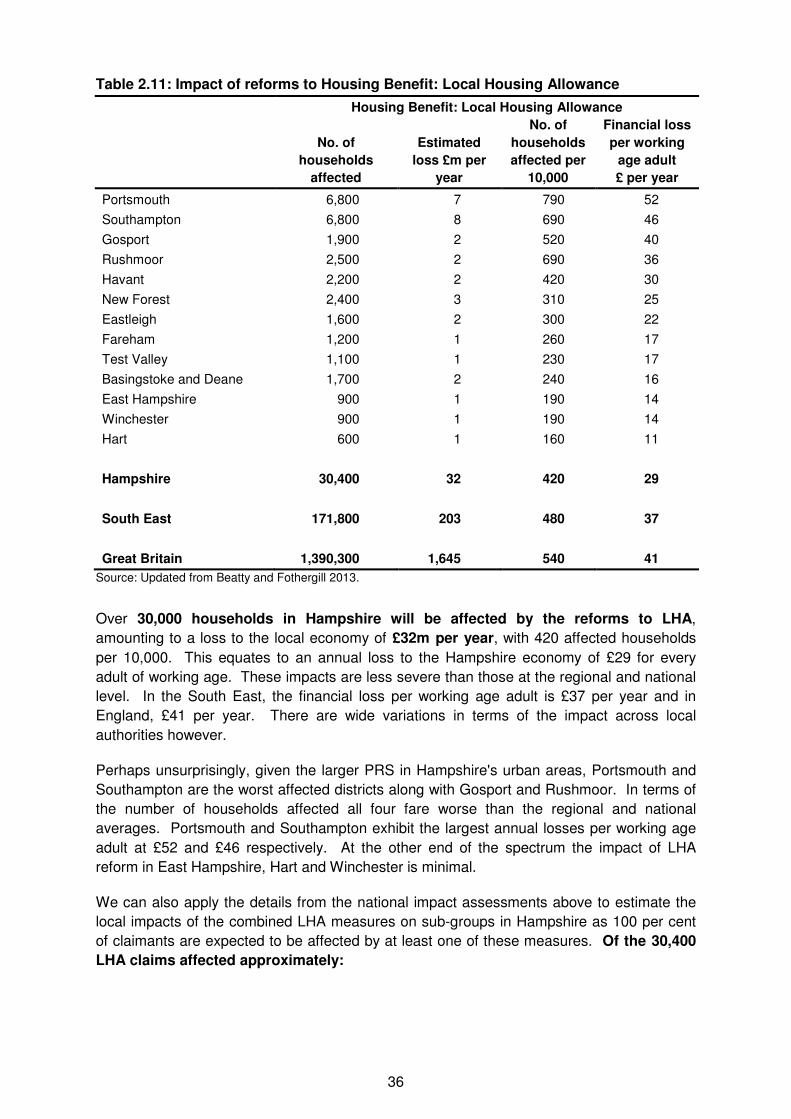
36
Table 2.11: Impact of reforms to Housing Benefit: Local Housing Allowance
Housing Benefit: Local Housing Allowance
No. of
households
affected
Estimated
loss £m per
year
No. of
households
affected per
10,000
Financial loss
per working
age adult
£ per year
Portsmouth 6,800 7 790 52
Southampton 6,800 8 690 46
Gosport 1,900 2 520 40
Rushmoor 2,500 2 690 36
Havant 2,200 2 420 30
New Forest 2,400 3 310 25
Eastleigh 1,600 2 300 22
Fareham 1,200 1 260 17
Test Valley 1,100 1 230 17
Basingstoke and Deane 1,700 2 240 16
East Hampshire 900 1 190 14
Winchester 900 1 190 14
Hart 600 1 160 11
Hampshire 30,400 32 420 29
South East 171,800 203 480 37
Great Britain 1,390,300 1,645 540 41
Source: Updated from Beatty and Fothergill 2013.
Over 30,000 households in Hampshire will be affected by the reforms to LHA,
amounting to a loss to the local economy of £32m per year, with 420 affected households
per 10,000. This equates to an annual loss to the Hampshire economy of £29 for every
adult of working age. These impacts are less severe than those at the regional and national
level. In the South East, the financial loss per working age adult is £37 per year and in
England, £41 per year. There are wide variations in terms of the impact across local
authorities however.
Perhaps unsurprisingly, given the larger PRS in Hampshire's urban areas, Portsmouth and
Southampton are the worst affected districts along with Gosport and Rushmoor. In terms of
the number of households affected all four fare worse than the regional and national
averages. Portsmouth and Southampton exhibit the largest annual losses per working age
adult at £52 and £46 respectively. At the other end of the spectrum the impact of LHA
reform in East Hampshire, Hart and Winchester is minimal.
We can also apply the details from the national impact assessments above to estimate the
local impacts of the combined LHA measures on sub-groups in Hampshire as 100 per cent
of claimants are expected to be affected by at least one of these measures. Of the 30,400
LHA claims affected approximately:
37
• 28,000 (92 per cent) will be of working age and 2,400 (8 per cent) over the age
of 65
• 5,800 (19 per cent) of those affected are estimated to have a disability
• 9,700 (32 per cent) will be lone parents
• 4,600 (15 per cent) of affected claims will be couple households with children
• 1,500 (five per cent) affected claims will be couples with no children
• 12,200 (or two-fifths) of affected claimants will be single persons.
In addition the impact assessment for the specific measures of the increase in the age
threshold to 35 years old for the SAR indicates that in Hampshire approximately:
• 1,800 (six per cent of all claimants) will be directly affected by the SAR reform
• 1,300 (72 per cent) of those affected will be men
• 290 (16 per cent) of those affected will be in work
• 790 (44 per cent) of those affected will be on JSA
• 140 (eight per cent) of those affected will be on income-related ESA (there will
be others on contribution-based Incapacity Benefit (IB) or ESA)
• 320 (18 per cent) will receive disability elements to their HB and not be exempt
from the reforms and 160 of these will fall under the EA definition of disability.
An assessment at the county and local authority district level can mask localised differences
in the distribution of households affected by the bedroom size criteria. Figure 2.2 below
presents the geographical impact of the LHA reforms in Hampshire by the estimated loss in
pounds per annum for all LSOAs. The darker the shading on the map, then the greater the
impact in pounds per annum. Given this measurement the greater impact is to be found in
the LSOAs containing larger numbers of LHA tenants, which again points to Portsmouth and
Southampton, and is clearly discernible in the map below. A "second tier" impact (which is
less acute than the large urban districts but still significant) amounting to a total loss to the
respective local authority of £2-3m includes Gosport, Havant, New Forest and Rushmoor.
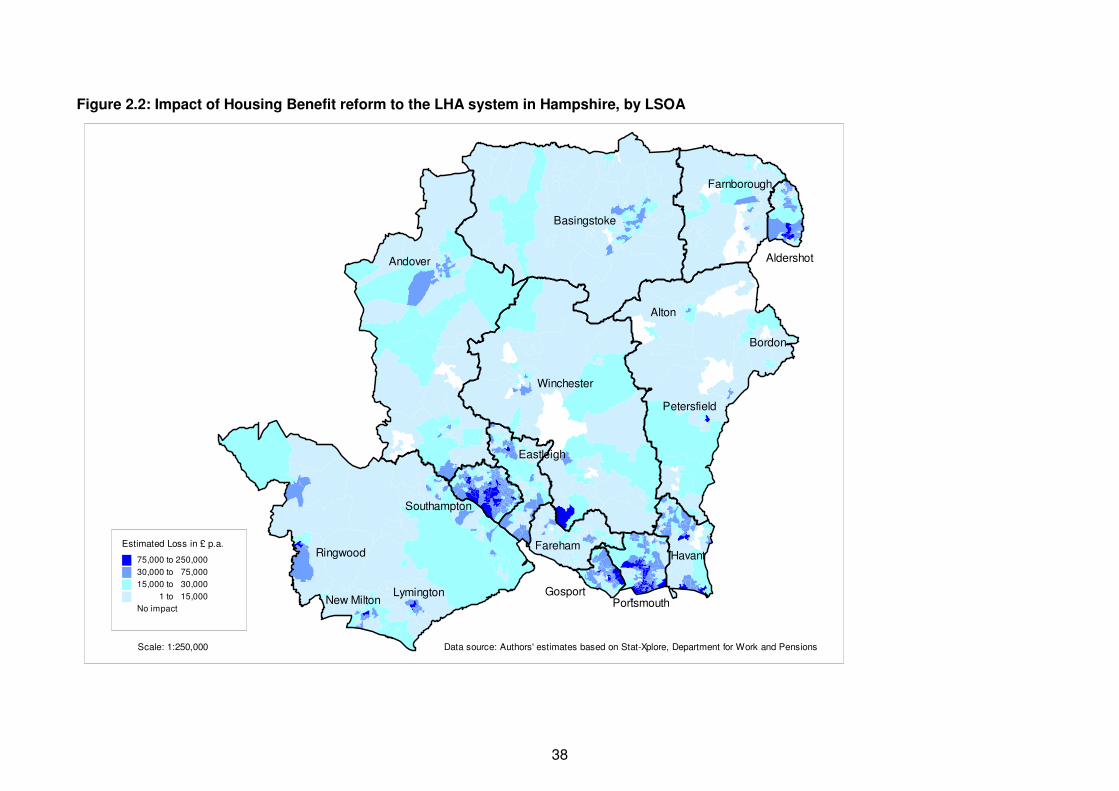
38
Figure 2.2: Impact of Housing Benefit reform to the LHA system in Hampshire, by LSOA
Estimated Loss in £ p.a.
75,000 to 250,000
30,000 to 75,000
15,000 to 30,000
1 to 15,000
No impact
Scale: 1:250,000 Data source: Authors' estimates based on Stat-Xplore, Department for Work and Pensions
Basingstoke
Andover
Farnborough
Aldershot
Alton
Bordon
Havant
PortsmouthGosport
Fareham
Eastleigh
Winchester
Southampton
New Milton
Petersfield
Lymington
Ringwood
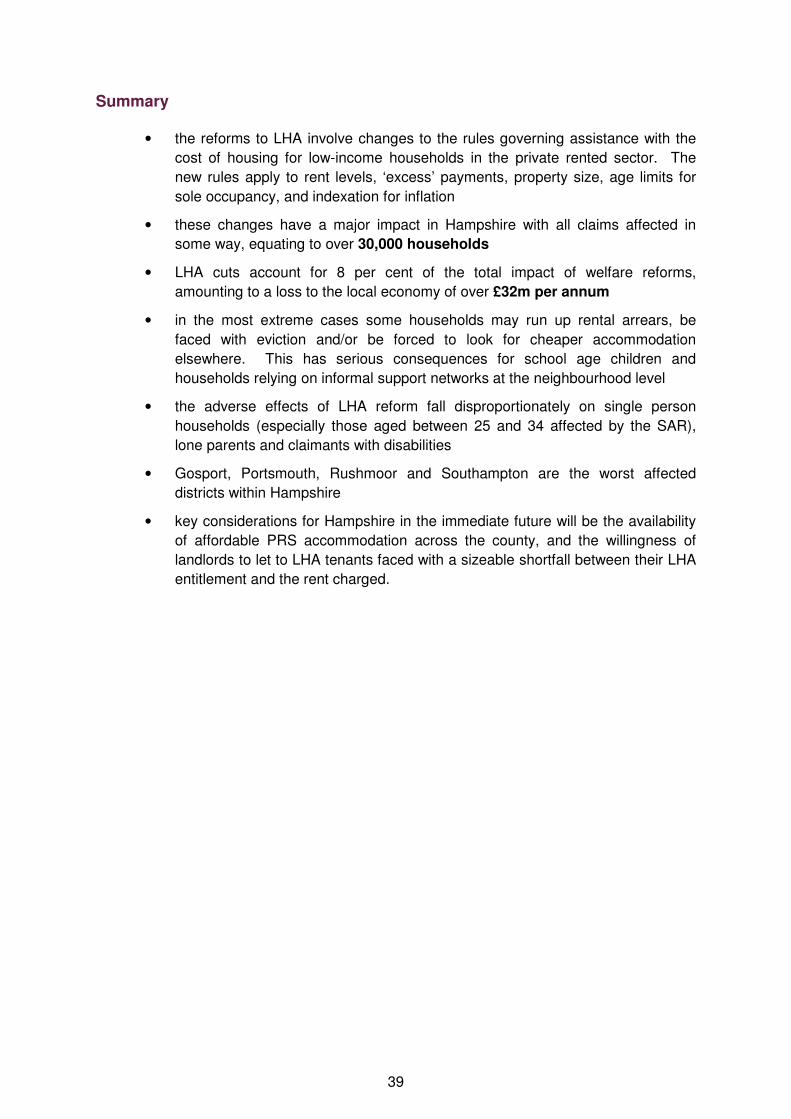
39
Summary
• the reforms to LHA involve changes to the rules governing assistance with the
cost of housing for low-income households in the private rented sector. The
new rules apply to rent levels, ‘excess’ payments, property size, age limits for
sole occupancy, and indexation for inflation
• these changes have a major impact in Hampshire with all claims affected in
some way, equating to over 30,000 households
• LHA cuts account for 8 per cent of the total impact of welfare reforms,
amounting to a loss to the local economy of over £32m per annum
• in the most extreme cases some households may run up rental arrears, be
faced with eviction and/or be forced to look for cheaper accommodation
elsewhere. This has serious consequences for school age children and
households relying on informal support networks at the neighbourhood level
• the adverse effects of LHA reform fall disproportionately on single person
households (especially those aged between 25 and 34 affected by the SAR),
lone parents and claimants with disabilities
• Gosport, Portsmouth, Rushmoor and Southampton are the worst affected
districts within Hampshire
• key considerations for Hampshire in the immediate future will be the availability
of affordable PRS accommodation across the county, and the willingness of
landlords to let to LHA tenants faced with a sizeable shortfall between their LHA
entitlement and the rent charged.
40
3Housing Benefit - Under-
occupation
Introduction
In the 2010 Emergency Budget the government announced that from 1st April 2013 it would
restrict Housing Benefit (HB) for working age tenants who lived in social housing and were
deemed to be under-occupying their property. This change has been commonly referred to
as introducing a "bedroom tax", although the government uses the term removing the "spare
room subsidy". As with many of the measures introduced in the Emergency Budget, this
reform was specifically targeted at working age claimants with the stated aim of increasing
work incentives. In addition, the policy aims to contribute to reducing HB expenditure,
encourage mobility within the social rented sector (SRS) and make more efficient use of the
housing stock by freeing up larger properties for families on the waiting list. Households
where both the tenant and any partner are above pensionable age are not included in the
new rules.32
Previously, there had been no consideration of the size of property that a household in the
SRS occupied when making a HB calculation. It was simply based on the rent for the
property that they occupied. In effect, the change means that from April 2013 tenants in the
SRS became subject to the same size criteria already in use for tenants in the private rented
sector (PRS) who claim HB under the Local Housing Allowance (LHA) system.
The government initially provided for an additional £30m a year from 2013/14 to the
Discretionary Housing Payment (DHP) fund to mitigate the effects on some of those
households which will face difficulties with their housing costs as a result of these changes.
This was especially focused on helping disabled tenants, whose properties may have
undergone significant adaptations, to remain in their current accommodation. On the 30th
July 2013 DWP announced a further £35m in DHPs to help claimants in the SRS who need
extra support because of the changes underway. However as this fund is discretionary it is
actually up the LAs how they decide their local priorities and allocate the funds.
This chapter will first provide an overview of SRS tenants in Hampshire before considering in
detail the implementation of the reform and estimating the scale of the impact on tenants in
the PRS.
32
Until April 2010 pensionable age within the benefits system was taken as 60. This is gradually increasing in
line with the changes in state pension age for women and by 2028 will be 67.

41
Housing Benefit claimants in the social rented sector
Table 3.1 below shows SRS households by household type in absolute numbers for all
Hampshire districts alongside the regional and national figures. There are just under
114,000 SRS households in Hampshire. 61,000 of these (or 54 per cent) are concentrated
within four districts: Basingstoke and Deane, Havant, Portsmouth and Southampton. The
largest SRS by local authority is Southampton where almost 23,000 households live in social
rented accommodation (see Table 2.1 on tenure above).
Table 3.1: Social rented sector households by household type - numbers
Area All h/holds
One person h/hold
Couple h/hold: with deps
Couple h/hold: no deps
Lone parent h/hold: with deps
Lone parent h/hold: No deps
Multi-person h/hold
Basingstoke & Deane 12,346 4,598 2,279 2,417 2,166 639 247
East Hampshire 5,681 2,044 1,199 1,113 892 340 93
Eastleigh 6,411 2,464 1,128 1,258 1,103 344 114
Fareham 3,785 1,535 663 615 699 201 72
Gosport 5,815 2,352 917 1,036 1,119 315 76
Hart 2,718 1,034 505 585 385 175 34
Havant 10,037 3,779 1,771 1,852 1,901 578 156
New Forest 8,440 3,166 1,565 1,686 1,451 437 135
Portsmouth 15,611 6,525 2,555 2,263 3,054 841 373
Rushmoor 5,927 2,121 1,243 1,000 1,064 372 127
Southampton 22,867 9,966 3,584 3,776 3,957 1,152 432
Test Valley 6,854 2,540 1,290 1,469 1,076 364 115
Winchester 7,243 3,090 1,274 1,575 867 302 135
Hampshire 113,735 45,214 19,973 20,645 19,734 6,060 2,109
South East 487,473 197,288 83,254 89,002 81,324 27,744 8,861
England 3,903,550 1,680,797 572,170 642,984 688,220 235,083 84,296
Source: 2011 Census of Population
There are a number of key differences between the PRS and the SRS in terms of household
type. The PRS contains more multi-person households, especially in urban areas and
University towns, due to the concentration of young people and students. In contrast, the
SRS shows a greater number of single person and lone parent households. The latter is a
reflection of the fact that social housing is allocated on the basis of need with households
with dependents struggling to access home ownership and the PRS more likely to be
allocated social housing.
Table 3.2 below presents these figures as a proportion of all households in the SRS by
district. Unlike the PRS, all districts show a relative degree of consistency in terms of
household type. Of most note for what follows on the bedroom tax are the relatively high
proportions of single person households in Portsmouth, Southampton and Winchester. All of
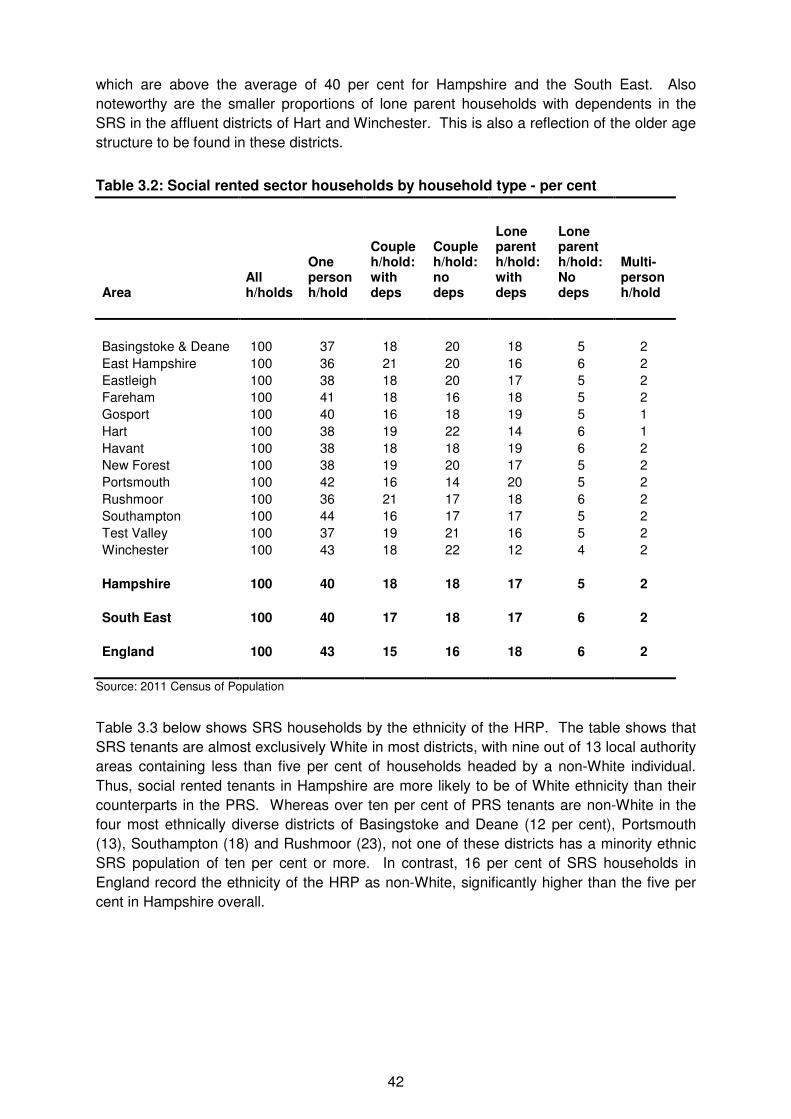
42
which are above the average of 40 per cent for Hampshire and the South East. Also
noteworthy are the smaller proportions of lone parent households with dependents in the
SRS in the affluent districts of Hart and Winchester. This is also a reflection of the older age
structure to be found in these districts.
Table 3.2: Social rented sector households by household type - per cent
Area All h/holds
One person h/hold
Couple h/hold: with deps
Couple h/hold: no deps
Lone parent h/hold: with deps
Lone parent h/hold: No deps
Multi-person h/hold
Basingstoke & Deane 100 37 18 20 18 5 2
East Hampshire 100 36 21 20 16 6 2
Eastleigh 100 38 18 20 17 5 2
Fareham 100 41 18 16 18 5 2
Gosport 100 40 16 18 19 5 1
Hart 100 38 19 22 14 6 1
Havant 100 38 18 18 19 6 2
New Forest 100 38 19 20 17 5 2
Portsmouth 100 42 16 14 20 5 2
Rushmoor 100 36 21 17 18 6 2
Southampton 100 44 16 17 17 5 2
Test Valley 100 37 19 21 16 5 2
Winchester 100 43 18 22 12 4 2
Hampshire 100 40 18 18 17 5 2
South East 100 40 17 18 17 6 2
England 100 43 15 16 18 6 2
Source: 2011 Census of Population
Table 3.3 below shows SRS households by the ethnicity of the HRP. The table shows that
SRS tenants are almost exclusively White in most districts, with nine out of 13 local authority
areas containing less than five per cent of households headed by a non-White individual.
Thus, social rented tenants in Hampshire are more likely to be of White ethnicity than their
counterparts in the PRS. Whereas over ten per cent of PRS tenants are non-White in the
four most ethnically diverse districts of Basingstoke and Deane (12 per cent), Portsmouth
(13), Southampton (18) and Rushmoor (23), not one of these districts has a minority ethnic
SRS population of ten per cent or more. In contrast, 16 per cent of SRS households in
England record the ethnicity of the HRP as non-White, significantly higher than the five per
cent in Hampshire overall.
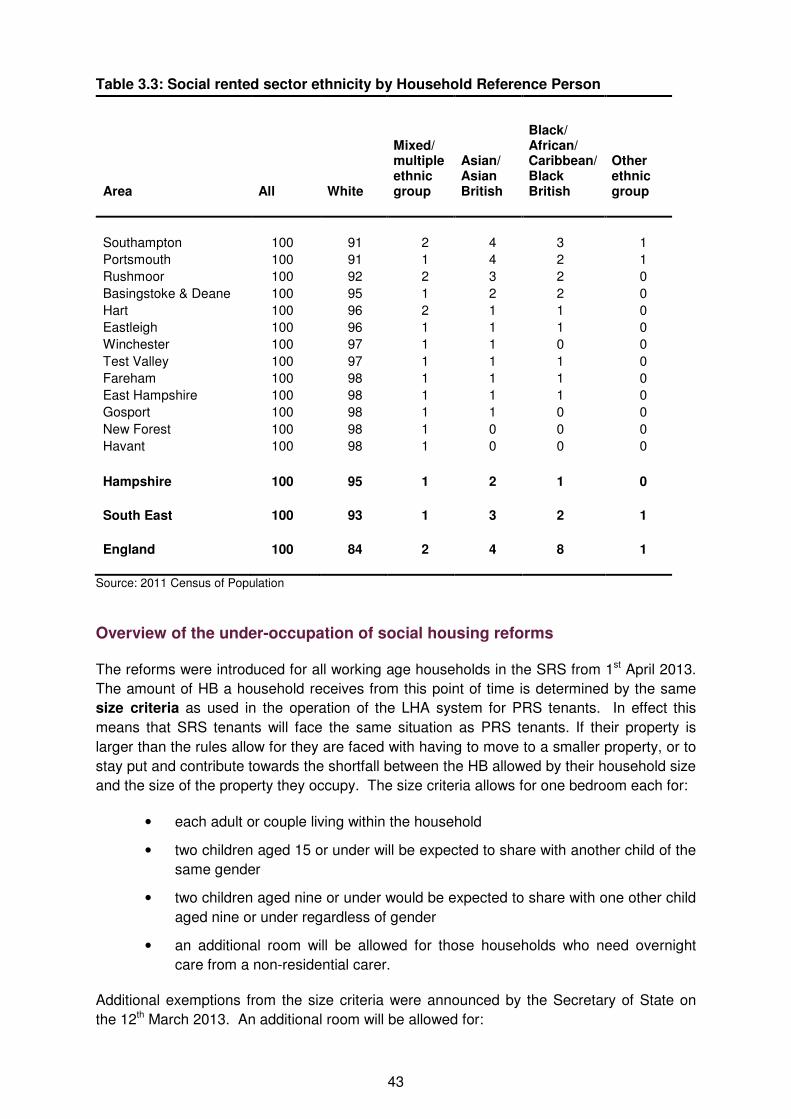
43
Table 3.3: Social rented sector ethnicity by Household Reference Person
Area All White
Mixed/ multiple ethnic group
Asian/ Asian British
Black/ African/ Caribbean/ Black British
Other ethnic group
Southampton 100 91 2 4 3 1
Portsmouth 100 91 1 4 2 1
Rushmoor 100 92 2 3 2 0
Basingstoke & Deane 100 95 1 2 2 0
Hart 100 96 2 1 1 0
Eastleigh 100 96 1 1 1 0
Winchester 100 97 1 1 0 0
Test Valley 100 97 1 1 1 0
Fareham 100 98 1 1 1 0
East Hampshire 100 98 1 1 1 0
Gosport 100 98 1 1 0 0
New Forest 100 98 1 0 0 0
Havant 100 98 1 0 0 0
Hampshire 100 95 1 2 1 0
South East 100 93 1 3 2 1
England 100 84 2 4 8 1
Source: 2011 Census of Population
Overview of the under-occupation of social housing reforms
The reforms were introduced for all working age households in the SRS from 1st April 2013.
The amount of HB a household receives from this point of time is determined by the same
size criteria as used in the operation of the LHA system for PRS tenants. In effect this
means that SRS tenants will face the same situation as PRS tenants. If their property is
larger than the rules allow for they are faced with having to move to a smaller property, or to
stay put and contribute towards the shortfall between the HB allowed by their household size
and the size of the property they occupy. The size criteria allows for one bedroom each for:
• each adult or couple living within the household
• two children aged 15 or under will be expected to share with another child of the
same gender
• two children aged nine or under would be expected to share with one other child
aged nine or under regardless of gender
• an additional room will be allowed for those households who need overnight
care from a non-residential carer.
Additional exemptions from the size criteria were announced by the Secretary of State on
the 12th March 2013. An additional room will be allowed for:
44
• households caring for a foster child or households accepted as foster carers but
who do not have a foster child with them currently, so long as this period does
not exceed 52 weeks
• households with adult children in the armed forces who continue to live with their
parents but are deployed on operations.
There were strong arguments put forth during the passing of this reform for two further
groups of exemptions, these were not accepted by the government at the time, but
subsequent legal challenges have been mounted and in some cases have been successful
in ensuring additional exemptions.
Firstly, the new rules mean that children of parents who don't live together will be treated as
living with the parent who is responsible for them and provides their main home. If the child
spends equal amounts of time with both parents then this will be counted as the parent who
receives Child Benefit for them. Therefore, for a parent who claims HB in the SRS, is
separated from their partner and may only have their children reside with them for part of the
week or the weekend, then the reduction to their HB will apply to the room(s) which they may
use for their children while they reside with them. Currently campaign group Liberty is
seeking a judicial review for the under-occupation provisions with regards to such cases.
They argue that the regulations are discriminatory and in breach of the European
Convention on Human Rights.
Secondly, legal challenges were made with regards to the new rules being discriminatory to
households with disabled residents. The Equality Impact Assessment33 shows that 63 per
cent of all working age SRS HB claimants affected will have a Disability Discrimination Act
(DDA) recognised disability. This is a higher proportion of affected tenants than amongst the
population of working age SRS HB tenants as a whole (56 per cent of all have a DDA
disability). The Court of Appeal subsequently accepted that the new regulations were
discriminatory in the case of households where two children cannot share a room because of
disability. DWP subsequently changed their position and accepted that LAs should allow for
an extra bedroom where children were unable to share because of severe disabilities. The
DWP decided it is up to the LAs on a case by case basis to decide that sufficient medical
evidence exists and that the nature of the disability means the other child would be disturbed
at night time if they shared the room. However, as of yet, DWP has failed to legislate for the
new regulations to enforce the rights of families in these circumstances. Whilst the Court
also accepted on 31st July 201334 that the under-occupation regulations in relation to adults
with disabilities were discriminatory, it decided that the discrimination was justified and
therefore lawful because discretionary payments are available to cover HB losses as a result
of the bedroom tax. The lawyers bringing this case have said they will appeal this decision.
33
DWP (2012) Housing Benefit: Size Criteria for People Renting in the Social Rented Sector, Equality Impact
Assessment. https://www.gov.uk/government/uploads/system/uploads/
attachment_data/file/220154/eia-social-sector-housing-under-occupation-wr2011.pdf 34
http://www.leighday.co.uk/News/2013/July-2013/Bedroom-Tax-Judgment-to-be-appealed
45
National impact of under-occupation of social housing reforms
As well as reducing costs on HB expenditure the government also hopes that this reform will
act as a work incentive and eventually lead to some households moving off of HB. However,
this is based on the following assumption in the latest DWP Impact Assessment35:
'Where the choice is to move, a lower rent will help to provide an additional work
incentive, and enable claimants to "float off" Housing Benefit at lower income levels
than is currently the case.'
Para 19, p7, DWP Impact Assessment
Therefore, the assumption is that the incentive to take a low-paid job may be more attractive
as a household would have lower out-goings on rent for a smaller property and therefore
would potentially have no further need for HB once in work. However, given the mismatch
between the number of households needing to downsize and the availability of smaller
accommodation (see below), those wishing to move may struggle to do so; or may have to
move into the PRS where rents tend to be higher. So a move to a smaller property in the
PRS may not actually result in a lower rent.
Others who are in receipt of partial housing benefit may find that the reduction in their
entitlement means their claim ceases altogether and they may "float-off" HB this way. The
Impact Assessment estimates that seven per cent of the households affected by the
change will "float off" HB - 40,000 in all nationally. If a similar pattern was seen amongst
claimants affected by the under-occupancy rules then 640 HB claimants in the SRS might
be expected to "float off" HB in Hampshire.
The government's second stated aim with the policy is that it will encourage mobility and free
up accommodation for larger households on the SRS waiting list, thereby utilising stock
more effectively and reducing the cost of housing these larger households either in
temporary accommodation or more expensive accommodation in the PRS. However, the
original DWP Impact Assessment36 acknowledges that:
'Estimates of Housing Benefit savings are based upon the current profile of tenants in
the social rented sector, with little tenant mobility assumed. If a significant number of
tenants wished to move, this would reduce direct savings and place extra demands on
social landlords.'
DWP Impact Assessment, p2
The Impact Assessment also acknowledges that there is a mismatch between the number of
tenants who may need to downsize and the supply of one bedroom properties available:
'According to estimates from DCLG there is a surplus of three bedroom properties,
based on the profile of existing working age tenants in receipt of Housing Benefit, and a
lack of one bedroom accommodation in the social sector. In many areas this mismatch
could mean that there are insufficient properties to enable tenants to move to
accommodation of an appropriate size even if tenants wished to move and landlords
were able to facilitate this movement'.
DWP Impact Assessment, para 38, p12
35
DWP (2012) Housing Benefit: Under Occupation of Social Housing, Impact Assessment. 28th June 2012,
http://www.dwp.gov.uk/docs/social-sector-housing-under-occupation-wr2011-ia.pdf 36
DWP (2012) Housing Benefit: Under Occupation of Social Housing Impact Assessment, 16th
February 2012.
46
Many social landlords and housing groups have raised concerns about the lack of availability
of smaller properties within the SRS which will impede the mobility of those who may wish to
downsize. This may result in individual hardship as tenants try to stay in their property and
subsume the HB cut within their current limited income as moving within the sector may not
be an option to many. A shortage of smaller properties available in the SRS means a move
to the PRS is a more likely outcome for those who do choose to move. In February 2013,
average HB awards for LA tenants in England was £78 a week, £88 a week for tenants of
Registered Social Landlords (RSLs) and £108 a week in the PRS. So a move to the PRS
may actually increase rents for those who move into a smaller property.
This mismatch in supply and demand of smaller properties in the SRS is highlighted by the
National Housing Federation (NHF).37 They estimate that whist 180,000 households are
under-occupying two bedroom homes in the SRS, only 85,000 one bedroom properties
became available in the social housing sector in 2011-12. In addition, a further 970,000
people are on waiting lists in England for this size of property. Further research
commissioned by NHF38 showed that approximately 52 per cent of housing associations in
the South East (61 per cent nationally) expect the size criteria to have a significant impact on
their businesses with rent arrears, rent collection difficulties and falling rental incomes
coming high on the list of expected outcomes.
The government's Impact Assessment estimates that the reforms will impact on nearly a
third (31 per cent) of all working age HB claimants in the SRS, 660,000 claimants
nationally, will face a reduction in their HB because of this reform. This is equivalent to
19 per cent of all SRS HB claimants nationally. These figures differ by region given the
nature of the housing stock and number of SRS HB claimants in each region. Regionally the
number of claimants affected is 40,000, equivalent to 12 per cent of all SRS HB claimants
in the South East.
Of the 660,000 claimants affected nationally:
• 540,000 (81 per cent) will be under occupying their accommodation by one
bedroom
• 120,000 (19 per cent) will be under-occupying by two or more bedrooms
• 390,000 (59 per cent) of the total households affected will be LA tenants
• 270,000 (41 per cent) will be tenants in the RSL sector.
Households who continue to under-occupy a property will face a reduction in their HB of 14
per cent (or an average of £12 per week) if under-occupying by one bedroom; or 25 per cent
(or an average of £22 per week) if under-occupying by two or more bedrooms.
Overall, these percentage reductions in HB entitlement are estimated to result in an average
loss of £14 per week per affected claimant. The estimated impact on claimants within the
South East Region is £15 a week. The DWP Equality Impact Assessment also provides
some details on the 660,000 households affected in terms of their household composition:
37
The National Housing Federation (2013) The Bedroom Tax: Some home truths.
http://s3-eu-west-1.amazonaws.com/doc.housing.org.uk/News/Bedroom_tax_home_truths.pdf 38
Ipsos MORI (2013) Impact of Welfare Reform on Housing Associations - Baseline Report 2012. http://s3-eu-
west-1.amazonaws.com/pub.housing.org.uk/Impact%20of%20welfare%20reform%20on
%20housing%20associations%20-%20IPSOS%20MORI%20report.pdf
47
• 48 per cent of the those affected will be single people aged under 60
• 22 per cent of those affected will be lone parents
• 10 per cent of all those affected will be couples with children
• women-headed households will account for 51 per cent of all those households
affected, men 24 per cent and couples 24 per cent; this reflects the higher
proportion of women amongst working age tenants as a whole
• BME households are less likely to be affected by the measure than white
claimants (ten per cent of affected households) which is lower than the
proportion of all working age SRS HB households that are BME (15 per cent);
this may be due to average family sizes being larger amongst BME claimants
and a higher proportion having children (and sometimes parents) living with
them as part of their household and therefore not under-occupying
• 63 per cent of all households affected will have a recognised disability under the
Disability Discrimination Act (DDA).
Impact of under-occupation of social housing reforms in Hampshire
Table 3.4 below details the impact of the implementation of the bedroom size criteria
("bedroom tax") within the SRS in Hampshire by district and benchmarked against the
regional and national averages. The impact at the national level is more severe than that in
Hampshire with 260 affected households for every 10,000 across England, compared to 110
households for the county. For Hampshire this represents a loss to the local economy of
around £7m per year.
The biggest impact at the LAD level is apparent in Southampton and Portsmouth, in absolute
terms and also in Havant (160) in relative terms, with the number of affected households per
10,000 estimated at 200 and 160 respectively. For three other districts - Gosport (140),
Basingstoke and Deane (130) and Rushmoor (130) - the proportion of households affected
is greater than that at the regional level (120). Again, the wealthy districts at the bottom of
the table show only a marginal impact in relative terms at the local authority level of analysis.
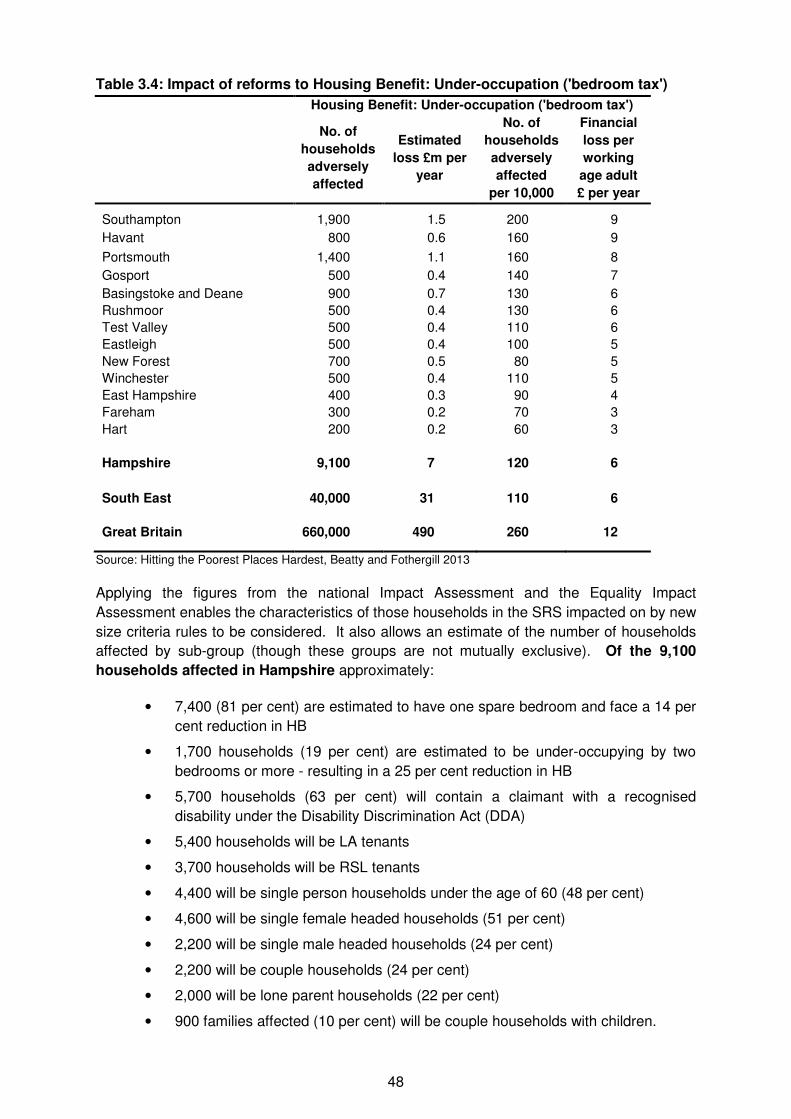
48
Table 3.4: Impact of reforms to Housing Benefit: Under-occupation ('bedroom tax')
Housing Benefit: Under-occupation ('bedroom tax')
No. of
households
adversely
affected
Estimated
loss £m per
year
No. of
households
adversely
affected
per 10,000
Financial
loss per
working
age adult
£ per year
Southampton 1,900 1.5 200 9
Havant 800 0.6 160 9
Portsmouth 1,400 1.1 160 8
Gosport 500 0.4 140 7
Basingstoke and Deane 900 0.7 130 6
Rushmoor 500 0.4 130 6
Test Valley 500 0.4 110 6
Eastleigh 500 0.4 100 5
New Forest 700 0.5 80 5
Winchester 500 0.4 110 5
East Hampshire 400 0.3 90 4
Fareham 300 0.2 70 3
Hart 200 0.2 60 3
Hampshire 9,100 7 120 6
South East 40,000 31 110 6
Great Britain 660,000 490 260 12
Source: Hitting the Poorest Places Hardest, Beatty and Fothergill 2013
Applying the figures from the national Impact Assessment and the Equality Impact
Assessment enables the characteristics of those households in the SRS impacted on by new
size criteria rules to be considered. It also allows an estimate of the number of households
affected by sub-group (though these groups are not mutually exclusive). Of the 9,100
households affected in Hampshire approximately:
• 7,400 (81 per cent) are estimated to have one spare bedroom and face a 14 per
cent reduction in HB
• 1,700 households (19 per cent) are estimated to be under-occupying by two
bedrooms or more - resulting in a 25 per cent reduction in HB
• 5,700 households (63 per cent) will contain a claimant with a recognised
disability under the Disability Discrimination Act (DDA)
• 5,400 households will be LA tenants
• 3,700 households will be RSL tenants
• 4,400 will be single person households under the age of 60 (48 per cent)
• 4,600 will be single female headed households (51 per cent)
• 2,200 will be single male headed households (24 per cent)
• 2,200 will be couple households (24 per cent)
• 2,000 will be lone parent households (22 per cent)
• 900 families affected (10 per cent) will be couple households with children.
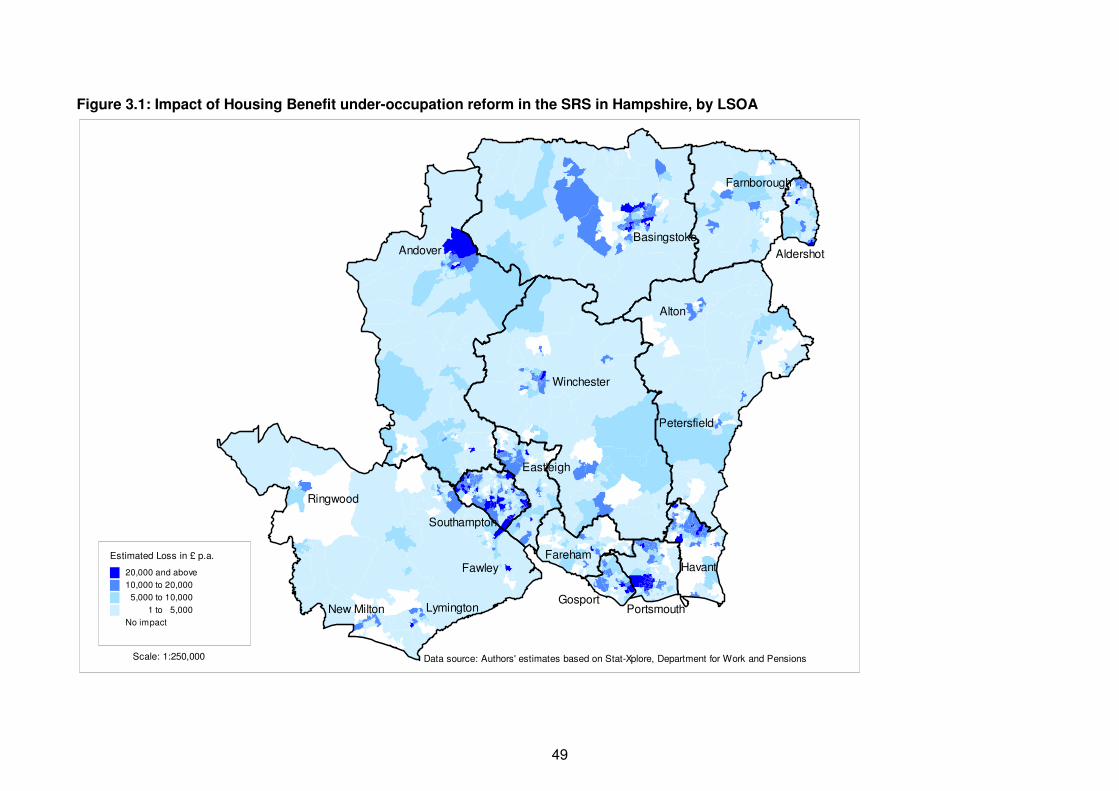
49
Figure 3.1: Impact of Housing Benefit under-occupation reform in the SRS in Hampshire, by LSOA
Estimated Loss in £ p.a.
20,000 and above
10,000 to 20,000
5,000 to 10,000
1 to 5,000
No impact
Scale: 1:250,000 Data source: Authors' estimates based on Stat-Xplore, Department for Work and Pensions
AndoverBasingstoke
Farnborough
Aldershot
Alton
Havant
GosportPortsmouth
Fareham
Winchester
Eastleigh
Southampton
Fawley
Ringwood
New Milton Lymington
Petersfield
50
An assessment at the county and local authority district level can mask localised differences
in the distribution of households affected by the bedroom size criteria. Figure 3.1 above
presents the geographical impact of the bedroom tax across Hampshire by the estimated
loss in pounds per annum for all LSOAs. The darker the shaded area on the map, then the
greater the impact for that particular LSOA. The darker blue areas represent the worst
affected areas, which stand to lose over £20,000 per year. These greater impacts are
concentrated in Basingstoke, Portsmouth and Southampton with other small pockets in
Aldershot and Andover for instance. Of course this also reflects the distribution of social
housing across Hampshire and so the districts with the least social housing - East
Hampshire, Fareham and Hart for instance - show a relatively minor impact in terms of the
absolute loss in pounds per annum. However, though the numbers affected are smaller in
these areas the effects for any low income households are likely to be similar.
Direct Payments to tenants
A key concern for both private and social sector landlords is the coalition government's
commitment to making HB payments direct to tenants - a key plank of the new Universal
Credit. The policy rationale for this move is that tenants and households will be instilled with
greater responsibility and will alter their behaviour. It is assumed that this will help prepare
out-of-work HB claimants for the world of work by making them take more control of their
financial affairs and budget accordingly - on a month-to-month basis in line with most
employee wages. The concern of landlords is that for many claimants on low incomes the
management of their household budgets can be extremely difficult and this shift will therefore
result in increased rent arrears.
In the PRS the presumption of direct payments to the tenant has been in place since 2008
with exceptions made for vulnerable groups (e.g. care leavers, those with drug and alcohol
dependencies) and for tenants who are in rental arrears of eight weeks or more. A further
exception was made as part of the raft of LHA measures in a bid to encourage landlords to
enter into rental negotiations. Where landlords were willing to reduce rents for claimants
adversely affected by the reforms, then they too were able to access direct payments as a
policy "carrot" designed to maintain tenancies and keep evictions and non-renewal of
tenancies down.
Evidence from the DWP-commissioned research monitoring the impact of the LHA reforms39
suggests that the change to direct payments (since 2008) has contributed to increased
arrears in some cases and is one of the most prominent issues of concern cited by private
landlords operating within the LHA market. Evidence also suggests that the policy of direct
payments is interpreted variably at the local level and some landlords report always being
able to receive LHA payments into their bank accounts; while others are unwilling to let to
LHA tenants unless they are able to receive direct payments. In terms of the latter, this is
especially the case where a tenant in substantial arrears has absconded leaving the landlord
out of pocket and unable to recoup those losses.
In the SRS direct payments to tenants is a more recent policy shift. Currently this is being
piloted nationally in six areas referred to as the Direct Payments Demonstration Projects
39
See Beatty, C., Brewer, M., Browne, J., Cole, I., Crisp, R., Emmerson, C., Joyce, R., Kemp, P. A., Pereira, I.
and Powell, R. (2013) Monitoring the Impact of Changes to the Local Housing Allowance System of Housing
Benefit: Interim Report (Research Report No. 838). London: DWP
51
(DPDPs): Edinburgh, Oxford, Southwark, Shropshire, Torfaen and Wakefield. DWP-
commissioned research on the DPDPs has produced some early findings in terms of the
experiences of both tenants and social landlords.40 In a baseline survey tenants participating
in the research were mostly unsupportive of direct payments with 32 per cent reporting
that they would "cope poorly" and 38 per cent suggesting they would find it difficult
to manage their finances. The existing high levels of indebtedness, including rent arrears
as well as other debt, were a key consideration here. Early experiences of direct payments
were also negative with rent collection rates lower across all six areas. Furthermore, some
tenants who had previously never been in arrears before had fallen behind with their rental
payments since the introduction of direct payments. Social landlords reported being
surprised by the resource-intensive nature of providing support to tenants and that capacity
to do so was limited. This is problematic given that personalised support was the preferred
option of tenants, which is by its very nature more resource-intensive. The cooperation
between local HB departments and social landlords was deemed crucial in implementation
and delivery through enabling flexibility. However, this would be lost when UC is rolled out
and HB claims are managed centrally at the national level. Social landlords also highlighted
the importance of providing multiple payment methods given that some tenants do not have
bank accounts. They also pointed to SMS messaging as having a positive impact on rent
collection rates.
These are of course early findings, but the challenges ahead for both tenants and social
landlords are clear with budgeting and debt management advice likely to be in high demand
once UC is implemented.
Summary
• the under-occupation measure introduces new rules governing the size of properties
for which payments are made to working age claimants in the social rented sector
(widely known as the ‘bedroom tax’)
• despite attracting significant media attention the overall impact of the bedroom tax is
less significant than most of the other welfare reforms. The measure affects over
9,000 households representing a total loss to the Hampshire economy of £7m
per annum
• HB cuts as a result of under-occupation account for just 2 per cent of the total impact
of all welfare reforms in Hampshire
• the adverse effects of the under-occupation measure fall disproportionately on single
person households, women and households and households containing a claimant
with a recognised disability
• Havant, Portsmouth and Southampton are the worst affected districts within
Hampshire, a reflection of the distribution and concentration of social housing within
the county
• looking ahead, a key factor and challenge in mitigating the effects of under-
occupation will be the ability of social housing providers to place affected tenants in
suitable alternative accommodation. The fears of long-standing tenants in terms of
leaving the familiarity of their neighbourhood and social support networks, however,
are likely to be a major factor.
40
Hickman, P. and Reeve, K. (2013) Direct Payments Demonstration Projects: Learning the lessons, six months
in. (Research Report No 839). London: DWP.
52
4Non-dependant deductions
Introduction
Traditionally, non-dependant adults have been expected to make a contribution towards the
housing costs of their accommodation if they live in a household of people claiming income-
related benefits. Those classified as non-dependants include adult children, other relatives,
or friends who live within the household. Children under the age of 18, partners, or lodgers
are not counted as non-dependants. A non-dependant deduction (NDD) is made from a
claimant's Housing Benefit (HB) or Council Tax Benefit (CTB) with the expectation that the
non-dependant will make this contribution to the claimant's housing costs. In theory the
claimant should be no worse off given any level that the NDD is set at, however, in practice
this relies on the non-dependant's ability and willingness to pay said contribution.
Several levels of NDD are applicable to HB, CTB or support towards housing costs for home
owners on income-related benefits. The appropriate level of deduction is based on the
circumstances of the non-dependant including their age, their earnings from work, or if they
are claiming benefits themselves. For example household members who are under 25 and
in receipt of income related benefits are not expected to make a contribution, but those aged
over 25 and on income-related benefits are. All non-dependants aged 18 or over who are in
paid work are expected to make a contribution linked to their level of pay. There are
exceptions from applying a NDD41 and these include where the claimant is in receipt of the
care component of Disability Living Allowance (DLA) or Attendance Allowance (AA) and
since 2005 NDDs were no longer made for non-dependants in receipt of Pension Credit.
In 2001 the Labour Government froze the NDD rates. The coalition government announced
in the 2010 Emergency Budget that it intended to reverse the policy of freezing NDDs. The
NDDs have been increased in three stages between 2011 to 2013 in line with what they
would have been had they been fully uprated in line with eligible rents and Council Tax since
2001. This chapter will consider the evidence from the government's quality Impact
Assessment42 as to what these changes might mean for residents claiming HB or CTB43 in
Hampshire.
41
See DWP (2011) Equality impact assessment Income-related benefits: change to the non-dependant
deduction rates, https://www.gov.uk/government/uploads/system/uploads/attachment_data
/file/220283/eia-ndd-2011.pdf 42
See footnote 41. 43
Detailed information is only available for HB or CTB cases and therefore this chapter focuses on the impacts to
these groups and does not include owner occupiers who receive support for their housing costs and will also be
subject to NDDs.
53
Overview of non-dependant deduction reforms
In 2001 the NDDs were frozen at a range from £7.40 to £47.75 a week for HB and £2.30 to
£6.95 per week for CTB, depending on the circumstances of the non-dependant. These
rates of NDD were in place until 2010/11. Three stages of increases were then implemented
from 2011/12 and by 2013/14 NDDs increased to between £13.60 and £87.75 a week for HB
and between £3.65 and £10.95 a week for CTB. The rate of increase has therefore been
rapid and for HB is equivalent to an 84 per cent increase for HB NDDs and a 59 per cent
increase for CTB NDDs.
The substantial increase in the NDDs may act as a work disincentive for some who live
with their families as their net pay after contributing to housing costs will reduce significantly.
Others may also be discouraged from sharing accommodation with their family and be
encouraged to move out of the family home into their own separate accommodation. For
non-dependants aged over 25 and on income-related benefits who are expected to make a
contribution (under 25s are not expected to) this in turn may result in subsequent demand for
SRS housing or an increase in HB claims. The rapid increases in the NDDs could potentially
lead to an increase in rent arrears if the claimant finds it difficult to obtain the full increased
NDD from the non-dependant who lives with them. Potentially, household formation rates
may be influenced by this policy which may encourage some to set-up their own home. In
turn older children leaving the family household may also result in under-occupation leading
to an increase in families in the SRS subject to the "bedroom tax".
The NDD system for those in receipt of HB as it is currently operationalised will however
change under Universal Credit (UC). The system for deductions will be simplified and will
become known as a 'Housing Cost Contribution' (HCC). Eventually, the full implementation
of UC across the country will, for some non-dependants, reverse the potential disincentives
to work or to remain in the family home of parents who receive income-related benefits. A
flat rate deduction of £68 per calendar month will be made for non-dependants aged 21 and
over. This will mean that the majority of non-dependant household members with earnings
will be better off under the new system. For example, those aged 18 to 21 and in work will
no longer be subject to the deduction. Those aged over 21 and with gross income above
£126 a week will also pay substantially less under the new flat rate system than they do now
- between £67 and £312 a calendar month less depending on income level.
There are some households with non-dependants with lower incomes or receiving income-
related benefits that will be worse off under the UC system of HCC. Those aged 21-24 and
in receipt of income-related benefits would previously have been exempt from NDDs but will
now be expected to contribute £68 per month to housing costs. Those who are aged 21 or
over and have a gross income of less than £126 per week, or who are aged 25 or over and
are in receipt of income-related benefits, will see their required contribution to housing costs
rise by £39 per calendar month.
The analysis presented here relates to the information provided in the HMRC Budget
statements and DWP Equality Impact Assessment for the financial losses that will occur as a
result of the up-rating of NDDs and does not consider the impacts relating to the introduction
of the HCC as part of UC, which includes transitional protection and is some way off full
implementation.
54
National impact of up-rating non-dependant deductions
The primary aim stated in the government's Equality Impact Assessment for the up-rating of
NDDs is that the reform will contribute to bringing HB expenditure under control and
contribute to reducing the deficit. In this sense it is one of the few reforms where the stated
policy aims do not include increasing incentives to work. This in part reflects the fact that
this reform is also one of the few which will affect pensioner claimants as well as working
age claimants. To some extent, as discussed earlier, the rapid increase in rates may actually
create some disincentives to work for some non-dependents living with a family who receive
HB.
'The decision to uprate the non-dependant deduction rates in three stages to what they
would have been had they been fully uprated since 2001 in line with growth in eligible
rents and Council Tax was announced in the June 2010 Budget as part of a package of
measures designed to bring Government expenditure under control and reduce the
fiscal deficit. Up-rating the non-dependant deduction rates is a reverse of the policy
since 2001-02 to freeze the rates and is intended to provide a fairer deal for taxpayers
and provide an expectation that adults make a reasonable contribution towards their
housing costs.'
DWP (2011) Equality Impact Assessment, p3
The Equality Impact Assessment estimates that 300,000 HB and CTB claimants nationally
will have their benefit reduced to account for non-dependants living in their homes. It is
estimated that of the 300,000 claimants affected:
• 60 per cent will be aged under 60
• of whom more than half (58 per cent) will be aged 45-59
• 47 per cent will be women headed households; this reflects the fact that there
are substantially more single women who claim HB or CTB than men
• 23 per cent will be men
• just under one in five claimants will have children
• 12 per cent will be lone parent households
• seven per cent will be couples with children
• 64 per cent will have a self-reported DDA disability
• 16 per cent of claimants will be BME
• 49 per cent will live in the SRS
• 18 per cent will live in the PRS
• 33 per cent will be owner occupiers.
There will be approximately 350,000 non-dependants living in the households affected
who will be expected to make up the shortfall in HB caused by increased deductions. The
characteristics of this group include:
• 92 per cent will be aged under 60
• of whom 41 per cent will be aged under 25
55
• 82 per cent will be single
• 59 per cent will be men
• more than half (56 per cent) will have an income of less than £180 per week44
• seven per cent will have children
• 26 per cent will be BME.
The characteristics of those claimants and the non-dependants affected by reform broadly
reflect the characteristics of the HB and CTB caseload as a whole. A small number of non-
dependants have dependent children (seven per cent) which has the potential to lead to
increased child poverty amongst some households, but the Equality Impact Assessment
assumes the effect on child poverty will be minimal. However, there are two exceptions
where particular groups may be disproportionately affected by the policy. Only 10 per cent
of HB/CTB customers as a whole are BME but:
'A higher proportion of ethnic minorities appear to be affected by the measure, both in
terms of customers and the non-dependants themselves, than their share of the wider
Housing Benefit and Council Tax Benefit, and indeed their share of the wider population,
and this implies a potential risk that this group may be disproportionately affected. This
may, in part, reflect the differences in living arrangements across ethnic groups, such as
extended families.'
DWP (2011) Equality Impact Assessment, p13
In addition, a disproportionate number of non-dependants who will be expected to make the
higher contribution to HB as the NDDs increase will be single males. Younger, working age
people will also be disproportionately affected as a group.
Impact of up-rating non-dependent deductions in Hampshire
Table 4.1 below details the impact of the reforms to non-dependant deductions in
Hampshire. A total of 6,400 Hampshire households are affected by the measures, or 90 in
every 10,000 households across the county. This figure rises to 140 and 130 in Portsmouth
and Southampton respectively. The impact at the national level is more severe than in
Hampshire as a whole with the financial loss per working age adult at £9 per year for Great
Britain compared to £6 per year in Hampshire. Only Portsmouth loses more than the
national average per working age adult.
44
Including those on income related benefits.
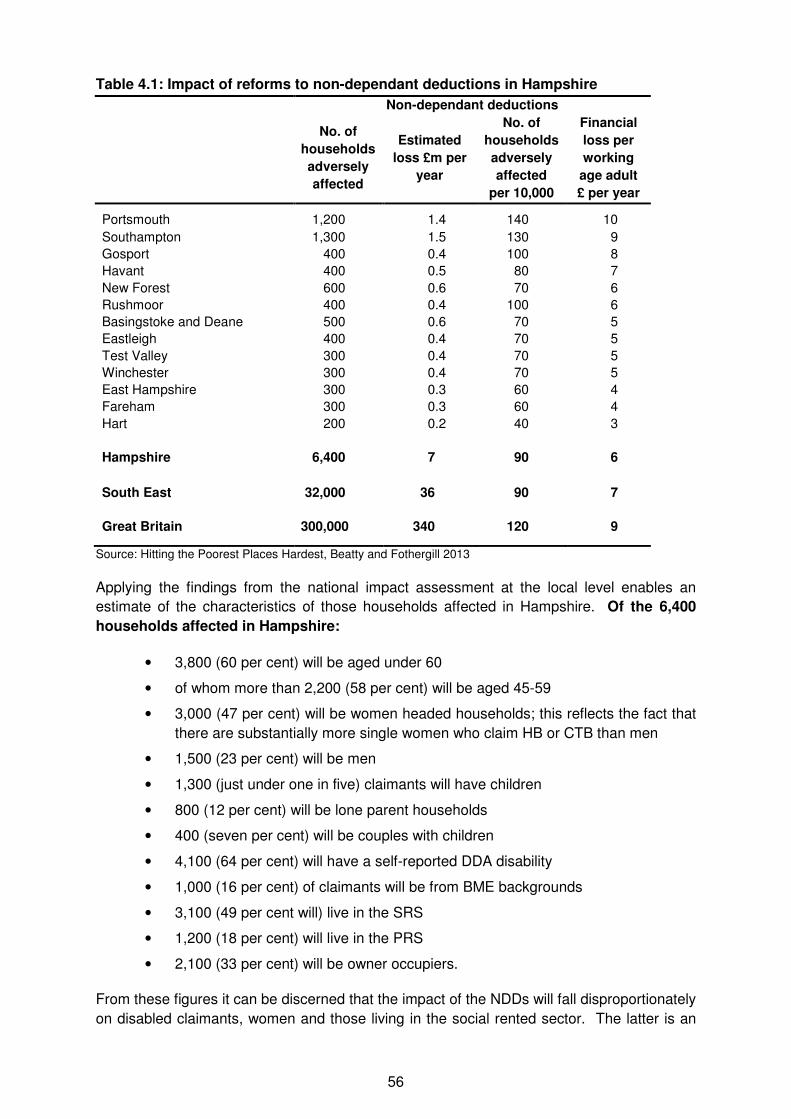
56
Table 4.1: Impact of reforms to non-dependant deductions in Hampshire
Non-dependant deductions
No. of
households
adversely
affected
Estimated
loss £m per
year
No. of
households
adversely
affected
per 10,000
Financial
loss per
working
age adult
£ per year
Portsmouth 1,200 1.4 140 10
Southampton 1,300 1.5 130 9
Gosport 400 0.4 100 8
Havant 400 0.5 80 7
New Forest 600 0.6 70 6
Rushmoor 400 0.4 100 6
Basingstoke and Deane 500 0.6 70 5
Eastleigh 400 0.4 70 5
Test Valley 300 0.4 70 5
Winchester 300 0.4 70 5
East Hampshire 300 0.3 60 4
Fareham 300 0.3 60 4
Hart 200 0.2 40 3
Hampshire 6,400 7 90 6
South East 32,000 36 90 7
Great Britain 300,000 340 120 9
Source: Hitting the Poorest Places Hardest, Beatty and Fothergill 2013
Applying the findings from the national impact assessment at the local level enables an
estimate of the characteristics of those households affected in Hampshire. Of the 6,400
households affected in Hampshire:
• 3,800 (60 per cent) will be aged under 60
• of whom more than 2,200 (58 per cent) will be aged 45-59
• 3,000 (47 per cent) will be women headed households; this reflects the fact that
there are substantially more single women who claim HB or CTB than men
• 1,500 (23 per cent) will be men
• 1,300 (just under one in five) claimants will have children
• 800 (12 per cent) will be lone parent households
• 400 (seven per cent) will be couples with children
• 4,100 (64 per cent) will have a self-reported DDA disability
• 1,000 (16 per cent) of claimants will be from BME backgrounds
• 3,100 (49 per cent will) live in the SRS
• 1,200 (18 per cent) will live in the PRS
• 2,100 (33 per cent) will be owner occupiers.
From these figures it can be discerned that the impact of the NDDs will fall disproportionately
on disabled claimants, women and those living in the social rented sector. The latter is an
57
important point given that where non-dependants choose to move out of their current home
as a result of the changes, they may leave the claimant under-occupying their property; and
will therefore be subject to the bedroom tax.
Our estimate for Hampshire is that a total of 6,400 households will be affected by NDDs. If
we apply the same ratio for non-dependents included in the DWP Impact Assessment
(350,000 dependents affected in 300,000 households: a ratio of 1.17 dependents per
household), then it is estimated that 7,500 (rounded) non-dependents living in these 6,400
households are affected. Therefore, of the 7,500 non-dependants living in the
households affected (who will be expected to make up the shortfall in HB caused by
increased deductions):
• 6,900 (92 per cent) will be aged under 60
• of whom 2,800 (41 per cent) will be aged under 25
• 6,200 (82 per cent) will be single
• 4,400 (59 per cent) will be men
• 4,200 (56 per cent) will have an income of less than £180 per week45
• 500 (seven per cent) will have dependent children
• 2,000 (26 per cent) will be from BME backgrounds.
A map of the distribution of the financial losses incurred as a result of the up-rating of NDDs
within local authorities is not possible due to the unavailability of small area CTB caseload
data.
Summary
• non-dependant deductions refers to increases in the deductions from Housing
Benefit, Council Tax Benefit and other income-based benefits to reflect the
contribution that non-dependant household members are expected to make
towards the household’s housing costs
• the impact of these changes is twofold with 6,400 households affected and
7,500 non-dependants living in those households
• the financial impact of NDDs in Hampshire is broadly comparable in scale to that
of the under-occupation measure: the changes account for 2 per cent of the total
impact of all welfare reforms and amount to an estimated financial loss of just
over £7m per annum
• the rise in NDD rates is equivalent to an 84 per cent increase for HB NDDs and
a 59 per cent increase for CTB NDDs between 2010/11 and 2013/14
• the effects of the measures fall disproportionately on claimants aged 45-59,
women headed households, the SRS and households containing an individual
with a self-reported DDA disability
• in terms of non-dependents those affected are more likely to be single, to be
men and to be on an income of less than £180 per week
• the larger urban areas of Portsmouth and Southampton are the worst affected
districts in Hampshire.
45
Including those on income-related benefits.
58
5Household benefit cap
Introduction
Three of the government's key principles underpinning the overhaul of the welfare system
have been the stated aims of making the benefits system fairer, tackling the deficit and
increasing the incentives to work. A completely new policy which epitomises these key aims
was announced in the October 2010 Spending Review: the benefit cap. The total amount of
benefits that any family will be able to receive will be capped at the average earnings of a
working family. The reform has received much attention in the press, policy and practitioner
circles although in reality it affects relatively few benefit claimants. However, those individual
families affected by the measure, although relatively small in number, will be hit hard.
"The state can no longer afford to pay people disproportionate amounts of benefit each
week, sometimes in excess of what someone in work may take home in wages."
DWP (2012) Impact Assessment,46 p1
As a key aim of the policy is to encourage claimants into work or to increase the number of
hours they work, the benefit cap only applies to working age claimants and pensioners are
not included in the policy. Those on Working Tax Credits are also exempt from the cap
in-order to increase the incentive to enter paid work and remain in paid work to avoid being
subject to the cap. There are also a number of other exempt groups who may have less
ability to reduce their housing costs, alter their spending patterns, have additional care or
mobility costs, or are families from the Armed Forces who should be supported to recognise
the sacrifices they have made. These exempt groups include those households receiving:
• Disability Living Allowance
• Personal Independence Payment
• Industrial Injuries benefit (and equivalent payments made as part of a War
Disablement Pension or the Armed Forces Compensation Scheme)
• Support Component of Employment and Support Allowance
• War widows and war widowers.
46
DWP (2102) Benefit Cap (Housing Benefit) Regulations 2012: Impact assessment for the benefit cap.
http://www.dwp.gov.uk/docs/benefit-cap-wr2011-ia.pdf
59
During the passing of the Welfare Reform Bill an additional concession was made to
introduce a grace period of nine months (39 weeks) for people who lose their jobs. However,
this only applies to those who have worked for at least 50 weeks of the last 52 weeks before
they lost their job. More recently in the 2012 Autumn Statement an additional exemption
was introduced to include a disregard for housing costs for those in supported Exempt
Accommodation (S(E)A).47
Because of the level of controversy the benefit cap generated it was also announced that a
review of the cap would be published in 2014 after the first year of its operation (April 2013-
April 2014). The review will consider specific issues of concern raised during the passing of
the bill including:
• the qualifying period of working for 50 out of past 52 weeks to be eligible for the
grace period of nine months
• the impact of the introduction of the Personal Independence Payment system on
the 8th April 2013 which will replace Disability Living Allowance (one of the
groups currently exempt from the benefit cap)
• differences in regional housing costs, costs for temporary and supported
accommodation which tend to be more expensive than mainstream provision.
Overview of the benefit cap
When the benefit cap was announced in October 2010 it was originally planned to be
introduced for all working age people in April 2013. However, in December 2012 it was
announced that in the first instance the benefit cap would be implemented in four London
boroughs - Bromley, Croydon, Enfield and Haringey - in April 2013. The cap was then rolled
out in two tranches from July 2013 and August 2013 and by the end of September 2013 all
households subject to the reform had had their benefits capped. The benefit cap has been
introduced in all districts in Hampshire since July 2013. Immediate employment support via
Jobcentre Plus and its partners including the Work Programme and Work Choice48 will be
available to all those who are affected by the cap.
Initially local authorities (LAs) will administer the benefit cap through the Housing Benefit (HB)
system. The LA will reduce a claimant's HB by the excess amount over the relevant benefit
cap. However, the local authority will ensure that a claimant has a HB payment of at least
£0.50 (which is the minimum amount needed to keep a HB claimant live) to enable claimants
to access support through their local authority such as Discretionary Housing Payments
(DHPs). The Government is providing up to49 an additional £65m in 2013/14 and £35m in
2014/15 in the DHP fund to provide short term assistance to claimants affected specifically
47 Exempt supported accommodation is defined as a resettlement place; or accommodation provided by a county
council, housing association registered charity or voluntary organisation where that body or person acting on their behalf provides the claimant with care, support or supervision. For further details see National Housing Federation (2013) Briefing: Benefits for people living in supported and sheltered housing. http://s3-eu-west-1.amazonaws.com/pub.housing.org.uk/Federation%20update%20on%20exempt %20accommodation%20Jan%202013.pdf 48
Work Choice provides support to disabled individuals who find it hard to work to find, keep and get on in a job. This scheme is open to those who have a recognised disability as defined by the Equalities Act 2010. Participants must be able to work at least 16 hours a week after Work Entry Support which includes addressing employability needs through training and developing skills, building confidence and interview coaching. 49
The exact figure has not been confirmed since the exemption for S(E)A.
60
by this measure. Eventually the Benefit Cap will be administered through Universal Credit
(UC).
The aim is to limit the total amount of benefits workless households can receive so that it is
no longer possible to receive more in welfare benefits than the average weekly wage for
working households. The caps are based on national net median earnings as a benchmark
of average take home pay amongst working households and are set at:
• £500 per week for couples and lone parent households, equivalent to £2,167
per month or £26,000 per year
• £350 per week for single person households without children, equivalent to
£1,517 per month or £18,200 per year.
The cap will be based on the combined value of the following benefits:
• Bereavement Allowance/ Widowed Parent’s/Mother’s Allowance
• Carer’s Allowance
• Child Benefit
• Child Tax Credit
• Employment and Support Allowance (ESA) (contribution-based and income-
related) except where the Support Component has been awarded
• Guardian’s Allowance
• Housing Benefit
• Incapacity Benefit
• Income Support
• Jobseeker’s Allowance (contribution-based and income-based)
• Maternity Allowance
• Severe Disablement Allowance (SDA)
• Widow’s Pension.
Free School meals and Council Tax Reduction (CTR) are excluded from the cap as will be
the childcare element of UC when it is introduced. There are a number of other payments
which will be disregarded when calculating the cap including Discretionary Housing
Payments, Social Fund Payments and Crisis Loans.50
National impact of benefit cap
The Government's expectations are that the benefit cap will result in a range of behavioural
responses by the claimants affected. These include: encouraging out-of-work benefit
claimants to enter work or increase their hours; reducing non-rent expenditure; using other
income to make up a shortfall in HB; or moving to cheaper accommodation or a cheaper
area. A full overview of the potential impacts and passage of this measure through the
50
For a full list of benefits disregarded see: House of Commons Library (2013) The Housing Benefit Cap,
Standard Note: Sn/SP/6294. http://www.parliament.uk/briefing-papers/SN06294
61
passing of the Welfare Reform Act is contained in a House of Commons Library Standard
Note on the Household Benefit Cap (see footnote 50 above).
The original DWP Impact Assessment for the benefit cap (January 2012) estimated that
67,000 households would be affected by the cap. This figure was subsequently revised
downwards to 56,000 in the revised Impact Assessment in July 201251. More recently (April
2013) the figure has been revised downwards again to indicate 40,000 households would
be affected and this reflected the additional exemption for S(E)A and advances in the
estimation methodology52. The fiscal savings to the Exchequer from the implementation of
the benefit cap were originally estimated to be £270m per year when fully implemented but
this figure has also been revised downwards in the 2013 Budget to savings of £185m
per year.
On the basis of the current HB caseload the 40,000 affected households would represent
just 0.8 per cent of the total current GB HB caseload. If the national figures from the latest
Impact Assessment are adjusted in line with the revised estimate of 40,000 affected
households, then it is estimated that they will contain approximately 57,000 adults and
136,000 children.
The households affected are workless and more likely to be larger than average with three
plus children and/or living in high-rent areas. The mean reduction of benefit is estimated
at £89 per week but this includes some households with very large reductions and the
median reduction is going to be in the region of £60 a week. Estimated characteristics
of households affected in 2013/14 in the impact assessment include:
• 49 per cent are in Greater London
• nearly three quarters of local authorities will have less than 100 families affected
• 39 per cent will be on Income Support
• 34 per cent will be on Jobseeker's Allowance
• 25 per cent will be on ESA (excludes those in the Support Group)
• 54 per cent will live in the PRS
• 46 per cent will live in the SRS
• 50 per cent will be lone parents
• 39 per cent will be couples
• 10 per cent will be single
• 62 per cent have been on benefit for more than two years.
Impact of benefit cap in Hampshire
Table 5.1 below shows the impact of the overall benefit cap on households in Hampshire by
local authority district and benchmarked against the regional and national figures. Over half
51
DWP (2102) Benefit Cap (Housing Benefit) Regulations 2012: Impact assessment for the benefit cap.
http://www.dwp.gov.uk/docs/benefit-cap-wr2011-ia.pdf 52
DWP (2013) Ad hoc statistics on Households identified as potentially impacted by the benefit cap. https://www.gov.uk/government/uploads/system/uploads/attachment_data/file/223253/Ben_Cap_Updated_Estimate.pdf
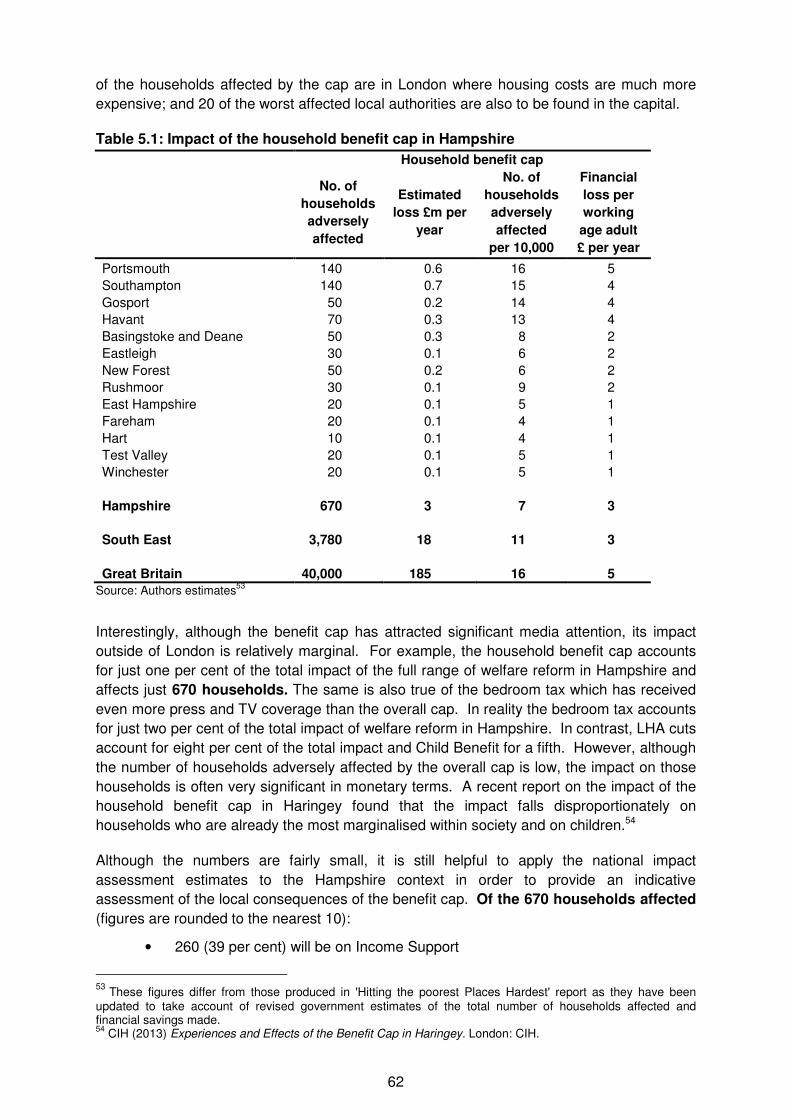
62
of the households affected by the cap are in London where housing costs are much more
expensive; and 20 of the worst affected local authorities are also to be found in the capital.
Table 5.1: Impact of the household benefit cap in Hampshire
Household benefit cap
No. of
households
adversely
affected
Estimated
loss £m per
year
No. of
households
adversely
affected
per 10,000
Financial
loss per
working
age adult
£ per year
Portsmouth 140 0.6 16 5
Southampton 140 0.7 15 4
Gosport 50 0.2 14 4
Havant 70 0.3 13 4
Basingstoke and Deane 50 0.3 8 2
Eastleigh 30 0.1 6 2
New Forest 50 0.2 6 2
Rushmoor 30 0.1 9 2
East Hampshire 20 0.1 5 1
Fareham 20 0.1 4 1
Hart 10 0.1 4 1
Test Valley 20 0.1 5 1
Winchester 20 0.1 5 1
Hampshire 670 3 7 3
South East 3,780 18 11 3
Great Britain 40,000 185 16 5
Source: Authors estimates53
Interestingly, although the benefit cap has attracted significant media attention, its impact
outside of London is relatively marginal. For example, the household benefit cap accounts
for just one per cent of the total impact of the full range of welfare reform in Hampshire and
affects just 670 households. The same is also true of the bedroom tax which has received
even more press and TV coverage than the overall cap. In reality the bedroom tax accounts
for just two per cent of the total impact of welfare reform in Hampshire. In contrast, LHA cuts
account for eight per cent of the total impact and Child Benefit for a fifth. However, although
the number of households adversely affected by the overall cap is low, the impact on those
households is often very significant in monetary terms. A recent report on the impact of the
household benefit cap in Haringey found that the impact falls disproportionately on
households who are already the most marginalised within society and on children.54
Although the numbers are fairly small, it is still helpful to apply the national impact
assessment estimates to the Hampshire context in order to provide an indicative
assessment of the local consequences of the benefit cap. Of the 670 households affected
(figures are rounded to the nearest 10):
• 260 (39 per cent) will be on Income Support
53
These figures differ from those produced in 'Hitting the poorest Places Hardest' report as they have been updated to take account of revised government estimates of the total number of households affected and financial savings made. 54
CIH (2013) Experiences and Effects of the Benefit Cap in Haringey. London: CIH.
63
• 230 (34 per cent) will be on Jobseeker's Allowance
• 170 (25 per cent) will be on ESA (excludes those in the Support Group)
• 360 (54 per cent) will live in the PRS
• 310 (46 per cent) will live in the SRS
• 340 (50 per cent) will be lone parents
• 260 (39 per cent) will be couples
• 70 (10 per cent) will be single
• 420 (62 per cent) have been on benefit for more than two years.
Looking across the characteristics of those impacted by the benefit cap there is a
disproportionate impact on the long-term unemployed, lone parents (who are much more
likely to be women), and claimants living in the PRS where housing costs tend to be higher.
There is no information available on the distribution of the households affected at sub LA
level. Therefore it is not possible to produce a local area map of where these families are
likely to live within each district.
Summary
• the household benefit cap introduces a new ceiling on total payments per
household, applying to the sum of a wide range of benefits for working age
claimants
• in a similar vein to the bedroom tax the overall benefit cap has attracted
significant media attention but affects only approximately 670 households in
Hampshire
• over half of the affected households are estimated to be resident in the districts
of Havant, Portsmouth or Southampton
• this measure has the least impact of all the different reforms amounting to a loss
of £3m per year to the local Hampshire economy
• the effects fall disproportionately on the long-term unemployed, lone parents
and households in the PRS where housing costs tend to be higher
• while the numbers affected are small the impacts can be quite severe,
especially for households with large numbers of dependants. With this in mind
BME groups which, for various cultural and religious reasons, tend to have
larger families are likely to be disproportionately affected also
• in extreme cases some households may have to find cheaper and/or smaller
accommodation elsewhere, which could lead to overcrowding and detachment
from social networks of support.
64
6Council Tax Benefit
Introduction
Council Tax Benefit (CTB) was an income related benefit which low-income households
could claim towards their Council Tax if they met means testing thresholds. CTB was
administered by local authorities (LAs) according to a nationally-set criteria and the full
amount was reimbursed to the LAs by the Department of Work and Pensions (DWP). In the
2010 Spending Review the government announced that from April 2013 it would abolish
CTB, reduce expenditure on Council Tax support by ten per cent and move to a localised
system of support for Council Tax. This localisation of the new Council Tax Reduction
(CTR) scheme makes this welfare reform very different from all the others introduced as the
level of support received no longer depends only on the claimant's circumstances but where
they live. Two sets of families in exactly the same financial situation may therefore receive
very different levels of support depending on which district they live in.
The legislation for the CTR was passed through the Local Government Finance Act 2012
which stated that a resident's liability may be reduced "to such an extent as the billing
authority thinks fit". Key aims of reforming CTB included making a contribution to a
reduction in the national deficit via the ten per cent cut in funding. The reform is also
targeted at those of working age and pensioners are protected from this cut in funding. By
targeting working age recipients the aim again is to reinforce work incentives and encourage
an increase in the number of hours worked by benefit claimants. The third aim is a
departure from the other welfare reforms as it was underpinned by the government's
localisation agenda to support LAs local-decision making and accountability over spending
decisions:
"To give local authorities a greater stake in the economic future of their local area, and
so support the Government’s wider agenda to enable stronger, balanced economic
growth across the country." House of Commons Library (2013)55, p6
The New Policy Institute (NPI) carried out a study for the Joseph Rowntree Foundation to
analyse all the CTR schemes to be introduced across all LAs in England.56 That data forms
the basis of the estimates provided here on the number of households affected in LAs within
Hampshire.
55
House of Commons Library (2013) Localising support for Council Tax - background. Staandard Note
SN/SP/6101. http://www.parliament.uk/briefing-papers/SN06101 56
Bushe, S., Kenway, P. and Aldridge, H. (2013) The impact of localising council tax benefit. Joeseph Rowntree
Foundation. http://www.jrf.org.uk/sites/files/jrf/council-tax-benefit-localisation-summary.pdf
65
National impact of Council Tax Benefit reforms
Council Tax is a devolved matter in Scotland and Wales and both governments have
decided not to pass on the ten per cent to their local authorities and so no residents in
Scotland and Wales will experience a reduction in the level of support they receive towards
their Council Tax bill. The Northern Ireland Executive have also decided to subsume the ten
per cent cut in funding and are not passing it onto residents there either.57
The NPI analysis estimates that 82 per cent of all 326 LAs in England will be reducing the
level of support previously given to CTB claimants. However, 18 per cent are making no
change to their local system and will, just like Scotland, Wales and Northern Ireland, absorb
the ten per cent cut in funding. In all, the ten per cent reduction in funding will save the
government £490m per year but on this basis it is estimated that only £340m of this a year
will be passed onto claimants. The Resolution Foundation58 estimates that a typical
working age non-employed claimant of CTB will on average face council tax bills of between
£1.80 and £4.90 a week.
There have been real concerns expressed that many low paid workers and benefit claimants
who previously received CTB, but who may now be expected to contribute, may struggle to
find the money especially when it comes alongside other cuts to their benefits package
leading families to fall into arrears. The LAs may also find it difficult or cost effective to
collect these small payments from large numbers of households and hence lead to shortfalls
in their local tax base.
There is very little information available on the characteristics of the individuals who will be
impacted by the changes to the CTB system, not least as the localisation means that an
assessment from national data is no longer possible. However, it is worth bearing in mind a
limited number of characteristics of the national caseload which it is reasonable to expect
might be reflected amongst key groups affected. The CTR will only impact on those of
working age, so if those over 65 are excluded and if we assume most families with
dependent children are below pensionable age then amongst those affected:
• 46 per cent will have dependent children
• 30 per will be lone parent families
• 59 per cent will be on passported benefits
• 29 per cent will be on Income Support
• 16 per cent will be on JSA
• 14 per cent will be on ESA.
57
In Northern Ireland the equivalent to the Council Tax system is known as Regional Rates Rebate. 58 Pennycook, M. and Hurrell, A. (2013) No Clear Benefit: The financial impact of Council Tax Benefit reform on
low income households. Resolution Foundation. http://res.a-g-a-i-n.com/media/media/downloads/ No_Clear_Benefit.pdf
New Policy Institute (2013)
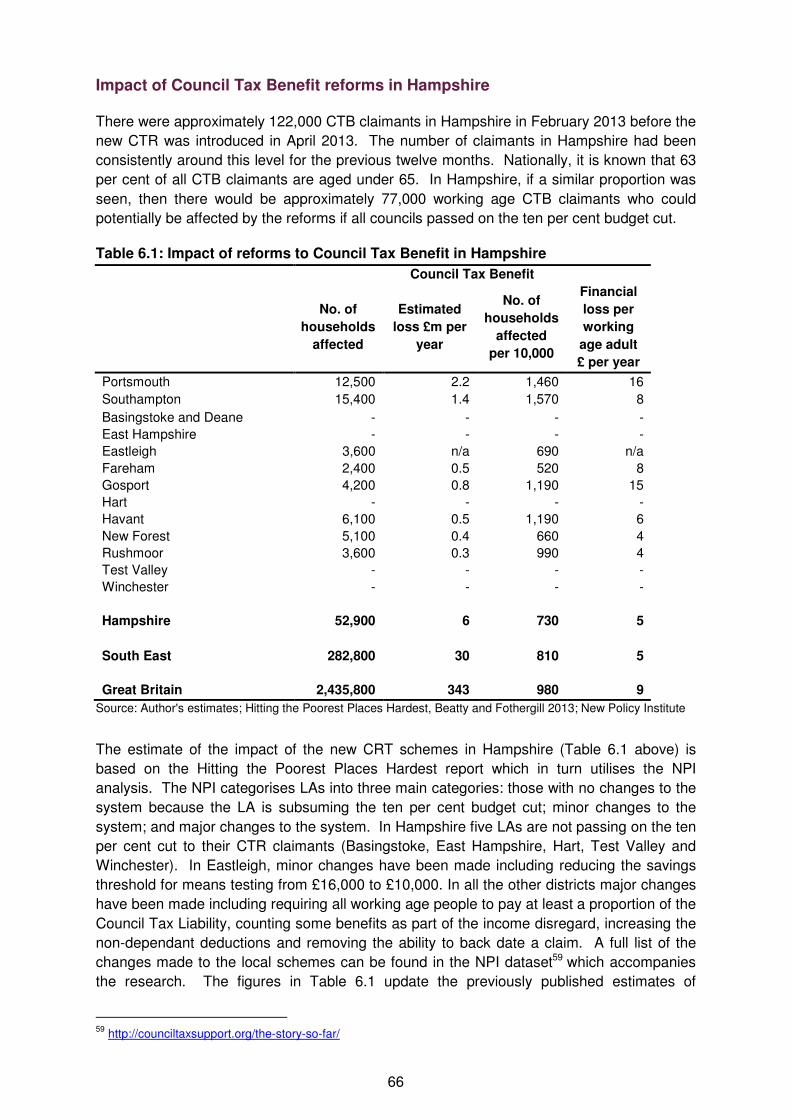
66
Impact of Council Tax Benefit reforms in Hampshire
There were approximately 122,000 CTB claimants in Hampshire in February 2013 before the
new CTR was introduced in April 2013. The number of claimants in Hampshire had been
consistently around this level for the previous twelve months. Nationally, it is known that 63
per cent of all CTB claimants are aged under 65. In Hampshire, if a similar proportion was
seen, then there would be approximately 77,000 working age CTB claimants who could
potentially be affected by the reforms if all councils passed on the ten per cent budget cut.
Table 6.1: Impact of reforms to Council Tax Benefit in Hampshire
Council Tax Benefit
No. of
households
affected
Estimated
loss £m per
year
No. of
households
affected
per 10,000
Financial
loss per
working
age adult
£ per year
Portsmouth 12,500 2.2 1,460 16
Southampton 15,400 1.4 1,570 8
Basingstoke and Deane - - - -
East Hampshire - - - -
Eastleigh 3,600 n/a 690 n/a
Fareham 2,400 0.5 520 8
Gosport 4,200 0.8 1,190 15
Hart - - - -
Havant 6,100 0.5 1,190 6
New Forest 5,100 0.4 660 4
Rushmoor 3,600 0.3 990 4
Test Valley - - - -
Winchester - - - -
Hampshire 52,900 6 730 5
South East 282,800 30 810 5
Great Britain 2,435,800 343 980 9
Source: Author's estimates; Hitting the Poorest Places Hardest, Beatty and Fothergill 2013; New Policy Institute
The estimate of the impact of the new CRT schemes in Hampshire (Table 6.1 above) is
based on the Hitting the Poorest Places Hardest report which in turn utilises the NPI
analysis. The NPI categorises LAs into three main categories: those with no changes to the
system because the LA is subsuming the ten per cent budget cut; minor changes to the
system; and major changes to the system. In Hampshire five LAs are not passing on the ten
per cent cut to their CTR claimants (Basingstoke, East Hampshire, Hart, Test Valley and
Winchester). In Eastleigh, minor changes have been made including reducing the savings
threshold for means testing from £16,000 to £10,000. In all the other districts major changes
have been made including requiring all working age people to pay at least a proportion of the
Council Tax Liability, counting some benefits as part of the income disregard, increasing the
non-dependant deductions and removing the ability to back date a claim. A full list of the
changes made to the local schemes can be found in the NPI dataset59 which accompanies
the research. The figures in Table 6.1 update the previously published estimates of
59
http://counciltaxsupport.org/the-story-so-far/
67
households affected as it includes the number of households affected by minor as well as
major changes to the system.60 It has however not been possible to assess the financial
impact for these minor changes in Eastleigh.
Drawing on the national figures on characteristics of impacted households, of the 52,900
households impacted in Hampshire:
• 24,300 (46 per cent) will have dependent children
• 15,900 (30 per cent) will be lone parent families
• 31,200 (59 per cent) will be on passported benefits
• 15,300 (29 per cent) will be on Income Support
• 8,500 (16 per cent) will be on JSA
• 7,400 (14 per cent) will be on ESA.
Though the above information on the characteristics of those affected is fairly limited there
are some important observations to make. Firstly, that three-in-five households affected by
CT localisation are on passported benefits points to the cumulative impact of the full range
of welfare reforms. The changes to CT benefit may be manageable in isolation for
households on low incomes, but considered alongside the raft of other changes they appear
much less so. Secondly, almost half of the households affected comprise dependent
children, a common thread throughout the impact assessments which underscores the
disproportionate impact of welfare reforms on children in Hampshire and across the country.
There is no information available on the distribution of the CTB at sub-LA level and therefore
it is not possible to produce a local area map of where the households affected by the
reforms to CTB live within each district.
Summary
• Council Tax Benefit reform involves reductions in the entitlement of working age
claimants arising from a 10 per cent reduction in total payments to local
authorities from central government
• the measure affects 52,900 households resulting in a loss of £6m per year to
the Hampshire economy
• claimants in eight of Hampshire's 13 local authority districts are affected; five
authorities - Basingstoke and Deane, East Hampshire, Hart, Test Valley and
Winchester - have chosen not to pass the ten per cent reduction on to claimants
• the worst affected districts in Hampshire are Gosport and Portsmouth in terms of
the relative loss per working age adult
• CT localisation accounts for two per cent of the total impact of all welfare
reforms
• for those areas affected the impact of this change falls disproportionately on
claimants on passported benefits.
60
The figures previously reported in 'Hitting the Poorest Places Hardest' only included those LAs with a major change to their CTR system. This reflected the fact that only four per cent of all LAs were undertaking minor changes and it was difficult to assess how much of the budget cut was being passed onto residents.
68
7Incapacity benefits
Introduction
There has been an on-going process of reforming the incapacity benefits system (which
includes Incapacity Benefit (IB), Severe Disablement Allowance (SDA), and Employment
and Support Allowance (ESA)) which pre-dates the current welfare reform programme
introduced by the coalition government. The impetus for reforming the system is rooted in
the growth in numbers of long term sick and disabled residents claiming work replacement,
sickness related benefits since the mid-1980s. The three-fold growth in claimants nationally
over the past thirty years means that even at the height of the recent recession in Great
Britain there were far more claimants of incapacity benefits than claimant unemployed;
2.62m and 1.49m respectively in August 2009. Unlike claimant unemployment, which had
fallen substantially during the period of sustained economic growth from the late 1990s to
the recession, the numbers on incapacity benefits had remained stubbornly high.
Much has been written about the growth in claimants nationally61 and the uneven geography
of the claims with the highest concentrations of claimants being located in the older industrial
regions of Britain. These are the areas which have also had to contend with persistently
weak demand for labour. In large parts of the South East, including Hampshire, which have
maintained buoyant labour markets with strong demand for labour, the incapacity benefits
rate amongst working age residents has been much lower than nationally; 4.3 per cent
working age population in Hampshire compared to 6.2 per cent nationally in February 2013.
However, even in Hampshire, both at the height of the recession and now, there were far
more incapacity benefits claimants than claimant unemployed; 48,910 and 27,410 claimants
respectively in February 2013. The numbers of incapacity benefit claimants in Hampshire
(Figure 7.1 below) and nationally have only recently begun to fall, primarily as a
consequence of the reforms which are discussed in this chapter. These include reforms
introduced to restrict eligibility for ESA, the transfer of IB claimants over to the ESA system
and time-limiting ESA to one year after which point it is means tested.
Because those on incapacity benefits account for the single largest group of working age
out-of-work benefit claimants and because the scale of the multiple reforms are substantial,
the financial loss to this benefit group is the greatest of all the reforms underway.
61
Beatty, C., Fothergill S. and Gore T. (2013) The Real Level of Unemployment. CRESR Sheffield Hallam
University.
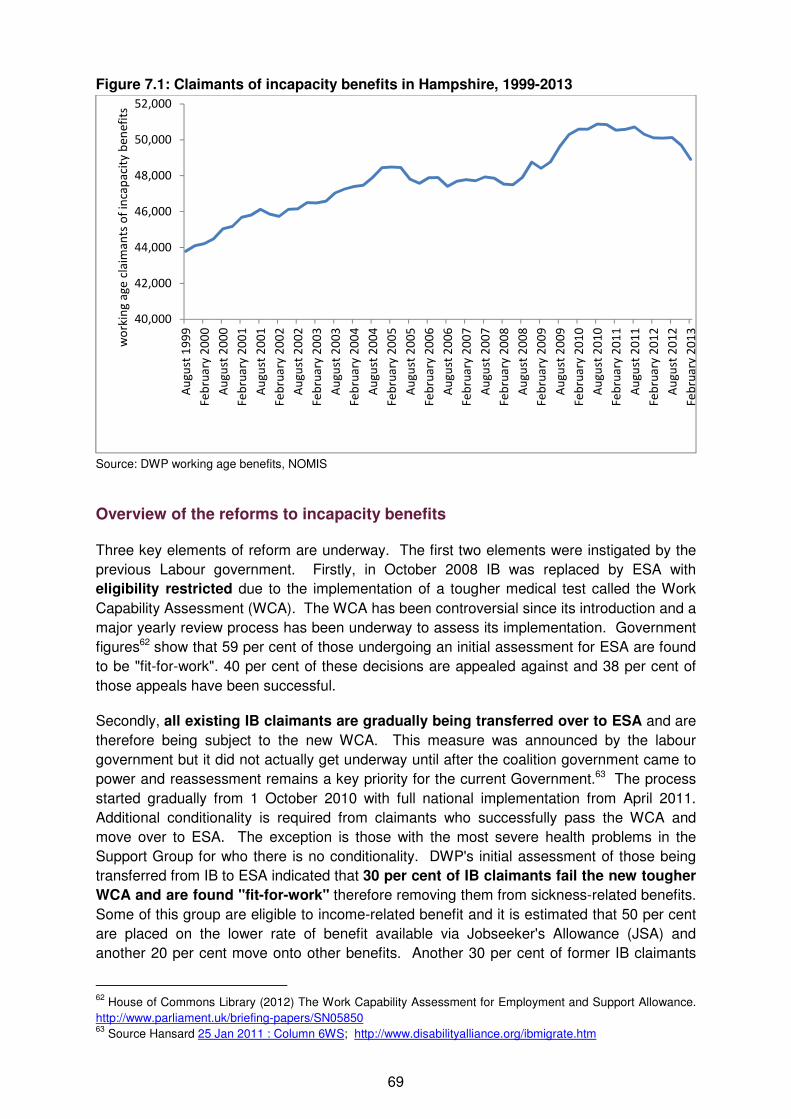
69
Figure 7.1: Claimants of incapacity benefits in Hampshire, 1999-2013
Source: DWP working age benefits, NOMIS
Overview of the reforms to incapacity benefits
Three key elements of reform are underway. The first two elements were instigated by the
previous Labour government. Firstly, in October 2008 IB was replaced by ESA with
eligibility restricted due to the implementation of a tougher medical test called the Work
Capability Assessment (WCA). The WCA has been controversial since its introduction and a
major yearly review process has been underway to assess its implementation. Government
figures62 show that 59 per cent of those undergoing an initial assessment for ESA are found
to be "fit-for-work". 40 per cent of these decisions are appealed against and 38 per cent of
those appeals have been successful.
Secondly, all existing IB claimants are gradually being transferred over to ESA and are
therefore being subject to the new WCA. This measure was announced by the labour
government but it did not actually get underway until after the coalition government came to
power and reassessment remains a key priority for the current Government.63 The process
started gradually from 1 October 2010 with full national implementation from April 2011.
Additional conditionality is required from claimants who successfully pass the WCA and
move over to ESA. The exception is those with the most severe health problems in the
Support Group for who there is no conditionality. DWP's initial assessment of those being
transferred from IB to ESA indicated that 30 per cent of IB claimants fail the new tougher
WCA and are found "fit-for-work" therefore removing them from sickness-related benefits.
Some of this group are eligible to income-related benefit and it is estimated that 50 per cent
are placed on the lower rate of benefit available via Jobseeker's Allowance (JSA) and
another 20 per cent move onto other benefits. Another 30 per cent of former IB claimants
62
House of Commons Library (2012) The Work Capability Assessment for Employment and Support Allowance.
http://www.parliament.uk/briefing-papers/SN05850 63
Source Hansard 25 Jan 2011 : Column 6WS; http://www.disabilityalliance.org/ibmigrate.htm
40,000
42,000
44,000
46,000
48,000
50,000
52,000
Au
gu
st 1
99
9
Fe
bru
ary
20
00
Au
gu
st 2
00
0
Fe
bru
ary
20
01
Au
gu
st 2
00
1
Fe
bru
ary
20
02
Au
gu
st 2
00
2
Fe
bru
ary
20
03
Au
gu
st 2
00
3
Fe
bru
ary
20
04
Au
gu
st 2
00
4
Fe
bru
ary
20
05
Au
gu
st 2
00
5
Fe
bru
ary
20
06
Au
gu
st 2
00
6
Fe
bru
ary
20
07
Au
gu
st 2
00
7
Fe
bru
ary
20
08
Au
gu
st 2
00
8
Fe
bru
ary
20
09
Au
gu
st 2
00
9
Fe
bru
ary
20
10
Au
gu
st 2
01
0
Fe
bru
ary
20
11
Au
gu
st 2
01
1
Fe
bru
ary
20
12
Au
gu
st 2
01
2
Fe
bru
ary
20
13
wo
rkin
g a
ge
cla
ima
nts
of
inca
pa
city
be
ne
fits
70
are removed from benefit altogether because they are found fit-for-work and do not meet
means testing thresholds required to access other benefits. This may be because they have
savings or other sources of income such as a partner in work. The process of moving IB
claimants over to ESA will not be complete until March 2014.
Thirdly, the coalition government announced in the 2010 Spending Review that from April
2012 contributory ESA entitlement was to be time-limited to a year for those in the Work
Related Activity Group (WRAG). Those in the WRAG group who had already received one
year's support by April 2012 were affected by this change immediately. This was a major
departure from the previous situation where IB/ESA had not been means tested for those
with sufficient National Insurance contributions to receive the benefit. Those in the Support
Group will not be affected by the change. The aims of the policy included reducing
expenditure, reinforcing the idea that the welfare system needs to be seen as a transitional
support system for all but the most severely sick and disabled and simplifying the benefits
system so that contributory ESA is aligned with contributory JSA, which is means tested
after six months:
"To ensure that ESA is paid for a temporary period thereby creating a culture that does
not allow people to stay permanently in the WRAG, that they are expected to move
towards work or into the Support Group if there is deterioration in their functional
impairment."
DWP (2011) Impact Assessment, p1
National impact of incapacity benefits reforms
The first two elements of the reform of incapacity benefits are estimated to impact upon
550,000 claimants of which 30 per cent will not claim alternative benefits (see Hitting the
Poorest Places Hardest). The government Impact Assessment64 on the impacts of time-
limiting ESA estimates that 60 per cent of all ESA claimants, equivalent to 700,000
claimants, will be on contributory ESA and thereby affected by this measure in 2015/16. Of
these 60 per cent will be eligible to go on and claim income related ESA either at the same
rate or a lower rate depending on their other income. The remaining 40 per cent of
contributory based ESA WRAG claimants will lose their benefit entirely - equivalent to
24 per cent of all ESA claimants. This measure will also affect the large number of
claimants who have been migrated from contributory IB into the ESA WRAG group.
Using Treasury 2010 Spending Review figures for 2014/15 updated by inflation and
additional numbers affected by 2015/16, then it is estimated there will be savings of £2,600m
per year by 2015/16 from the time-limiting measure. In addition, using calculations from
'Incapacity Benefit Reform: The local regional and national impact' produced by Beatty and
Fothergill in 2011 and calculations in 'Hitting the Poorest Places Hardest' it is estimated that
the remaining measures affecting IB/ESA claimants will amount to savings of £1,750m per
year. In total this means that reform of the incapacity benefits system will result in financial
losses to the individuals involved of £4,350m a year by 2015/16 - by far the largest of any of
the reforms considered here.
64
DWP (2011) Time limit Contributory Employment and Support Allowance to one year for those in the Work-
Related activity Group: Impact Assessment. http://www.dwp.gov.uk/docs/esa-time-limit-wr2011-ia.pdf
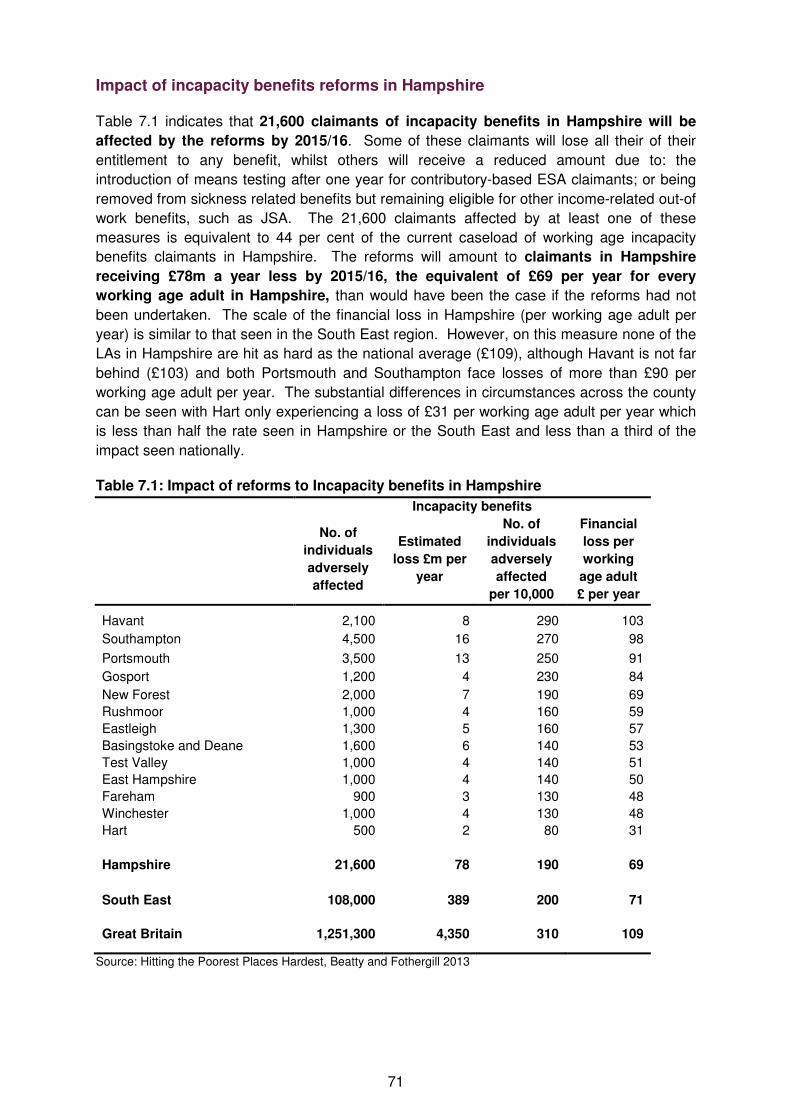
71
Impact of incapacity benefits reforms in Hampshire
Table 7.1 indicates that 21,600 claimants of incapacity benefits in Hampshire will be
affected by the reforms by 2015/16. Some of these claimants will lose all their of their
entitlement to any benefit, whilst others will receive a reduced amount due to: the
introduction of means testing after one year for contributory-based ESA claimants; or being
removed from sickness related benefits but remaining eligible for other income-related out-of
work benefits, such as JSA. The 21,600 claimants affected by at least one of these
measures is equivalent to 44 per cent of the current caseload of working age incapacity
benefits claimants in Hampshire. The reforms will amount to claimants in Hampshire
receiving £78m a year less by 2015/16, the equivalent of £69 per year for every
working age adult in Hampshire, than would have been the case if the reforms had not
been undertaken. The scale of the financial loss in Hampshire (per working age adult per
year) is similar to that seen in the South East region. However, on this measure none of the
LAs in Hampshire are hit as hard as the national average (£109), although Havant is not far
behind (£103) and both Portsmouth and Southampton face losses of more than £90 per
working age adult per year. The substantial differences in circumstances across the county
can be seen with Hart only experiencing a loss of £31 per working age adult per year which
is less than half the rate seen in Hampshire or the South East and less than a third of the
impact seen nationally.
Table 7.1: Impact of reforms to Incapacity benefits in Hampshire
Incapacity benefits
No. of
individuals
adversely
affected
Estimated
loss £m per
year
No. of
individuals
adversely
affected
per 10,000
Financial
loss per
working
age adult
£ per year
Havant 2,100 8 290 103
Southampton 4,500 16 270 98
Portsmouth 3,500 13 250 91
Gosport 1,200 4 230 84
New Forest 2,000 7 190 69
Rushmoor 1,000 4 160 59
Eastleigh 1,300 5 160 57
Basingstoke and Deane 1,600 6 140 53
Test Valley 1,000 4 140 51
East Hampshire 1,000 4 140 50
Fareham 900 3 130 48
Winchester 1,000 4 130 48
Hart 500 2 80 31
Hampshire 21,600 78 190 69
South East 108,000 389 200 71
Great Britain 1,251,300 4,350 310 109
Source: Hitting the Poorest Places Hardest, Beatty and Fothergill 2013
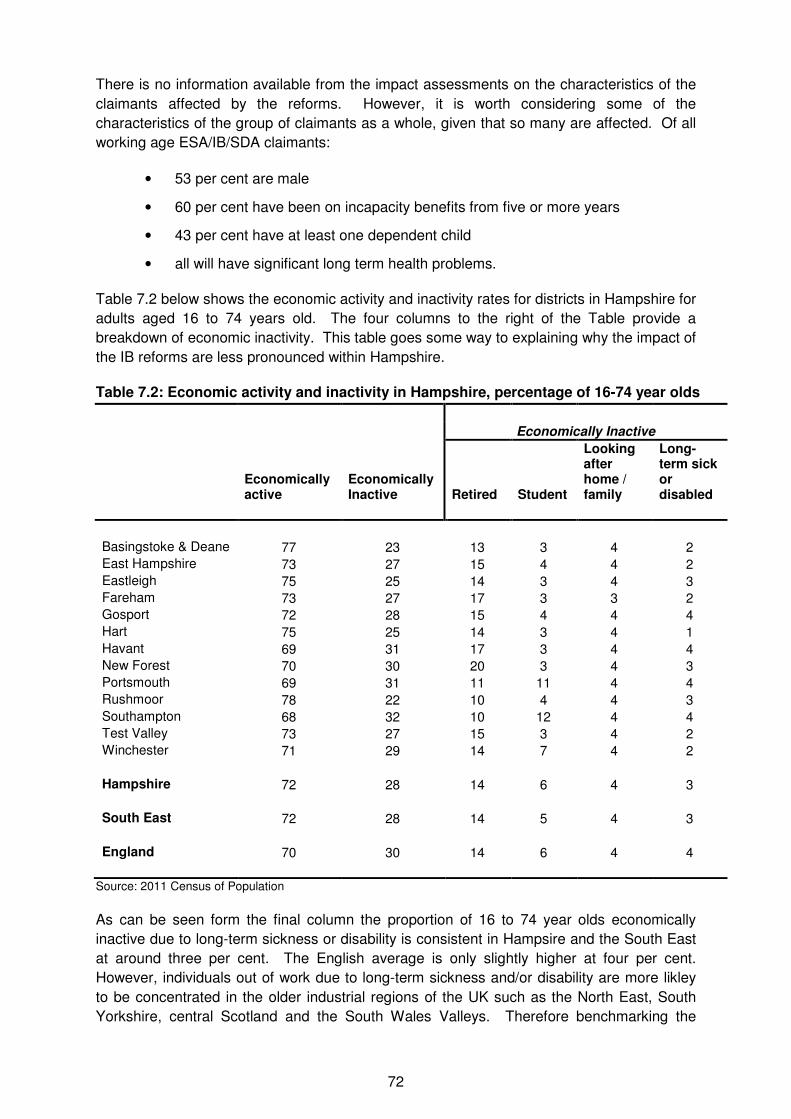
72
There is no information available from the impact assessments on the characteristics of the
claimants affected by the reforms. However, it is worth considering some of the
characteristics of the group of claimants as a whole, given that so many are affected. Of all
working age ESA/IB/SDA claimants:
• 53 per cent are male
• 60 per cent have been on incapacity benefits from five or more years
• 43 per cent have at least one dependent child
• all will have significant long term health problems.
Table 7.2 below shows the economic activity and inactivity rates for districts in Hampshire for
adults aged 16 to 74 years old. The four columns to the right of the Table provide a
breakdown of economic inactivity. This table goes some way to explaining why the impact of
the IB reforms are less pronounced within Hampshire.
Table 7.2: Economic activity and inactivity in Hampshire, percentage of 16-74 year olds
Economically Inactive
Economically active
Economically Inactive Retired Student
Looking after home / family
Long-term sick or disabled
Basingstoke & Deane 77 23 13 3 4 2
East Hampshire 73 27 15 4 4 2
Eastleigh 75 25 14 3 4 3
Fareham 73 27 17 3 3 2
Gosport 72 28 15 4 4 4
Hart 75 25 14 3 4 1
Havant 69 31 17 3 4 4
New Forest 70 30 20 3 4 3
Portsmouth 69 31 11 11 4 4
Rushmoor 78 22 10 4 4 3
Southampton 68 32 10 12 4 4
Test Valley 73 27 15 3 4 2
Winchester 71 29 14 7 4 2
Hampshire 72 28 14 6 4 3
South East 72 28 14 5 4 3
England 70 30 14 6 4 4
Source: 2011 Census of Population
As can be seen form the final column the proportion of 16 to 74 year olds economically
inactive due to long-term sickness or disability is consistent in Hampsire and the South East
at around three per cent. The English average is only slightly higher at four per cent.
However, individuals out of work due to long-term sickness and/or disability are more likley
to be concentrated in the older industrial regions of the UK such as the North East, South
Yorkshire, central Scotland and the South Wales Valleys. Therefore benchmarking the
73
impacts of IB reform in Hampshire and its districts against Great Britain produces a much
greater variation than doing so against England on its own. The four districts worst affected
by the IB reforms - Gosport, Havant, Portsmouth and Southampton - also have the highest
proportion of individuals economically inactive due to long-term sickness or disability
The table above also underscores the importance of students to the economies of
Portsmouith, Southampton and Winchester. Their relative concentration also serves to bring
down the economic activity rate in those districts: students in Portsmouth and Southampton
account for a third of the economically inactive total.
Figure 7.2 below shows the distribution of the financial impact of the reform of incapacity
benefits on local areas within Hampshire. These losses have been allocated to LSOAs on
the basis of the distribution of working age incapacity benefits claimants. It can be seen that
the impacts of IB reform in Hampshire are felt more in the principal towns and cities of the
county. While there is a clear correlation with the more populated areas of Hampshire, the
distribution across districts is more even than the impact of other welfare reforms. That said
LSOAs within the former industrial areas on the coast, from Havant up to Southampton,
exhibit greater concentartions of IB claimants and are therefore more adversely affected.
Summary
• incapacity benefit reforms involve the replacement of IB and related benefits by
ESA, with more stringent medical tests, greater conditionality and time-limiting of
non-means tested entitlement for all but the most severely ill or disabled
• the impacts of these measures are huge both in Hampshire and nationally.
They account for one fifth of the total impact of all welfare reforms in the county
with over 21,000 claimants affected
• some of those claimants will lose all of their entitlement to any benefit; others
will lose a proportion
• the reforms will amount to claimants in Hampshire collectively receiving £78m a
year less by 2015/16. Southampton alone will lose £16m and Portsmouth
£13m
• the characteristics of those affected - long-term ill health and labour market
detachment - mean that it will be extremely difficult for many to secure suitable
and sustainable employment in an increasingly competitive labour market.

74
Figure 7.2: Impact of the incapacity benefits reforms in Hampshire, by LSOA
Estimated loss in £
100,000 or more
70,000 to 100,000
50,000 to 70,000
30,000 to 50,000
Less than 30,000
Scale: 1:250,000 Data source: Authors' estimates based on Stat-Xplore, Department of Work and Pensions
New Milton LymingtonLymingtonLymingtonLymingtonLymingtonLymingtonLymingtonLymingtonLymington
FawleyFawleyFawleyFawleyFawleyFawleyFawleyFawleyFawley
BasingstokeBasingstokeBasingstokeBasingstokeBasingstokeBasingstokeBasingstokeBasingstokeBasingstoke
Havant
AndoverAndoverAndoverAndoverAndoverAndoverAndoverAndoverAndover
EastleighEastleighEastleighEastleighEastleighEastleighEastleighEastleighEastleigh
SouthamptonSouthamptonSouthamptonSouthamptonSouthamptonSouthamptonSouthamptonSouthamptonSouthampton
FarehamFarehamFarehamFarehamFarehamFarehamFarehamFarehamFareham
PortsmouthPortsmouthPortsmouthPortsmouthPortsmouthPortsmouthPortsmouthPortsmouthPortsmouthGosportGosportGosportGosportGosportGosportGosportGosportGosport
FarnboroughFarnboroughFarnboroughFarnboroughFarnboroughFarnboroughFarnboroughFarnboroughFarnborough
AldershotAldershotAldershotAldershotAldershotAldershotAldershotAldershotAldershot
AltonAltonAltonAltonAltonAltonAltonAltonAlton
PetersfieldPetersfieldPetersfieldPetersfieldPetersfieldPetersfieldPetersfieldPetersfieldPetersfield
BordonBordonBordonBordonBordonBordonBordonBordonBordon
WinchesterWinchesterWinchesterWinchesterWinchesterWinchesterWinchesterWinchesterWinchester
RingwoodRingwoodRingwoodRingwoodRingwoodRingwoodRingwoodRingwoodRingwood
75
8Disability Living Allowance
Introduction
Disability Living Allowance (DLA) was introduced in 1992 to make a contribution towards the
higher living costs associated with having a serious health problem or disability. DLA is
therefore not a work replacement benefit and is available to children and adults, whether in
work or not. There are currently 3.32m DLA claimants in Great Britain of whom 2.04m are of
working age (February 2013). The benefit is split into a mobility component to help with
walking difficulties which is paid at two levels (Higher and Lower), and a care component to
help with personal care needs which is available at three levels of payment (Highest, Middle
and Lowest). It is possible to receive any combination of these two components and the
benefit is not means tested or taxable. To make a claim an individual had to be under the
age of 65, but the benefit continues to be paid to claimants after retirement age. DLA was
awarded for either a fixed period or, in 71 per cent of cases, for an open-ended indefinite
period.65 A claimant has to have needed help for a qualifying period of at least three months
and pass a prospective test of needing the support for at least another six months.
The numbers on DLA have steadily increased since its introduction and from 2002 to 2011
the caseload had risen by a third. The increase was attributable to the maturing of the
benefit which was introduced in 1992, demographic factors given people are living for longer
and can receive DLA post retirement age, and increased awareness of the benefit including
signposting to making a DLA claim amongst the growing number of people who were
claiming incapacity benefits.
In the June 2010 Emergency Budget the coalition government announced a major overhaul
of the DLA system with respect to working age claimants: it would be replaced by a new
simplified benefit called the Personal Independence Payment (PIP). Those aged under 16
or over 65 will continue on DLA for now. The key aims underpinning the reforms are to
reduce the growing caseload on DLA and working age DLA expenditure by 20 per cent;
reduce complexity and subjectivity from the system; check that awards remain correct over
time; and remove the perception that DLA can act as a barrier to work since receipt of DLA
appears to reduce the likelihood of being in employment, even after taking into account the
impact of health conditions.
65
House of Commons (2011) Disability Living Allowance Reform. http://www.parliament.uk/briefing-
papers/SN05869
76
Overview of the replacement of DLA by PIP
The government carried out a consultation66 on the proposed reforms from December 2010
to the 18th February 2011. However, the framework for PIP was introduced via the Welfare
Reform Bill on the 16th of February 2011 before the responses to the consultation could be
considered. The consultation responses have therefore been used to inform the passage of
the Bill and secondary legislation. The government subsequently announced a series of
concessions for PIP as the Bill passed through parliament including two biennial
independent reviews within the first four years of implementation.67
The government also announced that in response to a further consultation undertaken in
March 2012 it would undertake a significantly slower migration profile for all claimants to be
moved over from DLA to the PIP system.68 The PIP system began to be introduced for new
claimants from April 2013 in a limited number of postcodes in the North West and North East
of England and in the rest of England from the June 2013. From October 2013 a sub-group
of existing DLA claimants will be invited to make a PIP claim. This group will include
children turning 16, those with changes in circumstances or those with fixed term awards
which will expire from February 2014. Finally, from October 2015 the rest of DLA claimants
will gradually be invited to make a PIP claim but this process will not be complete until
2017/18.
The PIP system will be based on a new "objective medical assessment" and regular re-
testing of claimants would be undertaken to review entitlement. The medical assessment is
designed to provide "a more holistic assessment of the impact of a health condition on an
individual's ability to participate in everyday life". The new system also means that most PIP
claimants will have to attend a face to face consultation with an independent "Healthcare
Professional" (HCP) but the final decision will be taken by a DWP Decision Maker. To date
two key private firms have won the contracts to provide the HCPs - Atos Healthcare and
Capita Business Services Ltd.
Other elements of the reform include fewer groups than previously having exemptions from
assessment, and aids and adaptations used by disabled people would be taken into
consideration when making an assessment of the level of support needed. The new benefit
will, like DLA, have two components but these will now be classified as the mobility
component and the daily living component. These components will be payable at either
the standard or the enhanced rate simplifying the combination of rates which were available
under the DLA system.
National impact of the DLA reforms
The revised Impact Assessment (footnote 66) indicates that the PIP caseload will be 1.75
million by the end of the reassessment exercise in October 2018, some 450,000 (25 per
cent) fewer than would have been under the DLA system. A further 510,000 (29 per
66
DWP (2010) Disability Living Allowance Reforms 67
See page 5, House of Commons (2011) Disability Living Allowance Reform. http://www.parliament.uk/briefing-
papers/SN05869 68
DWP(2012) Personal Independence Payments: Reassessments and Impacts
http://webarchive.nationalarchives.gov.uk/+/http:/dwp.gov.uk/docs/pip-reassessments-and-impacts.pdf
77
cent) claimants will experience a reduction in their award, the same amount will
experience an increased award and the remainder will experience no change.
There are potentially other knock on effects to other benefits as a result of the changes. In
May 2011, approximately 700,000 working age DLA claimants are also entitled to
premia in income-related benefits. This is the equivalent of 34 per cent of all working age
DLA claimants, the majority of whom will receive premia for IS or IB. Although the Impact
Assessment69 assumes that the level of expenditure will remain the same after the PIP is
introduced, it does expect there will be caseload movement as DLA claimants are migrated
to the new benefit. Approximately a quarter of a million (or 13 per cent of) working age
DLA claims also have a Carer's Allowance claim linked to their claim. Two-thirds of
those receiving the Carer's Allowance are women and therefore those affected by changes
in entitlement to Carer's Allowance linked to a working age DLA claim are more likely to be
women.70
Impact of DLA reforms in Hampshire
In February 2013 there were 69,690 DLA claimants in Hampshire of whom 44,970 are of
working age (65 per cent). The DWP impact assessment estimates that savings of £1,500m
per year will be made by the time all working age claimants have been moved over to the
new PIP system in 2017/18.
Table 8.171 below is again based on the Hitting the Poorest Places Hardest report but
updated to include the revised estimates of the number of claimants adversely affected by
the change from DLA to PIP. The local estimates of the number of claimants affected and
the resultant financial loss is allocated on the basis of the working age DLA claimants across
Hampshire relative to the national distribution of claimants. Unsurprisingly, in terms of
absolute numbers, the larger districts of Portsmouth and Southampton are the worst affected
areas. Hart, which invariably emerges "top" in terms of the national distribution of disability
and health-related benefits in the UK, has just 600 adversely affected DLA claimants.
In terms of the financial loss to the local economy however, Havant emerges as the biggest
loser where the monetary impact amounts to a loss of £40 per year per working age adult in
the district. This is slightly higher than the equivalent amounts for Portsmouth (£33),
Gosport (£35) and Southampton (£37). The reforms to DLA result in a not insignificant loss
to the Hampshire economy as a whole of £33m per year, with a third of that figure accounted
for by Portsmouth and Southampton.
69
DWP (2012) Disability Living Allowance Reform: Impact Assessment. https://www.gov.uk/government/uploads/system/uploads/attachment_data/file/220176/dla-reform-wr2011-ia.pdf 70
DWP (2012) Disability Living Allowance Reform: Equality Impact Assessment. https://www.gov.uk/government/uploads/system/uploads/attachment_data/file/220151/eia-dla-reform-wr2011.pdf 71
In the present report the figures on the numbers of individuals adversely affected by the DLA reforms include those experiencing a reduction in payment which is now available from the Revised Impact Assessment. These figures differ from those published in the Hitting the Poorest Places Hardest report, which only referred to complete loss of entitlement. The statistics on overall financial losses are however comparable.
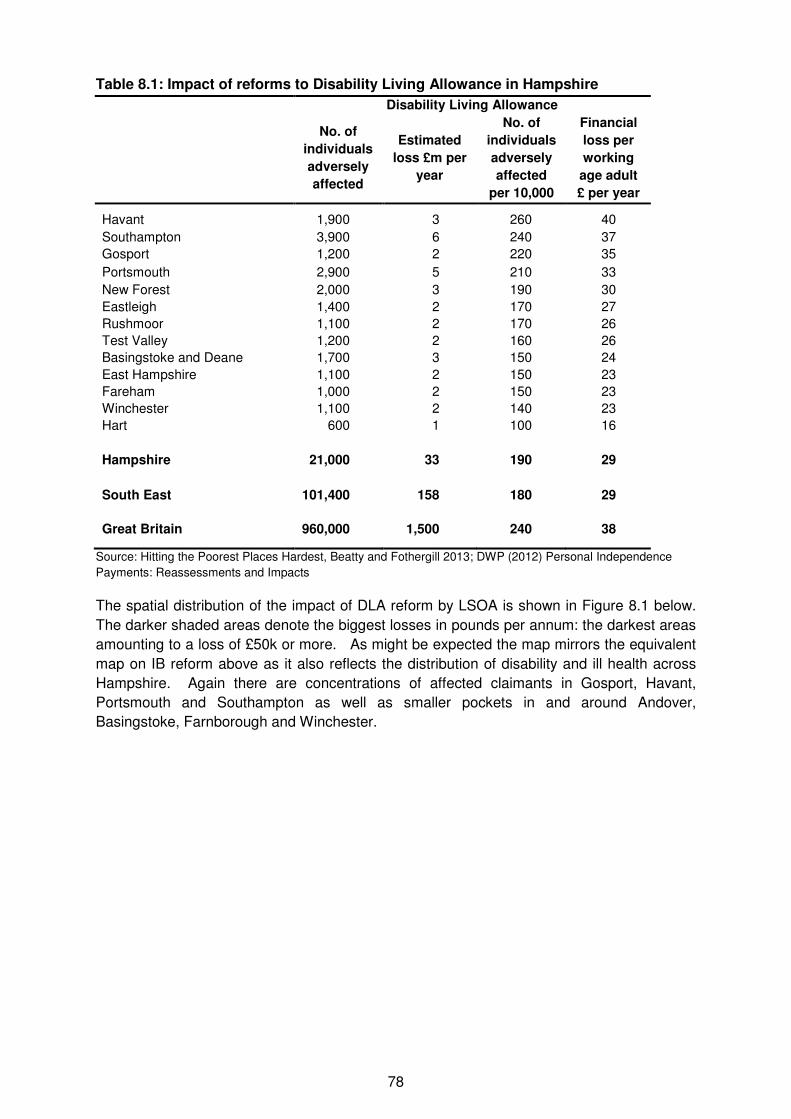
78
Table 8.1: Impact of reforms to Disability Living Allowance in Hampshire
Disability Living Allowance
No. of
individuals
adversely
affected
Estimated
loss £m per
year
No. of
individuals
adversely
affected
per 10,000
Financial
loss per
working
age adult
£ per year
Havant 1,900 3 260 40
Southampton 3,900 6 240 37
Gosport 1,200 2 220 35
Portsmouth 2,900 5 210 33
New Forest 2,000 3 190 30
Eastleigh 1,400 2 170 27
Rushmoor 1,100 2 170 26
Test Valley 1,200 2 160 26
Basingstoke and Deane 1,700 3 150 24
East Hampshire 1,100 2 150 23
Fareham 1,000 2 150 23
Winchester 1,100 2 140 23
Hart 600 1 100 16
Hampshire 21,000 33 190 29
South East 101,400 158 180 29
Great Britain 960,000 1,500 240 38
Source: Hitting the Poorest Places Hardest, Beatty and Fothergill 2013; DWP (2012) Personal Independence
Payments: Reassessments and Impacts
The spatial distribution of the impact of DLA reform by LSOA is shown in Figure 8.1 below.
The darker shaded areas denote the biggest losses in pounds per annum: the darkest areas
amounting to a loss of £50k or more. As might be expected the map mirrors the equivalent
map on IB reform above as it also reflects the distribution of disability and ill health across
Hampshire. Again there are concentrations of affected claimants in Gosport, Havant,
Portsmouth and Southampton as well as smaller pockets in and around Andover,
Basingstoke, Farnborough and Winchester.
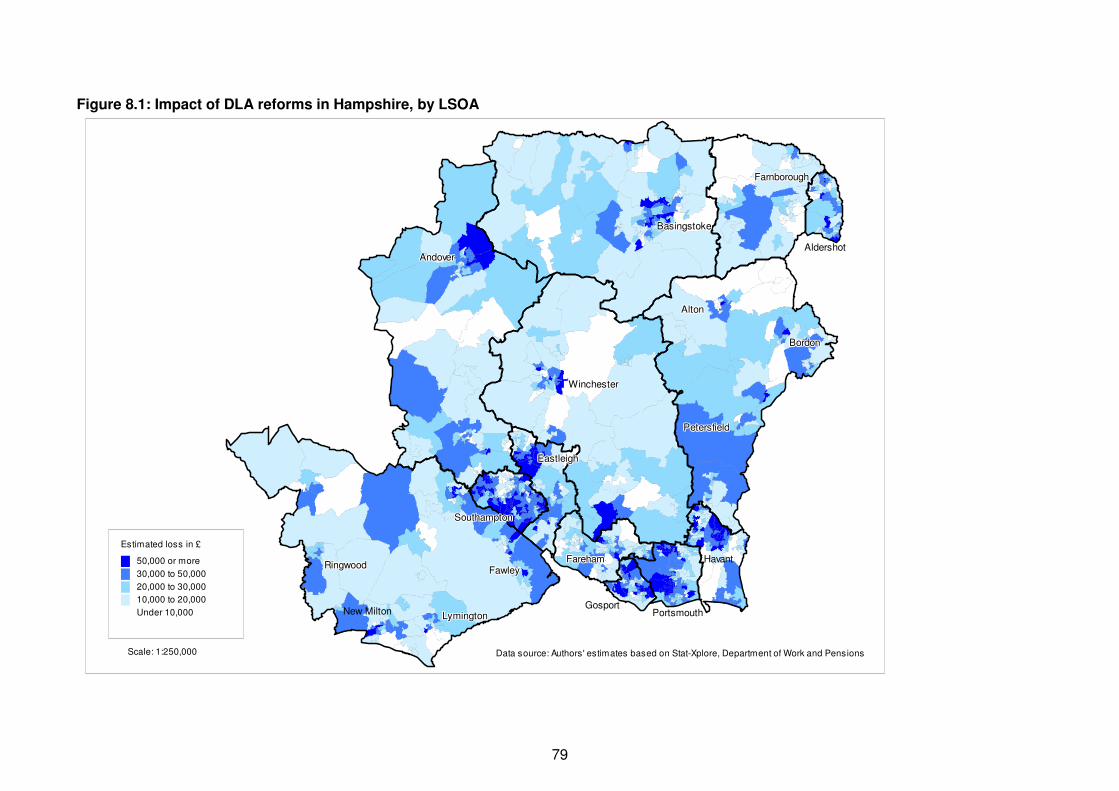
79
Figure 8.1: Impact of DLA reforms in Hampshire, by LSOA
Estimated loss in £
50,000 or more
30,000 to 50,000
20,000 to 30,000
10,000 to 20,000
Under 10,000
Scale: 1:250,000 Data source: Authors' estimates based on Stat-Xplore, Department of Work and Pensions
New Milton LymingtonLymingtonLymingtonLymingtonLymingtonLymingtonLymingtonLymingtonLymington
FawleyFawleyFawleyFawleyFawleyFawleyFawleyFawleyFawley
BasingstokeBasingstokeBasingstokeBasingstokeBasingstokeBasingstokeBasingstokeBasingstokeBasingstoke
Havant
AndoverAndoverAndoverAndoverAndoverAndoverAndoverAndoverAndover
EastleighEastleighEastleighEastleighEastleighEastleighEastleighEastleighEastleigh
SouthamptonSouthamptonSouthamptonSouthamptonSouthamptonSouthamptonSouthamptonSouthamptonSouthampton
FarehamFarehamFarehamFarehamFarehamFarehamFarehamFarehamFareham
PortsmouthPortsmouthPortsmouthPortsmouthPortsmouthPortsmouthPortsmouthPortsmouthPortsmouthGosportGosportGosportGosportGosportGosportGosportGosportGosport
FarnboroughFarnboroughFarnboroughFarnboroughFarnboroughFarnboroughFarnboroughFarnboroughFarnborough
AldershotAldershotAldershotAldershotAldershotAldershotAldershotAldershotAldershot
AltonAltonAltonAltonAltonAltonAltonAltonAlton
PetersfieldPetersfieldPetersfieldPetersfieldPetersfieldPetersfieldPetersfieldPetersfieldPetersfield
BordonBordonBordonBordonBordonBordonBordonBordonBordon
WinchesterWinchesterWinchesterWinchesterWinchesterWinchesterWinchesterWinchesterWinchester
RingwoodRingwoodRingwoodRingwoodRingwoodRingwoodRingwoodRingwoodRingwood

80
Summary
• DLA reform involves its replacement by Personal Independence Payments (PIP)
as the basis for financial support to help offset the additional costs faced by
individuals with disabilities. PIP also entails more stringent and frequent
medical tests for claimants
• the changes a have a significant impact in Hampshire affecting 21,000
individuals and amount to a loss to the local economy of £33m per annum
• the impact of DLA changes in the context of wider welfare reform is similar to
that of LHA - both accounting for 8 per cent of the total impact
• the impact across Hampshire mirrors that of the IB reforms with concentrations
in districts with a greater legacy of heavy industry and manufacturing
• DLA changes are particularly problematic given previous discussion of the
cumulative impact of the range of measures. While DLA is meant for the
additional costs of living and mobility for individuals with disabilities, recent
evidence suggests that it is often used for other essential items in the face of
financial pressures.72 DLA is increasingly used by recipients for items such as
food, heating and meeting rental payments as incomes are squeezed. A
reduction or loss in payment could therefore have dire consequences for
claimants on low-incomes.
72
See Beatty, C., Brewer, M., Browne, J., Cole, I., Crisp, R., Emmerson, C., Joyce, R., Kemp, P. A., Pereira, I.
and Powell, R. (2013) Monitoring the Impact of Changes to the Local Housing Allowance System of Housing
Benefit: Interim Report (Research Report No. 838). London: DWP
81
9HMRC reforms and up-rating
of benefits
Introduction
There are three further major reforms which have been introduced which are discussed in
this chapter. The first concerns multiple changes to the Tax Credits (TC) system which is
administered by HMRC rather than DWP. The changes, which affect large numbers of
families on low and middle incomes, were announced in the 2010 Emergency Budget and
Spending Review. These changes affect many families in work as well as those on out-of-
work benefits. The second major reform concerns the level at which working age benefits
are up-rated by and was announced in the 2012 Autumn Statement. This required separate
legislation which was passed through parliament as the Welfare Benefits Up-rating Act in
March 2013. It restricted increases in most working age benefits to one per cent for three
years from April 2013. The third reforms to be discussed in this chapter are the changes to
Child Benefit (CB) which are also administered by HMRC. The changes include freezing
the rate at which CB is paid for all claimants from 2011/12 for three years and withdrawal of
CB from January 2012.
Overview of Tax Credit reforms
Child Tax Credit (CTC) and Working Tax Credit (WTC) were introduced via the tax system in
2003 for households on low incomes with the aim of tackling child poverty and making work
pay. The CTC is available for families who are on low incomes, with children under the age
of 20 who are still in full-time tertiary education or training and is available to those in work or
out-of-work. The WTC supports people in work (including the self-employed) by topping up
low to modest incomes. In December 2012 there were 4.51 million families claiming TCs
and 2011/12 projected expenditure on TCs in Great Britain was estimated at £31.7 billion
before the reforms were introduced.
In the 2010 Emergency Budget there were ten separate measures announced which affect
both the WTC and CTC rules and regulations.73 Further announcements of changes to the
system were made in the subsequent 2010 Spending Review and 2011 Autumn Statement.
The changes affect the thresholds, withdrawal rates, supplements, income disregards,
backdating provisions, reductions in the payable costs through the childcare element from 80
to 70 per cent, indexation and up-rating from 2011/12 onwards. The changes mean that
from April 2012, to receive TCs most families with one child would need to
73
For the full regulations see: HMRC (2013) Child Tax Credit and Working Family Tax Credit: An
Introduction.
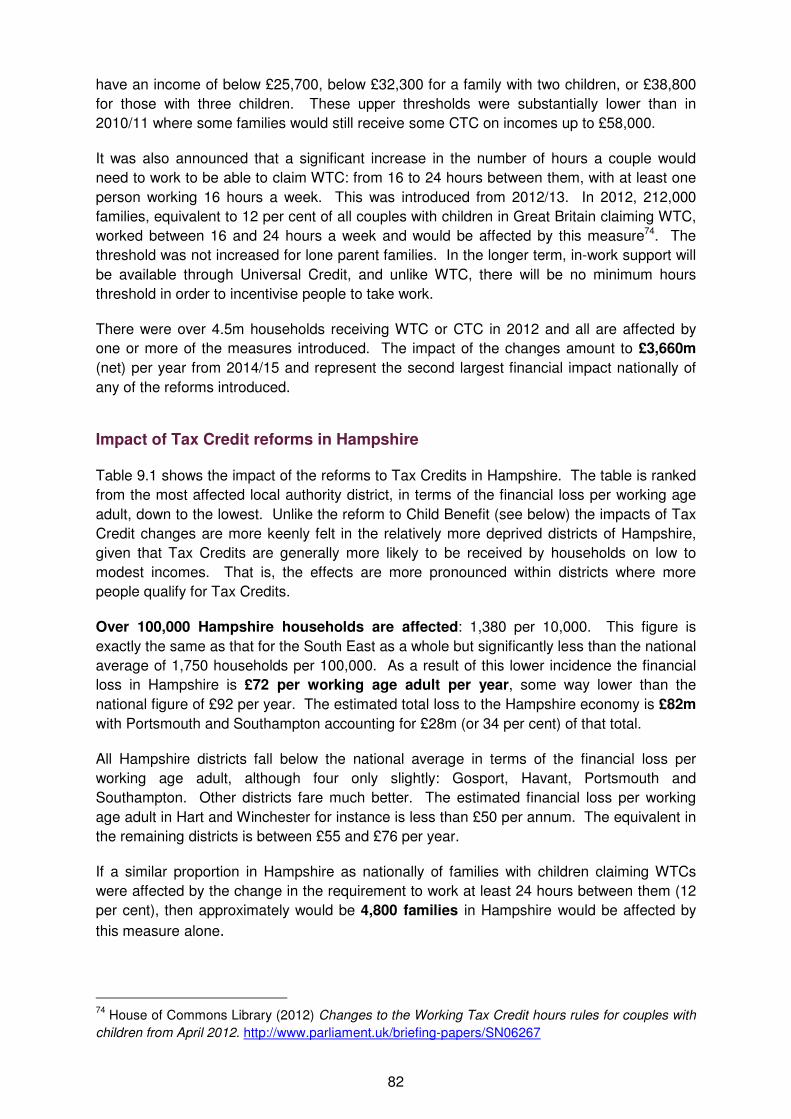
82
have an income of below £25,700, below £32,300 for a family with two children, or £38,800
for those with three children. These upper thresholds were substantially lower than in
2010/11 where some families would still receive some CTC on incomes up to £58,000.
It was also announced that a significant increase in the number of hours a couple would
need to work to be able to claim WTC: from 16 to 24 hours between them, with at least one
person working 16 hours a week. This was introduced from 2012/13. In 2012, 212,000
families, equivalent to 12 per cent of all couples with children in Great Britain claiming WTC,
worked between 16 and 24 hours a week and would be affected by this measure74. The
threshold was not increased for lone parent families. In the longer term, in-work support will
be available through Universal Credit, and unlike WTC, there will be no minimum hours
threshold in order to incentivise people to take work.
There were over 4.5m households receiving WTC or CTC in 2012 and all are affected by
one or more of the measures introduced. The impact of the changes amount to £3,660m
(net) per year from 2014/15 and represent the second largest financial impact nationally of
any of the reforms introduced.
Impact of Tax Credit reforms in Hampshire
Table 9.1 shows the impact of the reforms to Tax Credits in Hampshire. The table is ranked
from the most affected local authority district, in terms of the financial loss per working age
adult, down to the lowest. Unlike the reform to Child Benefit (see below) the impacts of Tax
Credit changes are more keenly felt in the relatively more deprived districts of Hampshire,
given that Tax Credits are generally more likely to be received by households on low to
modest incomes. That is, the effects are more pronounced within districts where more
people qualify for Tax Credits.
Over 100,000 Hampshire households are affected: 1,380 per 10,000. This figure is
exactly the same as that for the South East as a whole but significantly less than the national
average of 1,750 households per 100,000. As a result of this lower incidence the financial
loss in Hampshire is £72 per working age adult per year, some way lower than the
national figure of £92 per year. The estimated total loss to the Hampshire economy is £82m
with Portsmouth and Southampton accounting for £28m (or 34 per cent) of that total.
All Hampshire districts fall below the national average in terms of the financial loss per
working age adult, although four only slightly: Gosport, Havant, Portsmouth and
Southampton. Other districts fare much better. The estimated financial loss per working
age adult in Hart and Winchester for instance is less than £50 per annum. The equivalent in
the remaining districts is between £55 and £76 per year.
If a similar proportion in Hampshire as nationally of families with children claiming WTCs
were affected by the change in the requirement to work at least 24 hours between them (12
per cent), then approximately would be 4,800 families in Hampshire would be affected by
this measure alone.
74
House of Commons Library (2012) Changes to the Working Tax Credit hours rules for couples with
children from April 2012. http://www.parliament.uk/briefing-papers/SN06267
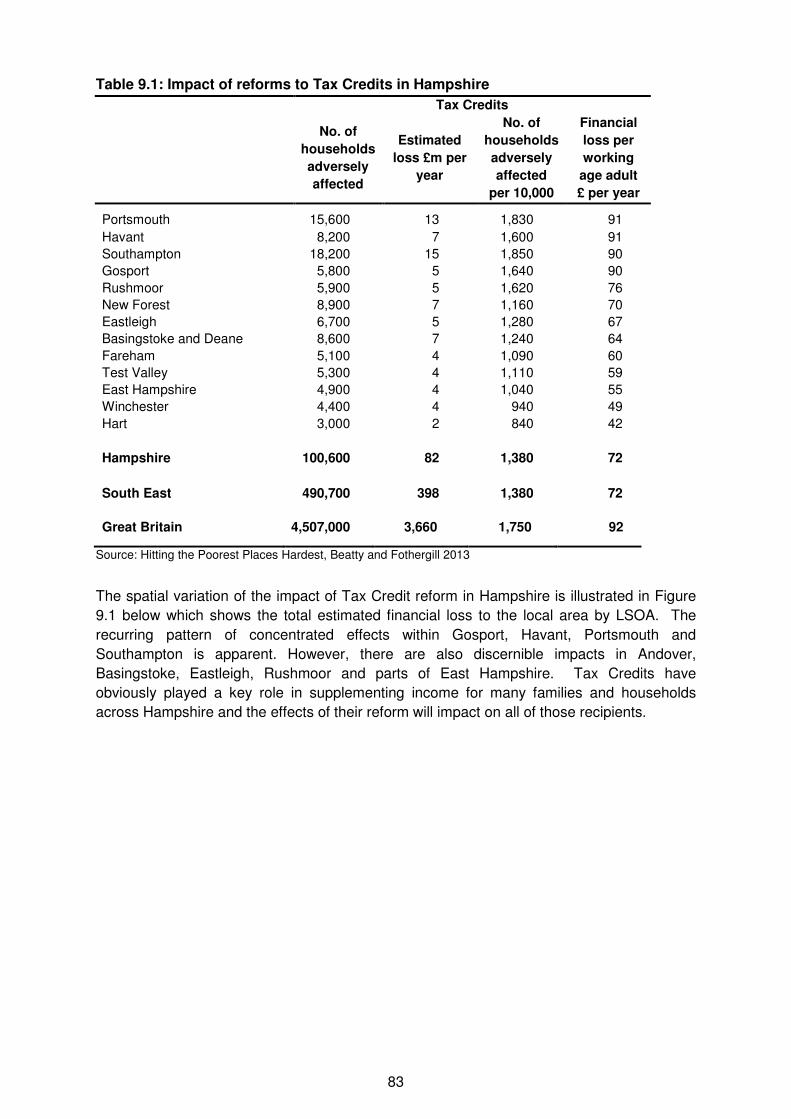
83
Table 9.1: Impact of reforms to Tax Credits in Hampshire
Tax Credits
No. of
households
adversely
affected
Estimated
loss £m per
year
No. of
households
adversely
affected
per 10,000
Financial
loss per
working
age adult
£ per year
Portsmouth 15,600 13 1,830 91
Havant 8,200 7 1,600 91
Southampton 18,200 15 1,850 90
Gosport 5,800 5 1,640 90
Rushmoor 5,900 5 1,620 76
New Forest 8,900 7 1,160 70
Eastleigh 6,700 5 1,280 67
Basingstoke and Deane 8,600 7 1,240 64
Fareham 5,100 4 1,090 60
Test Valley 5,300 4 1,110 59
East Hampshire 4,900 4 1,040 55
Winchester 4,400 4 940 49
Hart 3,000 2 840 42
Hampshire 100,600 82 1,380 72
South East 490,700 398 1,380 72
Great Britain 4,507,000 3,660 1,750 92
Source: Hitting the Poorest Places Hardest, Beatty and Fothergill 2013
The spatial variation of the impact of Tax Credit reform in Hampshire is illustrated in Figure
9.1 below which shows the total estimated financial loss to the local area by LSOA. The
recurring pattern of concentrated effects within Gosport, Havant, Portsmouth and
Southampton is apparent. However, there are also discernible impacts in Andover,
Basingstoke, Eastleigh, Rushmoor and parts of East Hampshire. Tax Credits have
obviously played a key role in supplementing income for many families and households
across Hampshire and the effects of their reform will impact on all of those recipients.
84
Figure 9.1: Impact of Tax Credits reforms in Hampshire, by LSOA
Estimated Loss in £
100,000 or more
80,000 to 100,000
60,000 to 80,000
40,000 to 60,000
Less than 40,000
Scale: 1:250,000Data source: Authors' estimates based on ONS Neighbourhood Statistics
New Milton LymingtonLymingtonLymingtonLymingtonLymingtonLymingtonLymingtonLymingtonLymington
FawleyFawleyFawleyFawleyFawleyFawleyFawleyFawleyFawley
BasingstokeBasingstokeBasingstokeBasingstokeBasingstokeBasingstokeBasingstokeBasingstokeBasingstoke
Havant
AndoverAndoverAndoverAndoverAndoverAndoverAndoverAndoverAndover
EastleighEastleighEastleighEastleighEastleighEastleighEastleighEastleighEastleigh
SouthamptonSouthamptonSouthamptonSouthamptonSouthamptonSouthamptonSouthamptonSouthamptonSouthampton
FarehamFarehamFarehamFarehamFarehamFarehamFarehamFarehamFareham
PortsmouthPortsmouthPortsmouthPortsmouthPortsmouthPortsmouthPortsmouthPortsmouthPortsmouthGosportGosportGosportGosportGosportGosportGosportGosportGosport
FarnboroughFarnboroughFarnboroughFarnboroughFarnboroughFarnboroughFarnboroughFarnboroughFarnborough
AldershotAldershotAldershotAldershotAldershotAldershotAldershotAldershotAldershot
AltonAltonAltonAltonAltonAltonAltonAltonAlton
PetersfieldPetersfieldPetersfieldPetersfieldPetersfieldPetersfieldPetersfieldPetersfieldPetersfield
BordonBordonBordonBordonBordonBordonBordonBordonBordon
WinchesterWinchesterWinchesterWinchesterWinchesterWinchesterWinchesterWinchesterWinchester
RingwoodRingwoodRingwoodRingwoodRingwoodRingwoodRingwoodRingwoodRingwood
85
Overview of Child Benefit reforms
Child Benefit was introduced in 1979 as a non-taxable, universal benefit for families with
children. Total expenditure on CB in 2010/11 was £12 billion and in 2012 approximately 7.9
million families in Great Britain were in receipt of CB which is worth £20.30 a week for the
eldest eligible child and £13.20 a week for each subsequent child. In the 2010 Emergency
Budget it was announced that the CB would be frozen for three years from 2011/12. The
financial loss arising from this freeze is £975m per year by 2014/15. In addition, a major
change to the benefit was announced by the Chancellor at the Conservative Party
Conference in October 2012: that CB would be removed for families with a higher rate tax
payer.75 The measure was controversial on a number of levels: it abandoned the idea of
universality for this family benefit; there were major issues about operationalising and
policing the system; a dual earner couple both earning under the higher rate tax threshold
could keep their CB whilst a single earner or lone parent household just above the threshold
would lose all of theirs; and a "cliff edge" was created where falling £1 the wrong side of the
threshold resulted in the loss of all CB, which in turn creates disincentives to take work paid
above the higher tax rate threshold.
In the 2012 Budget the Government announced that the original plans were to be revised in
the form of a "high income Child Benefit charge" which was introduced from 7th January
2013. The threshold for losing any CB was raised from the higher tax rate threshold
(approximately £43,000) to those where at least one person in a household receiving CB
earns £50,000 or above. The charge will be one per cent for every £100 of income in
excess of £50,000. In practice this means a household with an earner receiving £50,000
can keep all their CB, a household with and earner on £55,000 has to pay back half their CB
and a household with an earner on £60,000 or more will lose all their CB. The charge is
collected through Self Assessment and PAYE with an estimated additional 500,000
individuals having to complete Self Assessment as a consequence of the measure. It is
estimated by HM Treasury that the financial loss arising from this reform will amount to
£1,870 million per year by 2014/15.
The HMRC Impact Assessment76 for the removal of CB from households with a higher
income earner estimates that:
• 1.2 million families will be affected by the reforms; 16 per cent of all claimants
• 790,000 (67 per cent) of these will be couples who lose the full amount of CB
• 30,000 (3 per cent) of these will be lone parents who lose the full amount of CB
• 330,000 (28 per cent) of these will be couples who lose a portion of CB
• 20,000 (2 per cent) of these will be lone parents who lose a portion of CB.
75
House of Commons Library (2012) Child Benefit for higher income families. Standard Note SN06299.
http://www.parliament.uk/briefing-papers/SN06299 76
HMRC (2012) Child Benefit: Income Tax Charge for Those on Higher Incomes.
http://www.hmrc.gov.uk/budget2012/tiin-0620.pdf
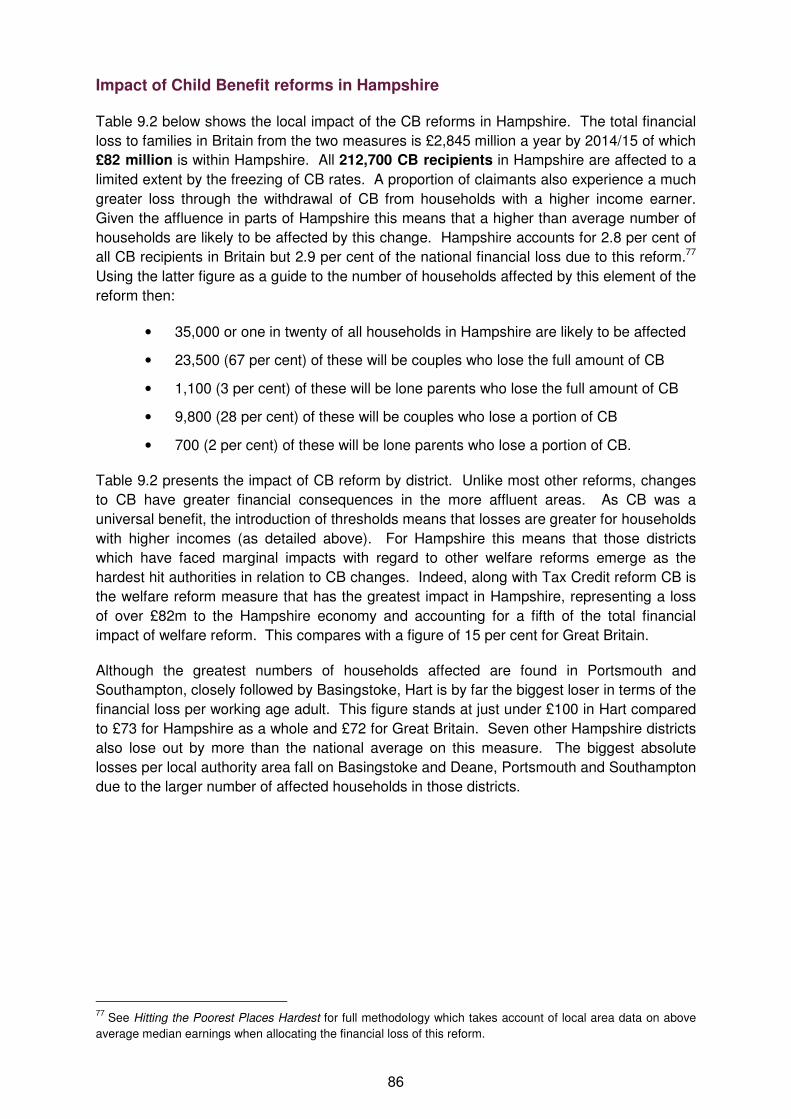
86
Impact of Child Benefit reforms in Hampshire
Table 9.2 below shows the local impact of the CB reforms in Hampshire. The total financial
loss to families in Britain from the two measures is £2,845 million a year by 2014/15 of which
£82 million is within Hampshire. All 212,700 CB recipients in Hampshire are affected to a
limited extent by the freezing of CB rates. A proportion of claimants also experience a much
greater loss through the withdrawal of CB from households with a higher income earner.
Given the affluence in parts of Hampshire this means that a higher than average number of
households are likely to be affected by this change. Hampshire accounts for 2.8 per cent of
all CB recipients in Britain but 2.9 per cent of the national financial loss due to this reform.77
Using the latter figure as a guide to the number of households affected by this element of the
reform then:
• 35,000 or one in twenty of all households in Hampshire are likely to be affected
• 23,500 (67 per cent) of these will be couples who lose the full amount of CB
• 1,100 (3 per cent) of these will be lone parents who lose the full amount of CB
• 9,800 (28 per cent) of these will be couples who lose a portion of CB
• 700 (2 per cent) of these will be lone parents who lose a portion of CB.
Table 9.2 presents the impact of CB reform by district. Unlike most other reforms, changes
to CB have greater financial consequences in the more affluent areas. As CB was a
universal benefit, the introduction of thresholds means that losses are greater for households
with higher incomes (as detailed above). For Hampshire this means that those districts
which have faced marginal impacts with regard to other welfare reforms emerge as the
hardest hit authorities in relation to CB changes. Indeed, along with Tax Credit reform CB is
the welfare reform measure that has the greatest impact in Hampshire, representing a loss
of over £82m to the Hampshire economy and accounting for a fifth of the total financial
impact of welfare reform. This compares with a figure of 15 per cent for Great Britain.
Although the greatest numbers of households affected are found in Portsmouth and
Southampton, closely followed by Basingstoke, Hart is by far the biggest loser in terms of the
financial loss per working age adult. This figure stands at just under £100 in Hart compared
to £73 for Hampshire as a whole and £72 for Great Britain. Seven other Hampshire districts
also lose out by more than the national average on this measure. The biggest absolute
losses per local authority area fall on Basingstoke and Deane, Portsmouth and Southampton
due to the larger number of affected households in those districts.
77
See Hitting the Poorest Places Hardest for full methodology which takes account of local area data on above
average median earnings when allocating the financial loss of this reform.
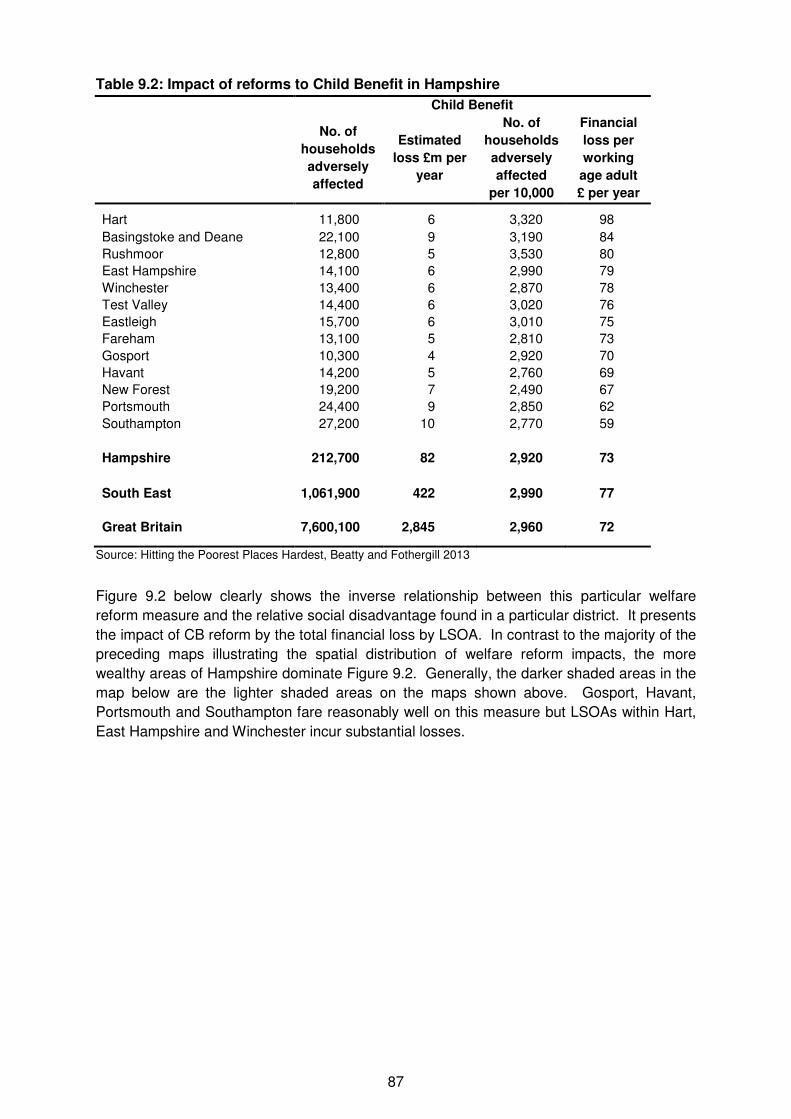
87
Table 9.2: Impact of reforms to Child Benefit in Hampshire
Child Benefit
No. of
households
adversely
affected
Estimated
loss £m per
year
No. of
households
adversely
affected
per 10,000
Financial
loss per
working
age adult
£ per year
Hart 11,800 6 3,320 98
Basingstoke and Deane 22,100 9 3,190 84
Rushmoor 12,800 5 3,530 80
East Hampshire 14,100 6 2,990 79
Winchester 13,400 6 2,870 78
Test Valley 14,400 6 3,020 76
Eastleigh 15,700 6 3,010 75
Fareham 13,100 5 2,810 73
Gosport 10,300 4 2,920 70
Havant 14,200 5 2,760 69
New Forest 19,200 7 2,490 67
Portsmouth 24,400 9 2,850 62
Southampton 27,200 10 2,770 59
Hampshire 212,700 82 2,920 73
South East 1,061,900 422 2,990 77
Great Britain 7,600,100 2,845 2,960 72
Source: Hitting the Poorest Places Hardest, Beatty and Fothergill 2013
Figure 9.2 below clearly shows the inverse relationship between this particular welfare
reform measure and the relative social disadvantage found in a particular district. It presents
the impact of CB reform by the total financial loss by LSOA. In contrast to the majority of the
preceding maps illustrating the spatial distribution of welfare reform impacts, the more
wealthy areas of Hampshire dominate Figure 9.2. Generally, the darker shaded areas in the
map below are the lighter shaded areas on the maps shown above. Gosport, Havant,
Portsmouth and Southampton fare reasonably well on this measure but LSOAs within Hart,
East Hampshire and Winchester incur substantial losses.
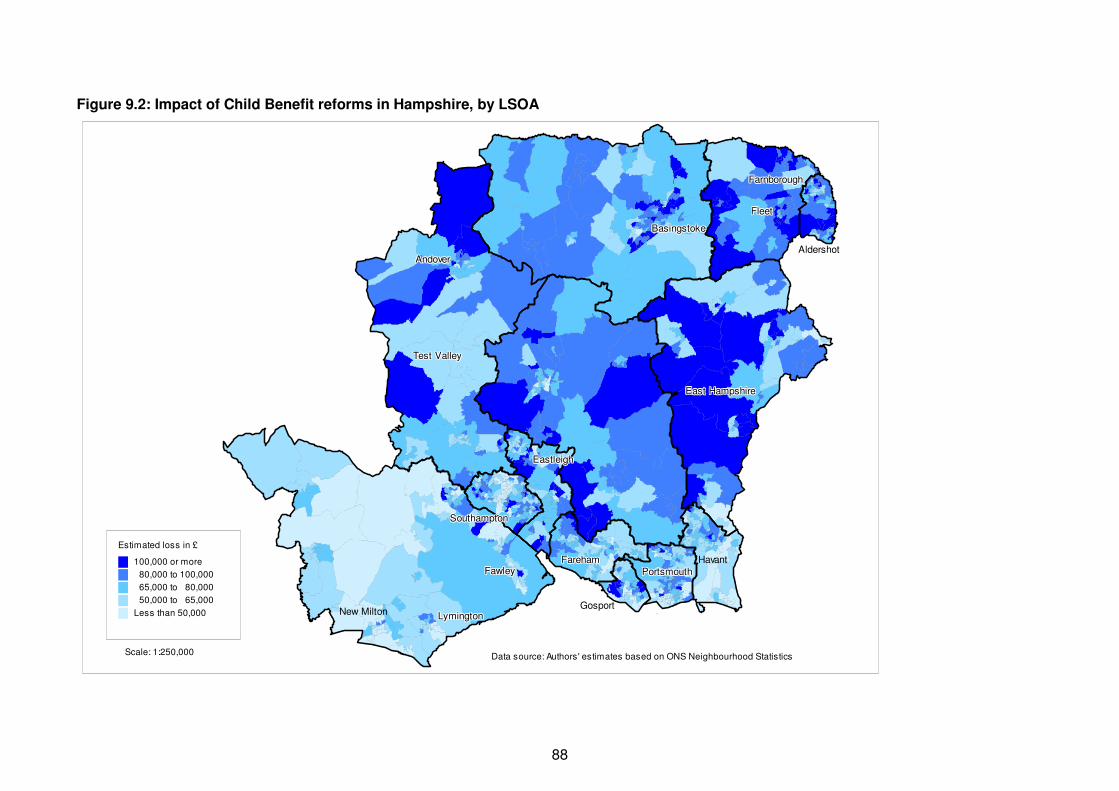
88
Figure 9.2: Impact of Child Benefit reforms in Hampshire, by LSOA
Estimated loss in £
100,000 or more
80,000 to 100,000
65,000 to 80,000
50,000 to 65,000
Less than 50,000
Scale: 1:250,000Data source: Authors' estimates based on ONS Neighbourhood Statistics
New Milton LymingtonLymingtonLymingtonLymingtonLymingtonLymingtonLymingtonLymingtonLymington
FawleyFawleyFawleyFawleyFawleyFawleyFawleyFawleyFawley
BasingstokeBasingstokeBasingstokeBasingstokeBasingstokeBasingstokeBasingstokeBasingstokeBasingstoke
Havant
East HampshireEast HampshireEast HampshireEast HampshireEast HampshireEast HampshireEast HampshireEast HampshireEast Hampshire
AndoverAndoverAndoverAndoverAndoverAndoverAndoverAndoverAndover
Test ValleyTest ValleyTest ValleyTest ValleyTest ValleyTest ValleyTest ValleyTest ValleyTest Valley
EastleighEastleighEastleighEastleighEastleighEastleighEastleighEastleighEastleigh
SouthamptonSouthamptonSouthamptonSouthamptonSouthamptonSouthamptonSouthamptonSouthamptonSouthampton
FarehamFarehamFarehamFarehamFarehamFarehamFarehamFarehamFarehamPortsmouthPortsmouthPortsmouthPortsmouthPortsmouthPortsmouthPortsmouthPortsmouthPortsmouth
GosportGosportGosportGosportGosportGosportGosportGosportGosport
FleetFleetFleetFleetFleetFleetFleetFleetFleet
FarnboroughFarnboroughFarnboroughFarnboroughFarnboroughFarnboroughFarnboroughFarnboroughFarnborough
AldershotAldershotAldershotAldershotAldershotAldershotAldershotAldershotAldershot
89
The one per cent up-rating of working age welfare benefits
In the 2010 Emergency Budget the government announced that the method for up-rating
public sector pensions, benefits and tax credits would change from 2011/12 to the Consumer
Price Index (CPI). Previously pensions and non-means tested benefits had been uprated in
line with the Retail Price Index (RPI) and means tested benefits had been uprated in line
with the 'Rossi' index (which is the RPI minus certain housing costs). At the same time it
was announced that a "triple guarantee" would ensure basic state pension would be
increased in line with earnings, prices (in line with the CPI) or 2.5 per cent; whichever
benchmark was highest. The move to using CPI as the main indexation tool for benefits
reduced expenditure for the government as CPI tends to be lower than RPI. In 2012
average earnings had increased by 1.6 per cent, CPI by 2.2 per cent, RPI by 2.6 per cent
and the Rossi index by 2.8 per cent78. It is not possible from the Treasury figures in the
Budget to estimate the proportion of the overall savings resulting from to the move to CPI
(which includes public sector pensions) that are due to the welfare benefits bill alone.
In the 2012 Autumn Statement the Chancellor announced that because of the continuing
difficult prevailing economic circumstances rather than up-rating the majority of working age
benefits and tax credits in line with CPI, up-rating would be limited to a one per cent increase
for three years from 2013/14 to 2015/16. At that time CPI was 2.2 per cent and forecast to
rise to 2.6 per cent the following year. Child Benefit had already been frozen and LHA set at
the CPI for 2013/14 and so the one per cent up-rating would not apply to these benefits until
2014/15. There were also certain exceptions in relation to some disability benefits and the
one per cent up-rating would not apply premia for disability, carers, the support group within
ESA, or disability elements for tax credits. The government passed primary legislation in the
form of the Welfare Benefits Up-rating Act 2013 in March 2013 in order to implement the
changes from 2014/15.79
The one per cent up-rating of working age benefits will result in a financial loss to claimants
nationally of £3,340million a year by 2015/16. The government Impact Assessment80
estimates that approximately 9.6million or 30 per cent of all households in Britain will be
affected on average by £3 a week. The change will have a bigger effect on those in the
lower deciles of equivalised income where the loss will be between £4 or £5 a week. For
those in the lowest ten per cent income bracket the reduction will be equivalent to a two per
cent reduction in their overall net income. It is estimated that of those affected for working
age households:
• 47 per cent will be couple households with children
• 21 per cent will be lone parents
• 7 per cent will be couple households without children
• 23 per cent will be single person households.
Table 9.3 below shows the impact of the one per cent up-rating measure in Hampshire by
district and benchmarked against the regional and national figures. The table is ranked from
78
House of Commons Library (2012) 2013 Benefit Uprating. Standard note SN/SG 6512.
http://www.parliament.uk/briefing-papers/SN06512 79
The Social Security Benefits Uprating Order 2013 enacted the change in uprating for 2013/14. 80
DWP (2013) Welfare Benefits Up-rating Bill: Impact Assessment.
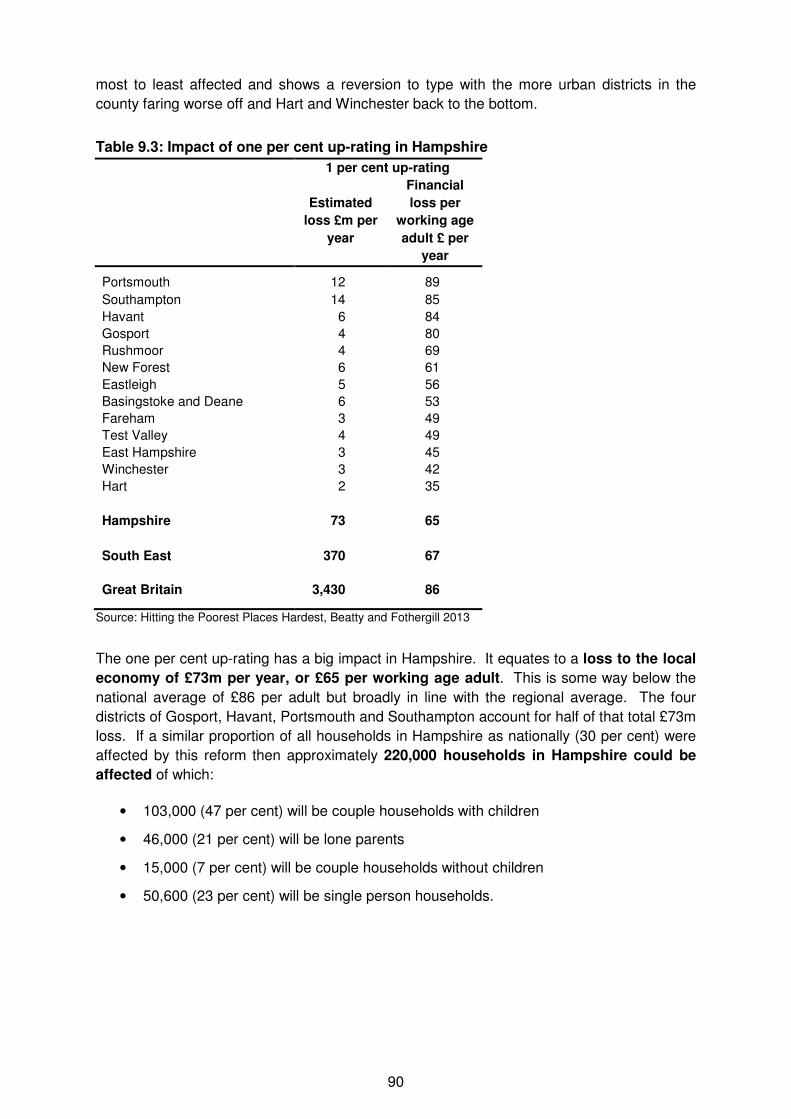
90
most to least affected and shows a reversion to type with the more urban districts in the
county faring worse off and Hart and Winchester back to the bottom.
Table 9.3: Impact of one per cent up-rating in Hampshire
1 per cent up-rating
Estimated
loss £m per
year
Financial
loss per
working age
adult £ per
year
Portsmouth 12 89
Southampton 14 85
Havant 6 84
Gosport 4 80
Rushmoor 4 69
New Forest 6 61
Eastleigh 5 56
Basingstoke and Deane 6 53
Fareham 3 49
Test Valley 4 49
East Hampshire 3 45
Winchester 3 42
Hart 2 35
Hampshire 73 65
South East 370 67
Great Britain 3,430 86
Source: Hitting the Poorest Places Hardest, Beatty and Fothergill 2013
The one per cent up-rating has a big impact in Hampshire. It equates to a loss to the local
economy of £73m per year, or £65 per working age adult. This is some way below the
national average of £86 per adult but broadly in line with the regional average. The four
districts of Gosport, Havant, Portsmouth and Southampton account for half of that total £73m
loss. If a similar proportion of all households in Hampshire as nationally (30 per cent) were
affected by this reform then approximately 220,000 households in Hampshire could be
affected of which:
• 103,000 (47 per cent) will be couple households with children
• 46,000 (21 per cent) will be lone parents
• 15,000 (7 per cent) will be couple households without children
• 50,600 (23 per cent) will be single person households.
91
Summary
Tax Credit reforms
• a raft of changes to Child Tax Credit and Working Families Tax Credit - paid to lower
and middle income households - were introduced including altering thresholds,
withdrawal rates, supplements, income disregards, backdating provisions, reductions
in the payable costs through the childcare element, indexation and up-rating from
2011/12 onwards
• over 100,000 households in Hampshire will be affected to some degree by the
reform of the Tax Credit system resulting in a financial loss to the Hampshire
economy is £82m a year
• the financial loss in Hampshire due to Tax Credits reforms is equivalent to £72 per
working age adult per year
• if families with children claiming WTCs were affected to the same extent as nationally
(12 per cent) by the change in the requirement to work at least 24 hours between
them, then approximately would be 4,800 families in Hampshire would be affected
by this measure alone
• Tax Credits have played a key role in supplementing low income for many families
and households across Hampshire and the effects of their reform will to various
extents impact on all of those recipients.
Child Benefit reforms
• Child Benefit is subject to a three-year freeze, and withdrawal of benefit from
households including a higher earner
• the removal of Child Benefit from households with a high earner has a higher than
average effect in more affluent parts of Hampshire contributing to an overall financial
loss of £82 million a year
• all 212,700 CB recipients in Hampshire are affected to certain extent by the freezing
of CB rates
• an estimated 35,000 or one in twenty of all households in Hampshire are likely to be
affected by the reduction or loss of CB from households with a higher earner and
approximately 25,000 of these will loss all their CB.
The one per cent up-rating of working age welfare benefits
• the annual up-rating of value of most working-age benefits will be restricted to one
per cent for three years from 2013
• this reform accounts for 18 per cent of the overall financial loss to the local economy
from welfare reform, equivalent to £73m per year, or £65 per working age adult
per year
• for those in the lowest ten per cent income bracket the reduction will be equivalent to
a two per cent reduction in their overall net income.
92
10 The overall impact of welfare
reforms in Hampshire
The impacts of welfare reform are very substantial: an estimated £19bn a year will be taken
out of the national economy once all the reforms have been fully implemented; or an
average of £470 a year per adult of working age across the whole of Britain. For some
of the individuals affected by the changes the loss of income is much, much greater. What is
also clear, however, is that the financial losses arising from the reforms will hit some
individuals, households and places much harder than others.
The financial loss in Hampshire, as in much of south and east England outside London, is
comparatively light compared to Britain’s older industrial areas, a number of seaside towns
and some London boroughs which are hit hardest. However, this report has shown that
there is significant variation within Hampshire with certain local authorities and local areas
within those districts hit much harder than others. The scale of the overall combined impact
of the ten reforms considered in this report is shown in Table 10.1. It is estimated that there
will be a loss of £404 million a year in Hampshire when the reforms are fully implemented,
which is a substantial loss of income to residents in the county. This estimate is based on
government national impact assessments, Treasury estimates of savings made and the
distribution of claimants across Hampshire.
The financial loss is equivalent to £360 per year for every working age adult in
Hampshire which is substantially below the national average of £470 per year in Great
Britain. All districts in Hampshire are below the national average. Portsmouth has the
greatest loss, relative to the size of the working age population, equivalent to £450 per
working age adult per year with Southampton, Havant and Gosport not far behind with
between £430 and £440. Hart has the second lowest loss per working age adult of any
district in Great Britain (after the City of London). Winchester and East Hampshire are also
in the bottom 20 districts nationally in terms of the impacts of the reforms relative to the
working age population. In absolute terms, Southampton is hit the hardest of all Hampshire
districts with a loss of £73 million a year, more than five times the amount in Hart although
the working age population in Southampton is only just over three times the size of Hart.
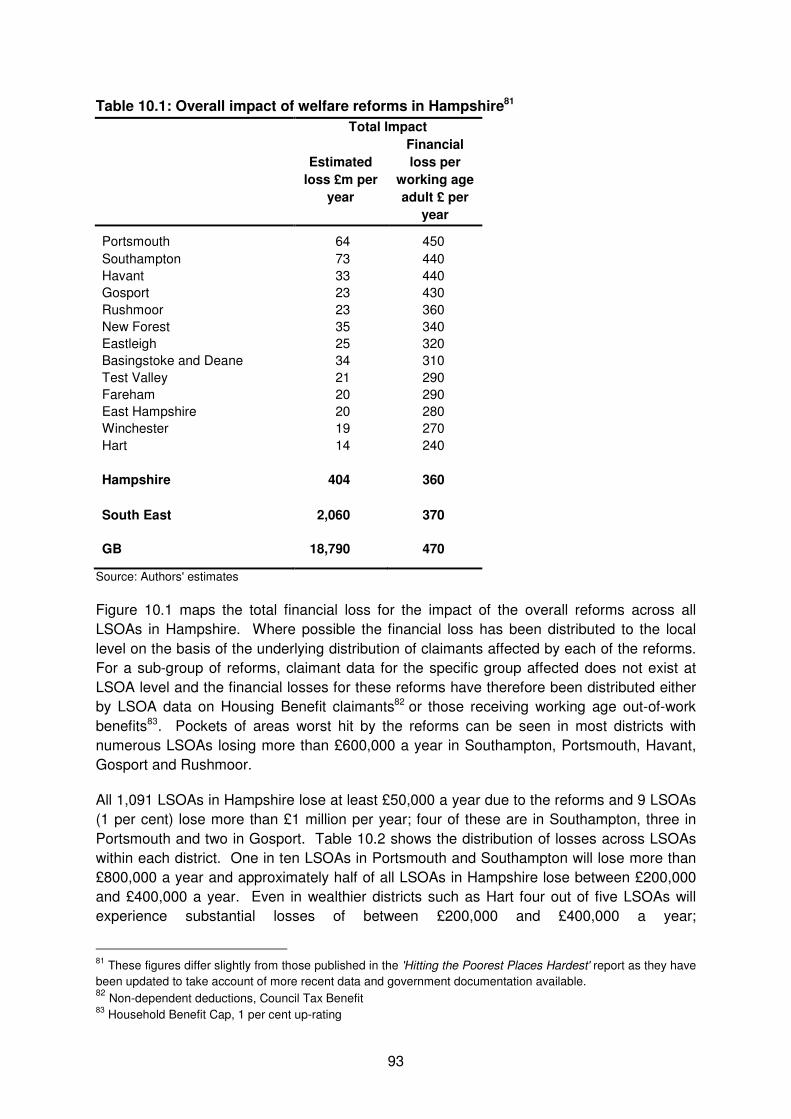
93
Table 10.1: Overall impact of welfare reforms in Hampshire81
Total Impact
Estimated
loss £m per
year
Financial
loss per
working age
adult £ per
year
Portsmouth 64 450
Southampton 73 440
Havant 33 440
Gosport 23 430
Rushmoor 23 360
New Forest 35 340
Eastleigh 25 320
Basingstoke and Deane 34 310
Test Valley 21 290
Fareham 20 290
East Hampshire 20 280
Winchester 19 270
Hart 14 240
Hampshire 404 360
South East 2,060 370
GB 18,790 470
Source: Authors' estimates
Figure 10.1 maps the total financial loss for the impact of the overall reforms across all
LSOAs in Hampshire. Where possible the financial loss has been distributed to the local
level on the basis of the underlying distribution of claimants affected by each of the reforms.
For a sub-group of reforms, claimant data for the specific group affected does not exist at
LSOA level and the financial losses for these reforms have therefore been distributed either
by LSOA data on Housing Benefit claimants82 or those receiving working age out-of-work
benefits83. Pockets of areas worst hit by the reforms can be seen in most districts with
numerous LSOAs losing more than £600,000 a year in Southampton, Portsmouth, Havant,
Gosport and Rushmoor.
All 1,091 LSOAs in Hampshire lose at least £50,000 a year due to the reforms and 9 LSOAs
(1 per cent) lose more than £1 million per year; four of these are in Southampton, three in
Portsmouth and two in Gosport. Table 10.2 shows the distribution of losses across LSOAs
within each district. One in ten LSOAs in Portsmouth and Southampton will lose more than
£800,000 a year and approximately half of all LSOAs in Hampshire lose between £200,000
and £400,000 a year. Even in wealthier districts such as Hart four out of five LSOAs will
experience substantial losses of between £200,000 and £400,000 a year;
81
These figures differ slightly from those published in the 'Hitting the Poorest Places Hardest' report as they have
been updated to take account of more recent data and government documentation available. 82
Non-dependent deductions, Council Tax Benefit 83
Household Benefit Cap, 1 per cent up-rating
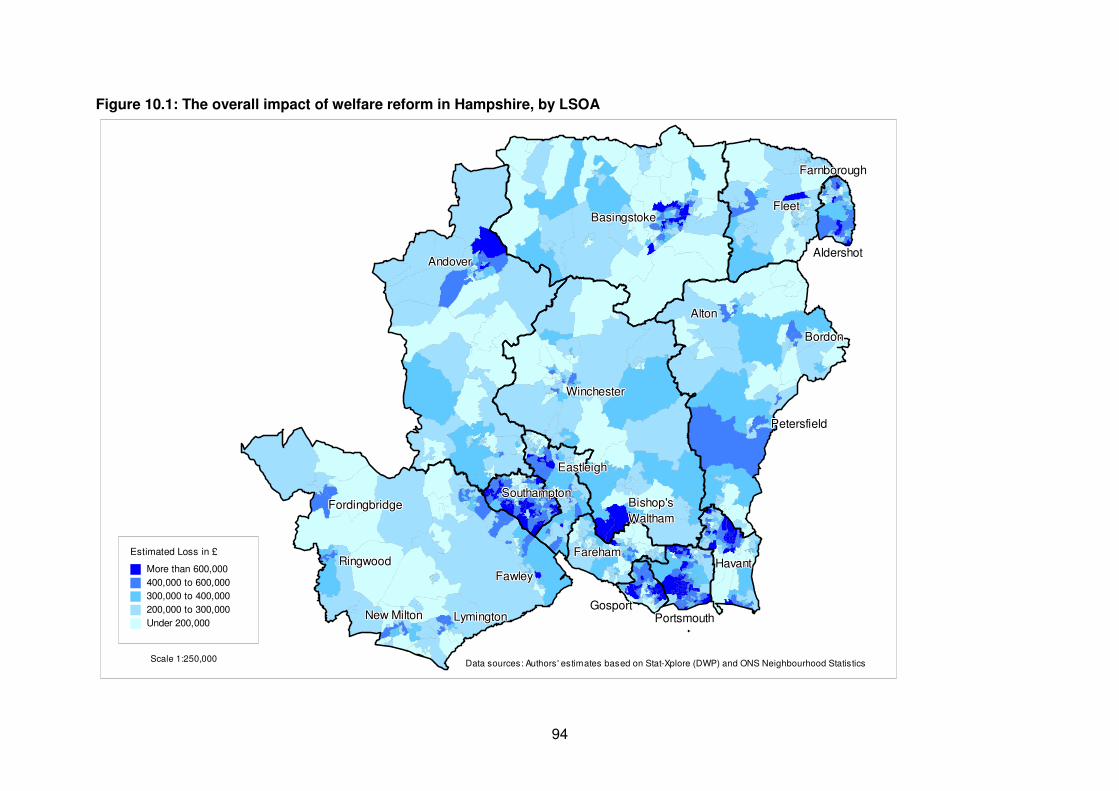
94
Figure 10.1: The overall impact of welfare reform in Hampshire, by LSOA
Estimated Loss in £
More than 600,000
400,000 to 600,000
300,000 to 400,000
200,000 to 300,000
Under 200,000
Scale 1:250,000Data sources: Authors' estimates based on Stat-Xplore (DWP) and ONS Neighbourhood Statistics
AndoverAndoverAndoverAndoverAndoverAndoverAndoverAndoverAndover
BasingstokeBasingstokeBasingstokeBasingstokeBasingstokeBasingstokeBasingstokeBasingstokeBasingstokeFleetFleetFleetFleetFleetFleetFleetFleetFleet
FarnboroughFarnboroughFarnboroughFarnboroughFarnboroughFarnboroughFarnboroughFarnboroughFarnborough
AldershotAldershotAldershotAldershotAldershotAldershotAldershotAldershotAldershot
AltonAltonAltonAltonAltonAltonAltonAltonAlton
BordonBordonBordonBordonBordonBordonBordonBordonBordon
PetersfieldPetersfieldPetersfieldPetersfieldPetersfieldPetersfieldPetersfieldPetersfieldPetersfield
WinchesterWinchesterWinchesterWinchesterWinchesterWinchesterWinchesterWinchesterWinchester
EastleighEastleighEastleighEastleighEastleighEastleighEastleighEastleighEastleigh
FawleyFawleyFawleyFawleyFawleyFawleyFawleyFawleyFawley
RingwoodRingwoodRingwoodRingwoodRingwoodRingwoodRingwoodRingwoodRingwood
New MiltonNew MiltonNew MiltonNew MiltonNew MiltonNew MiltonNew MiltonNew MiltonNew Milton LymingtonLymingtonLymingtonLymingtonLymingtonLymingtonLymingtonLymingtonLymington
FordingbridgeFordingbridgeFordingbridgeFordingbridgeFordingbridgeFordingbridgeFordingbridgeFordingbridgeFordingbridgeSouthamptonSouthamptonSouthamptonSouthamptonSouthamptonSouthamptonSouthamptonSouthamptonSouthampton
FarehamFarehamFarehamFarehamFarehamFarehamFarehamFarehamFareham
GosportGosportGosportGosportGosportGosportGosportGosportGosport
HavantHavantHavantHavantHavantHavantHavantHavantHavant
PortsmouthPortsmouthPortsmouthPortsmouthPortsmouthPortsmouthPortsmouthPortsmouthPortsmouth
Bishop'sBishop'sBishop'sBishop'sBishop'sBishop'sBishop'sBishop'sBishop's
WalthamWalthamWalthamWalthamWalthamWalthamWalthamWalthamWaltham
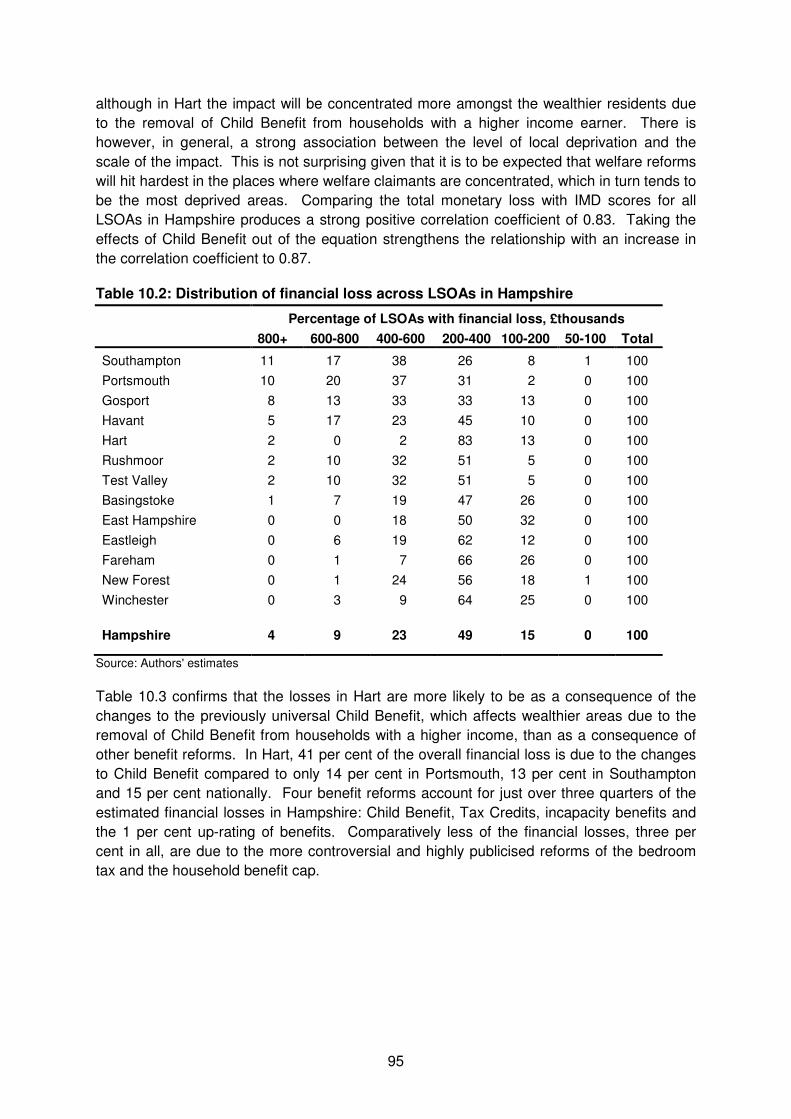
95
although in Hart the impact will be concentrated more amongst the wealthier residents due
to the removal of Child Benefit from households with a higher income earner. There is
however, in general, a strong association between the level of local deprivation and the
scale of the impact. This is not surprising given that it is to be expected that welfare reforms
will hit hardest in the places where welfare claimants are concentrated, which in turn tends to
be the most deprived areas. Comparing the total monetary loss with IMD scores for all
LSOAs in Hampshire produces a strong positive correlation coefficient of 0.83. Taking the
effects of Child Benefit out of the equation strengthens the relationship with an increase in
the correlation coefficient to 0.87.
Table 10.2: Distribution of financial loss across LSOAs in Hampshire
Percentage of LSOAs with financial loss, £thousands
800+ 600-800 400-600 200-400 100-200 50-100 Total
Southampton 11 17 38 26 8 1 100
Portsmouth 10 20 37 31 2 0 100
Gosport 8 13 33 33 13 0 100
Havant 5 17 23 45 10 0 100
Hart 2 0 2 83 13 0 100
Rushmoor 2 10 32 51 5 0 100
Test Valley 2 10 32 51 5 0 100
Basingstoke 1 7 19 47 26 0 100
East Hampshire 0 0 18 50 32 0 100
Eastleigh 0 6 19 62 12 0 100
Fareham 0 1 7 66 26 0 100
New Forest 0 1 24 56 18 1 100
Winchester 0 3 9 64 25 0 100
Hampshire 4 9 23 49 15 0 100
Source: Authors' estimates
Table 10.3 confirms that the losses in Hart are more likely to be as a consequence of the
changes to the previously universal Child Benefit, which affects wealthier areas due to the
removal of Child Benefit from households with a higher income, than as a consequence of
other benefit reforms. In Hart, 41 per cent of the overall financial loss is due to the changes
to Child Benefit compared to only 14 per cent in Portsmouth, 13 per cent in Southampton
and 15 per cent nationally. Four benefit reforms account for just over three quarters of the
estimated financial losses in Hampshire: Child Benefit, Tax Credits, incapacity benefits and
the 1 per cent up-rating of benefits. Comparatively less of the financial losses, three per
cent in all, are due to the more controversial and highly publicised reforms of the bedroom
tax and the household benefit cap.
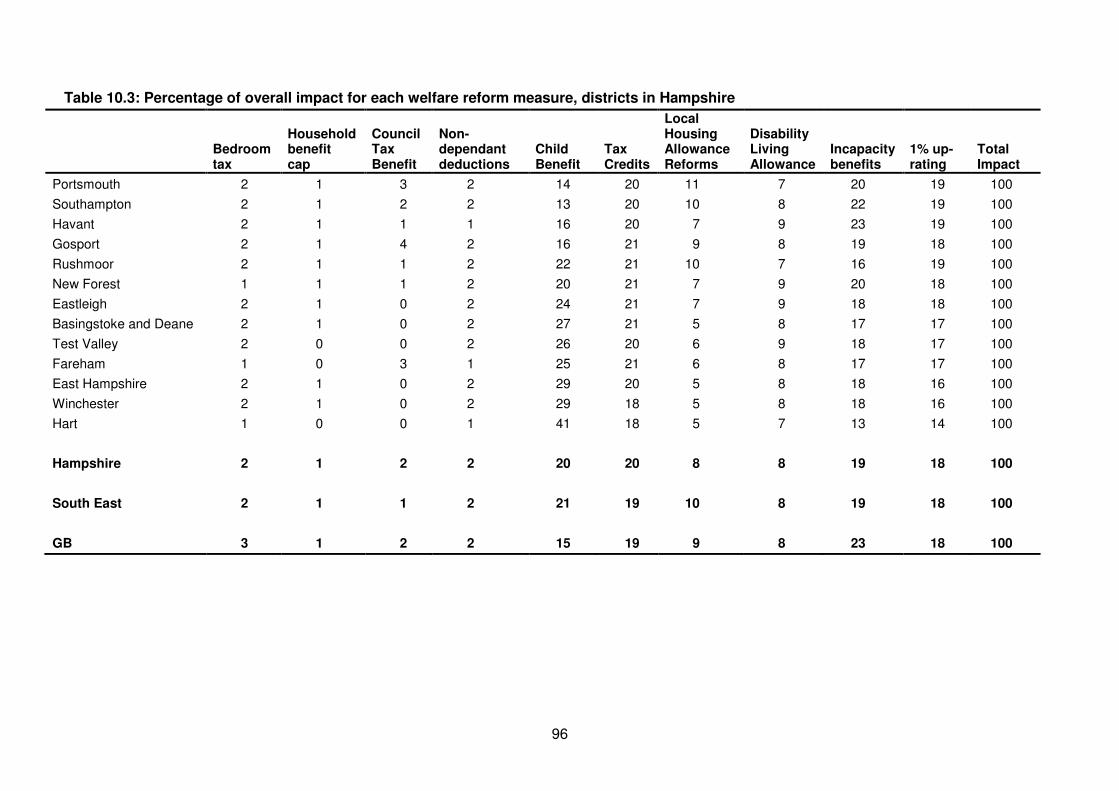
96
Table 10.3: Percentage of overall impact for each welfare reform measure, districts in Hampshire
Bedroom tax
Household benefit cap
Council Tax Benefit
Non-dependant deductions
Child Benefit
Tax Credits
Local Housing Allowance Reforms
Disability Living Allowance
Incapacity benefits
1% up-rating
Total Impact
Portsmouth 2 1 3 2 14 20 11 7 20 19 100
Southampton 2 1 2 2 13 20 10 8 22 19 100
Havant 2 1 1 1 16 20 7 9 23 19 100
Gosport 2 1 4 2 16 21 9 8 19 18 100
Rushmoor 2 1 1 2 22 21 10 7 16 19 100
New Forest 1 1 1 2 20 21 7 9 20 18 100
Eastleigh 2 1 0 2 24 21 7 9 18 18 100
Basingstoke and Deane 2 1 0 2 27 21 5 8 17 17 100
Test Valley 2 0 0 2 26 20 6 9 18 17 100
Fareham 1 0 3 1 25 21 6 8 17 17 100
East Hampshire 2 1 0 2 29 20 5 8 18 16 100
Winchester 2 1 0 2 29 18 5 8 18 16 100
Hart 1 0 0 1 41 18 5 7 13 14 100
Hampshire 2 1 2 2 20 20 8 8 19 18 100
South East 2 1 1 2 21 19 10 8 19 18 100
GB 3 1 2 2 15 19 9 8 23 18 100
97
This research has pieced together information on the impacts of welfare reform from a variety
of official sources to arrive at an estimate of the overall impact on households and claimants in
Hampshire. The tables in the Appendix provide a full breakdown of the financial impacts of
each of the reforms both in absolute financial loss and loss per working age adults for all
Hampshire districts. Though Hampshire is a relatively affluent area of the UK in general terms
the research highlights far reaching consequences for families and households. This
quantitative assessment has inevitably focused on the local authority district and LSOA levels
in estimating the impact across the 13 districts within Hampshire and has therefore centred on
the financial consequences of welfare reform. This report provides an evidence base on the
scale and impact of welfare reform. Understanding the very real impacts on individuals and
families at the local level of the social costs of the reforms, which are likely to be wide ranging
and severe, would be enhanced by also undertaking qualitative research on the impacts. This
would highlight the difficult decisions families were undertaking to make ends meet and how
they adjust to the reforms.
As the vast majority of benefits are means-tested claimants, by their very nature, are the most
disadvantaged groups in society and are the least able to gain and maintain a foothold in the
competitive labour market. Households reliant on government support to make ends meet tend
to spend the vast majority of their income and save little, if at all. The cumulative impact of
the reforms discussed here will therefore have severe consequences for many low income
households in Hampshire in terms of their ability to meet essential costs such as those related
to housing, energy and food. Although we can estimate the overall financial loss as a
consequence of the reforms to residents in Hampshire as a whole, very little is known about the
cumulative impact of the reforms at a household level. Many households will be subject to not
just one, but several, of the measures once the reforms have been fully implemented. The
reduction in household income to some may therefore be much greater than the average
financial loss to those affected by any one single element of the reforms.
For those individuals least able to gain a foothold in the labour market, often due to
compounding issues - such as long-term health problems; lack of skills, qualifications or recent
experience in the workforce - their ability to adjust to the new regime may be more limited than
those who are closer to the job's market. If there is a ready supply of younger, fitter, or more
qualified labour then many will remain at the back of the queue for jobs. These households will
have limited options as to how to adjust to falling incomes alongside the rising cost of living.
They are likely to be faced with difficult decisions as to how to manage their budget in the face
of their new circumstances and for those who are unable to secure employment and lack other
mechanisms of support, then increased poverty and hardship seems inevitable. The impacts
will also not occur all at once. The measures have been introduced gradually since 2011 and
will not be fully implemented for many until 2014/15 but in the case of means testing of ESA
and the one per cent up-rating of benefits will not be complete until 2015/16 and for DLA
2017/18. For those individuals or families who are not successful in gaining a foothold in the
labour market, some may at first be able to reduce their expenditure to counteract reductions in
their benefit entitlement, but as further benefit changes impact upon them this may be less of
an option. Over time, it may be less feasible for some to keep up with their mortgage or rent
payments, stay in their current home, or sufficiently heat their home.
It is important to remember that it is not just the households directly affected by the benefit
changes that will be impacted upon. The loss of benefit income, which is often large, will have
knock-on consequences for local spending and thus for local employment. A key effect of
welfare reform will therefore be to widen the gaps in prosperity between the best and worst
local areas within Hampshire.
98
Summary
• the cumulative impact of welfare reform in Hampshire will result in an estimated
loss of income of just over £400 million a year once the reforms have been fully
implemented
• the financial loss is equivalent to £360 a year for every working age adult in
Hampshire
• the cumulative impact of the reforms will have severe consequences for many
low income households in Hampshire in terms of their ability to meet essential
costs such as those related to housing, energy and food
• three benefit reforms affecting low income families account for over half of the
estimated financial losses in Hampshire: Tax Credits, incapacity benefits and the
one per cent up-rating of benefits
• the financial loss in nine LSOAs is more than £1 million per year
• over a quarter of all LSOAs in Portsmouth and Southampton will lose more than
£600,000 a year
• the greatest impact is more likely to be in the most deprived local areas within
Hampshire
• many of the reforms affect residents in work as well as out of work
• for individuals least able to gain a foothold in the labour market, often due to
compounding issues - such as long-term health problems; lack of skills,
qualifications or recent experience in the workforce - their ability to adjust to the
new regime may be more limited than those who are closer to the jobs market
• welfare reform is likely to widen the gaps in prosperity between the best and worst
local areas within Hampshire.
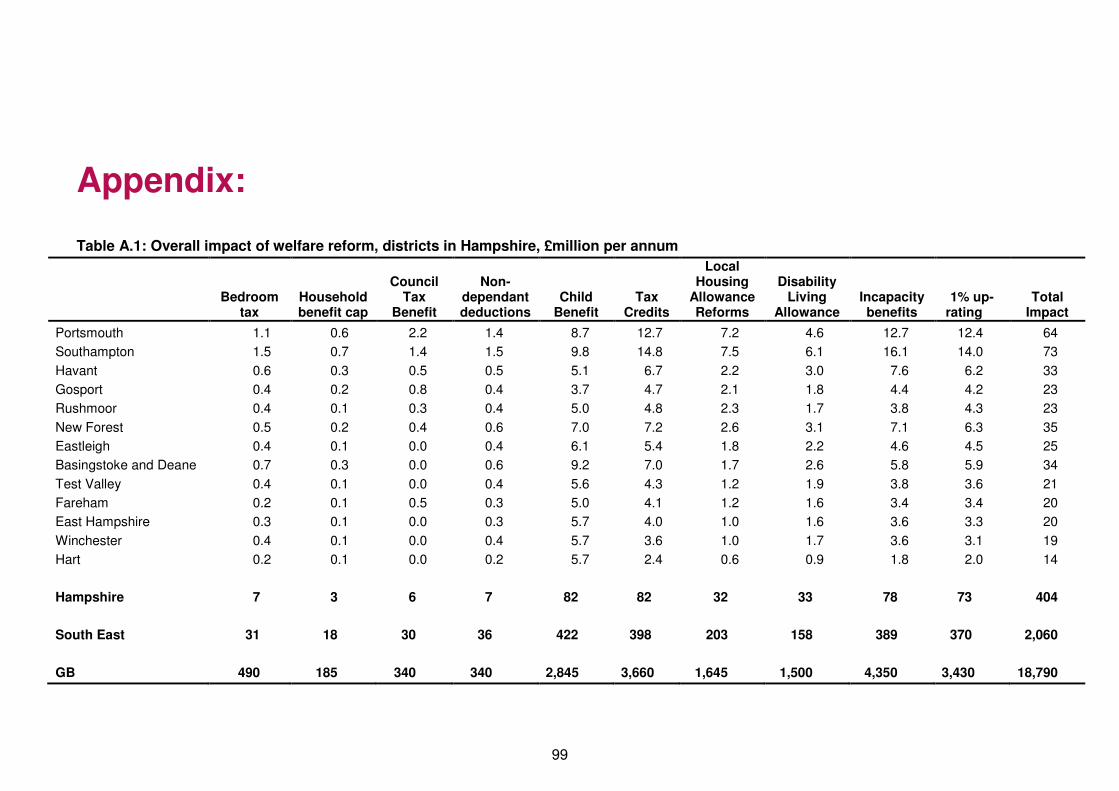
99
Appendix:
Table A.1: Overall impact of welfare reform, districts in Hampshire, £million per annum
Bedroom tax
Household benefit cap
Council Tax
Benefit
Non-dependant deductions
Child Benefit
Tax Credits
Local Housing
Allowance Reforms
Disability Living
Allowance Incapacity benefits
1% up-rating
Total Impact
Portsmouth 1.1 0.6 2.2 1.4 8.7 12.7 7.2 4.6 12.7 12.4 64
Southampton 1.5 0.7 1.4 1.5 9.8 14.8 7.5 6.1 16.1 14.0 73
Havant 0.6 0.3 0.5 0.5 5.1 6.7 2.2 3.0 7.6 6.2 33
Gosport 0.4 0.2 0.8 0.4 3.7 4.7 2.1 1.8 4.4 4.2 23
Rushmoor 0.4 0.1 0.3 0.4 5.0 4.8 2.3 1.7 3.8 4.3 23
New Forest 0.5 0.2 0.4 0.6 7.0 7.2 2.6 3.1 7.1 6.3 35
Eastleigh 0.4 0.1 0.0 0.4 6.1 5.4 1.8 2.2 4.6 4.5 25
Basingstoke and Deane 0.7 0.3 0.0 0.6 9.2 7.0 1.7 2.6 5.8 5.9 34
Test Valley 0.4 0.1 0.0 0.4 5.6 4.3 1.2 1.9 3.8 3.6 21
Fareham 0.2 0.1 0.5 0.3 5.0 4.1 1.2 1.6 3.4 3.4 20
East Hampshire 0.3 0.1 0.0 0.3 5.7 4.0 1.0 1.6 3.6 3.3 20
Winchester 0.4 0.1 0.0 0.4 5.7 3.6 1.0 1.7 3.6 3.1 19
Hart 0.2 0.1 0.0 0.2 5.7 2.4 0.6 0.9 1.8 2.0 14
Hampshire 7 3 6 7 82 82 32 33 78 73 404
South East 31 18 30 36 422 398 203 158 389 370 2,060
GB 490 185 340 340 2,845 3,660 1,645 1,500 4,350 3,430 18,790
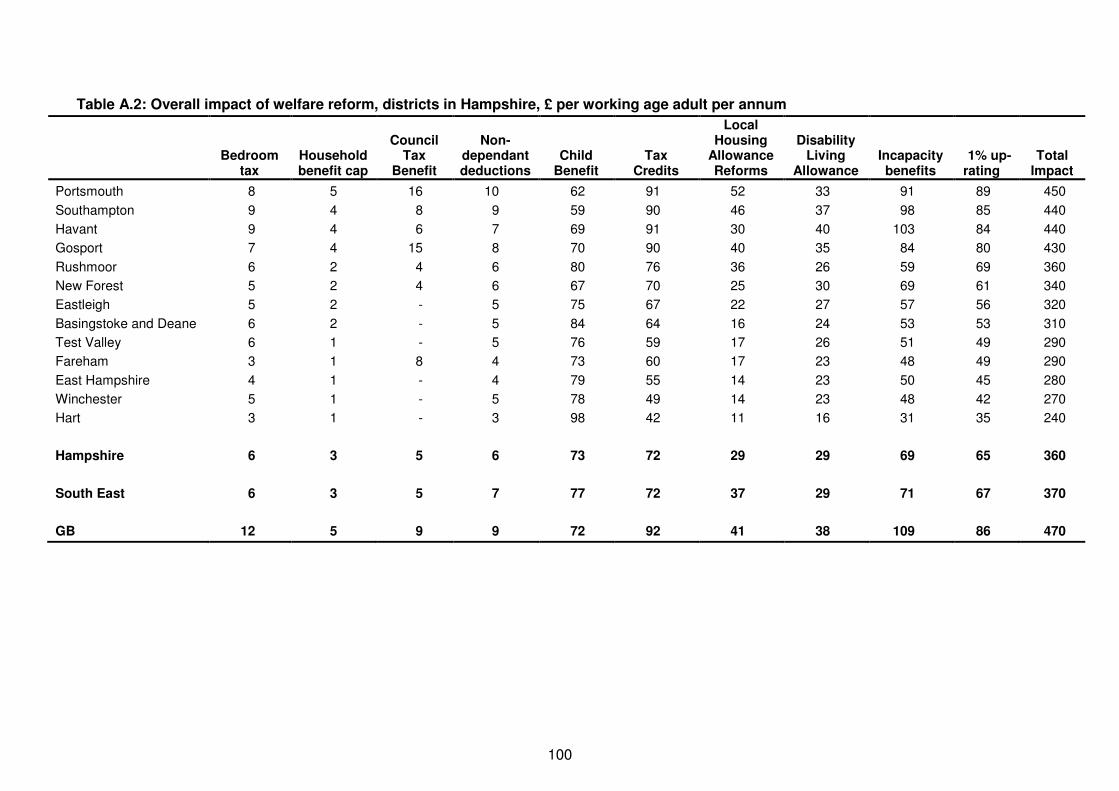
100
Table A.2: Overall impact of welfare reform, districts in Hampshire, £ per working age adult per annum
Bedroom tax
Household benefit cap
Council Tax
Benefit
Non-dependant deductions
Child Benefit
Tax Credits
Local Housing
Allowance Reforms
Disability Living
Allowance Incapacity benefits
1% up-rating
Total Impact
Portsmouth 8 5 16 10 62 91 52 33 91 89 450
Southampton 9 4 8 9 59 90 46 37 98 85 440
Havant 9 4 6 7 69 91 30 40 103 84 440
Gosport 7 4 15 8 70 90 40 35 84 80 430
Rushmoor 6 2 4 6 80 76 36 26 59 69 360
New Forest 5 2 4 6 67 70 25 30 69 61 340
Eastleigh 5 2 - 5 75 67 22 27 57 56 320
Basingstoke and Deane 6 2 - 5 84 64 16 24 53 53 310
Test Valley 6 1 - 5 76 59 17 26 51 49 290
Fareham 3 1 8 4 73 60 17 23 48 49 290
East Hampshire 4 1 - 4 79 55 14 23 50 45 280
Winchester 5 1 - 5 78 49 14 23 48 42 270
Hart 3 1 - 3 98 42 11 16 31 35 240
Hampshire 6 3 5 6 73 72 29 29 69 65 360
South East 6 3 5 7 77 72 37 29 71 67 370
GB 12 5 9 9 72 92 41 38 109 86 470
The impact of welfare reform in Hampshire
BEATTY, Christina <http://orcid.org/0000-0003-0943-9979>, GORE, Tony <http://orcid.org/0000-0002-0997-7198>, POWELL, Ryan and SANDERSON, Elizabeth <http://orcid.org/0000-0003-1423-1670>
Available from the Sheffield Hallam University Research Archive (SHURA) at:
http://shura.shu.ac.uk/27041/
Copyright and re-use policy
Please visit http://shura.shu.ac.uk/27041/ and http://shura.shu.ac.uk/information.html for further details about copyright and re-use permissions.