
Register Transfer Specification And Designgajski/eecs31/slides/Chapter08.pdfThe function fC defines...
62
Principles Of Principles Of Digital Design Digital Design Chapter 8 Chapter 8 Register Transfer Specification And Design
Transcript of Register Transfer Specification And Designgajski/eecs31/slides/Chapter08.pdfThe function fC defines...

Principles OfPrinciples Of
Digital DesignDigital DesignChapter 8Chapter 8
Register TransferSpecification And Design

2Copyright © 2004-2005 by Daniel D. Gajski Slides by Xi Cheng, University of California, Irvine
Chapter previewChapter preview
Logic gates and flip-flops
3Boolean algebra
3
Finite-state machine
6
2
8
4
5
6
7
8
9
Logic design techniques
Binary system and data
representation
Generalized finite-state machines
Combinational components
Sequential design techniques
Storage components
Register-transfer design
Processor components
3Copyright © 2004-2005 by Daniel D. Gajski Slides by Xi Cheng, University of California, Irvine
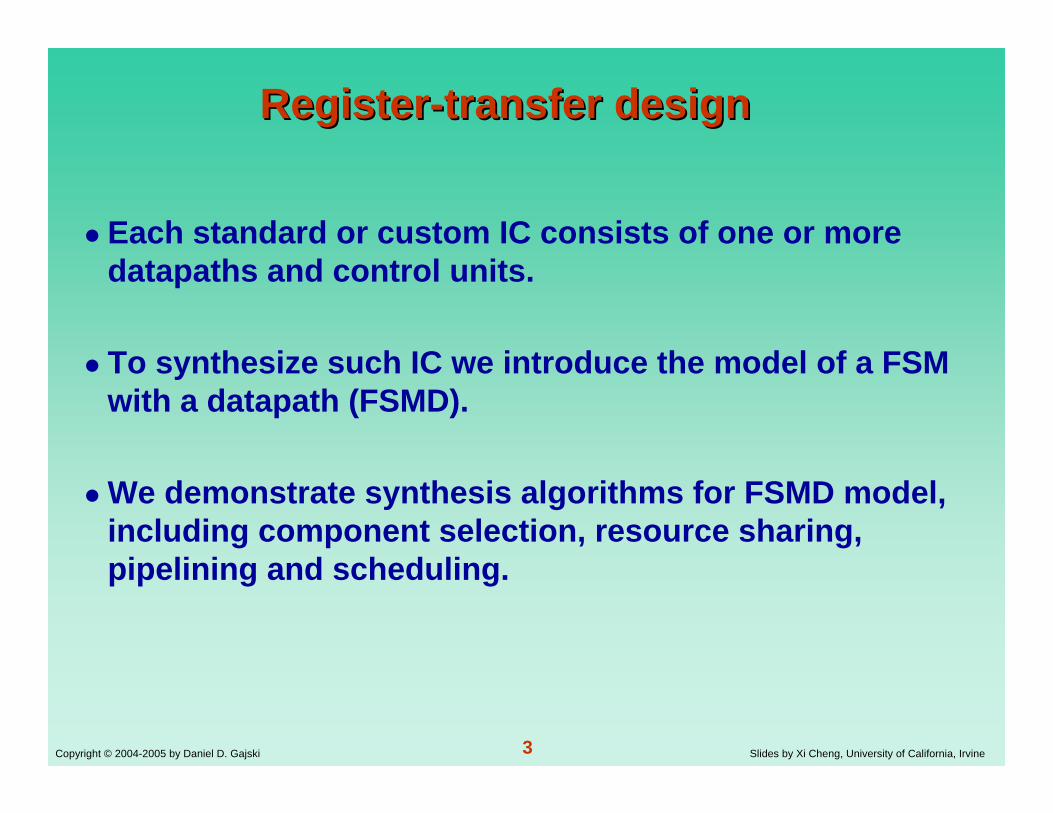
RegisterRegister--transfer designtransfer design
Each standard or custom IC consists of one or more datapaths and control units.
To synthesize such IC we introduce the model of a FSM with a datapath (FSMD).
We demonstrate synthesis algorithms for FSMD model, including component selection, resource sharing, pipelining and scheduling.

4Copyright © 2004-2005 by Daniel D. Gajski Slides by Xi Cheng, University of California, Irvine
Example 7.1Example 7.1

5Copyright © 2004-2005 by Daniel D. Gajski Slides by Xi Cheng, University of California, Irvine
Design ModelDesign Model
Control unit
Datapath
Control signalsStatus signals
Control inputs
Datapathinputs
Datapathoutputs
Control outputs
Control unit
Datapath
Control signalsStatus signals
Control inputs
Datapathinputs
Datapathoutputs
Control outputs
High-level block diagram
Register-transfer-level block diagram
Control unit Datapath
Bus 1Bus 2
Bus 3Status signals
Control signals
Control outputs
Datapathoutputs
Datapathinputs
Control inputs
Register
Register
ALU */÷
RF Mem
Selector
Output logic
Next-state logic
D Q
D Q
D Q
.
.
....
.
.
.
State register

6Copyright © 2004-2005 by Daniel D. Gajski Slides by Xi Cheng, University of California, Irvine
OnesOnes--counter specificationcounter specification
OcountTempMaskData
OcountTempMaskData
Done=0; Data = Input
Done=1; Data = Data >> 1
Done=0; Mask = 1
Done=0; Temp = Data AND Mask
Done=0; Ocount = Ocount + Temp
Done=0; Ocount = 0
Done=1; Output =Ocount
Start = 1
Data = 0
Data = 0
Start = 0

7Copyright © 2004-2005 by Daniel D. Gajski Slides by Xi Cheng, University of California, Irvine
FSDM DefinitionFSDM DefinitionIn Chapter 6 we defined an FSM as a quintuple < S, I, O, f, h >where S is a set of states, I and O are the sets of input and output
symbols: f : S × I S , and h : S × I O
More precisely, I = A1 × A2 ×…Ak
S = Q1 × Q2 ×…QmO = Y1 × Y2 ×…Yn
Where Ai, , is an input signal, Qi, is the flip-flop output and Yi, is an output signal.
To define a FSMD, we define a set of variables V = V1 × V2 ×…Vq
which defines the state of the datapath by defining the values of all variables in each state.
where IC = A1 × A2 ×…Ak as before and ID = B1 × B2 ×…Bp,
Where OC = Y1 × Y2 ×…Yn as before and OD = Z1 × Z2 ×…Zr.
≤ ≤1 i k ≤ ≤1 i m≤ ≤1 i n
( ){ }{ }{ }
= ∈
= = ∈ ∈ ≤ = ≥
U U W W
V V p f
×I = I IC D
×O = O OC D
8Copyright © 2004-2005 by Daniel D. Gajski Slides by Xi Cheng, University of California, Irvine
FSDM DefinitionFSDM Definition
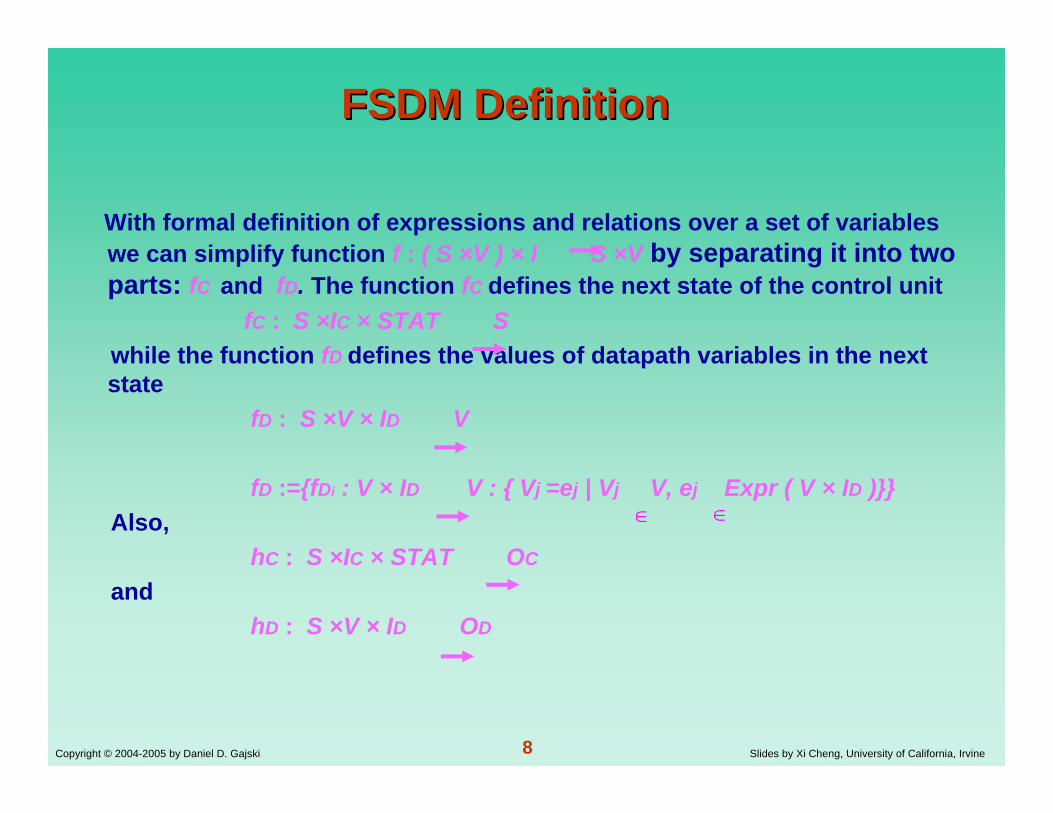
With formal definition of expressions and relations over a set of variables we can simplify function f : ( S ×V ) × I S ×V by separating it into two parts: fC and fD. The function fC defines the next state of the control unit
fC : S ×IC × STAT Swhile the function fD defines the values of datapath variables in the next state
fD : S ×V × ID V
fD :={fDi : V × ID V : { Vj =ej | Vj V, ej Expr ( V × ID )}}Also,
hC : S ×IC × STAT OC
and hD : S ×V × ID OD
∈∈
9Copyright © 2004-2005 by Daniel D. Gajski Slides by Xi Cheng, University of California, Irvine
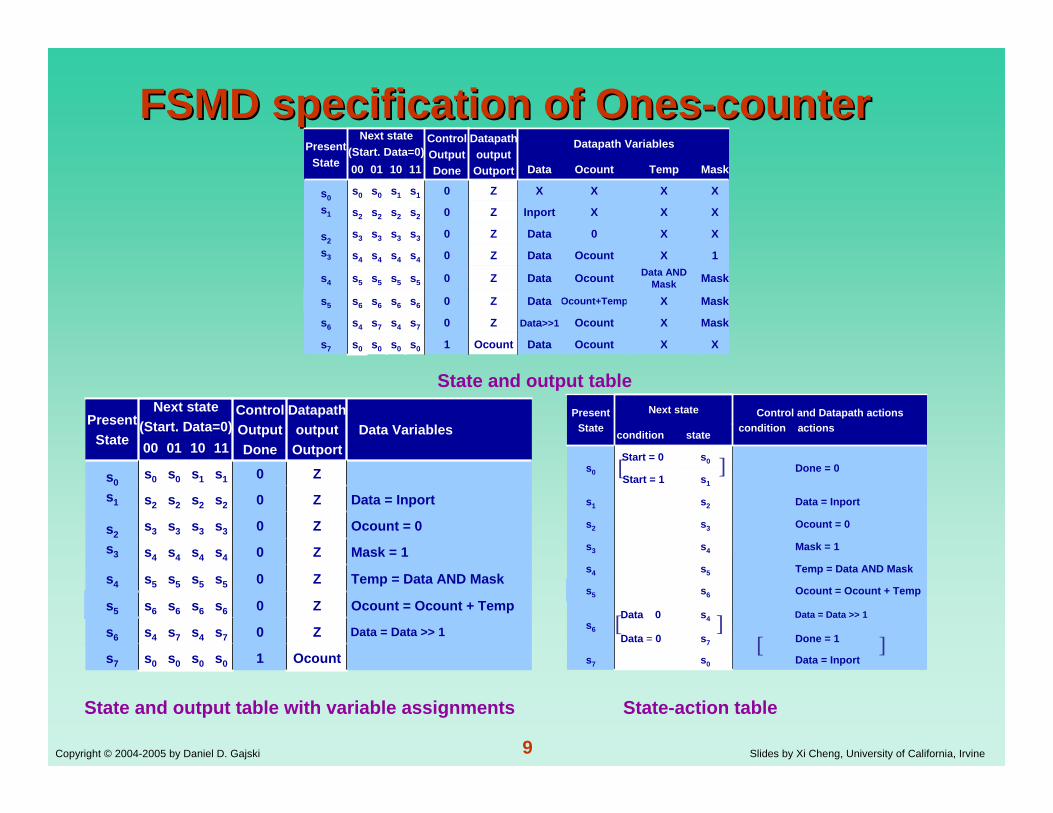
FSMD specification of OnesFSMD specification of Ones--countercounter
State and output table
State and output table with variable assignments State-action table
s4
0s5
XXOcountDataOcount1s0s0s0s0 s7
s7
s6
s3
s2
s1
s7
s6
s5
s4
s3
s2
s0
1101 MaskTempOcountData
MaskXOcountData>>1Z0s4s4s6
MaskXOcount+TempDataZ 0s6s6s5
MaskData AND MaskOcountDataZs5s5s4
1XOcountDataZ0s4s4
XX0DataZ0s3s3s2
s3
XXXInportZ0s2s2
XXXXZ0s1s0s0
s1
1000
Datapath VariablesDatapathoutputOutport
ControlOutputDone
Next state(Start. Data=0)Present
State
s4
0s5
Ocount1s0s0s0s0 s7
s7
s6
s3
s2
s1
s7
s6
s5
s4
s3
s2
s0
1101
Data = Data >> 1Z0s4s4s6
Ocount = Ocount + TempZ 0s6s6s5
Temp = Data AND MaskZs5s5s4
Mask = 1Z0s4s4
Ocount = 0Z0s3s3s2
s3
Data = InportZ0s2s2
Z0s1s0s0
s1
1000Data Variables
DatapathoutputOutport
ControlOutputDone
Next state(Start. Data=0)Present
State
Data = Inports2s1
s1Start = 1
Done = 1s7Data = 0
Done = 0s0Start = 0
s0
Ocount = 0s3s2
Mask = 1s4s3
s5
Data = Inports0s7
s4
s6
Data = Data >> 1Data 0s6
Ocount = Ocount + Temps5
Temp = Data AND Masks4
statecondition
Control and Datapath actionscondition actions
Next statePresentState
Data = Inports2s1
s1Start = 1
Done = 1s7Data = 0
Done = 0s0Start = 0
s0
Ocount = 0s3s2
Mask = 1s4s3
s5
Data = Inports0s7
s4
s6
Data = Data >> 1Data 0s6
Ocount = Ocount + Temps5
Temp = Data AND Masks4
statecondition
Control and Datapath actionscondition actions
Next statePresentState
[
]]
]
[[

10Copyright © 2004-2005 by Daniel D. Gajski Slides by Xi Cheng, University of California, Irvine
AlgorithmicAlgorithmic--StateState--MachineMachine
Graphic representation of FSMD model
Equivalent to state-action table
Similar to a flowchart used for program description
11Copyright © 2004-2005 by Daniel D. Gajski Slides by Xi Cheng, University of California, Irvine
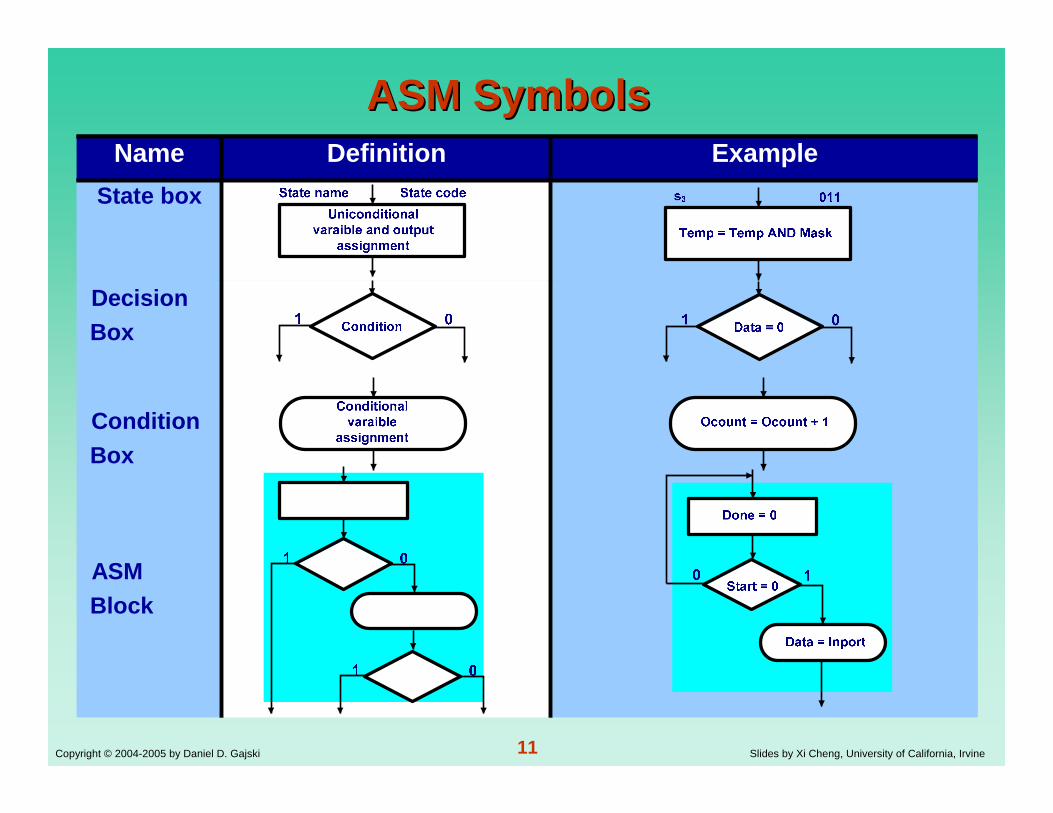
ASM SymbolsASM Symbols
ASMBlock
ConditionBox
DecisionBox
State box
ExampleDefinitionName
ASMBlock
ConditionBox
DecisionBox
State box
ExampleDefinitionName

12Copyright © 2004-2005 by Daniel D. Gajski Slides by Xi Cheng, University of California, Irvine
ASM rulesASM rulesRule 1: The chart must define a unique next state for each stateand set of conditions.
Rule 2: Every path defined by the network of condition boxes must lead to another state.
Undefined next state Undefined exit path
s1
s2 s3
0 1 0 1cond2cond1
ASM block
10
10
s2 s3
s1
ASM block
cond1
cond2

13Copyright © 2004-2005 by Daniel D. Gajski Slides by Xi Cheng, University of California, Irvine
ASM chart for OnesASM chart for Ones--countercounter
(a) State-based (Moore) chart (b) Input-based (Mealy) chart

14Copyright © 2004-2005 by Daniel D. Gajski Slides by Xi Cheng, University of California, Irvine
StateState--action tables for Onesaction tables for Ones--countercounter
Output = Ocount
Ocount = 0
s5
s4
s3
s2
s1
s0
Data = Inports20 0 1
s1Start = 1,
s5Data = 0,
Done = 0s0Start = 0,
0 0 0
s3DataLSR=1,0 1 0
s4DataLSR=0,s4
Done = 1s01 0 1
s2 Data = Data >> 1Data 0,
1 0 0
Ocount = Ocount + 10 1 1
StateCondition Datapath actions
condition Operations
Next statePresent StateQ2 Q1 Q0 Name
State-based table
= = + + ≠
= + + ≠= = + + ≠
= + + ≠
= = + + ≠
= + + ≠
= =
= + = += =
= == = =

15Copyright © 2004-2005 by Daniel D. Gajski Slides by Xi Cheng, University of California, Irvine
StateState--action tables for Onesaction tables for Ones--countercounter
Input-based table
= = + = +
= = + ≠
= + ≠
= ≠ = = ≠
= + ≠ = + ≠
= =
= == = =
Output = Ocount
Ocount = 0
s3
s2
s1
s0
Data = Inports20 1
s1Start = 1,Done = 0
s0Start = 0,0 0
Ocount = Ocount + 1DataLSR=1,s2Data 0,1 0
Data = Data >> 1Data 0,s3Data = 0,
s0Done = 1
1 1
StateCondition Datapath actions
condition OperationsNext statePresent State
Q1 Q0 Name
Output = Ocount
Ocount = 0
s3
s2
s1
s0
Data = Inports20 1
s1Start = 1,Done = 0
s0Start = 0,0 0
Ocount = Ocount + 1DataLSR=1,s2Data 0,1 0
Data = Data >> 1Data 0,s3Data = 0,
s0Done = 1
1 1
StateCondition Datapath actions
condition OperationsNext statePresent State
Q1 Q0 Name
=
[
[
[
[
]
]
]
]
]
[
=
16Copyright © 2004-2005 by Daniel D. Gajski Slides by Xi Cheng, University of California, Irvine
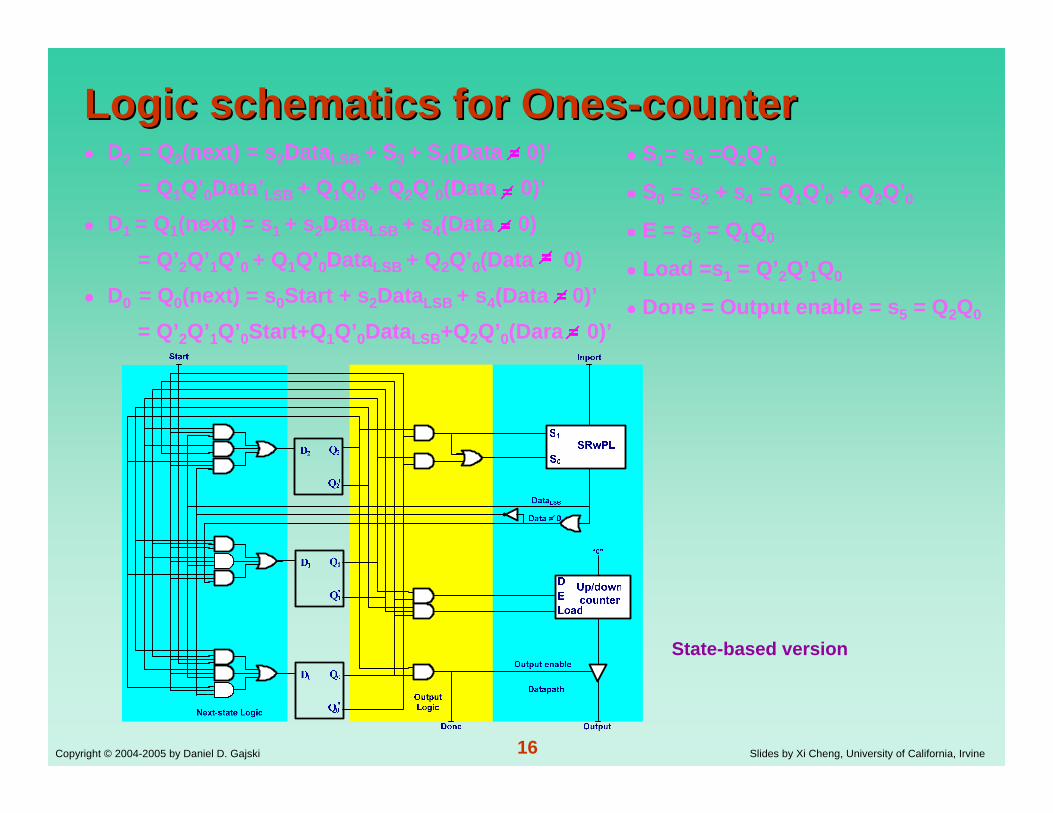
Logic schematics for OnesLogic schematics for Ones--countercounterD2 = Q2(next) = s2DataLSB + S3 + S4(Data 0)’
= Q1Q’0Data’LSB + Q1Q0 + Q2Q’0(Data 0)’D1 = Q1(next) = s1 + s2DataLSB + s4(Data 0)
= Q’2Q’1Q’0 + Q1Q’0DataLSB + Q2Q’0(Data 0)D0 = Q0(next) = s0Start + s2DataLSB + s4(Data 0)’
= Q’2Q’1Q’0Start+Q1Q’0DataLSB+Q2Q’0(Dara 0)’
S1= s4 =Q2Q’0S0 = s2 + s4 = Q1Q’0 + Q2Q’0E = s3 = Q1Q0
Load =s1 = Q’2Q’1Q0
Done = Output enable = s5 = Q2Q0
State-based version

17Copyright © 2004-2005 by Daniel D. Gajski Slides by Xi Cheng, University of California, Irvine
Logic schematics for OnesLogic schematics for Ones--countercounterD1 = Q1 ( next ) = s1+s2 = Q’1Q0 + Q1Q’0D0 = Q0 ( next ) = s0Start + s2( Data 0 )’
= Q’1Q’0Start + Q1Q’0 ( Data 0 )
S1 =s2( Data 0 ) = Q1Q’0( Data 0 )S0 = s1 + s2( Data 0 ) = Q’1Q0 + Q1Q’0( Data 0 )E = s2DataLSB = Q1Q’0DataLSB
Load = s1 = Q’1Q0
Done = Output enable = s3= Q1Q0
Input-based version
18Copyright © 2004-2005 by Daniel D. Gajski Slides by Xi Cheng, University of California, Irvine
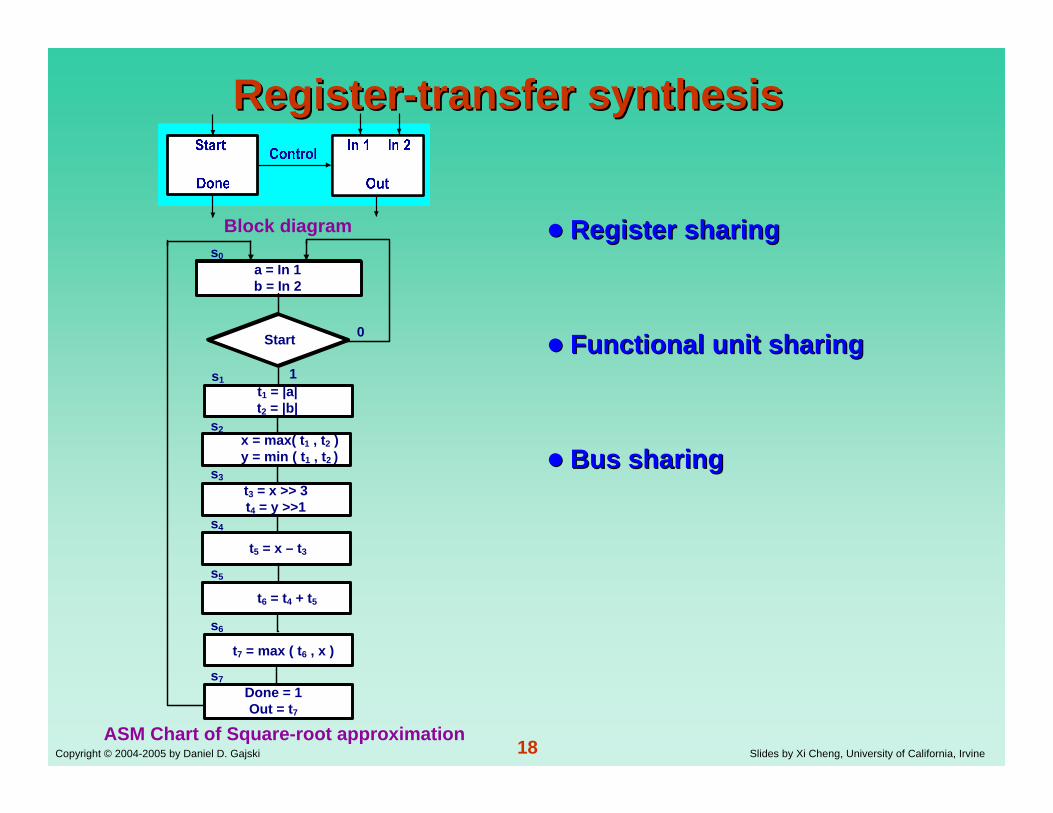
RegisterRegister--transfer synthesistransfer synthesis
Register sharingRegister sharing
Functional unit sharingFunctional unit sharing
Bus sharingBus sharing
Block diagram
ASM Chart of Square-root approximation
s0a = In 1b = In 2
0
1
Start
s1
s2
s3
s4
s5
s6
s7
t1 = |a|t2 = |b|
t5 = x – t3
x = max( t1 , t2 )y = min ( t1 , t2 )
t3 = x >> 3t4 = y >>1
t6 = t4 + t5
t7 = max ( t6 , x )
Done = 1Out = t7

19Copyright © 2004-2005 by Daniel D. Gajski Slides by Xi Cheng, University of California, Irvine
Resource usage in squareResource usage in square--root root approximationapproximation
Block diagram
ASM Chart of Square-root approximation
No. of live variables
1233222Xt7
Xt6
Xt5
XXt4
Xt3
XyXXXXx
Xt2
Xt1
XbXa
s7s6s5s4s3s2s1
No. of live variables
1233222Xt7
Xt6
Xt5
XXt4
Xt3
XyXXXXx
Xt2
Xt1
XbXa
s7s6s5s4s3s2s1
Max. no.of units
No. of operations
111212
1+
1-
2>>
11max
1min
211211
2abs
s7s6s5s4s3s2s1
Max. no.of units
No. of operations
111212
1+
1-
2>>
11max
1min
211211
2abs
s7s6s5s4s3s2s1
Variable usage
Operation usage
s0a = In 1b = In 2
0
1
Start
s1
s2
s3
s4
s5
s6
s7
t1 = |a|t2 = |b|
t5 = x – t3
x = max( t1 , t2 )y = min ( t1 , t2 )
t3 = x >> 3t4 = y >>1
t6 = t4 + t5
t7 = max ( t6 , x )
Done = 1Out = t7

20Copyright © 2004-2005 by Daniel D. Gajski Slides by Xi Cheng, University of California, Irvine
Simple library componentsSimple library components(a) Absolute value unit
(version 1)
(b) Absolute value unit
(version 2)
(c) Min unit (d) Max unit (e) Min/Max unit
(f) 1-bit right shifter (g) 3-bit right shifter (h) 1-bit/3-bit right shifter
(i) Adder (j) Subtractor (k) Adder/Subtractor
0 0
“0”
a
a>>1
0 0 0
a
a>>3
a b
a+b
Adder
a b
a-b
Adder
a b
a+b/a-b
add/sub control
Adder
Subtractor
Selector1 0
a b
Min(a,b)
Sign bit
Subtractor
Selector1 0
a b
Max(a,b)
Sign bit
Subtractor
Selector1 0
“0” b
|b|
Sign bit
|b|Sign bitSubtractor
Selector1 0
“0” b
|b|
a>>3/a>>1
>>3>>1
a
Shift control
Selector1 0
min/max control
Subtractor
Selector1 0
a b
min/max(a,b)
Sign bit

21Copyright © 2004-2005 by Daniel D. Gajski Slides by Xi Cheng, University of California, Irvine
Connectivity requirementsConnectivity requirements
Block diagram
ASM Chart of Square-root approximation
011-
011+
01>>1
01>>3
010111max
011min
01abs2
01abs1
t7t6t5t4t3yxt2t1ba
Connectivity table
s0a = In 1b = In 2
0
1
Start
s1
s2
s3
s4
s5
s6
s7
t1 = |a|t2 = |b|
t5 = x – t3
x = max( t1 , t2 )y = min ( t1 , t2 )
t3 = x >> 3t4 = y >>1
t6 = t4 + t5
t7 = max ( t6 , x )
Done = 1Out = t7

22Copyright © 2004-2005 by Daniel D. Gajski Slides by Xi Cheng, University of California, Irvine
Register sharing (Variable merging)Register sharing (Variable merging)
Grouping of variables with nonoverlapinglifetimes
Each group shares one register
Grouping reduces number of registers needed in the design
Two algorithms: leftleft--edgeedge
graphgraph--partitioningpartitioning

23Copyright © 2004-2005 by Daniel D. Gajski Slides by Xi Cheng, University of California, Irvine
LeftLeft--edge algorithmedge algorithm

24Copyright © 2004-2005 by Daniel D. Gajski Slides by Xi Cheng, University of California, Irvine
Register sharing by leftRegister sharing by left--edge algorithmedge algorithm
ASM Chart
Xt7
Xt6
Xt5
Xt4
XXt3
XyXXXXx
Xt2
Xt1
XbXa
s7s6s5s4s3s2s1
Sorted list of variables
R1 = {a, t1, x, t7}
R2 = {b, t2, y, t4, t6}
R3 = {t2, t5 }Register assignments
Datapath schematic
s0a = In 1b = In 2
0
1
Start
s1
s2
s3
s4
s5
s6
s7
t1 = |a|t2 = |b|
t5 = x – t3
x = max( t1 , t2 )y = min ( t1 , t2 )
t3 = x >> 3t4 = y >>1
t6 = t4 + t5
t7 = max ( t6 , x )
Done = 1Out = t7

25Copyright © 2004-2005 by Daniel D. Gajski Slides by Xi Cheng, University of California, Irvine
Merging variables with common sources Merging variables with common sources and destinationand destination
Partial ASM Chart Datapath without register sharing Datapath with register sharing
x = a + b
y = c + dsj
si
a
Selector Selector
Selector Selector
c b d
x y
+
Selector Selector
Selector
a , c b , d
x , y
+

26Copyright © 2004-2005 by Daniel D. Gajski Slides by Xi Cheng, University of California, Irvine
Graph partitioning algorithmGraph partitioning algorithm
Create compatibility graph
Start
Merge highest priority nodes
Upgrade compatibility graph
All nodes incompatible
Stop
no yes
(a) Initial compatibility graph
0/1

27Copyright © 2004-2005 by Daniel D. Gajski Slides by Xi Cheng, University of California, Irvine
Graph partitioning algorithm for SRAGraph partitioning algorithm for SRA
ASM Chart
(a) Initial compatibility grah
(b) Compatibility graph after merging t3, t5 and t6
(c) Compatibility graph after merging t1, xand t7
(d) Compatibility graph after merging t2 and y
(e) Final compatibility graph
1/0
s0a = In 1b = In 2
0
1
Start
s1
s2
s3
s4
s5
s6
s7
t1 = |a|t2 = |b|
t5 = x – t3
x = max( t1 , t2 )y = min ( t1 , t2 )
t3 = x >> 3t4 = y >>1
t6 = t4 + t5
t7 = max ( t6 , x )
Done = 1Out = t7

28Copyright © 2004-2005 by Daniel D. Gajski Slides by Xi Cheng, University of California, Irvine
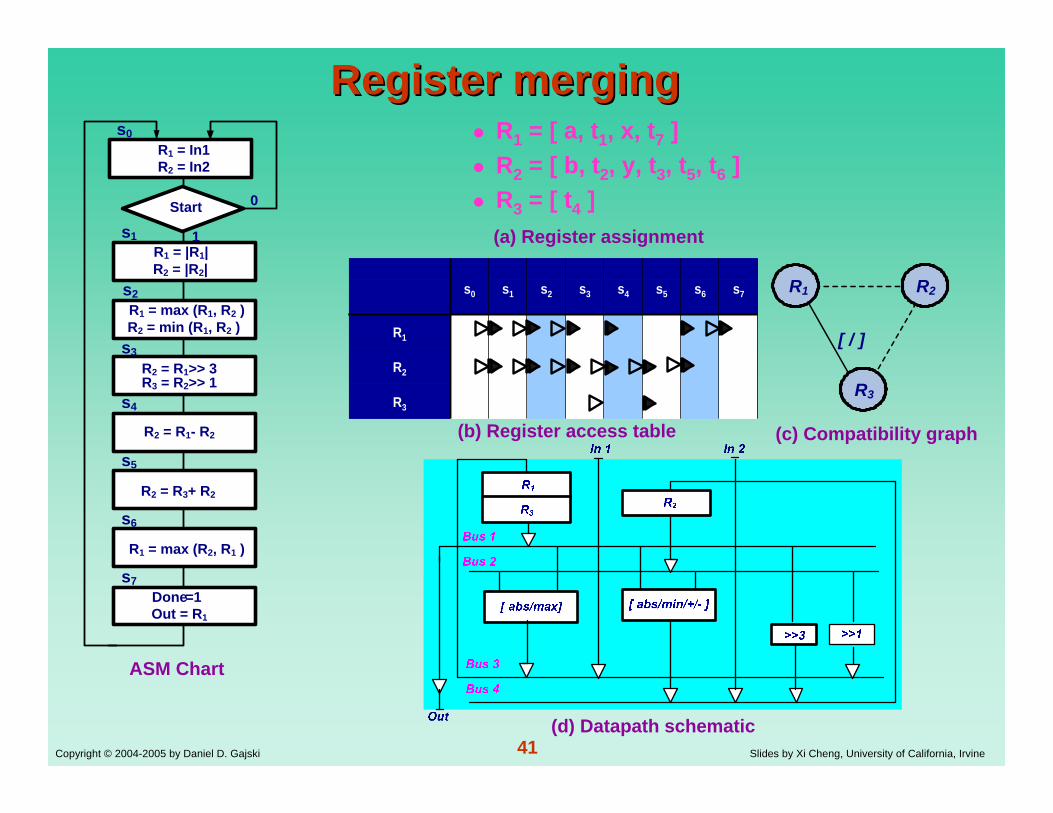
Register assignment generated by the Register assignment generated by the graphgraph--partitioning algorithmpartitioning algorithm
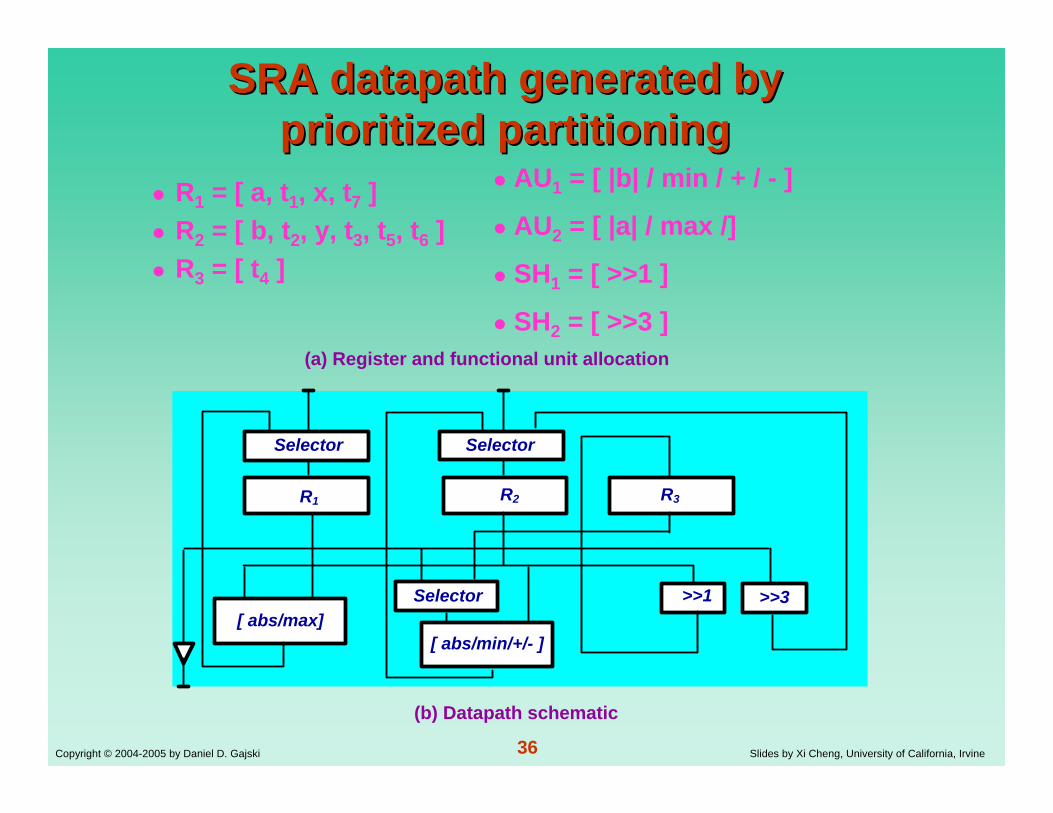
R1 = [ a , t1 , x , t7 ]R2 =[b , t2 , y , t3 , t5 , t6 ]R3= [ t4 ]
Register assignments
Datapath

29Copyright © 2004-2005 by Daniel D. Gajski Slides by Xi Cheng, University of California, Irvine
Functional unit sharingFunctional unit sharing(operator merging)(operator merging)
Group non-concurrent operations
Each group shares one functional unit
Sharing reduces number of functional units
Prioritized grouping by reducing connectivity
Clustering algorithm used for grouping

30Copyright © 2004-2005 by Daniel D. Gajski Slides by Xi Cheng, University of California, Irvine
Functional unit sharingFunctional unit sharing
Partial ASM Chart Non-shared design Shared design

31Copyright © 2004-2005 by Daniel D. Gajski Slides by Xi Cheng, University of California, Irvine
Complex library componentsComplex library components
maximum11
minimum01
absolute10
Operationc0c1
maximum11
minimum01
absolute10
Operationc0c1
subtraction11
absolute10
addition01
Operationc0c1
subtraction11
absolute10
addition01
Operationc0c1
addition00
maximum11
subtraction01
minimum10
Operationc0c1
addition00
maximum11
subtraction01
minimum10
Operationc0c1
maximum111
1
1
1
0
c2
addition10
minimum01
subtraction10
absolute00
Operationc0c1
maximum111
1
1
1
0
c2
addition10
minimum01
subtraction10
absolute00
Operationc0c1
Unit for computing minimum, maxmum and absolute value
Unit for computing addition, subtraction, minimum and maximum
Unit for computing addition, subtraction, and absolute value
Unit for computing addition, subtraction, minimum, maximum and absolute value

32Copyright © 2004-2005 by Daniel D. Gajski Slides by Xi Cheng, University of California, Irvine
Compunoent
22112Total
2111[| b |/max/+/-]
2111[| a |/min]
SelectorAdderEX-ORLogic
InvertLogic
ANDLogic
Unit
Compunoent
22112Total
2111[| b |/max/+/-]
2111[| a |/min]
SelectorAdderEX-ORLogic
InvertLogic
ANDLogic
Unit
Compuno-ent
465Total
11-
1+
111max
111min
111| b |
111| a |
SelectorAdderEX-ORLogic
InvertLogic
ANDLogic
Unit
Compuno-ent
465Total
11-
1+
111max
111min
111| b |
111| a |
SelectorAdderEX-ORLogic
InvertLogic
ANDLogic
Unit
Compunoent
22112Total
2111[| b |/max/+]2111[| a |/min/+]
SelectorAdderEX-ORLogic
InvertLogic
ANDLogicUnit
Compunoent
22112Total
2111[| b |/max/+]2111[| a |/min/+]
SelectorAdderEX-ORLogic
InvertLogic
ANDLogicUnit
Operator merging for SRA Operator merging for SRA implementationimplementation
ASM Chart
(a) Compatibiltity graph
(c) Merging altermative
(e) Merging altermative
(b) Cost table
(d) Cost table
(f) Cost table

33Copyright © 2004-2005 by Daniel D. Gajski Slides by Xi Cheng, University of California, Irvine
DatapathDatapath connectivityconnectivity
ASM Chart
(a) Datapath schematic for unit allocation from figure 8.22 (c)
(b) Datapath schematic for unit allocation from figure 8.22 (e)
Selector Selector
R1 R2 R3
[ abs/min]>>1 >>3Selector
[ abs/max/+/- ]
Selector Selector
R1 R2 R3
[ abs/min/+]>>1 >>3Selector
[ abs/max/- ]

34Copyright © 2004-2005 by Daniel D. Gajski Slides by Xi Cheng, University of California, Irvine
Priorities in unit mergingPriorities in unit merging
Selector Selector
Selector
x , y
+/-
a , c b , d
x = a + b
y = c + dsj
si
(a) Partial ASM Chart (b) Design without merged units
a , c
x , y
+ -
Selector Selector Selector Selector
Selector
b , d
(c) Design with merged units

35Copyright © 2004-2005 by Daniel D. Gajski Slides by Xi Cheng, University of California, Irvine
Unit merging for SRA Unit merging for SRA datapathdatapath
ASM Chart
(a) Compatibility graph (b) Compatibility graph after merging of + and _
(c) Compatibility graph after merging of min, + and _
(d) Final graph partitions
36Copyright © 2004-2005 by Daniel D. Gajski Slides by Xi Cheng, University of California, Irvine
SRA SRA datapathdatapath generated by generated by prioritized partitioningprioritized partitioning
R1 = [ a, t1, x, t7 ]R2 = [ b, t2, y, t3, t5, t6 ]R3 = [ t4 ]
Selector Selector
R1 R2 R3
[ abs/max]>>1 >>3Selector
[ abs/min/+/- ]
AU1 = [ |b| / min / + / - ]
AU2 = [ |a| / max /]
SH1 = [ >>1 ]
SH2 = [ >>3 ](a) Register and functional unit allocation
(b) Datapath schematic
37Copyright © 2004-2005 by Daniel D. Gajski Slides by Xi Cheng, University of California, Irvine
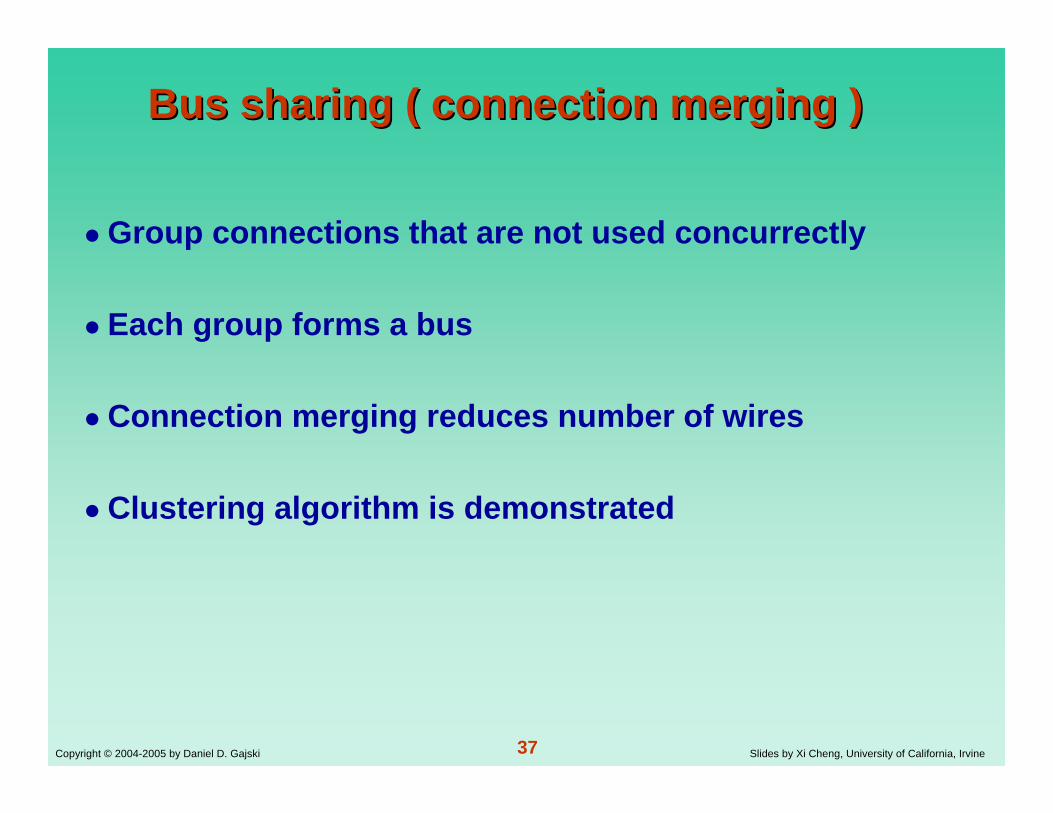
Bus sharing ( connection merging )Bus sharing ( connection merging )
Group connections that are not used concurrectly
Each group forms a bus
Connection merging reduces number of wires
Clustering algorithm is demonstrated

38Copyright © 2004-2005 by Daniel D. Gajski Slides by Xi Cheng, University of California, Irvine
Connection merging in SRA Connection merging in SRA datapathdatapath
XLXM
Xs7
XN
XKXXXXJ
XXXIXHXG
XXXXFXE
XXDXXXCXXB
As6s5s4s3s2s1s0
XLXM
Xs7
XN
XKXXXXJ
XXXIXHXG
XXXXFXE
XXDXXXCXXB
As6s5s4s3s2s1s0
Bus1 = [ A, C, D, E, H ]
Bus2 = [ B, F, G ]
Bus3= [ I, K, M ]
Bus4 = [ J, L, N ]
(a) Datapath for SRA (e) Bus assignment
(b) Connectivity usage table(c) Compatibility graph
for input buses(d) Compatibility graph
for output buses
Selector Selector
R1 R2 R3
[ abs/max]>>1 >>3Selector
[ abs/min/+/- ]
A B C D E F G H
IJ
K L
M NIn 1 In 2
Out

39Copyright © 2004-2005 by Daniel D. Gajski Slides by Xi Cheng, University of California, Irvine
Connection merging in SRA Connection merging in SRA datapathdatapath
R1 R2 R3
>>1 >>3
Bus 1
[ abs/min] [ abs/max/+/- ]
Bus 2
Bus 3
Bus 4
Bus1 = [ A, C, D, E, H ]
Bus2 = [ B, F, G ]
Bus3= [ I, K, M ]
Bus4 = [ J, L, N ]Datapath for SRA Bus assignment
(f) Bus oriented datapath
Selector Selector
R1 R2 R3
[ abs/max]>>1 >>3Selector
[ abs/min/+/- ]
A B C D E F G H
IJ
K L
M NIn 1 In 2
Out

40Copyright © 2004-2005 by Daniel D. Gajski Slides by Xi Cheng, University of California, Irvine
Register mergingRegister merging
Group register with nonoverlapping accesses
Each group assigned to one register file
Register grouping reduces number of ports, and therefore number of buses
Demonstration with clustering algorithm
41Copyright © 2004-2005 by Daniel D. Gajski Slides by Xi Cheng, University of California, Irvine
Register mergingRegister merging
s0
R2
R3
R1
s7s6s5s4s3s2s1s0
R2
R3
R1
s7s6s5s4s3s2s1
ASM Chart
R1 = [ a, t1, x, t7 ]R2 = [ b, t2, y, t3, t5, t6 ]R3 = [ t4 ](a) Register assignment
(d) Datapath schematic
(b) Register access table
R1 R2
R3
[ / ]
(c) Compatibility graph
0
1
Start
R1 = |R1|
Done = 1
R2 = |R2|
R1 = max (R1, R2 ) R2 = min (R1, R2 )
R2 = R1>> 3 R3 = R2>> 1
R2 = R1- R2
R2 = R3+ R2
R1 = max (R2, R1 )
Out = R1
R2 = In2R1 = In1
s1
s0
s2
s3
s4
s5
s6
s7

42Copyright © 2004-2005 by Daniel D. Gajski Slides by Xi Cheng, University of California, Irvine
Chaining and Chaining and multicyclingmulticyclingChaining allows serial execution of two or more operations in each state
Chaining reduces number of states and increases performance
Multicycling allows one operation to be executed over two or more clock cycles
Multicycling reduces size of functional units
Chaining and multicycling are used on noncriticalpaths to improve resource utilization and performance

43Copyright © 2004-2005 by Daniel D. Gajski Slides by Xi Cheng, University of California, Irvine
SRA SRA datapathdatapath with chained unitswith chained units
(a) ASM Chart
(b) Datapath schematic
In 1
R1 R2 R3
>>1
Bus 1
[ abs/max] [ abs/min/+/- ]
Bus 2
Bus 3
Bus 4
>>3
In 2
Out
In 2
s0a = In 1b = In 2
0
1
Start = 1
s1
s2
s3
s4
s5
s6
t1 = |a|t2 = |b|
t5 = x – t3
x = max( t1 , t2 )t3 = max( t1 , t2 )>>3t4 = min ( t1 , t2 )>>1
t6 = t4 + t5
t7 = max ( t6 , x )
Done = 1Out = t7

44Copyright © 2004-2005 by Daniel D. Gajski Slides by Xi Cheng, University of California, Irvine
SRA SRA datapathdatapath with with multicyclemulticycle unitsunits
In 1
R1 R2 R3
>>1
Bus 1
[ abs/max] [ abs/+/- ]
Bus 2
Bus 3
Bus 4
>>3
In 2
Out
min
(a) ASM Chart
(b) Datapath schematic
In 2
s0a = In 1b = In 2
0
1
Start = 1
s1
s2
s3
s4
s5
s6
t1 = |a|t2 = |b|
t5 = x – t3
x = max( t1 , t2 )t3 = max( t1 , t2 )>>3t4 = min ( t1 , t2 )>>1
t6 = t4 + t5
t7 = max ( t6 , x )
Done = 1Out = t7

45Copyright © 2004-2005 by Daniel D. Gajski Slides by Xi Cheng, University of California, Irvine
PipeliningPipeliningPipelining improves performance at a very small additional cost
Pipelining divides resources into stages and uses all stage concurrently for different data ( assembly line principle)
Pipelining principles works on several levels:(a) Units pipelining
(b) Control pipelining
(c) Datapath pipelining

46Copyright © 2004-2005 by Daniel D. Gajski Slides by Xi Cheng, University of California, Irvine
Pipelined arithmetic unitPipelined arithmetic unit
Selector01
Adder
Selector01
sign bit
c0
c1
c2
latches

47Copyright © 2004-2005 by Daniel D. Gajski Slides by Xi Cheng, University of California, Irvine
SRA SRA datapathdatapath with single AUwith single AU
(a) ASM Chart
(b) Datapath schematic
In 2
s0a = In 1b = In 2
0
1
Start = 1
s1
s2
s3
s4
s5
s6
t1 = |a|t2 = |b|
t5 = x – t3t4 = [min ( t1 , t2 )>>1]
x = max( t1 , t2 )t3 = max( t1 , t2 )>>3[t4] = min ( t1 , t2 )>>1
t6 = t4 + t5
t7 = max ( t6 , x )
Done = 1Out = t7

48Copyright © 2004-2005 by Daniel D. Gajski Slides by Xi Cheng, University of California, Irvine
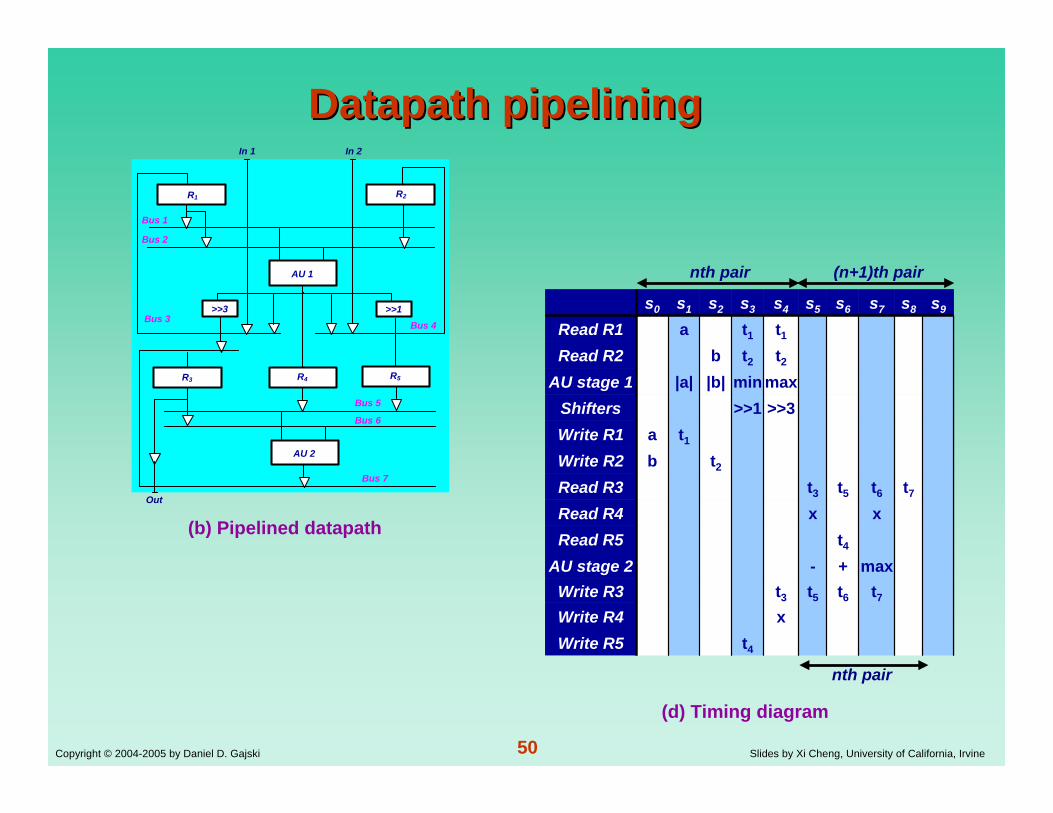
DatapathDatapath with pipelined functional unitwith pipelined functional unitIn 1
R1 R2 R3
>>1
Bus 1
Bus 2
Bus 3
Bus 4
>>3
In 2
Out
2-stage AU
t7Outportt4Write R3
t6t5t3t2bWrite R2
t7xt1aWrite R1
>>1>>3shiftersmax+-minmax|b||a|AU stage 2
max+-minmax|b||a|AU stage 1t4Read R3
t6t5t3t2t2bRead R2
t7xxt1t1aRead R1
s12s11s10s9s8s7s6s5s4s3s2s1s0
t7Outportt4Write R3
t6t5t3t2bWrite R2
t7xt1aWrite R1
>>1>>3shiftersmax+-minmax|b||a|AU stage 2
max+-minmax|b||a|AU stage 1t4Read R3
t6t5t3t2t2bRead R2
t7xxt1t1aRead R1
s12s11s10s9s8s7s6s5s4s3s2s1s0
(a) Datapath with pipelined AU
(b) Timing diagram

49Copyright © 2004-2005 by Daniel D. Gajski Slides by Xi Cheng, University of California, Irvine
DatapathDatapath pipeliningpipelining
t2 = |b|
s0a = In 1b = In 2
0
1s1
s2
s3
s4
s5
s6
s7
t1 = |a|
t5 = x – t3
x = max( t1 , t2 )t3 = max ( t1 , t2 )>>3
t4 = min ( t1 , t2 ) >>1
t6 = t4 + t5
t7 = max ( t6 , x )
s8Done = 1Out = t7
In 1
R1 R2
R3
>>1
Bus 1
Bus 2
Bus 3Bus 4
>>3
In 2
Out
AU 1
R4 R5
AU 2
Bus 5
Bus 6
Bus 7
(a) ASM Chart
(b) Pipelined datapath
R1 = [ a, t1 ] R3 = [ t3, t5, t6, t7 ]
R2 = [ b, t2 ] R4 = [ x ]
AU1 = [ abs/min/max ] R5 = [ t4 ]
AU2 = [ +/-/max ]
(c) Register and functional unit assignment
50Copyright © 2004-2005 by Daniel D. Gajski Slides by Xi Cheng, University of California, Irvine
DatapathDatapath pipeliningpipeliningIn 1
R1 R2
R3
>>1
Bus 1
Bus 2
Bus 3Bus 4
>>3
In 2
Out
AU 1
R4 R5
AU 2
Bus 5
Bus 6
Bus 7
(b) Pipelined datapath
(d) Timing diagram
nth pair (n+1)th pair
nth pair
t4Write R5xWrite R4
t7t6t5t3Write R3max+-AU stage 2
t4Read R5xxRead R4
t7t6t5t3Read R3t2bWrite R2
t1aWrite R1>>3>>1Shiftersmaxmin|b||a|AU stage 1
t2t2bRead R2t1t1aRead R1
s9s8s7s6s5s4s3s2s1s0
t4Write R5xWrite R4
t7t6t5t3Write R3max+-AU stage 2
t4Read R5xxRead R4
t7t6t5t3Read R3t2bWrite R2
t1aWrite R1>>3>>1Shiftersmaxmin|b||a|AU stage 1
t2t2bRead R2t1t1aRead R1
s9s8s7s6s5s4s3s2s1s0

51Copyright © 2004-2005 by Daniel D. Gajski Slides by Xi Cheng, University of California, Irvine
Timing diagram for Timing diagram for datapathdatapath pipeline pipeline with pipelined unitswith pipelined units
t7Out t4t4Write R5
xxWrite R4t3t7t6t5t3Write R3
max+-AU2 stage 2
max+-AU2 stage 1
t4Read R5xxRead R4
t7t6t5t3Read R3t2bWrite R2
t1aWrite R1>>3>>1Shifters
maxmin|b||a|AU1 stage 2
maxmin|b||a|AU1 stage 1
t2t2bRead R2t1t1aRead R1
s13s12s11s10s9s8s7s6s5s4s3s2s1s0
t7Out t4t4Write R5
xxWrite R4t3t7t6t5t3Write R3
max+-AU2 stage 2
max+-AU2 stage 1
t4Read R5xxRead R4
t7t6t5t3Read R3t2bWrite R2
t1aWrite R1>>3>>1Shifters
maxmin|b||a|AU1 stage 2
maxmin|b||a|AU1 stage 1
t2t2bRead R2t1t1aRead R1
s13s12s11s10s9s8s7s6s5s4s3s2s1s0
52Copyright © 2004-2005 by Daniel D. Gajski Slides by Xi Cheng, University of California, Irvine
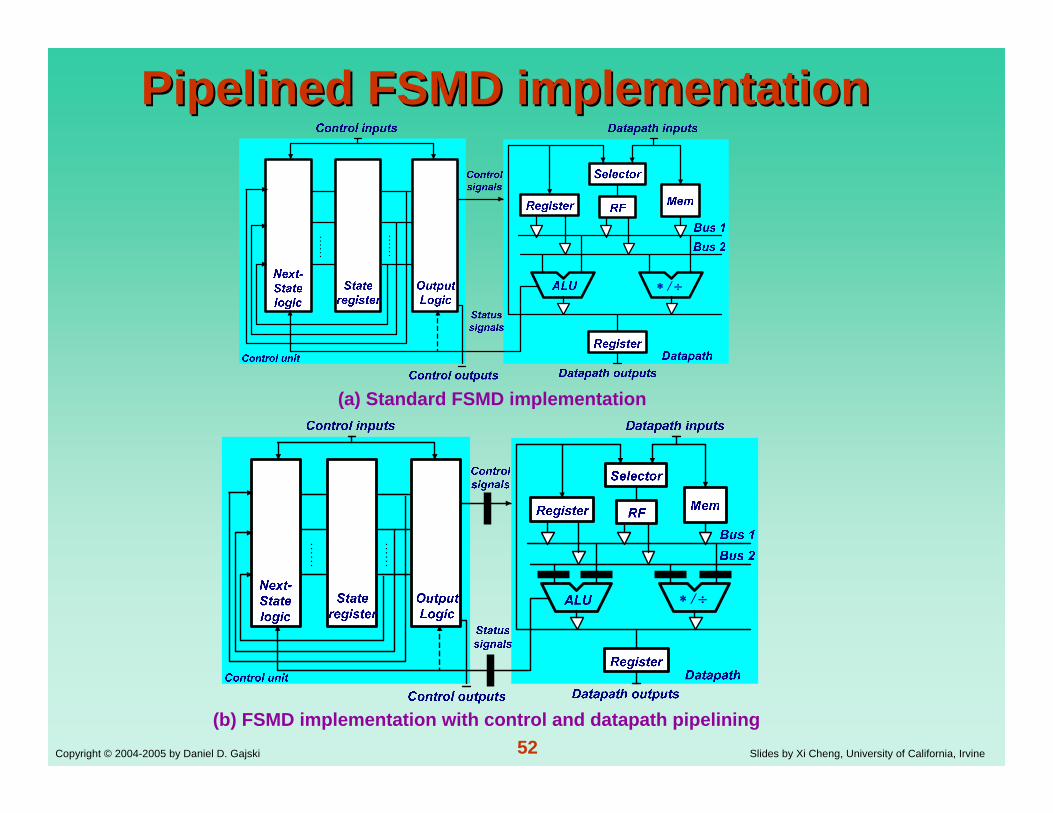
Pipelined FSMD implementationPipelined FSMD implementation
/∗ ÷
/∗ ÷
(a) Standard FSMD implementation
(b) FSMD implementation with control and datapath pipelining

53Copyright © 2004-2005 by Daniel D. Gajski Slides by Xi Cheng, University of California, Irvine
ASM charts for pipelined ASM charts for pipelined FSMDsFSMDs
/∗ ÷
(b) FSMD implementation with control and datapath pipelining
(a) ASM chart(b) ASM chart
for control pipeline with
status register
(c) ASM chart for control pipeline with status register and control registers
(d) ASM chart for control and datapath pipeline

54Copyright © 2004-2005 by Daniel D. Gajski Slides by Xi Cheng, University of California, Irvine
SchedulingSchedulingRT description such as ASM chart specifies data operations in each stateFlowcharts or programming languages do not have states, but only specify order in which operations are executed.Scheduling transforms flowcharts or programs with RT descriptionsTwo types of scheduling
(a) resource constrained(resource given, minimize time)
(b) time constrained (time given, minimize resources)

55Copyright © 2004-2005 by Daniel D. Gajski Slides by Xi Cheng, University of California, Irvine
Control/dataflow graph for SRAControl/dataflow graph for SRA
0a>b
t1=|a|t2=|b|
x=max (t1, t2)y=min(t1, t2)
t3=x>>3t4=y>>1t5=x-t3t6=t4+t5
t7= max(t6,x)Done=1Out=t7
a=In 1b=In 2
0
1
Start
In1 In 2
a b
a b
min
|a| |b|
max
>>1 >>3
-+
max
1
Out Done
(a) Flowchart(b) Control/Data flow graph
56Copyright © 2004-2005 by Daniel D. Gajski Slides by Xi Cheng, University of California, Irvine
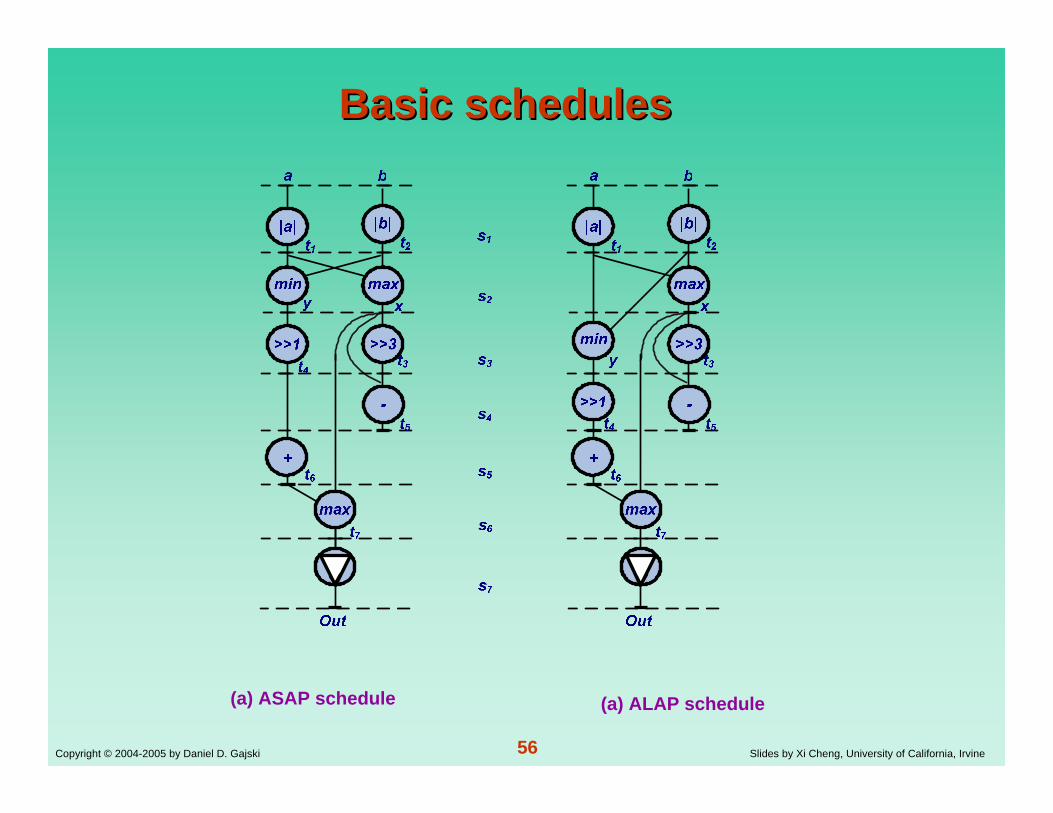
Basic schedulesBasic schedules
(a) ASAP schedule (a) ALAP schedule

57Copyright © 2004-2005 by Daniel D. Gajski Slides by Xi Cheng, University of California, Irvine
List scheduling algorithmList scheduling algorithm
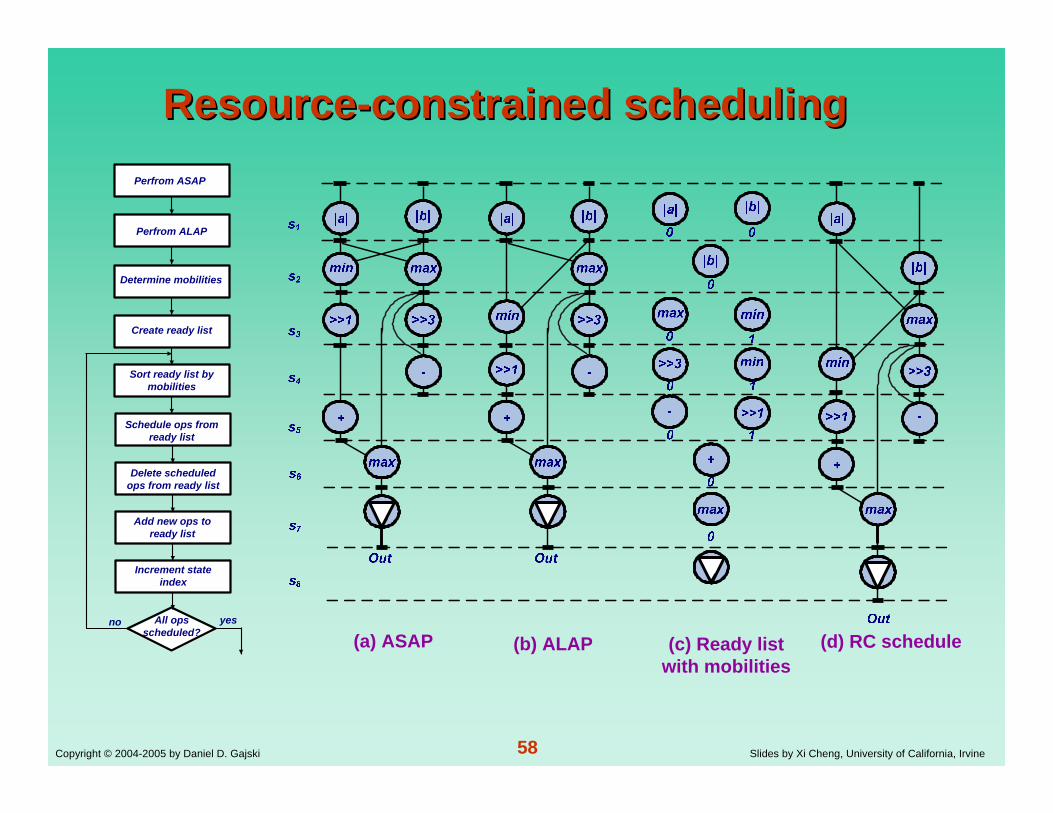
58Copyright © 2004-2005 by Daniel D. Gajski Slides by Xi Cheng, University of California, Irvine
ResourceResource--constrained schedulingconstrained scheduling
(a) ASAP (b) ALAP (c) Ready list with mobilities
(d) RC scheduleno
Perfrom ASAP
Perfrom ALAP
Determine mobilities
Create ready list
Sort ready list by mobilities
Schedule ops from ready list
Delete scheduled ops from ready list
Add new ops to ready list
Increment state index
All ops scheduled?
yes

59Copyright © 2004-2005 by Daniel D. Gajski Slides by Xi Cheng, University of California, Irvine
TimeTime--constrained schedulingconstrained scheduling
no
Perfrom ASAP
Perfrom ALAP
Determine mobilities ranges
Create probability distribution graphs
All ops scheduled?
yes
All ops scheduled?
yes
Schedule ops from ready list
Schedule ops from ready list

60Copyright © 2004-2005 by Daniel D. Gajski Slides by Xi Cheng, University of California, Irvine
TC schedule for SRA algorithmTC schedule for SRA algorithm
Out
min
|a| |b|
max
>>1 >>3
-
+
max
Out
min
|a| |b|
max
>>1
>>3
-
+
max
min
|a|
|b|
max
>>1
>>3
-
+
max
s5
s6
s7
s1
s2
s3
s4
s8
(a) ASAP (b) ALAP (c) TC schedule
61Copyright © 2004-2005 by Daniel D. Gajski Slides by Xi Cheng, University of California, Irvine
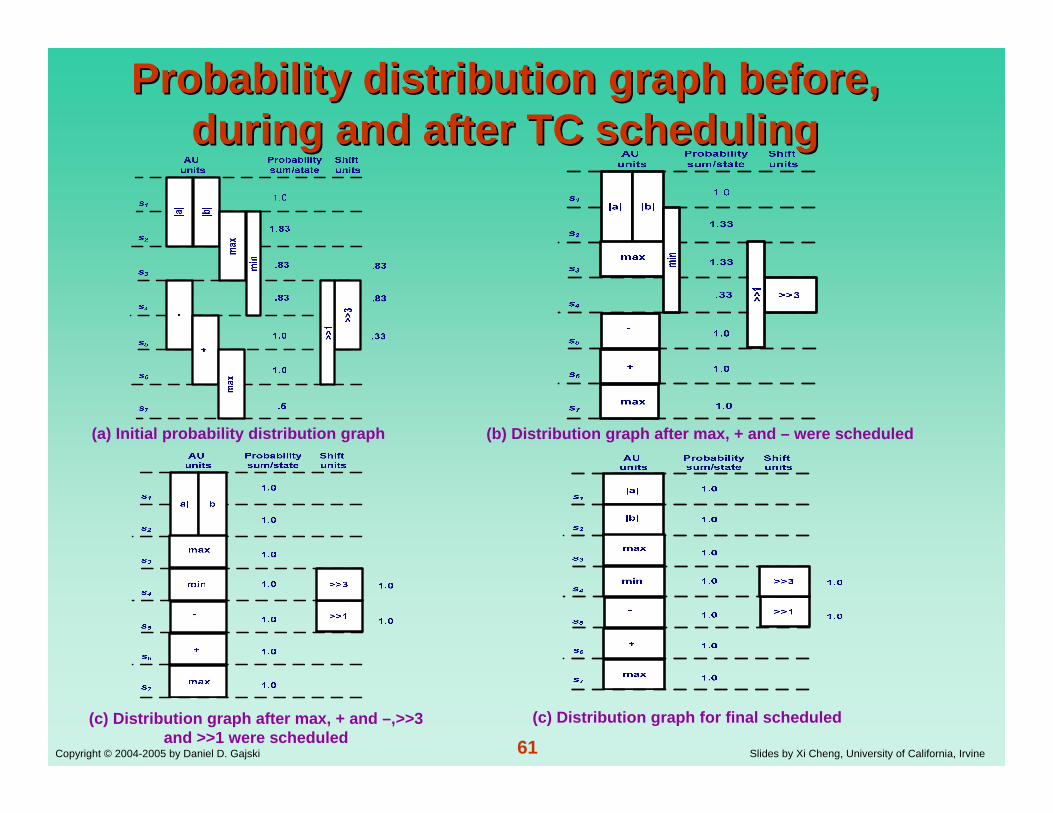
Probability distribution graph before, Probability distribution graph before, during and after TC schedulingduring and after TC scheduling
(a) Initial probability distribution graph (b) Distribution graph after max, + and – were scheduled
(c) Distribution graph after max, + and –,>>3 and >>1 were scheduled
(c) Distribution graph for final scheduled

62Copyright © 2004-2005 by Daniel D. Gajski Slides by Xi Cheng, University of California, Irvine
Chapter summaryChapter summaryWe introduced RT design:
FSMD modelRT specification with
Procedure for synthesis from RT specificationDesign Optimization through
Design Pipelining
Scheduling of flowcharts
Static-action tablesASM charts
Register sharingUnit chainingFunctional unit sharingMulticlockingBus sharing
Unit pipeliningControl pipeliningDatapath pipelining


![2015 / 16...Southampton FC Stoke City FC Sunderland AFC Swansea City AFC Tottenham Hotspur FC [London ] Watford FC West Bromwich Albion FC West Ham United FC [London ] …](https://static.fdocuments.us/doc/165x107/6147d88ca830d0442101b33e/2015-16-southampton-fc-stoke-city-fc-sunderland-afc-swansea-city-afc-tottenham.jpg)


![Invicta Fc 11 [Invicta FC 11]](https://static.fdocuments.us/doc/165x107/55d25bd2bb61ebc5698b459f/invicta-fc-11-invicta-fc-11.jpg)