Regions. Formal common factor easily recognized language, religion, nationality, political identity...
33
Regions
-
Upload
sophie-sherman -
Category
Documents
-
view
216 -
download
0
Transcript of Regions. Formal common factor easily recognized language, religion, nationality, political identity...

Regions
Formal
• common factor easily recognized
• language, religion, nationality, political identity or culture• climate, landform, or vegetation.• capital city, states, regions.
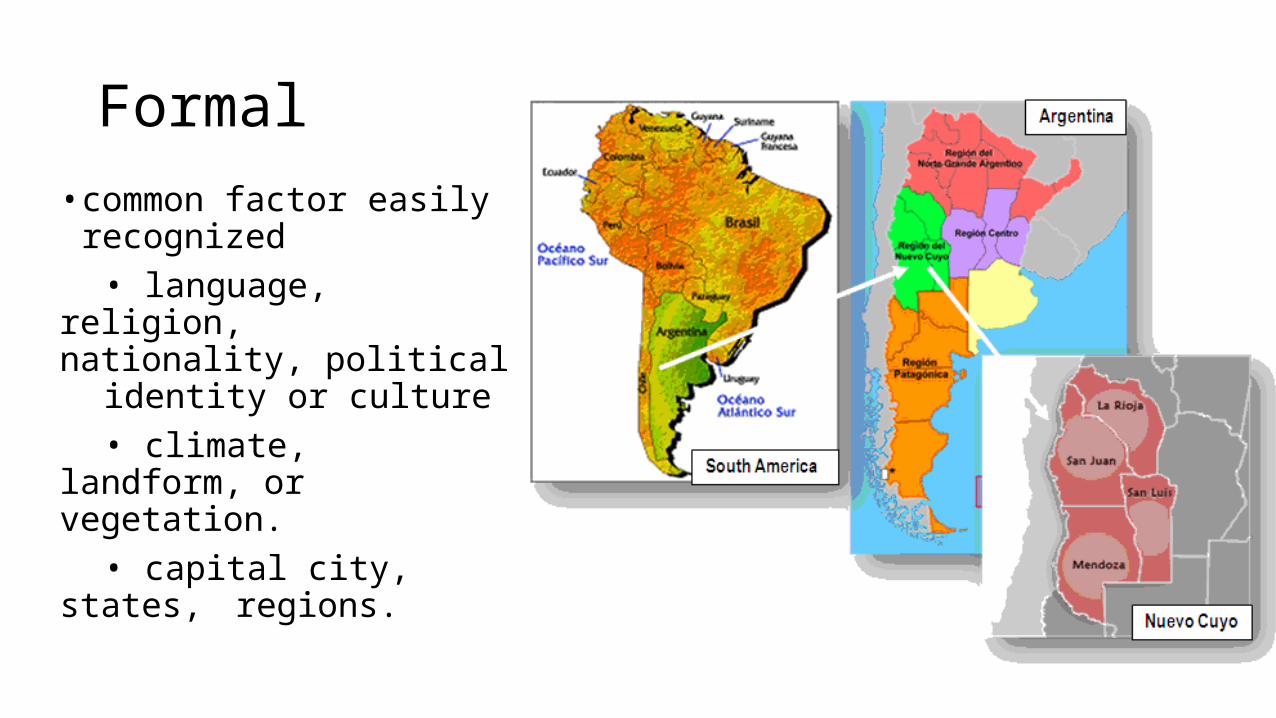
Functional
• Share an activity in common• Transportation system• Education District• All the capitals of the U.S
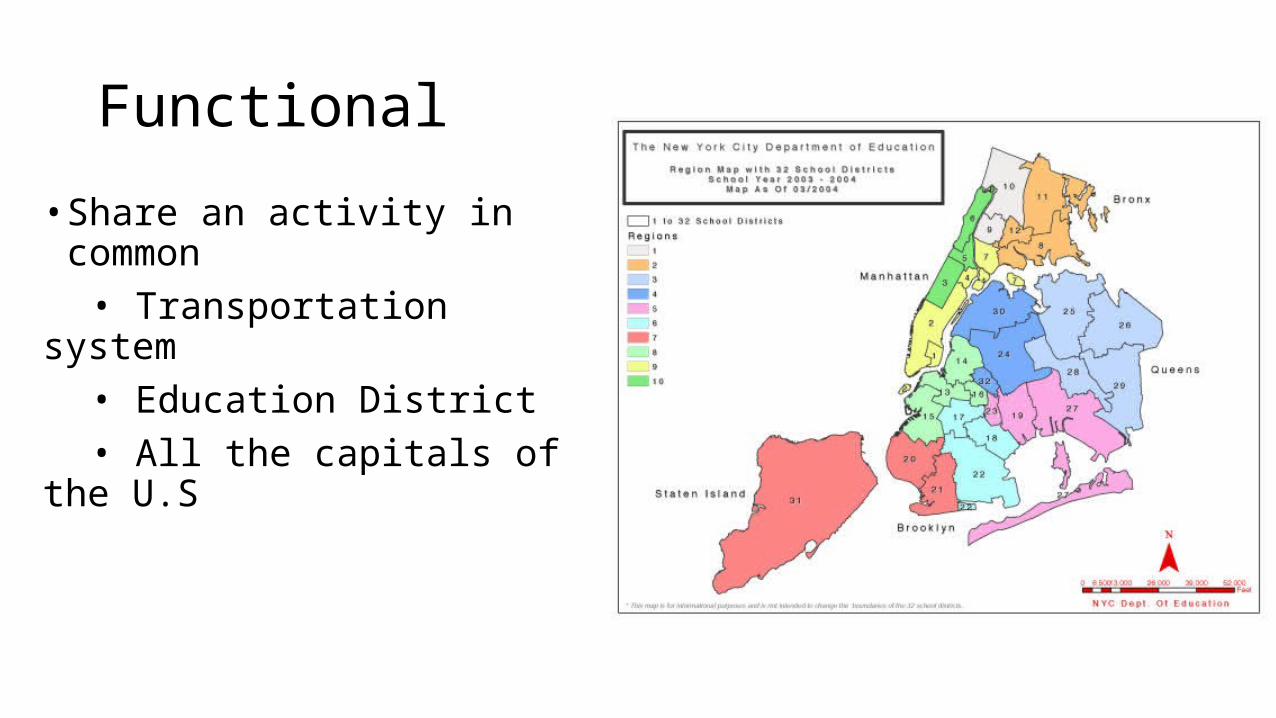
Vernacular/Perceptual
• Mental map• Bible belt• Chinatown• Wine Country
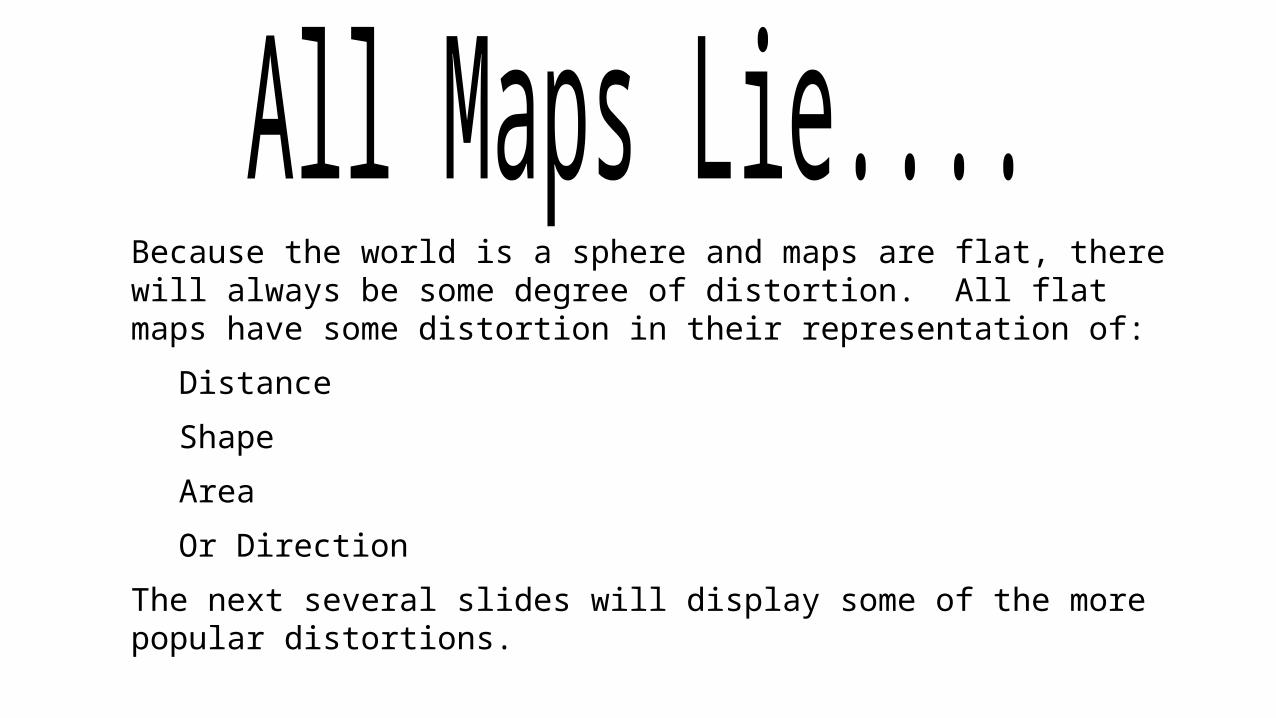
Because the world is a sphere and maps are flat, there will always be some degree of distortion. All flat maps have some distortion in their representation of:
Distance
Shape
Area
Or Direction
The next several slides will display some of the more popular distortions.
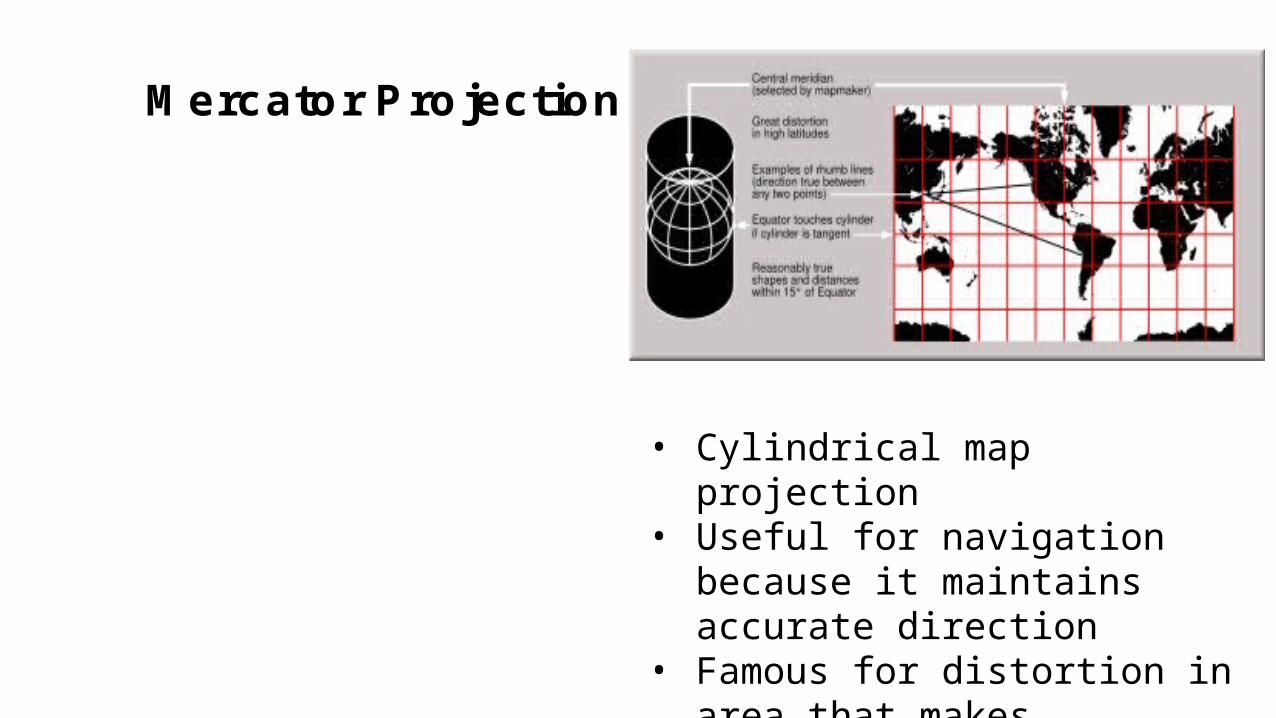
Mercator Projection
• Cylindrical map projection• Useful for navigation because it
maintains accurate direction• Famous for distortion in area that
makes landmasses at the poles appear oversized

Peters Projection
• Cylindrical map projection• Attempts to retain accurate
sizes of all landmasses• Sometimes used as a political
statement- that we should refocus our attention to the tropics, home to large landmasses and many of the world’s poorest countries.
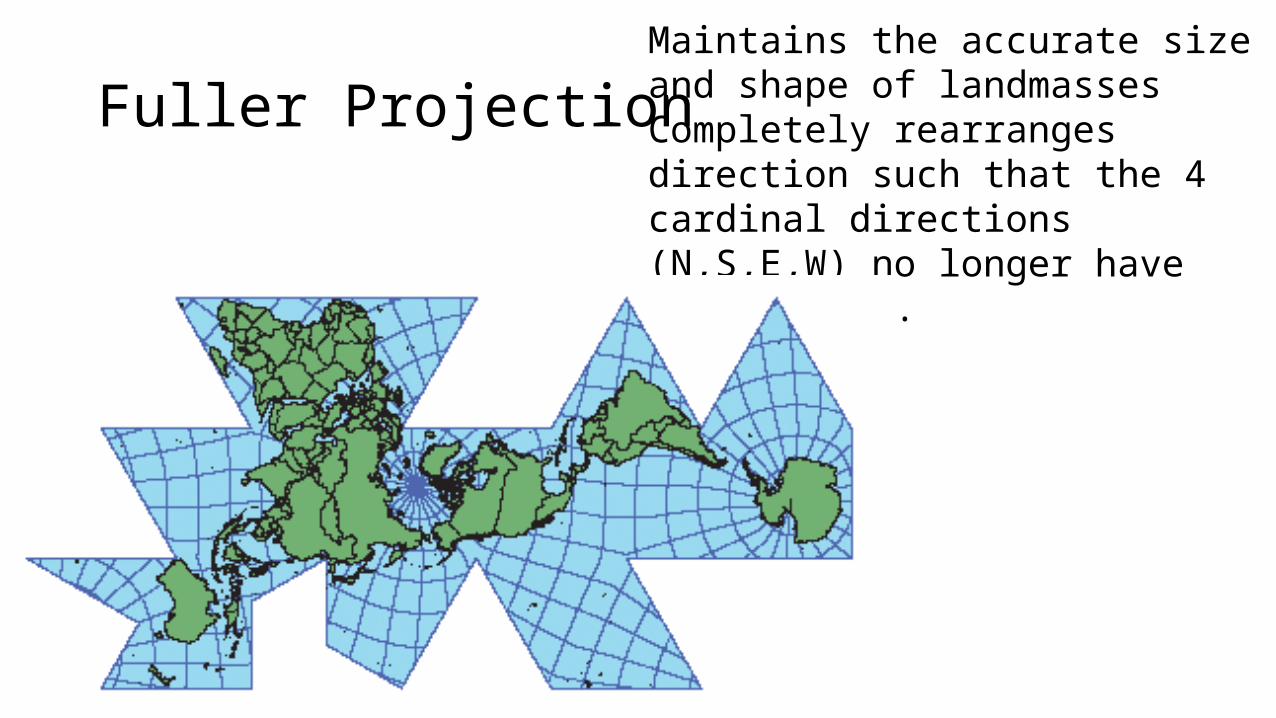
Fuller ProjectionMaintains the accurate size and shape of landmasses Completely rearranges direction such that the 4 cardinal directions (N,S,E,W) no longer have any meaning.
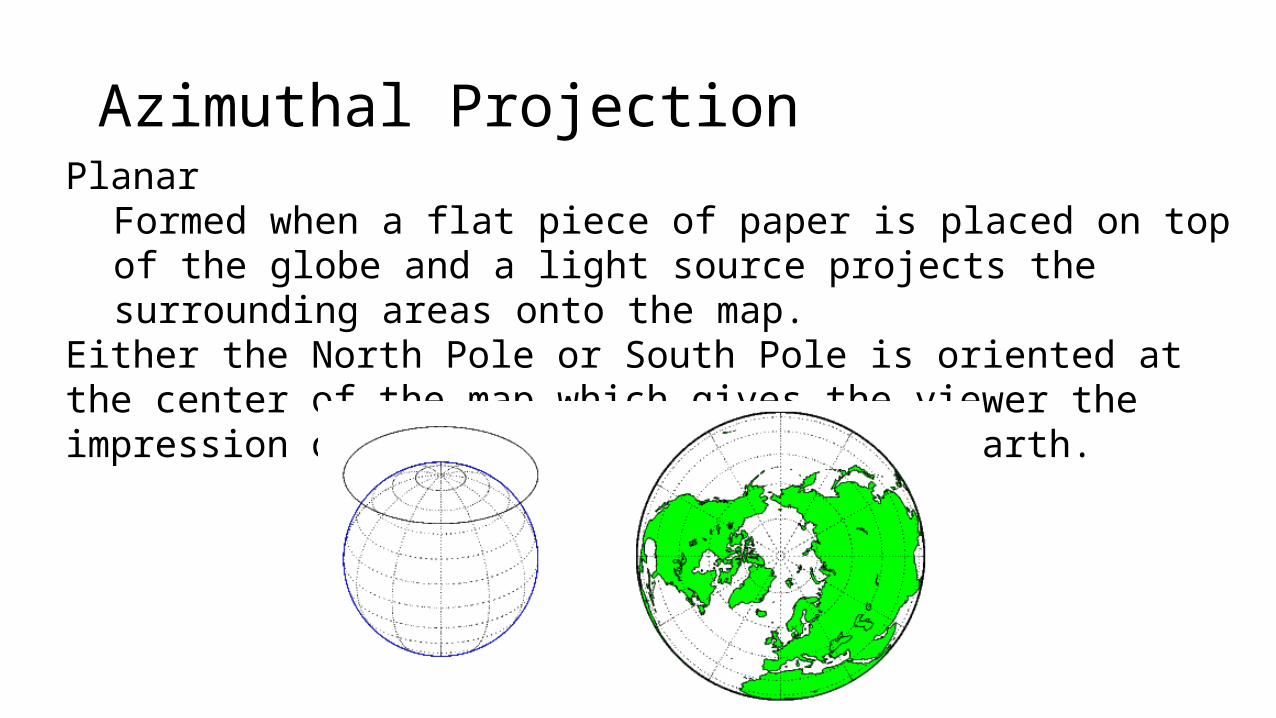
Azimuthal ProjectionPlanar
Formed when a flat piece of paper is placed on top of the globe and a light source projects the surrounding areas onto the map.
Either the North Pole or South Pole is oriented at the center of the map which gives the viewer the impression of looking up or down at the earth.
Robinson Projection• Attempts to balance
several possible projection errors.
• Does not maintain completely accurate area, shape, distance, or direction, but it minimizes errors in each.
• Used by National Geographic

https://www.youtube.com/watch?v=n8zBC2dvERM
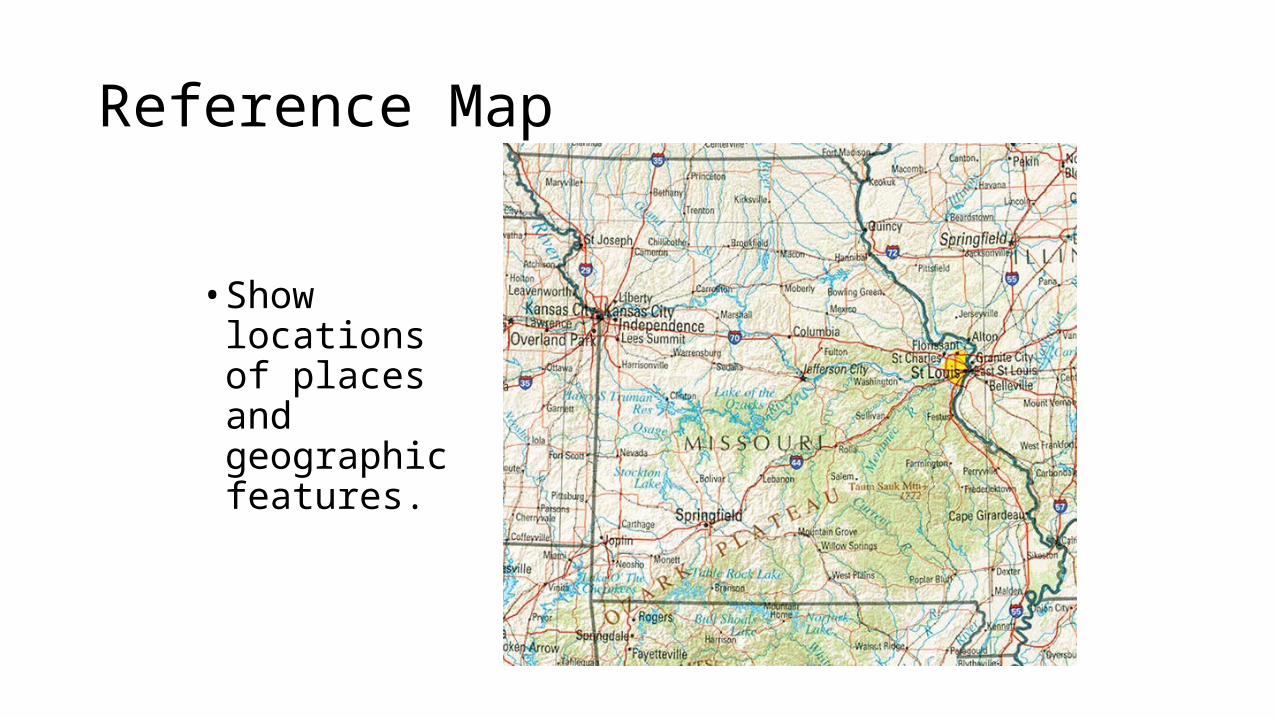
Reference Map
• Show locations of places and geographic features.
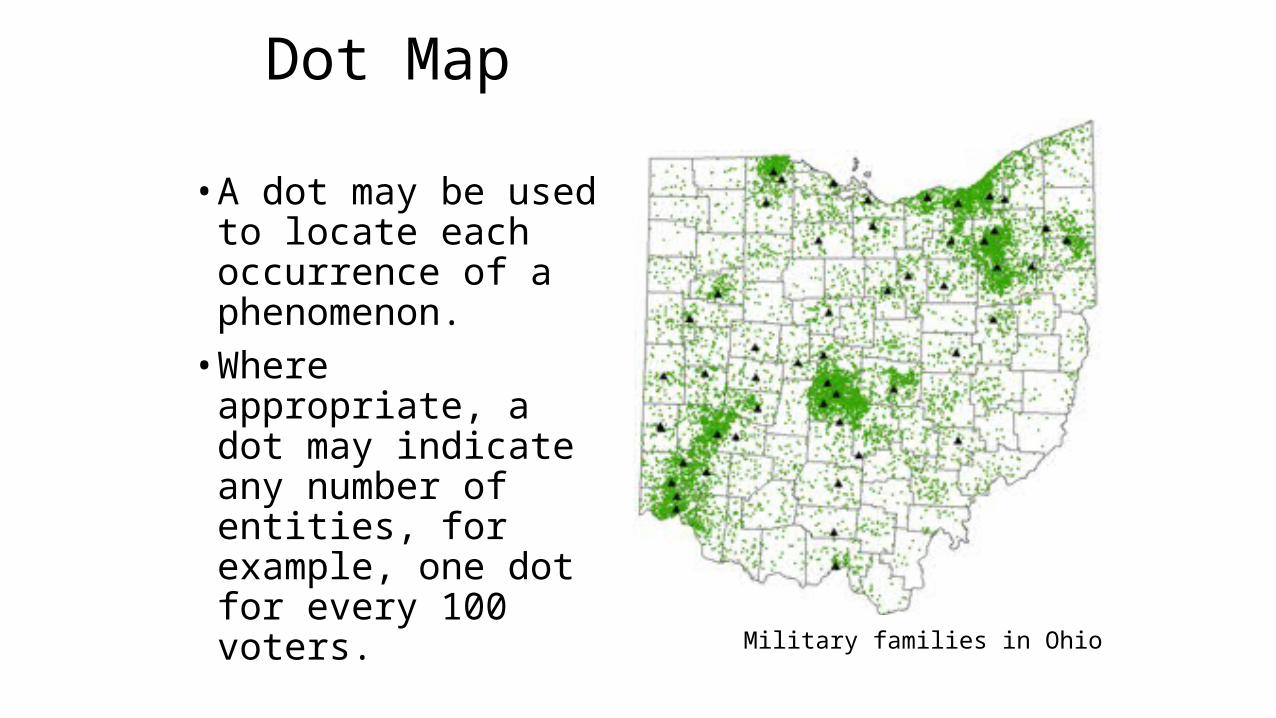
• A dot may be used to locate each occurrence of a phenomenon.
• Where appropriate, a dot may indicate any number of entities, for example, one dot for every 100 voters.
Dot Map
Military families in Ohio
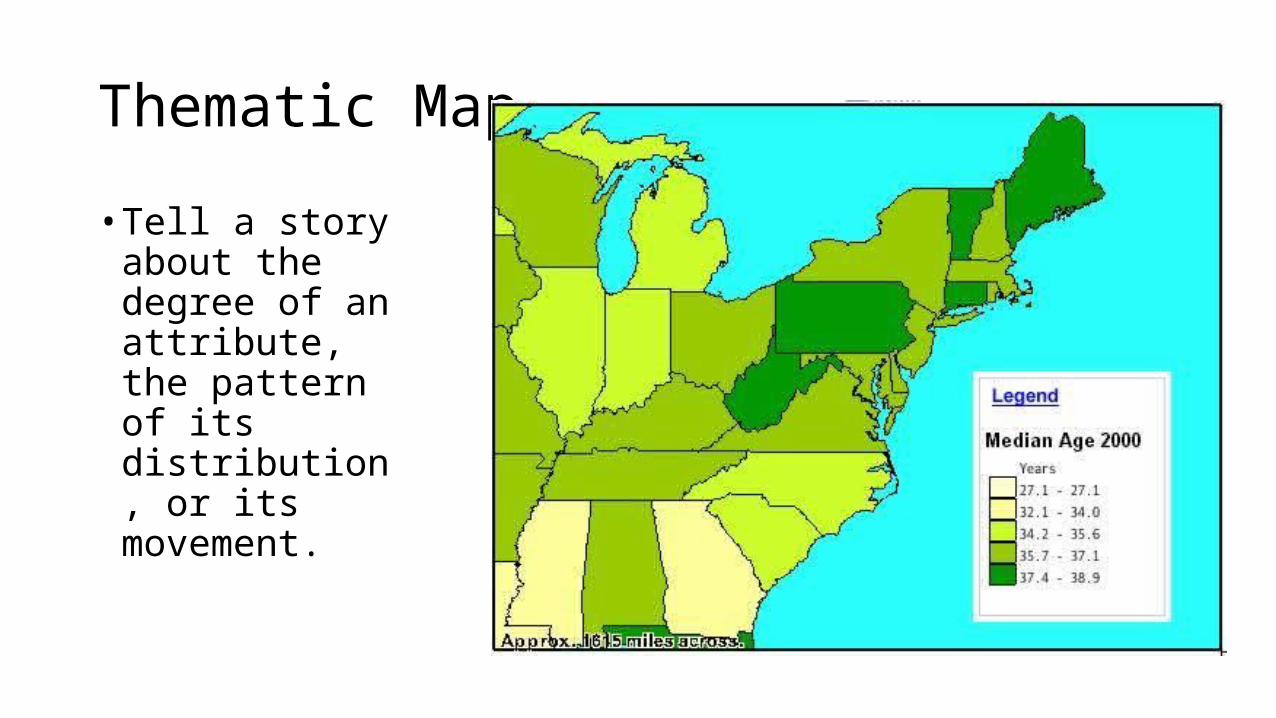
Thematic Map
• Tell a story about the degree of an attribute, the pattern of its distribution, or its movement.
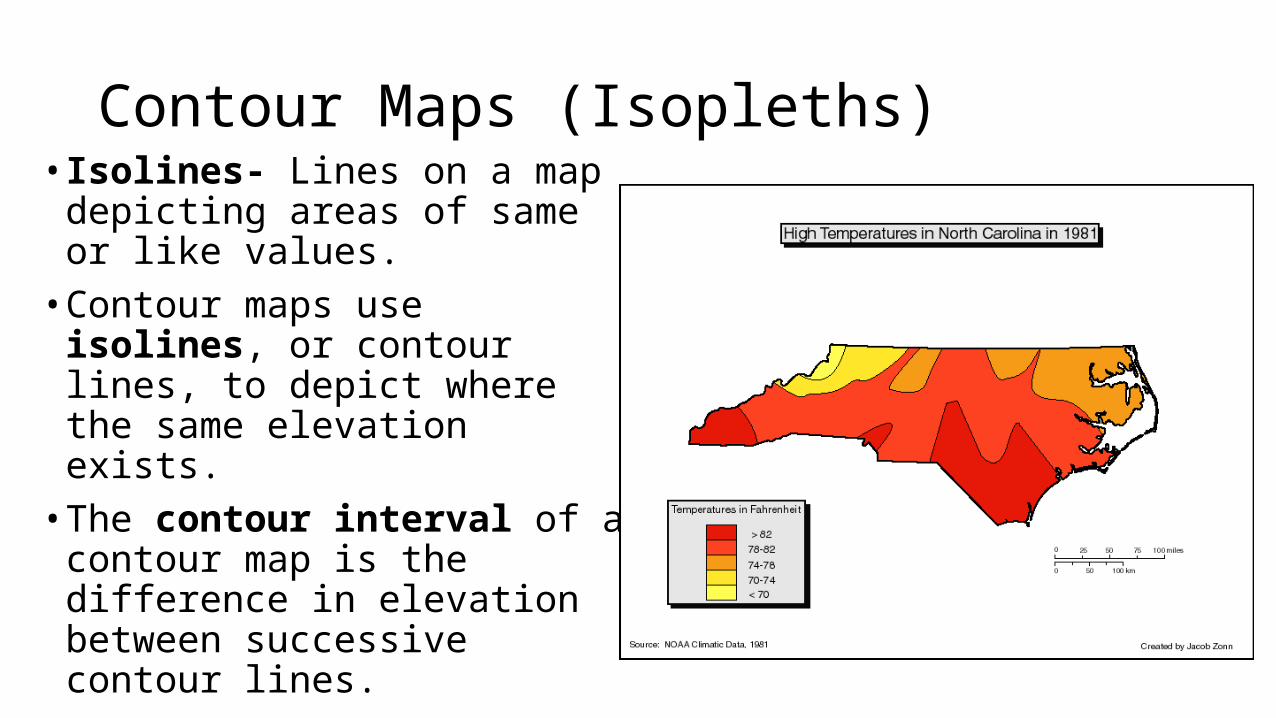
Contour Maps (Isopleths)• Isolines- Lines on a map depicting
areas of same or like values. • Contour maps use isolines, or
contour lines, to depict where the same elevation exists.
• The contour interval of a contour map is the difference in elevation between successive contour lines.
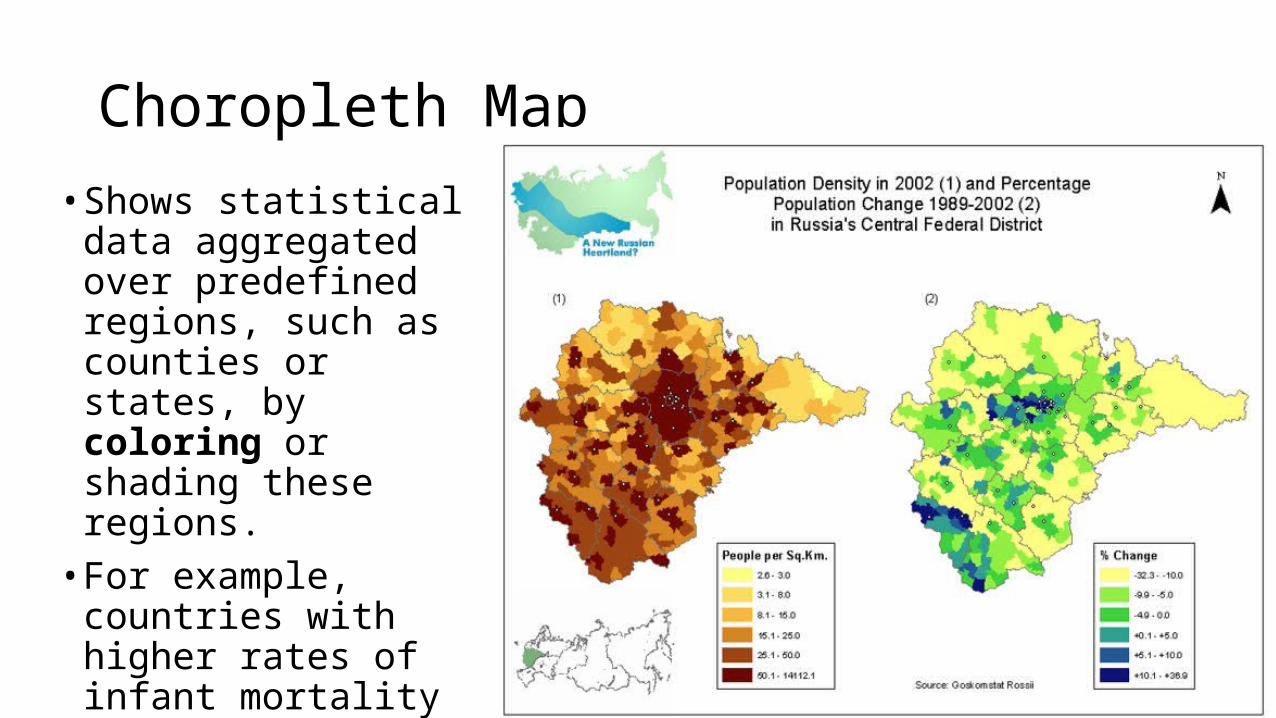
Choropleth Map
• Shows statistical data aggregated over predefined regions, such as counties or states, by coloring or shading these regions.
• For example, countries with higher rates of infant mortality might appear darker on a choropleth map.
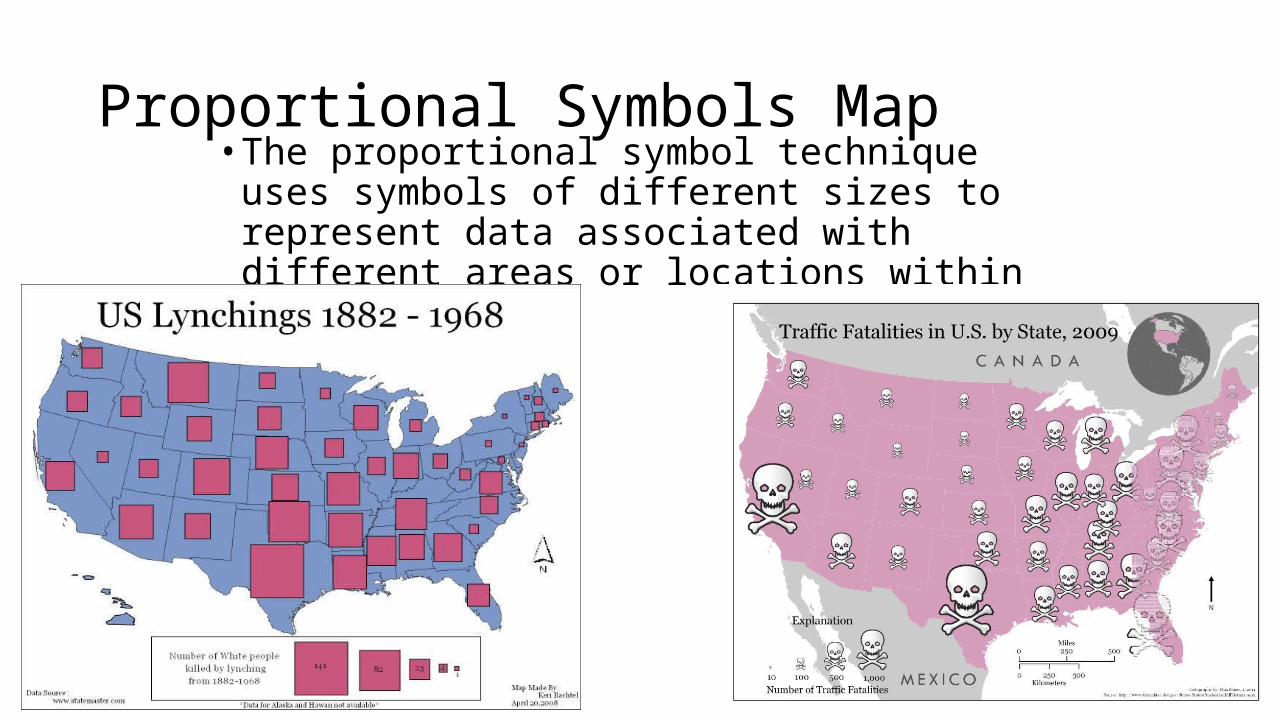
Proportional Symbols Map• The proportional symbol technique uses symbols of
different sizes to represent data associated with different areas or locations within the map.

• http://bcs.wiley.com/he-bcs/Books?action=mininav&bcsId=3206&itemId=0471701211&assetId=96271&resourceId=8133&newwindow=true
Displaying the same geographical features at various scales may also
depict misleading results.
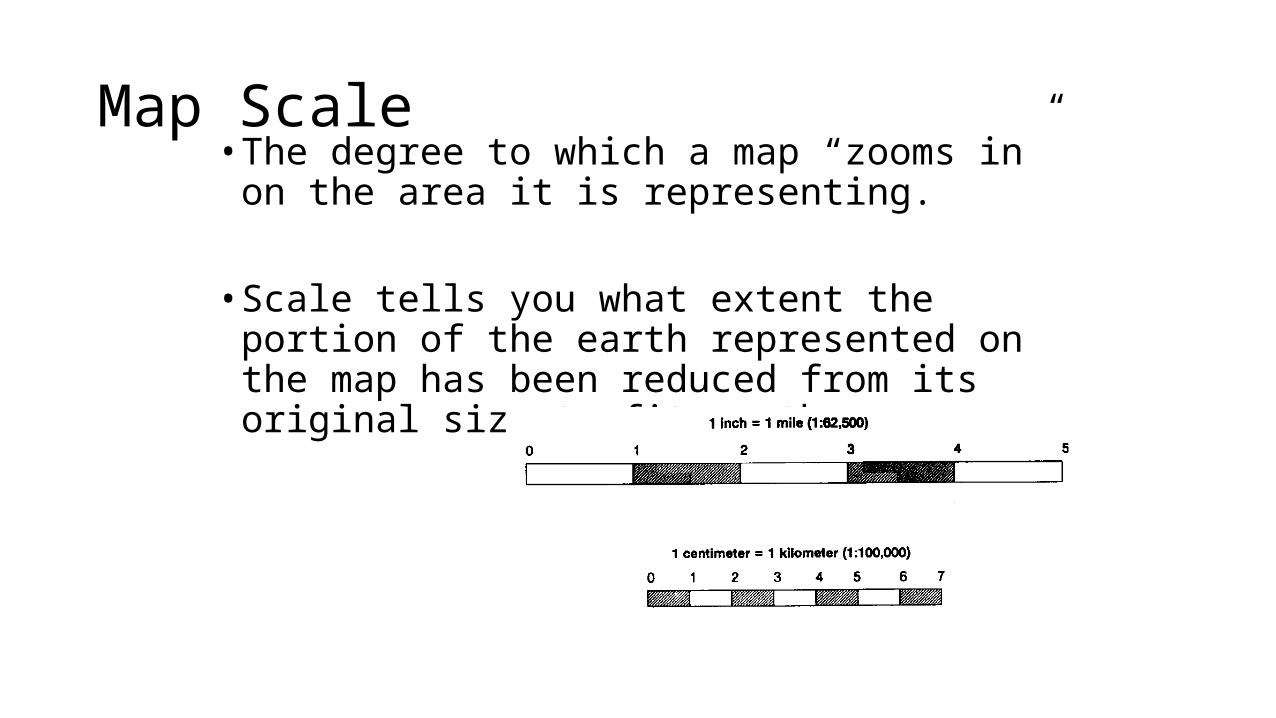
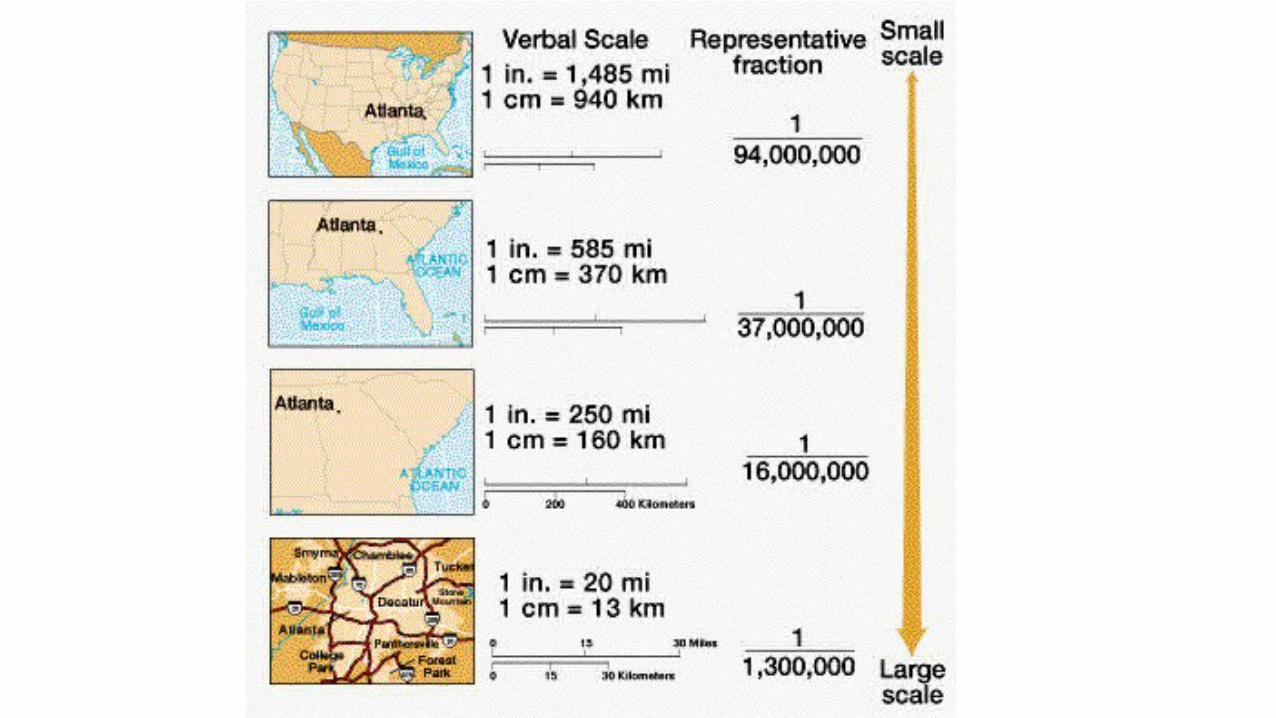
Map Scale• The degree to which a map “zooms in” on the area it
is representing.
• Scale tells you what extent the portion of the earth represented on the map has been reduced from its original size to fit on the map.
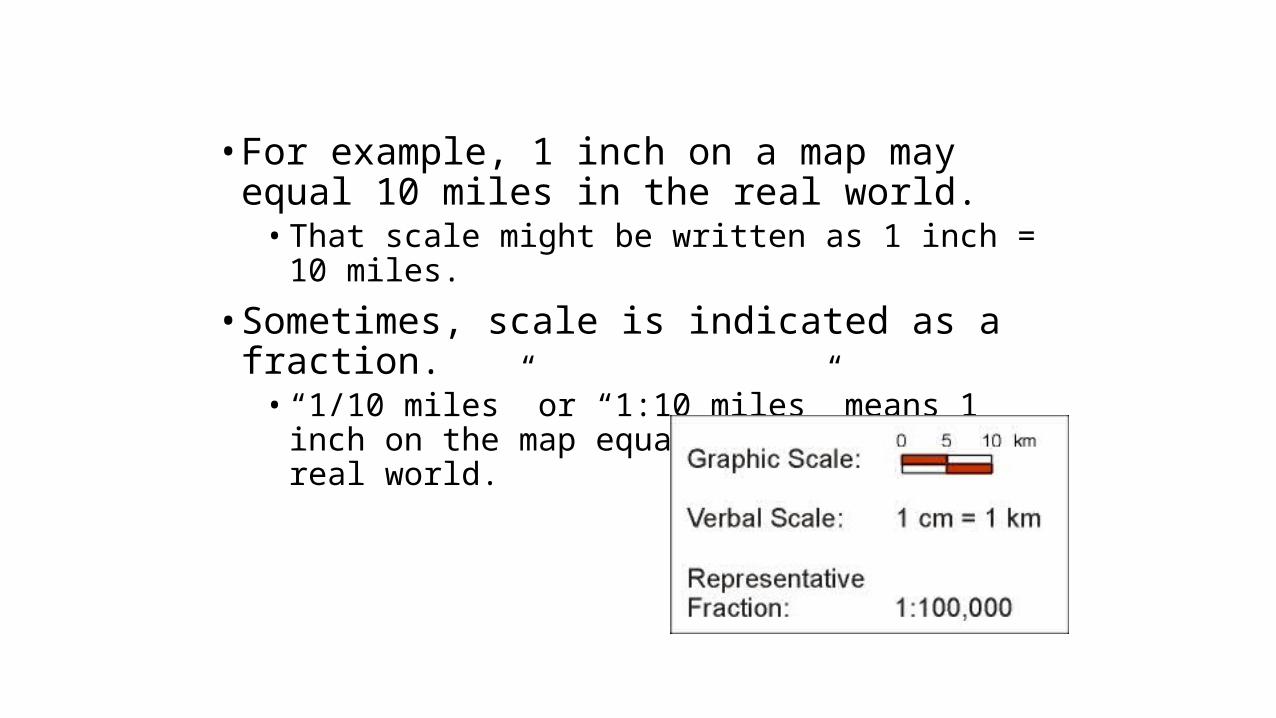
• For example, 1 inch on a map may equal 10 miles in the real world.
• That scale might be written as 1 inch = 10 miles.
• Sometimes, scale is indicated as a fraction. • “1/10 miles” or “1:10 miles” means 1 inch on the map
equals 10 miles in the real world.
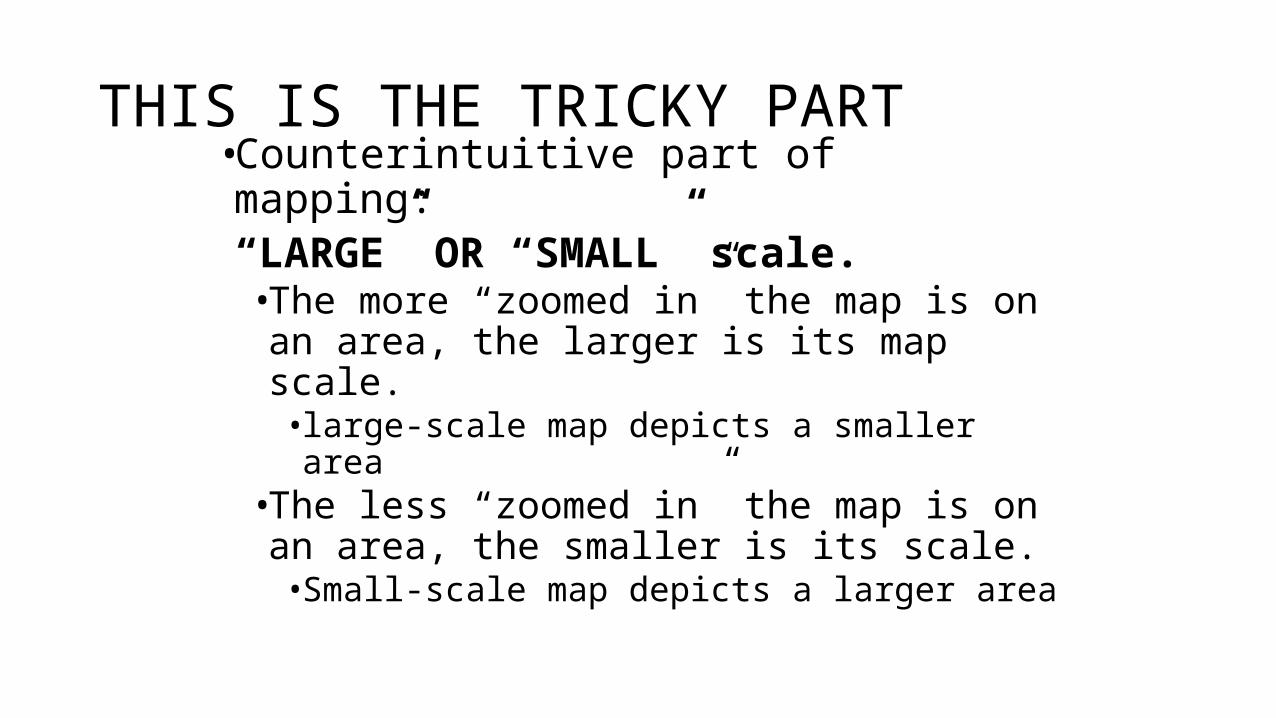
THIS IS THE TRICKY PART•Counterintuitive part of mapping: “LARGE” OR “SMALL” scale.• The more “zoomed in” the map is on
an area, the larger is its map scale.• large-scale map depicts a smaller area
• The less “zoomed in” the map is on an area, the smaller is its scale.• Small-scale map depicts a larger area
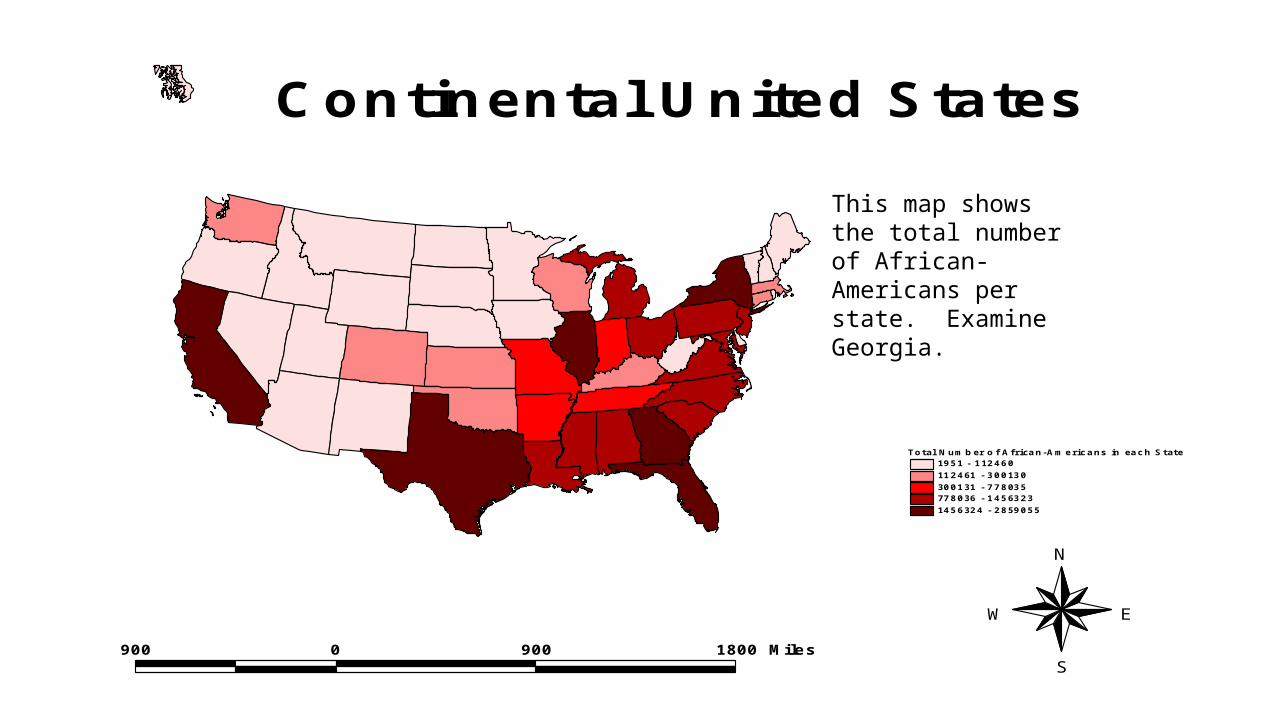
Total Number of African-Americans in each State1951 - 112460112461 - 300130300131 - 778035778036 - 14563231456324 - 2859055
900 0 900 1800 Miles
N
EW
S
Continental United States
This map shows the total number of African-Americans per state. Examine Georgia.

Number of African-Americans per County0 - 47914792 - 1219412195 - 2424124242 - 8260882609 - 324008
100 0 100 200 Miles
N
EW
S
GeorgiaIn the previous slide, Georgia had one of the highest number of African-Americans, but a closer look tells a different picture. The dark red is the Atlanta metropolitan area.

Percentage of African-Americans-99-99 - 13.5813.58 - 38.6638.66 - 75.175.1 - 99.76
Counties.shp
States.shp
60 0 60 120 Miles
Metropolitan Counties of Atlanta
Using Census Tracts of the Atlanta Metropolitan Area, a different scale gives different results.
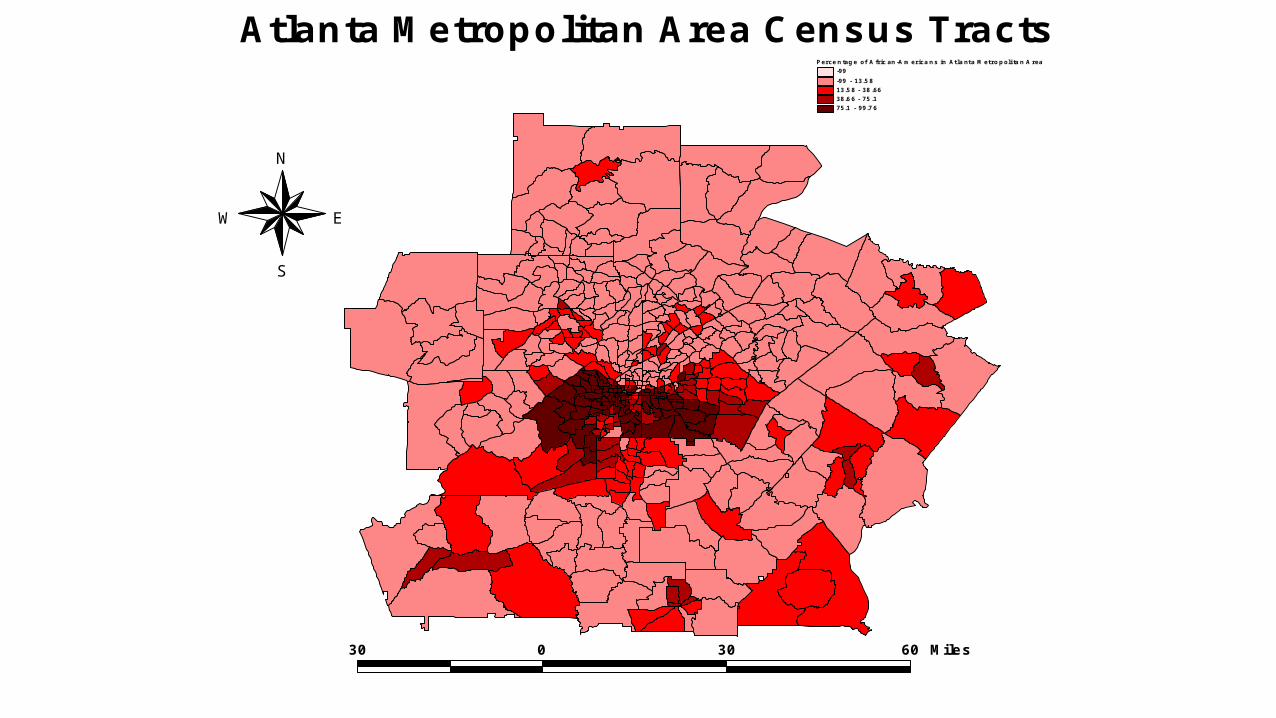
Percentage of African-Americans in Atlanta Metropolitan Area-99-99 - 13.5813.58 - 38.6638.66 - 75.175.1 - 99.76
30 0 30 60 Miles
N
EW
S
Atlanta Metropolitan Area Census Tracts
Data may also distort desired results. The following slides show how population of a particular cohort may be misleading.
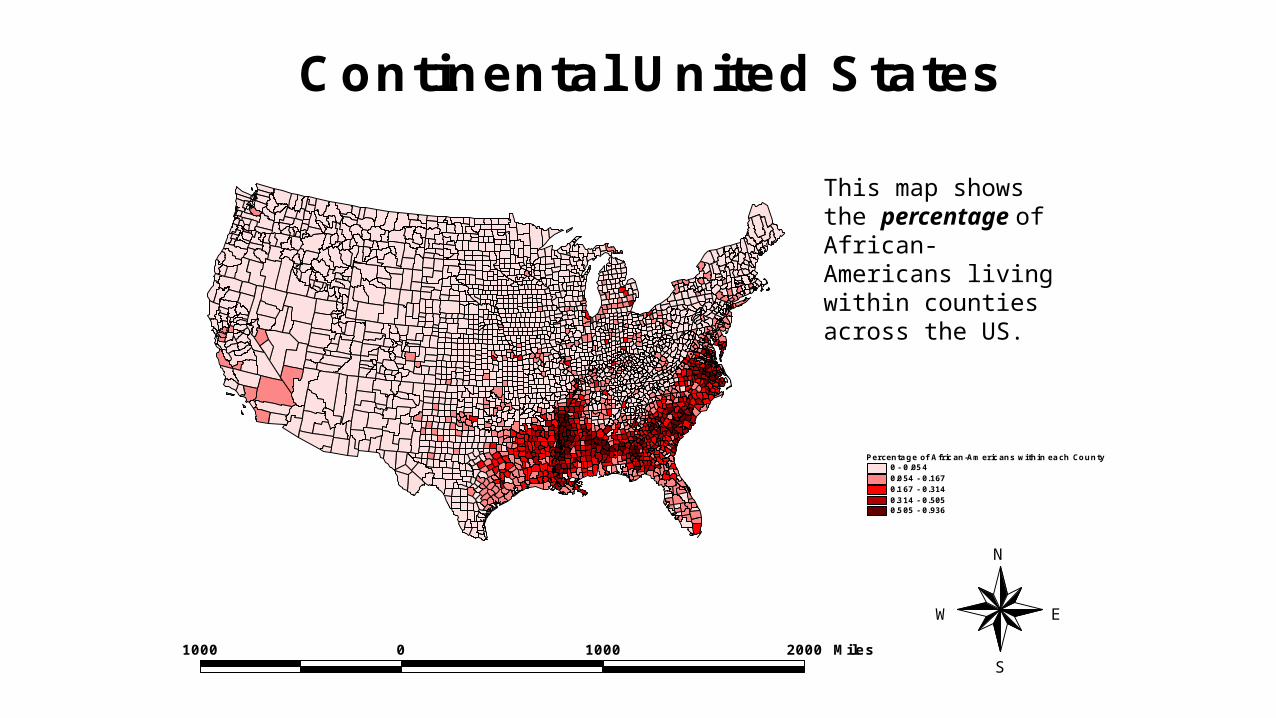
Percentage of African-Americans within each County0 - 0.0540.054 - 0.1670.167 - 0.3140.314 - 0.5050.505 - 0.936
1000 0 1000 2000 Miles
N
EW
S
Continental United States
This map shows the percentage of African-Americans living within counties across the US.
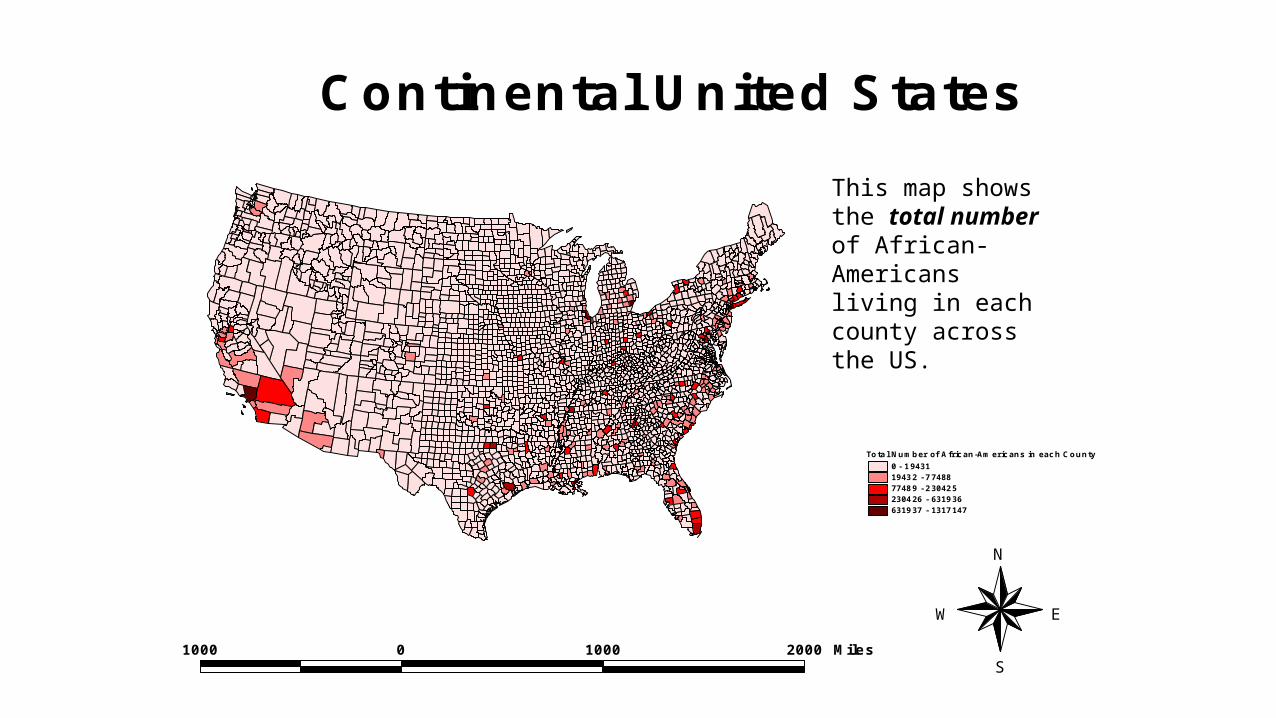
Total Number of African-Americans in each County0 - 1943119432 - 7748877489 - 230425230426 - 631936631937 - 1317147
1000 0 1000 2000 Miles
N
EW
S
Continental United States
This map shows the total number of African-Americans living in each county across the US.
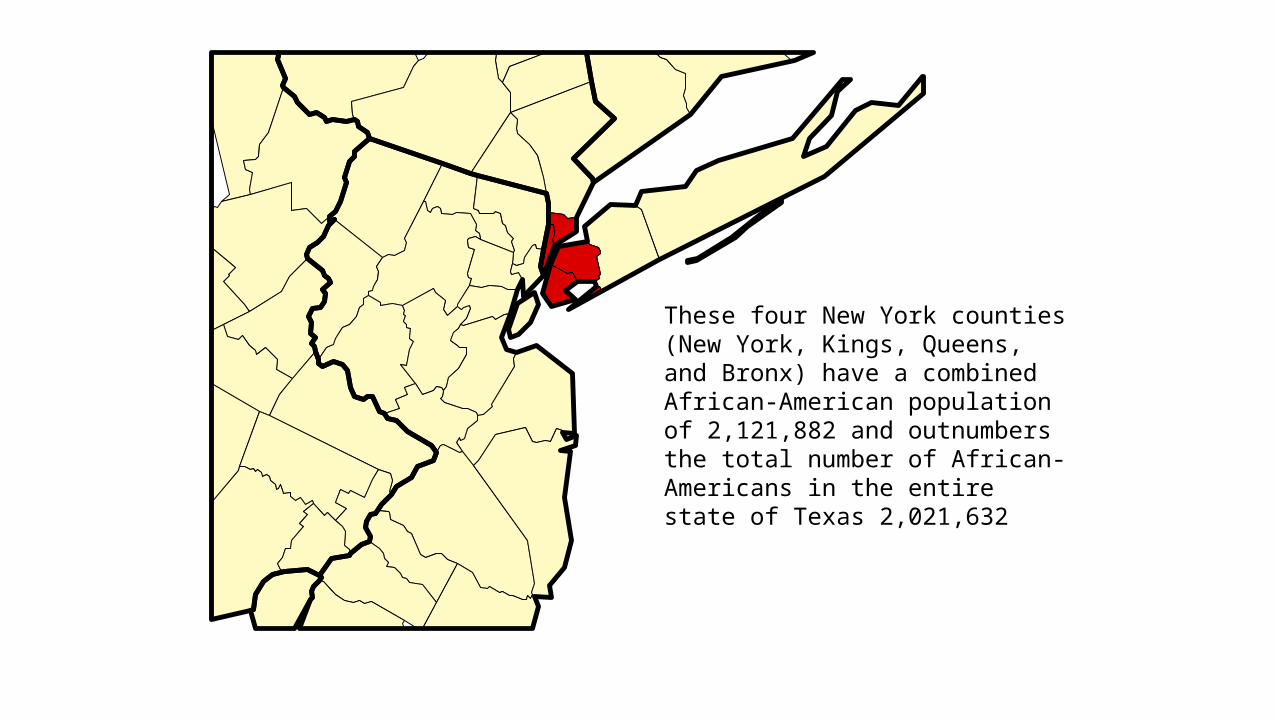
These four New York counties (New York, Kings, Queens, and Bronx) have a combined African-American population of 2,121,882 and outnumbers the total number of African-Americans in the entire state of Texas 2,021,632


![LANDFORM CLASSIFICATION AND ITS APPLICATION IN … · Landform units have been used as basic georelief descriptors in soil and vegetation mapping [18, 4] for a relatively long time.](https://static.fdocuments.us/doc/165x107/5f4fc1584f7ee7662f43fd5d/landform-classification-and-its-application-in-landform-units-have-been-used-as.jpg)