
Regional variations in the health, environmental, and climate … · Regional variations in the...
6
Regional variations in the health, environmental, and climate benefits of wind and solar generation Kyle Siler-Evans a , Inês Lima Azevedo a,1 , M. Granger Morgan a , and Jay Apt a,b a Engineering and Public Policy and b Tepper School of Business, Carnegie Mellon University, Pittsburgh, PA 15213 Edited by Edward L. Miles, University of Washington, Seattle, WA, and approved May 15, 2013 (received for review December 19, 2012) When wind or solar energy displace conventional generation, the reduction in emissions varies dramatically across the United States. Although the Southwest has the greatest solar resource, a solar panel in New Jersey displaces significantly more sulfur dioxide, nitrogen oxides, and particulate matter than a panel in Arizona, resulting in 15 times more health and environmental benefits. A wind turbine in West Virginia displaces twice as much carbon dioxide as the same turbine in California. Depending on location, we estimate that the combined health, environmental, and climate benefits from wind or solar range from $10/MWh to $100/MWh, and the sites with the highest energy output do not yield the greatest social benefits in many cases. We estimate that the social benefits from existing wind farms are roughly 60% higher than the cost of the Production Tax Credit, an important federal subsidy for wind energy. However, that same investment could achieve greater health, environmental, and climate benefits if it were differentiated by region. externalities | renewable electricity | renewable energy policy | air pollution W ind and solar power provide health, environmental, and climate benefits by displacing conventional generators and therefore reducing emissions of carbon dioxide (CO 2 ) and criteria air pollutants, which include sulfur dioxide (SO 2 ), nitrogen oxides (NO x ), and fine particulate matter (PM 2.5 ). It is natural to think that the windiest or sunniest sites will yield the best performance. However, the reduction in emissions resulting from wind or solar depends not only on the energy produced but also on the con- ventional generators displaced, and that varies dramatically de- pending on location. Previous research has explored the emissions implications of renewable energy (1–7). The US Department of Energy estimates that achieving 20% wind penetration in the United States would reduce CO 2 emissions by 825 million metric tons by 2030 (1). Valenteno et al. (2) estimate the avoided emissions resulting from wind energy in Illinois, with a focus on the effects of additional cycling of conventional power plants. The study finds that 10% wind penetration would result in a 12% reduction in CO 2 emissions, 13% reduction in NO x , 8% reduction in SO 2 , and an 11% reduction in PM. Lu et al. (3) estimate that the CO 2 reductions resulting from 30% wind penetration in Texas would cost approximately $20 per ton avoided. Kaffine et al. (4) estimate the emissions savings from wind energy for three regions of the United States. The study concludes that “emissions reductions in the Upper Midwest roughly cover government subsidies for wind generation, [while] environ- mental benefits in Texas and California fall short.” These studies vary greatly in the methods and assumptions used, the regions and pollutants covered, and the metrics reported, all of which prevent meaningful comparisons among studies. This work provides a systematic assessment of wind and solar energy across the United States. We estimate the monetized social benefits re- sulting from emissions reductions, and we explicitly consider dif- ferences in energy production, climate benefits from displaced CO 2 emissions, and health and environmental benefits from displaced SO 2 , NO x , and PM 2.5 . In addition, we compare the social benefits from existing wind farms with the cost of the Production Tax Credit, an important federal subsidy for wind energy. Results We evaluate a Vestas V90-3.0-MW wind turbine at more than 33,000 locations and a 1-kW photovoltaic (PV) solar panel at more than 900 locations across the United States. We assume that wind and solar displace the damages from marginal electricity production, which varies regionally and temporally. Damages from CO 2 emis- sions are monetized using a social cost of $20 per ton of CO 2 . Location-specific damages from SO 2 , NO x , and PM 2.5 emissions are adopted from the Air Pollution Emission Experiments and Policy (APEEP) analysis model, which values mortality from air pollution at $6 million per life lost (often termed the value of a statistical life) (8). For more than 1,400 fossil-fueled power plants, dollar-per-ton damage values for each pollutant are combined with plant-level emissions data to estimate the health, environmental, and climate damages for each hour from 2009 through 2011. Finally, we use regressions of measured hourly emissions and generation data to estimate the reduction in damages that occurs when conventional generators are displaced by wind or solar. To account for regional differences, regressions are performed separately for the 22 subregions defined in the Emissions and Generation Resource Integrated Database (eGRID). eGRID subregions were created by the US Environmental Protection Agency (EPA) using Power Control Areas as a guide. Although not perfect, they provide an estimate for the group of plants serving loads within a region (9). Results are presented in Fig. 1. For both wind (Fig. 1 A–C) and solar (Fig. 1 D–F), we consider three measures of performance: capacity factor, which is the ratio of the annual energy production to the maximum energy production at full-power operation (Fig. 1 A and D); annual avoided CO 2 emissions (Fig. 1 B and E); and annual health and environmental benefits from displaced SO 2 , NO x , and PM 2.5 emissions (Fig. 1 C and F). For consistency, we provide all results on a per-kilowatt-installed or per-megawatt- hour basis. All monetary values are in 2010 dollars. Social Benefits of Wind Energy. From an energy standpoint, wind turbines perform best in the Great Plains south through west Texas, where capacity factors can exceed 40%. The wind re- source is poor in much of the West and moderate in much of the East. It is also poor in the Southeast, which is excluded from our assessment owing to data limitations (Fig. S1). We report two metrics for reductions in CO 2 emissions— kilograms of CO 2 avoided annually and the corresponding social benefits, assuming a social cost of $20 per ton of CO 2 . Wind turbines are most effective at displacing CO 2 emissions when located in the Midwest, where the wind resource is excellent and Author contributions: K.S.-E., I.L.A., M.G.M., and J.A. designed research; K.S.-E. performed research; and K.S.-E., I.L.A., M.G.M., and J.A. wrote the paper. The authors declare no conflict of interest. This article is a PNAS Direct Submission. Data deposition: A spreadsheet of the full results reported in this paper for both wind and solar is available at http://cedmcenter.org/tools-for-cedm/marginal-emissions-factors-repository/. See Commentary on page 11666. 1 To whom correspondence should be addressed. E-mail: [email protected]. This article contains supporting information online at www.pnas.org/lookup/suppl/doi:10. 1073/pnas.1221978110/-/DCSupplemental. 11768–11773 | PNAS | July 16, 2013 | vol. 110 | no. 29 www.pnas.org/cgi/doi/10.1073/pnas.1221978110
Transcript of Regional variations in the health, environmental, and climate … · Regional variations in the...
Regional variations in the health, environmental,and climate benefits of wind and solar generationKyle Siler-Evansa, Inês Lima Azevedoa,1, M. Granger Morgana, and Jay Apta,b
aEngineering and Public Policy and bTepper School of Business, Carnegie Mellon University, Pittsburgh, PA 15213
Edited by Edward L. Miles, University of Washington, Seattle, WA, and approved May 15, 2013 (received for review December 19, 2012)
When wind or solar energy displace conventional generation, thereduction in emissions varies dramatically across the United States.Although the Southwest has the greatest solar resource, a solar panelin New Jersey displaces significantly more sulfur dioxide, nitrogenoxides, and particulatematter than a panel in Arizona, resulting in 15times more health and environmental benefits. A wind turbine inWest Virginia displaces twice as much carbon dioxide as the sameturbine in California. Depending on location, we estimate that thecombined health, environmental, and climate benefits from wind orsolar range from $10/MWh to $100/MWh, and the sites with thehighest energy output do not yield the greatest social benefits inmany cases. We estimate that the social benefits from existing windfarms are roughly 60% higher than the cost of the Production TaxCredit, an important federal subsidy for wind energy. However, thatsame investment could achieve greater health, environmental, andclimate benefits if it were differentiated by region.
externalities | renewable electricity | renewable energy policy |air pollution
Wind and solar power provide health, environmental, andclimate benefits by displacing conventional generators and
therefore reducing emissions of carbon dioxide (CO2) and criteriaair pollutants, which include sulfur dioxide (SO2), nitrogen oxides(NOx), and fine particulate matter (PM2.5). It is natural to thinkthat the windiest or sunniest sites will yield the best performance.However, the reduction in emissions resulting from wind or solardepends not only on the energy produced but also on the con-ventional generators displaced, and that varies dramatically de-pending on location.Previous research has explored the emissions implications of
renewable energy (1–7). The US Department of Energy estimatesthat achieving 20% wind penetration in the United States wouldreduce CO2 emissions by 825 million metric tons by 2030 (1).Valenteno et al. (2) estimate the avoided emissions resulting fromwind energy in Illinois, with a focus on the effects of additionalcycling of conventional power plants. The study finds that 10%wind penetrationwould result in a 12% reduction inCO2 emissions,13% reduction inNOx, 8% reduction in SO2, and an 11% reductionin PM. Lu et al. (3) estimate that the CO2 reductions resulting from30% wind penetration in Texas would cost approximately $20 perton avoided. Kaffine et al. (4) estimate the emissions savings fromwind energy for three regions of the United States. The studyconcludes that “emissions reductions in theUpperMidwest roughlycover government subsidies for wind generation, [while] environ-mental benefits in Texas and California fall short.”These studies vary greatly in the methods and assumptions used,
the regions and pollutants covered, and the metrics reported, all ofwhich prevent meaningful comparisons among studies. This workprovides a systematic assessment of wind and solar energy acrossthe United States. We estimate the monetized social benefits re-sulting from emissions reductions, and we explicitly consider dif-ferences in energy production, climate benefits from displaced CO2emissions, and health and environmental benefits from displacedSO2, NOx, and PM2.5. In addition, we compare the social benefitsfrom existing wind farms with the cost of the Production TaxCredit, an important federal subsidy for wind energy.
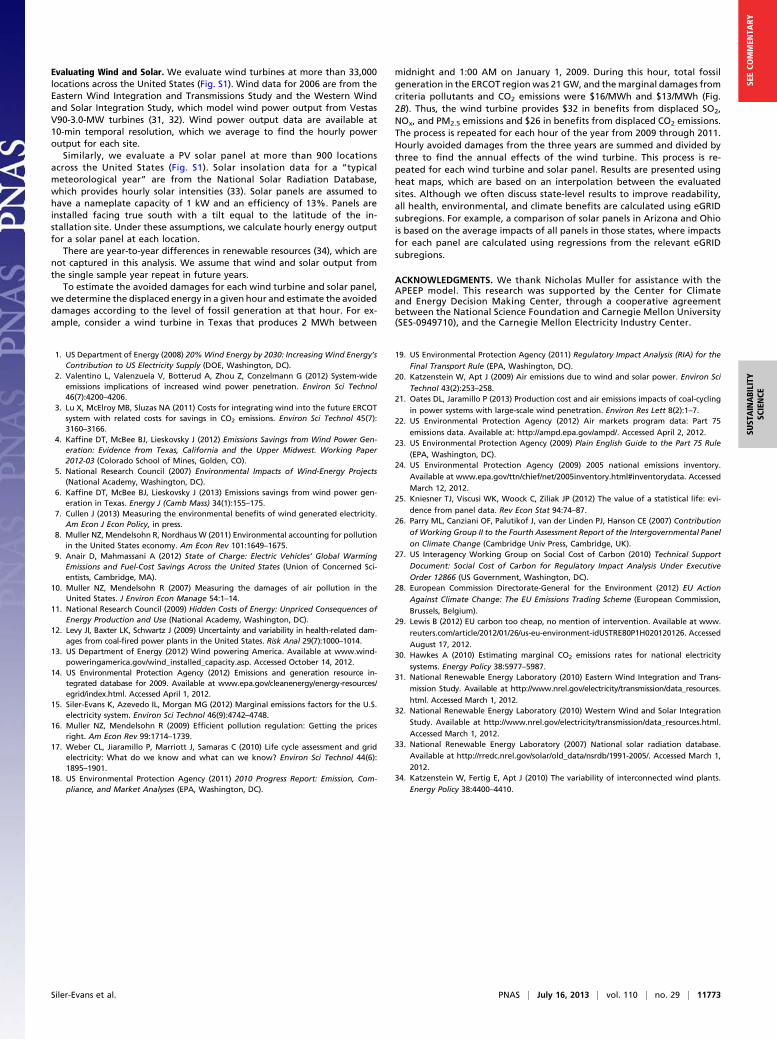
ResultsWe evaluate a Vestas V90-3.0-MW wind turbine at more than33,000 locations and a 1-kW photovoltaic (PV) solar panel at morethan 900 locations across the United States. We assume that windand solar displace the damages frommarginal electricity production,which varies regionally and temporally. Damages from CO2 emis-sions are monetized using a social cost of $20 per ton of CO2.Location-specific damages from SO2, NOx, and PM2.5 emissions areadopted from the Air Pollution Emission Experiments and Policy(APEEP) analysis model, which values mortality from air pollutionat $6 million per life lost (often termed the value of a statistical life)(8). For more than 1,400 fossil-fueled power plants, dollar-per-tondamage values for each pollutant are combined with plant-levelemissions data to estimate the health, environmental, and climatedamages for each hour from 2009 through 2011. Finally, we useregressions of measured hourly emissions and generation data toestimate the reduction in damages that occurs when conventionalgenerators are displaced by wind or solar. To account for regionaldifferences, regressions are performed separately for the 22subregions defined in the Emissions and Generation ResourceIntegrated Database (eGRID). eGRID subregions were createdby the US Environmental Protection Agency (EPA) using PowerControl Areas as a guide. Although not perfect, they provide anestimate for the group of plants serving loads within a region (9).Results are presented in Fig. 1. For both wind (Fig. 1 A–C) and
solar (Fig. 1 D–F), we consider three measures of performance:capacity factor, which is the ratio of the annual energy productionto themaximum energy production at full-power operation (Fig. 1A and D); annual avoided CO2 emissions (Fig. 1 B and E); andannual health and environmental benefits from displaced SO2,NOx, and PM2.5 emissions (Fig. 1 C and F). For consistency, weprovide all results on a per-kilowatt-installed or per-megawatt-hour basis. All monetary values are in 2010 dollars.
Social Benefits of Wind Energy. From an energy standpoint, windturbines perform best in the Great Plains south through westTexas, where capacity factors can exceed 40%. The wind re-source is poor in much of the West and moderate in much of theEast. It is also poor in the Southeast, which is excluded from ourassessment owing to data limitations (Fig. S1).We report two metrics for reductions in CO2 emissions—
kilograms of CO2 avoided annually and the corresponding socialbenefits, assuming a social cost of $20 per ton of CO2. Windturbines are most effective at displacing CO2 emissions whenlocated in the Midwest, where the wind resource is excellent and
Author contributions: K.S.-E., I.L.A., M.G.M., and J.A. designed research; K.S.-E. performedresearch; and K.S.-E., I.L.A., M.G.M., and J.A. wrote the paper.
The authors declare no conflict of interest.
This article is a PNAS Direct Submission.
Data deposition: A spreadsheet of the full results reported in this paper for bothwind and solaris available at http://cedmcenter.org/tools-for-cedm/marginal-emissions-factors-repository/.
See Commentary on page 11666.1To whom correspondence should be addressed. E-mail: [email protected].
This article contains supporting information online at www.pnas.org/lookup/suppl/doi:10.1073/pnas.1221978110/-/DCSupplemental.
11768–11773 | PNAS | July 16, 2013 | vol. 110 | no. 29 www.pnas.org/cgi/doi/10.1073/pnas.1221978110
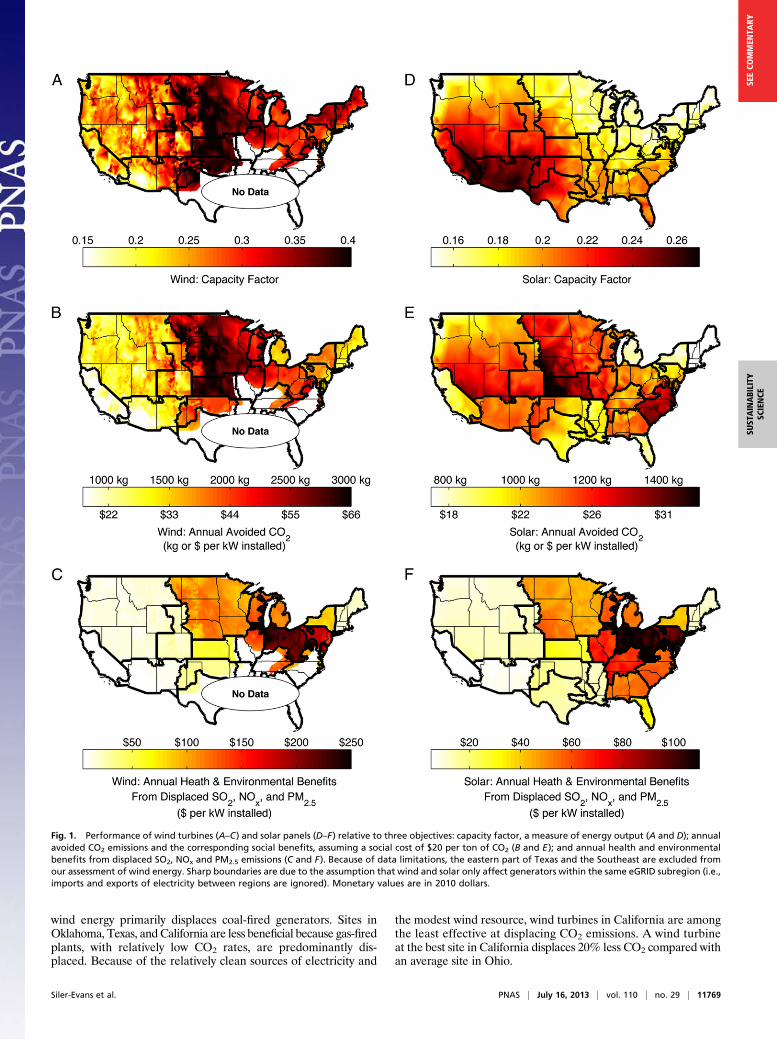
wind energy primarily displaces coal-fired generators. Sites inOklahoma, Texas, and California are less beneficial because gas-firedplants, with relatively low CO2 rates, are predominantly dis-placed. Because of the relatively clean sources of electricity and
the modest wind resource, wind turbines in California are amongthe least effective at displacing CO2 emissions. A wind turbineat the best site in California displaces 20% less CO2 compared withan average site in Ohio.
Fig. 1. Performance of wind turbines (A–C) and solar panels (D–F) relative to three objectives: capacity factor, a measure of energy output (A and D); annualavoided CO2 emissions and the corresponding social benefits, assuming a social cost of $20 per ton of CO2 (B and E); and annual health and environmentalbenefits from displaced SO2, NOx and PM2.5 emissions (C and F). Because of data limitations, the eastern part of Texas and the Southeast are excluded fromour assessment of wind energy. Sharp boundaries are due to the assumption that wind and solar only affect generators within the same eGRID subregion (i.e.,imports and exports of electricity between regions are ignored). Monetary values are in 2010 dollars.
Siler-Evans et al. PNAS | July 16, 2013 | vol. 110 | no. 29 | 11769
SUST
AINABILITY
SCIENCE
SEECO
MMEN
TARY
Per kilowatt of installed wind capacity, the annual value ofdisplaced CO2 emissions ranges from $23 in Rhode Island to $65in Kansas, equivalent to $11/MWh and $18/MWh. Because re-sults are linearly related to the social cost of CO2, the benefits ofdisplaced emissions double if we assume costs of $40 rather than$20 per ton.Previous studies by Kaffine et al. (6) and Cullen (7) have es-
timated that wind energy in Texas displaces ∼470 and 650 kg ofCO2 per MWh, reasonably consistent with our estimate of560 kg/MWh.By displacing SO2, NOx, and PM2.5 from conventional gen-
erators, a wind turbine in West Virginia avoids $230 in health andenvironmental damages per kilowatt per year ($81/MWh)—7times more than a wind turbine in Oklahoma and 33 times morethan a wind turbine in California. Damages from SO2, NOx, andPM2.5 are dominated by human-health effects. Muller et al. (10)used the APEEP model to estimate the annual damages fromcriteria pollutants in the United States, finding that 71% of totaldamages are from premature mortality and 23% are from ill-nesses. The combined impacts from reduced visibility, agriculturaland timber losses, and degradation of materials made up only 6%of total damages. Because we value all premature deaths at $6million, and Muller et al. used life-years lost, the results presentedhere place a higher value on human mortality. As a result, human-health effects will account for a greater share of total damages.On average, wind turbines in California provide $7/kW in an-
nual health and environmental benefits from displaced SO2, NOx,and PM2.5; the same turbine in Indiana provides $245/kW in an-nual benefits ($3/MWh and $83/MWh). These regional variationsare driven by differences in the generation mix. In much of theMidwest and mid-Atlantic, wind energy primarily displaced coal-fired generators. The National Research Council found that themonetized health and environmental damages from the mediancoal-fired plant are 20 times higher compared with themedian gas-fired plant (11). Coal plants in the East are particularly harmfulowing to their proximity to major population centers (12).Under the assumptions used here, wind turbines in Indiana
provide the greatest annual health, environmental, and climatebenefits (Fig. S2)—nearly $300/kW installed ($100/MWh); dis-placed CO2 emissions account for less than 20% of the total. Bycontrast, the combined benefits from the average wind turbine inCalifornia are $32/y ($13/MWh) and displaced CO2 emissionsaccount for nearly 80% of the total.Thirty percent of existing wind capacity is installed in Texas
and California (13), where the combined health, environmental,and climate benefits from wind are among the lowest in thecountry. Less than 5% of existing wind capacity is in Indiana,Ohio, and West Virginia, where wind energy offers the greatestsocial benefits from displaced pollution.
Cost-Effectiveness of the Production Tax Credit Subsidy. As of 2009,there was ∼34,000 MW of installed wind generation in the UnitedStates, producing more than 74 million MWh of electricity an-nually (14). Assuming a social cost of carbon dioxide of $20 per tonand a value of a statistical life of $6 million, we estimate that thesewind farms provide $2.6 billion in social benefits annually, equiv-alent to $35/MWh (SI Text). The benefits are primarily from dis-placed SO2 (44%) and displaced CO2 (40%). Through theProduction Tax Credit, the federal government provides a directsubsidy of $22/MWh for wind energy. We estimate that the cost ofthe subsidy was $1.6 billion in 2009. This suggests that the Pro-duction Tax Credit is a good value for taxpayers—the socialbenefits from existing wind farms are roughly 60% higher than thecost of the subsidy. Assuming a social cost of carbon dioxide of $30per ton, CO2 reductions alone justify the cost of the tax credit forexisting wind farms.However, if health and environmental benefits are the justifi-
cation, the Production Tax Credit may over- or under-subsidize
wind energy depending on the location. For example, the com-bined health, environmental, and climate benefits from windenergy in Ohio are $100/MWh—more than four times the sub-sidy—compared with only $13/MWh in California. In addition,production-based subsidies encourage developers to seek siteswith high energy output, although electricity production may notbe the goal of taxpayers and policy makers.
Social Benefits of Solar Energy. Results for solar PV are shown inFig. 1, D–F. Energy output from solar is highest in the Southwestand lowest in New England. A solar panel in Arizona, for ex-ample, is expected to generate ∼60% more electricity than thesame panel in Maine.For a 1-kW solar panel, the annual value of displaced CO2
emissions ranges from $15 in Vermont to $30 in Kansas, equiv-alent to $11/MWh and $17/MWh. In California and the South-west, natural gas is the dominant marginal fuel and, as a result,solar panels displace relatively little CO2. Avoided CO2 emissionsare highest in Kansas, Nebraska, Virginia, and the Carolinas,where there is a moderate solar resource and a carbon-intensivesupply of electricity. The average solar panel in Nebraska dis-places 20% more CO2 than a panel in Arizona, although energyoutput from the Nebraska panel is 20% less.Solar panels in Indiana, Ohio, or West Virginia achieve signif-
icant health and environmental benefits by displacing coal-firedgenerators. Despite a poor solar resource, a 1-kW PV panel inOhio provides $105 in health and environmental benefits per year($75/MWh)—15 times more than the same panel in Arizona.Remarkably, if the goal is to improve air quality and human health,Arizona and NewMexico are among the worst locations for solar.
Comparison Between Wind and Solar. In most of the United Stateswind turbines have higher capacity factors than solar panels. Asa result, a 1-MW wind turbine will offset more health, environ-mental, and climate damages than a 1-MW solar installation (Fig.1). On a per-megawatt-hour basis, wind and solar energy mayresult in different social benefits because of temporal differences.Wind output tends to be highest late at night, when demand is lowand coal is more often on the margin (15). Solar output peaksmidday, when demand is high and gas is more often on themargin.As a result, a megawatt-hour of wind energy may displace moreemissions than a megawatt-hour of solar energy. The differencebetween wind and solar, on a per-megawatt-hour bases, is negli-gible in much of the country. In Virginia and Maryland, where thedifference is most pronounced, a megawatt-hour of wind energyresults in 30% more health, environmental, and climate benefitsthan a megawatt-hour of solar energy.
Sensitivity Analysis. If the goal of renewables is to mitigate climatechange or reduce health and environmental damages, then (i) thebenefits of wind and solar energy vary widely depending on loca-tion, and (ii) the sites with the highest energy output are not nec-essarily the best for offsetting health and environmental impacts.These conclusions hold under a wide range of assumptions. Resultsare most sensitive to the value of a statistical life, the social cost ofCO2 emissions, and the dose–response function that relates mor-tality to concentrations of fine particulate matter (16). Changes tothese assumptions affect the magnitude of our results, but the re-gional variations presented in Fig. 1 persist (Fig. S3). Regionalvariations are qualitatively consistent if we assume that wind andsolar displace the average (rather than marginal) damages fromelectricity production (Fig. S4). This verifies that the conclusions ofthis analysis do not depend on the details of the regression model.This analysis assumes that wind and solar affect only gen-
erators within the same eGRID subregion; imports and exportsof electricity from neighboring regions are ignored. We can re-duce, but not eliminate, the errors associated with this assump-tion by defining larger regions, although this may mask variations
11770 | www.pnas.org/cgi/doi/10.1073/pnas.1221978110 Siler-Evans et al.
in the generation mix (17). In SI Text we repeat the analysis usingeight regions of the North American Electric Reliability Cor-poration, rather than the 22 eGRID subregions (Fig. S5). Wefind that regional variations are qualitatively consistent.Perhaps the most important assumption in this analysis is our
treatment of displaced emissions in the eastern United States,where NOx and SO2 are regulated under cap-and-trade programs.If pollution caps are binding, total emissions remain fixed andwind or solar will not achieve a net reduction in SO2 and NOx. Insuch cases, “displaced” emissions can be valued using allowanceprices, which reflect the avoided abatement costs for generators inthe system.If pollution caps are not binding, as assumed in Fig. 1, then wind
and solar generation will reduce overall emissions, thus reducinghealth and environmental damages. Caps have not been binding inrecent years for NOx (2010) and SO2 (2008 and 2009) (18).Through the Cross-State Air Pollution Rule (CSAPR), the EPAhas proposed aggressively lower caps, although the future of theseregulations is uncertain (18).We have repeated our assessment of wind and solar under the
assumption that CSAPR takes effect. For the eastern UnitedStates, we value displaced NOx and SO2 emissions using the EPA’sprojected allowances prices for 2014 (Table S1) (19). This ap-proach changes the interpretation of the results—rather thanmeasuring the health and environmental benefits of renewables,we are estimating the cost-savings of meeting the CSAPR pollu-tion cap. For regions and pollutants unaffected by cap-and-traderegulation, we retain the original method of valuing displacedemissions using health and environmental damages.This approach significantly lowers the estimated benefits of
wind and solar in certain regions (Fig. S6). For example, in theabsence of a binding cap-and-trade program, a 1-kW solar panel inOhio is expected to yield $105 in annual benefits ($75/MWh)from displaced SO2, NOx, and PM2.5 (Fig. 1F). With CSAPR ineffect, the value falls to $20/y ($15/MWh). This difference arisesbecause health and environmental damages from SO2 emissionsare roughly 10 times higher than allowance prices, suggesting thatthe proposed SO2 cap is too lax. In economic theory, social welfareis maximized when the marginal abatement costs equal the mar-ginal social damages for a pollutant.Even using the CSAPR valuations, regional variations persist
(Fig. S6). For example, the benefits of displaced SO2, NOx, andPM2.5 for a solar panel are six times greater in New Jersey thanin Arizona, although energy output from the New Jersey panel is30% less. The details of the sensitivity analysis are presented inthe SI Text.
Large-Scale Adoption of Wind or Solar. This analysis assumes thatwind and solar displace damages from marginal electricity pro-duction. In other words, we are evaluating the benefits of a near-term, small-scale intervention. Large-scale adoption of wind orsolar will, in the short term, result in deep displacements of ex-isting generators (Fig. S7). In such cases, coal accounts for agreater share of displaced generation in most regions, resulting ineven greater reductions in pollution-related damages (Fig. S8).With increased penetration of wind or solar, conventional gen-erators may be required to cycle more often, resulting in anemissions penalty (2, 20, 21); these effects are not captured in ouranalysis. In the long-term, large-scale adoption of wind or solarwill affect investment and retirement decisions for conventionalgenerators. Although this may have a significant impact on emis-sions, a full analysis of these issues is beyond the scope of this work.The implications of large-scale interventions are discussed furtherin SI Text.
DiscussionIf the goal of renewable energy is to mitigate climate change orreduce human-health impacts, then the sites with the highest
energy output are not the best choice in many cases. We find thata solar panel in New Jersey displaces significantly more criteriapollutants than a panel in Arizona, resulting in 15 times morehealth and environmental benefits. Similarly, despite the excel-lent resource, a wind turbine on the plains of Montana displaces45% less CO2 emissions than a turbine in West Virginia. Theseresults are driven primarily by regional variations in the gener-ation mix: there are significantly greater benefits when wind orsolar displace coal- or oil-, rather than gas-fired, generators.We estimate that the social benefits of wind and solar are
more than $40/MWh in much of the United States and as high as$100/MWh in the parts of the mid-Atlantic and Midwest (Fig.S2). This suggests that appropriately valuing health, environ-mental, and climate impacts would significantly improve thecompetitiveness of wind and solar in some regions. In places likeCalifornia, given how clean the electricity mix already is, addi-tional investments in wind and solar achieve comparatively littlehealth and environmental benefits.There are also regional differences in the private costs and
benefits of renewable energy, which have not been consideredhere. Capital and labor costs, availability of transmission, and theprice of electricity all vary by location. Ultimately, the “best” sitesfor wind and solar will depend on both private and social costs.If emissions were priced at the level of social damages, either
through a tax or cap-and-trade policy, then electricity generatorsand consumers would internalize those costs. Private investorswould then choose locations for wind and solar installationsaccording to the full cost of electricity, which would account forthe regional differences illustrated above. However, the UnitedStates currently lacks a national policy covering CO2 emissions,and existing cap-and-trade programs value SO2 emissions wellbelow the level of social damages. In the absence of more com-prehensive policies, it is likely that direct subsidies for renew-ables will remain an important policy instrument.We provide a first-order evaluation of the Production Tax
Credit and conclude that the cost of the subsidy is justified ona national basis. We estimate that the social benefits from existingwind farms are ∼60% greater than the cost of the tax credit.However, we argue that nationwide production-based subsidiesare a crude policy instrument because they fail to reflect regionaldifferences in the health, environmental, and climate benefits ofrenewables. Per megawatt-hour, wind energy in Ohio offers fivetimesmore social benefits than wind energy inNewMexico, yet thetwo receive the same subsidy under the Production Tax Credit. Inaddition, production-based subsidies encourage private devel-opers to seek sites offering high energy output, although, as thisanalysis has shown, energy output is poorly aligned with health andenvironmental benefits.
Materials and MethodsTo evaluate the social benefits of wind and solar, we (i) gather emissions datafor more than 1,400 fossil-fueled power plants, (ii) estimate the health,environmental, and climate damages from those emissions, (iii) use regres-sions of hourly emissions and generation data from 2009 through 2011 toestimate the damages from marginal electricity production by region, and(iv) estimate the reduction in damages that occurs when conventionalgenerators are displaced by wind or solar. Each step is discussed below.
Emissions Data. Hourly emissions data from 2009 through 2011 are from theEPA’s Continuous Emissions Monitoring System (CEMS) (22). CEMS data in-clude generator-level SO2, NOx, and CO2 emissions, as well as gross poweroutput for fossil-fueled generators greater than 25 MW (23). We assumethat nuclear, hydroelectric, and other generators that are excluded from theCEMS database do not operate on the margin. Because nuclear providesbase-load power and hydroelectric has a very low marginal cost, neithergeneration source is likely to be displaced by wind or solar. This assumptionis discussed further by Siler-Evans et al. (15).
Annual PM2.5 emissions data by power plant are from the 2005 NationalEmissions Inventory (24). We assume that emissions are proportional to power
Siler-Evans et al. PNAS | July 16, 2013 | vol. 110 | no. 29 | 11771
SUST
AINABILITY
SCIENCE
SEECO
MMEN
TARY
output, allowing us to estimate hourly PM2.5 emissions. We divide the annualPM2.5 emissions by the annual electricity produced, giving an emissions rate foreach plant. We then multiply the emissions rate by the hourly power output(using CEMS data), which gives the hourly PM2.5 emissions from each fossil-fueled plant in the dataset. This analysis does not account for life cycle emissionsassociated with constructing power plants or extracting or delivering fuels.Plant locations and primary fuel types are from the EPA’s eGRID database (14).
Damages from Criteria Pollutants. Damages from criteria pollutants are from theAPEEP model (8), which was recently used by the National Research Council toestimate the externalities from electricity production (11). APEEP estimates thedamages from emissions of SO2, NOx, PM2.5, coarse particulate matter (PM10),volatile organic compounds (VOC), and ammonia (NH3) on a dollar-per-ton basis(8, 10, 16). Damages include human-health effects (e.g., lung cancer, bronchitis,asthma, and cardiopulmonary diseases), reduced crop and timber yields, reducedvisibility, degradation of materials, and lost recreational services.
For each source location, APEEP uses a Gaussian plume model to estimatethe dispersion of emissions and the resulting concentrations in each county.Dose–response functions are used to estimate physical effects to populationsand other receptors (crops, forests, materials, etc.). Physical effects are trans-lated to monetary values using market prices for lost commodities, costs ofillnesses, and nonmarket valuations from the literature. Monetized damagesare driven largely by the value placed on premature deaths from air pollution.The damage estimates used here value mortality at $6 million (11, 25).
Results from the APEEP model give the average, dollar-per-ton damagesfor each pollutant (SO2, NOx, PM2.5, PM10, VOCs, and NH3) emitted in each UScounty. APEEP provides separate damage estimates for point sources withlow, medium, and high effective stack heights (11). We assume a mediumeffective stack height (250–500 m) for all power plants. For each plant, wemultiply hourly emissions by the dollar-per-ton damage value for the ap-propriate county. The result is hourly damages for each pollutant from 2009through 2011 for more than 1,400 fossil-fueled power plants. VOCs, NH3,and PM10 are excluded from this analysis because they result in damagesthat are, on average, more than two orders of magnitude lower thandamages from other pollutants.
Damages from CO2 Emissions. There have been various attempts to estimatethe cost of damages arising from CO2 emissions, often termed the social costof carbon dioxide. The Intergovernmental Panel on Climate Change and theNational Research Council report values that range from $0 to more than$100 per ton of CO2 (11, 26). Using a range of assumptions, the US In-teragency Working Group on Social Cost of Carbon estimates damages of$5, $21, $35, and $65 per ton of CO2 emitted in 2010 (in 2007 dollars) (27).From 2005 through 2009, the price per ton for CO2 allowances in the Eu-ropean Union trading market averaged roughly V20 (28). More recently ithas fallen to less than half of that (29). In light of this varied evidence, weadopt a social cost of carbon dioxide of $20 per ton.
For each power plant, we multiply the hourly CO2 emissions by its socialcost to find the hourly damages from 2009 through 2011. Results are linearlyrelated to the social cost, so doubling (or halving) the assumed cost doubles(or halves) the damages resulting from CO2 emissions.
Estimating Marginal Damages from Electricity Production. Hourly damagesfrom power plants are aggregated by eGRID subregions, giving a vector ofhourly damages for 22 regions and four pollutants (SO2, NOx, PM2.5, andCO2). Similarly, we aggregate hourly gross generation from fossil-fueledpower plants in each region. We then calculate the change in total fossilgeneration (G) and change in damages (D) between one hour (h) and thenext for each eGRID subregion (r) and each pollutant (p):
ΔGr;h =Gr;h+1 −Gr;hðMWhÞ ΔDr;p;h =Dr;p;h+1 −Dr;p;hð$Þ
Using hourly data from 2009 through 2011, there are more than 25,000observed changes in damages corresponding to a change in generation foreach region and each pollutant. A linear, ordinary least-squares regression ofΔD on ΔG estimates the marginal damages from electricity production (β, indollars per megawatt-hour) for each region and each pollutant:
ΔDr;p = βr;p × ΔGr + Intercept + e
Toaccount for temporal variations, data arebinnedaccording to the level ofsystemdemand,which isa strongpredictorof themarginalemissions ratesofanelectricity system (15, 30).Weused total fossil generation (based onCEMSdata)as a proxy for system demand. Hourly data are binned by every fifth percentile,where the first bin contains the 5% of data occurring during the lowest-
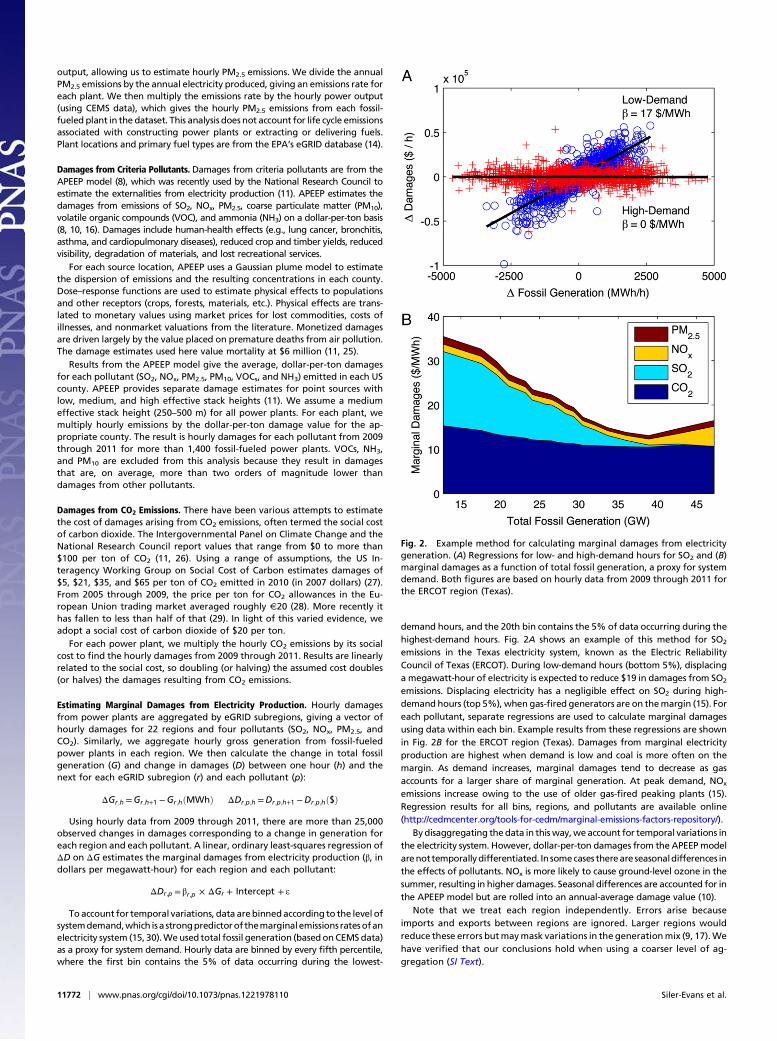
demand hours, and the 20th bin contains the 5% of data occurring during thehighest-demand hours. Fig. 2A shows an example of this method for SO2
emissions in the Texas electricity system, known as the Electric ReliabilityCouncil of Texas (ERCOT). During low-demand hours (bottom 5%), displacinga megawatt-hour of electricity is expected to reduce $19 in damages from SO2
emissions. Displacing electricity has a negligible effect on SO2 during high-demand hours (top 5%), when gas-fired generators are on themargin (15). Foreach pollutant, separate regressions are used to calculate marginal damagesusing data within each bin. Example results from these regressions are shownin Fig. 2B for the ERCOT region (Texas). Damages from marginal electricityproduction are highest when demand is low and coal is more often on themargin. As demand increases, marginal damages tend to decrease as gasaccounts for a larger share of marginal generation. At peak demand, NOx
emissions increase owing to the use of older gas-fired peaking plants (15).Regression results for all bins, regions, and pollutants are available online(http://cedmcenter.org/tools-for-cedm/marginal-emissions-factors-repository/).
By disaggregating thedata in this way,we account for temporal variations inthe electricity system. However, dollar-per-ton damages from the APEEPmodelarenot temporallydifferentiated. In somecases thereare seasonaldifferences inthe effects of pollutants. NOx is more likely to cause ground-level ozone in thesummer, resulting in higher damages. Seasonal differences are accounted for inthe APEEP model but are rolled into an annual-average damage value (10).
Note that we treat each region independently. Errors arise becauseimports and exports between regions are ignored. Larger regions wouldreduce these errors butmaymask variations in the generationmix (9, 17).Wehave verified that our conclusions hold when using a coarser level of ag-gregation (SI Text).
Fig. 2. Example method for calculating marginal damages from electricitygeneration. (A) Regressions for low- and high-demand hours for SO2 and (B)marginal damages as a function of total fossil generation, a proxy for systemdemand. Both figures are based on hourly data from 2009 through 2011 forthe ERCOT region (Texas).
11772 | www.pnas.org/cgi/doi/10.1073/pnas.1221978110 Siler-Evans et al.
Evaluating Wind and Solar. We evaluate wind turbines at more than 33,000locations across the United States (Fig. S1). Wind data for 2006 are from theEastern Wind Integration and Transmissions Study and the Western Windand Solar Integration Study, which model wind power output from VestasV90-3.0-MW turbines (31, 32). Wind power output data are available at10-min temporal resolution, which we average to find the hourly poweroutput for each site.
Similarly, we evaluate a PV solar panel at more than 900 locationsacross the United States (Fig. S1). Solar insolation data for a “typicalmeteorological year” are from the National Solar Radiation Database,which provides hourly solar intensities (33). Solar panels are assumed tohave a nameplate capacity of 1 kW and an efficiency of 13%. Panels areinstalled facing true south with a tilt equal to the latitude of the in-stallation site. Under these assumptions, we calculate hourly energy outputfor a solar panel at each location.
There are year-to-year differences in renewable resources (34), which arenot captured in this analysis. We assume that wind and solar output fromthe single sample year repeat in future years.
To estimate the avoided damages for each wind turbine and solar panel,we determine the displaced energy in a given hour and estimate the avoideddamages according to the level of fossil generation at that hour. For ex-ample, consider a wind turbine in Texas that produces 2 MWh between
midnight and 1:00 AM on January 1, 2009. During this hour, total fossilgeneration in the ERCOT regionwas 21 GW, and themarginal damages fromcriteria pollutants and CO2 emissions were $16/MWh and $13/MWh (Fig.2B). Thus, the wind turbine provides $32 in benefits from displaced SO2,NOx, and PM2.5 emissions and $26 in benefits from displaced CO2 emissions.The process is repeated for each hour of the year from 2009 through 2011.Hourly avoided damages from the three years are summed and divided bythree to find the annual effects of the wind turbine. This process is re-peated for each wind turbine and solar panel. Results are presented usingheat maps, which are based on an interpolation between the evaluatedsites. Although we often discuss state-level results to improve readability,all health, environmental, and climate benefits are calculated using eGRIDsubregions. For example, a comparison of solar panels in Arizona and Ohiois based on the average impacts of all panels in those states, where impactsfor each panel are calculated using regressions from the relevant eGRIDsubregions.
ACKNOWLEDGMENTS. We thank Nicholas Muller for assistance with theAPEEP model. This research was supported by the Center for Climateand Energy Decision Making Center, through a cooperative agreementbetween the National Science Foundation and Carnegie Mellon University(SES-0949710), and the Carnegie Mellon Electricity Industry Center.
1. US Department of Energy (2008) 20%Wind Energy by 2030: Increasing Wind Energy’sContribution to US Electricity Supply (DOE, Washington, DC).
2. Valentino L, Valenzuela V, Botterud A, Zhou Z, Conzelmann G (2012) System-wideemissions implications of increased wind power penetration. Environ Sci Technol46(7):4200–4206.
3. Lu X, McElroy MB, Sluzas NA (2011) Costs for integrating wind into the future ERCOTsystem with related costs for savings in CO2 emissions. Environ Sci Technol 45(7):3160–3166.
4. Kaffine DT, McBee BJ, Lieskovsky J (2012) Emissions Savings from Wind Power Gen-eration: Evidence from Texas, California and the Upper Midwest. Working Paper2012-03 (Colorado School of Mines, Golden, CO).
5. National Research Council (2007) Environmental Impacts of Wind-Energy Projects(National Academy, Washington, DC).
6. Kaffine DT, McBee BJ, Lieskovsky J (2013) Emissions savings from wind power gen-eration in Texas. Energy J (Camb Mass) 34(1):155–175.
7. Cullen J (2013) Measuring the environmental benefits of wind generated electricity.Am Econ J Econ Policy, in press.
8. Muller NZ, Mendelsohn R, Nordhaus W (2011) Environmental accounting for pollutionin the United States economy. Am Econ Rev 101:1649–1675.
9. Anair D, Mahmassani A (2012) State of Charge: Electric Vehicles’ Global WarmingEmissions and Fuel-Cost Savings Across the United States (Union of Concerned Sci-entists, Cambridge, MA).
10. Muller NZ, Mendelsohn R (2007) Measuring the damages of air pollution in theUnited States. J Environ Econ Manage 54:1–14.
11. National Research Council (2009) Hidden Costs of Energy: Unpriced Consequences ofEnergy Production and Use (National Academy, Washington, DC).
12. Levy JI, Baxter LK, Schwartz J (2009) Uncertainty and variability in health-related dam-ages from coal-fired power plants in the United States. Risk Anal 29(7):1000–1014.
13. US Department of Energy (2012) Wind powering America. Available at www.wind-poweringamerica.gov/wind_installed_capacity.asp. Accessed October 14, 2012.
14. US Environmental Protection Agency (2012) Emissions and generation resource in-tegrated database for 2009. Available at www.epa.gov/cleanenergy/energy-resources/egrid/index.html. Accessed April 1, 2012.
15. Siler-Evans K, Azevedo IL, Morgan MG (2012) Marginal emissions factors for the U.S.electricity system. Environ Sci Technol 46(9):4742–4748.
16. Muller NZ, Mendelsohn R (2009) Efficient pollution regulation: Getting the pricesright. Am Econ Rev 99:1714–1739.
17. Weber CL, Jiaramillo P, Marriott J, Samaras C (2010) Life cycle assessment and gridelectricity: What do we know and what can we know? Environ Sci Technol 44(6):1895–1901.
18. US Environmental Protection Agency (2011) 2010 Progress Report: Emission, Com-pliance, and Market Analyses (EPA, Washington, DC).
19. US Environmental Protection Agency (2011) Regulatory Impact Analysis (RIA) for the
Final Transport Rule (EPA, Washington, DC).20. Katzenstein W, Apt J (2009) Air emissions due to wind and solar power. Environ Sci
Technol 43(2):253–258.21. Oates DL, Jaramillo P (2013) Production cost and air emissions impacts of coal-cycling
in power systems with large-scale wind penetration. Environ Res Lett 8(2):1–7.22. US Environmental Protection Agency (2012) Air markets program data: Part 75
emissions data. Available at: http://ampd.epa.gov/ampd/. Accessed April 2, 2012.23. US Environmental Protection Agency (2009) Plain English Guide to the Part 75 Rule
(EPA, Washington, DC).24. US Environmental Protection Agency (2009) 2005 national emissions inventory.
Available at www.epa.gov/ttn/chief/net/2005inventory.html#inventorydata. Accessed
March 12, 2012.25. Kniesner TJ, Viscusi WK, Woock C, Ziliak JP (2012) The value of a statistical life: evi-
dence from panel data. Rev Econ Stat 94:74–87.26. Parry ML, Canziani OF, Palutikof J, van der Linden PJ, Hanson CE (2007) Contribution
of Working Group II to the Fourth Assessment Report of the Intergovernmental Panel
on Climate Change (Cambridge Univ Press, Cambridge, UK).27. US Interagency Working Group on Social Cost of Carbon (2010) Technical Support
Document: Social Cost of Carbon for Regulatory Impact Analysis Under Executive
Order 12866 (US Government, Washington, DC).28. European Commission Directorate-General for the Environment (2012) EU Action
Against Climate Change: The EU Emissions Trading Scheme (European Commission,
Brussels, Belgium).29. Lewis B (2012) EU carbon too cheap, no mention of intervention. Available at www.
reuters.com/article/2012/01/26/us-eu-environment-idUSTRE80P1H020120126. Accessed
August 17, 2012.30. Hawkes A (2010) Estimating marginal CO2 emissions rates for national electricity
systems. Energy Policy 38:5977–5987.31. National Renewable Energy Laboratory (2010) Eastern Wind Integration and Trans-
mission Study. Available at http://www.nrel.gov/electricity/transmission/data_resources.
html. Accessed March 1, 2012.32. National Renewable Energy Laboratory (2010) Western Wind and Solar Integration
Study. Available at http://www.nrel.gov/electricity/transmission/data_resources.html.
Accessed March 1, 2012.33. National Renewable Energy Laboratory (2007) National solar radiation database.
Available at http://rredc.nrel.gov/solar/old_data/nsrdb/1991-2005/. Accessed March 1,
2012.34. Katzenstein W, Fertig E, Apt J (2010) The variability of interconnected wind plants.
Energy Policy 38:4400–4410.
Siler-Evans et al. PNAS | July 16, 2013 | vol. 110 | no. 29 | 11773
SUST
AINABILITY
SCIENCE
SEECO
MMEN
TARY