Regional-scale climate influences on temporal variations...
14
Regional-scale climate influences on temporal variations of rainwater and cave dripwater oxygen isotopes in northern Borneo Kim M. Cobb a, , Jess F. Adkins b , Judson W. Partin a , Brian Clark c a School of Earth and Atmospheric Sciences, Georgia Inst. of Technology, 311 Ferst Dr., Atlanta, GA 30332, United States b Department of Geological and Planetary Sciences, California Inst. of Technology, Pasadena, CA 91125, United States c Gunung Mulu National Park, Sarawak, Malaysia Received 23 February 2007; received in revised form 22 August 2007; accepted 22 August 2007 Editor: M.L. Delaney Available online 31 August 2007 Abstract This study investigates the relationship between large-scale climate variability, rainfall oxygen isotopic composition (δ 18 O), and cave dripwater δ 18 O at Gunung Mulu and Gunung Buda National Parks in northern Borneo (4°N, 115°E) on intraseasonal to interannual timescales. A 3-yr timeseries of rainfall δ 18 O contains prominent seasonal and interannual variability. The seasonal cycle in rainfall δ 18 O is defined by lighter values of - 10‰ during late boreal summer and heavier values of - 4‰ during late boreal winter, and is poorly correlated to local precipitation, which displays very weak seasonality. Seasonally-varying moisture trajectories likely play a key role in the observed seasonal cycle of rainfall δ 18 O, driving enhanced fractionation during boreal summer and less fractionation during boreal winter. Dripwater δ 18 O timeseries display 2‰ seasonal cycles that follow the rainfall δ 18 O seasonal cycles, with a mean δ 18 O value equivalent to the mean δ 18 O of rainfall. Large surveys of cave dripwaters conducted during three fieldtrips to Gunung Mulu/Buda reveal a system-wide response to rainfall δ 18 O seasonality that supports a relatively short (less than 6months) response time for most drips. During the weak 2005/2006 La Niña event, sustained positive precipitation anomalies are associated with rainfall δ 18 O values that are 4 to 5‰ lighter than previous years' values, consistent with the tropical “amount effect” observed in both models and data. Dripwater δ 18 O values are 1 to 2‰ lighter during the weak La Niña event. The importance of the “amount effect” in driving intraseasonal rainfall δ 18 O anomalies at our site is supported by an 8‰ increase in rainfall δ 18 O that occurred over the course of two weeks in response to a pronounced decrease in regional convective activity. Dripwater discharge rates underwent a ten-fold decrease during the extended dry period, but dripwater δ 18 O values remained constant. This study supports the interpretation of stalagmite δ 18 O records from Gunung Mulu/Buda as paleo-precipitation records that are sensitive to the location and strength of deep convection in the West Pacific Warm Pool. © 2007 Elsevier B.V. All rights reserved. Keywords: stalagmite; rainfall; dripwater; oxygen isotopes; paleoclimate; West Pacific Warm Pool 1. Introduction Stalagmite oxygen isotopic records have provided long, high-resolution, absolutely-dated climate recon- structions from many regions of the globe. Such reconstructions have played a particularly important role Available online at www.sciencedirect.com Earth and Planetary Science Letters 263 (2007) 207 – 220 www.elsevier.com/locate/epsl Corresponding author. Tel.: +1 404 894 1992; fax: +1 404 894 5638. E-mail address: [email protected] (K.M. Cobb). 0012-821X/$ - see front matter © 2007 Elsevier B.V. All rights reserved. doi:10.1016/j.epsl.2007.08.024
Transcript of Regional-scale climate influences on temporal variations...

Regional-scale climate influences on temporal variations of rainwaterand cave dripwater oxygen isotopes in northern Borneo
Kim M. Cobb a,!, Jess F. Adkins b, Judson W. Partin a, Brian Clark c
a School of Earth and Atmospheric Sciences, Georgia Inst. of Technology, 311 Ferst Dr., Atlanta, GA 30332, United Statesb Department of Geological and Planetary Sciences, California Inst. of Technology, Pasadena, CA 91125, United States
c Gunung Mulu National Park, Sarawak, Malaysia
Received 23 February 2007; received in revised form 22 August 2007; accepted 22 August 2007
Editor: M.L. DelaneyAvailable online 31 August 2007
Abstract
This study investigates the relationship between large-scale climate variability, rainfall oxygen isotopic composition (δ18O), andcave dripwater δ18O at Gunung Mulu and Gunung Buda National Parks in northern Borneo (4°N, 115°E) on intraseasonal tointerannual timescales. A 3-yr timeseries of rainfall δ18O contains prominent seasonal and interannual variability. The seasonalcycle in rainfall δ18O is defined by lighter values of − 10‰ during late boreal summer and heavier values of − 4‰ during lateboreal winter, and is poorly correlated to local precipitation, which displays very weak seasonality. Seasonally-varying moisturetrajectories likely play a key role in the observed seasonal cycle of rainfall δ18O, driving enhanced fractionation during borealsummer and less fractionation during boreal winter. Dripwater δ18O timeseries display 2‰ seasonal cycles that follow the rainfallδ18O seasonal cycles, with a mean δ18O value equivalent to the mean δ18O of rainfall. Large surveys of cave dripwaters conductedduring three fieldtrips to Gunung Mulu/Buda reveal a system-wide response to rainfall δ18O seasonality that supports a relativelyshort (less than 6months) response time for most drips. During the weak 2005/2006 La Niña event, sustained positive precipitationanomalies are associated with rainfall δ18O values that are 4 to 5‰ lighter than previous years' values, consistent with the tropical“amount effect” observed in both models and data. Dripwater δ18O values are 1 to 2‰ lighter during the weak La Niña event. Theimportance of the “amount effect” in driving intraseasonal rainfall δ18O anomalies at our site is supported by an 8‰ increase inrainfall δ18O that occurred over the course of two weeks in response to a pronounced decrease in regional convective activity.Dripwater discharge rates underwent a ten-fold decrease during the extended dry period, but dripwater δ18O values remainedconstant. This study supports the interpretation of stalagmite δ18O records from Gunung Mulu/Buda as paleo-precipitation recordsthat are sensitive to the location and strength of deep convection in the West Pacific Warm Pool.© 2007 Elsevier B.V. All rights reserved.
Keywords: stalagmite; rainfall; dripwater; oxygen isotopes; paleoclimate; West Pacific Warm Pool
1. Introduction
Stalagmite oxygen isotopic records have providedlong, high-resolution, absolutely-dated climate recon-structions from many regions of the globe. Suchreconstructions have played a particularly important role
Available online at www.sciencedirect.com
Earth and Planetary Science Letters 263 (2007) 207–220www.elsevier.com/locate/epsl
! Corresponding author. Tel.: +1 404 894 1992; fax: +1 404 8945638.
E-mail address: [email protected] (K.M. Cobb).
0012-821X/$ - see front matter © 2007 Elsevier B.V. All rights reserved.doi:10.1016/j.epsl.2007.08.024

in the tropics, where high-resolution, absolutely-datedpaleoclimate archives are scarce. Indeed, tropical stalag-mite oxygen isotopic (δ18O) records conclusively linkprecipitation variability in southeastern Asia (Wanget al., 2001), the Arabian Sea (Burns et al., 2003), andthe eastern Mediterranean (Bar-Matthews et al., 1999) toabrupt climate change events recorded in the Greenlandice cores (Grootes et al., 1993). Millennial-scale variabil-ity in stalagmite δ18O records points to precessionalforcing as the dominant control on orbital-scale tropicalhydrology (Fleitmann et al., 2003; Yuan et al., 2004; Cruzet al., 2005a,b; Dykoski et al., 2005; Cruz et al., 2006;Wang et al., 2006; Partin et al., 2007), while centennial-scale variability in stalagmite δ18O records that span thelast millennium document tropical hydrological effectsassociated with the ‘Medieval Warm Period’ and the‘Little Ice Age’ (Burns et al., 2002; Fleitmann et al., 2004;Lachniet et al., 2004).
Despite the increasingly important role that stalagmiteδ18O records play in global climate change studies, theirinterpretationwith respect to large-scale climate dynamicsis often ambiguous. In the tropics, stalagmite δ18Orecords are largely interpreted as rainfall δ18O reconstruc-tions, with a minor role for relatively small temperaturechanges that occur in the tropics. Potential controls onrainfall δ18O variability include temperature-dependentchanges in the vapor-liquid fractionation factor, changesin thewater vapor source region, and the cumulative effectof Raleigh fractionation that occurs as vapor condensationproceeds (Dansgaard, 1964; Rozanski et al., 1993; Gat,1996). An empirical relationship referred to as the‘amount effect’ exists between rainfall δ18O and rainfallamount in the tropics, and likely arises from moreextensive rainout (and therefore larger rainfall δ18Odepletions) and/or less evaporative enrichment of rain-drops duringwet periods. On regional scales, atmosphericgeneral circulation models equipped with stable isotopetracers have reproduced the strong inverse relationshipbetween the amount of precipitation and the δ18O ofrainfall throughout the tropics (Jouzel et al., 1987;Hoffmann et al., 1998; Cole et al., 1999; Noone andSimmonds, 2002; Vuille et al., 2005; Brown et al., 2006).However, both models and data highlight the importanceof variable moisture sources and trajectories in contrib-uting to significant seasonal and interannual rainfall δ18Ovariability in the tropics, especially in regions character-ized by monsoonal circulation and/or proximity to large-scale atmospheric fronts (Araguas-Araguas et al., 1998;Cole et al., 1999; Cruz et al., 2005a,b; Vuille and Werner,2005; Vuille et al., 2005). Detailed on-site analyses of therelationship between large-scale climate and local rainfallδ18O are critical to accurate climatic interpretations of
many terrestrial paleoclimate reconstructions based on icecore, tree ring, or stalagmite δ18O, but few such studiesexist.
Even if the climate-rainfall δ18O relationship is well-constrained, cave hydrology adds an additional layer ofcomplexity to the interpretation of stalagmite δ18Orecords. The climate-related rainfall δ18O signal must betransmitted through the dynamic karst system, whichinvolves mixing in the epikarst, possible evaporativefractionation, and highly variable groundwater flow rates.Dripwater residence times vary from several months intropical regions (Cruz et al., 2005a,b; Johnson et al., 2006)to decades in semi-arid regions (Ayalon et al., 1998),depending on the recharge and mixing characteristics of agiven cave system. Prolonged rainfall anomalies cancause temporal variability in dripwater residence times(McDonald et al., 2004), while different dripwaterpathways contribute to spatial heterogeneity in residencetimes (Ayalon et al., 1998). Quantitative calibrations ofhigh-resolution stalagmite δ18O records to the instru-mental climate record (e.g. Fleitmann et al., 2004; Trebleet al., 2005b) provide the most direct measure ofclimatic influences on stalagmite δ18O, but such calibra-tions are exceedingly rare and may be impossible toundertake at some sites. Therefore, detailed site-specificinvestigations of the relationship between large-scaleclimate, rainfall δ18O variability, cave hydrology, anddripwater δ18O variability are critical to accurate inter-pretations of stalagmite δ18O variability.
In this study we investigate the large-scale climaticcontrols on rainfall and dripwater δ18O variability innorthern Borneo, where climate is dominated bymonsoonal variability and the El Niño-Southern Oscilla-tion. As no GNIP (http://isohis.iaea.org) rainfall δ18Odata exist from Borneo, this study is key to accurateinterpretations of several new stalagmite δ18O reconstruc-tions that extend through the Last Glacial Maximum fromthe site (Partin et al., 2007). A 3-yr-long on-site rainfalland dripwater monitoring program is supplemented withintensive sampling during three fieldtrips in 2003, 2005,and 2006 to provide constraints on both spatial andtemporal variability in rainwater and dripwater δ18O. Theresulting δ18O timeseries are compared against localrainfall as well as gridded datasets of precipitation andwind in an attempt to isolate the climatic controls onrainfall and dripwater δ18O across synoptic, seasonal, andinterannual timescales.
2. Geologic setting
The research site is located in the adjoining GunungMulu and Gunung Buda National Parks (4°N, 115°E), in
208 K.M. Cobb et al. / Earth and Planetary Science Letters 263 (2007) 207–220

northern Sarawak, Malaysian Borneo (Fig. 1). Thecaves formed in the northeast-striking Melinau lime-stone formation, driven by runoff flowing down thenorthwestern flank of Gunung Mulu peak, a sandstoneformation which rises to an elevation of 2376m abovesea level (Fig. 1). Rivers have cut steep gorges throughthe Melinau limestone to form topographically isolatedmounds of carbonate which rise from the base of therainforest (∼ 100m above sea level) to 1710m above sealevel, in the case of Gunung Api, the largest of theMelinau carbonate mounds. Therefore, these activekarst systems are presently fed exclusively by rainfallthat falls directly over the carbonate mounds. GunungMulu National Park, a UNESCO world heritage site,contains all of the Melinau carbonate mounds with theexception of Gunung Buda, which is contained within aseparate, undeveloped national park to the north ofGunung Mulu. A September, 2003 expedition includedcollections from Snail Shell, Mojo, Chin Chin, GreenCathedral, and Bukit Assam caves, all located withinGunung Buda. Expeditions during March, 2005 andJune, 2006 expeditions included return visits to SnailShell and Mojo caves at Gunung Buda, as well asLang's, Wind, Clearwater, and Deer caves at GunungMulu. Detailed information concerning overburden,distance from cave entrances, and soil cover is notavailable for these remote cave systems. In situ loggingdevices measured stable relative humidity levels of ∼100% in the caves.
3. Climatic setting
Warm sea-surface temperatures drive year-roundatmospheric deep convection in northern Borneo,which receives over 5m of rainfall per year with weakseasonality (Fig. 2), as documented by daily precipita-tion data collected at the Mulu airport since 1998.Analysis of the Mulu airport rainfall data reveals thatintraseasonal (30–60day) variability (Madden andJulian, 1971; Madden and Julian, 1972; Knutson andWeickmann, 1987) accounts for approximately 20% oftotal precipitation variance at the research site, roughlyequivalent to the variance contribution from weakseasonal variability. Temperatures lie between 26 and27°C year-round, as recorded by on-site temperatureloggers.
Fig. 1. (left) Topographic map of Borneo (GTOPO30 data, available at http://eros.usgs.gov/). Note that the scale was chosen to maximize contrast atlow elevations, meaning that peaks above 2000 m a.s.l. are saturated. Thick black box represents inset map. (right) Topographic map of GunungMuluNational Park, Sarawak, Malaysia, showing locations of research caves (after Fig. 86 of Hazebroeck and Morshidi, 2002).
Fig. 2. Seasonal precipitation cycle for Mulu airport (shown with 1σs.d.), calculated from June 1998 to December 2005.
209K.M. Cobb et al. / Earth and Planetary Science Letters 263 (2007) 207–220

Maps of precipitation in the Western tropical Pacificconfirm that the precipitation maximum associated withthe Intertropical Convergence Zone (ITCZ) does notleave northern Borneo in its meridional migration(Fig. 3), explaining the weak seasonality observed inthe local Mulu rainfall data. Small precipitation maximaare observed in boreal fall and in late boreal spring(Fig. 2), when large-scale meridional temperaturegradients are at a minimum. Prevailing wind directiondisplays marked seasonality, however, with morenortherly winds occurring during boreal winter, whilesoutherly winds occur during boreal summer (see alsoFigs. 1 and 2 of Lau and Nath, 2000).
The largest changes in Warm Pool convectiveactivity occur during extremes of the El Niño-SouthernOscillation (ENSO). During El Niño events, warm sea-surface temperatures (SSTs) in the central to easternPacific drive an eastward shift in convection (Rasmus-son and Wallace, 1983), leading to drought in northernBorneo that begins in boreal fall and persists throughboreal spring (Ropelewski and Halpert, 1987; Lau andNath, 2003). Indeed, boreal winter precipitation innorthern Borneo was reduced by more than 50% during
the 1997/1998 El Niño event. Convection strengthensover the Warm Pool during La Niña events. Precipita-tion in northern Borneo is highly correlated to theSouthern Oscillation Index (SOI) (Fig. 4), an indexwhich tracks the seesaw in atmospheric pressure thatoccurs during ENSO extremes. Maps of the SOIregressed against seasonal precipitation and wind dataconfirm the year-round impact of ENSO on northern
Fig. 3. Precipitation (shaded) and 1000 mb wind (arrows) climatology maps for the Western Pacific. (A) Mean precipitation and winds for Decemberthrough February (DJF). A 5 m/s wind vector (shown in white box) is plotted for reference. (B) Same as (A) but for March through May (MAM).(C) Same as (A) but for June through August (JJA). (D) Same as (A) but for September through November (SON). CMAP precipitation (Xie andArkin, 1997) and NCEP wind data (Kalnay et al., 1996) provided by the NOAA/OAR/ESRL PSD, Boulder, Colorado, USA, from their web-site athttp://www.cdc.noaa.gov/.
Fig. 4. Interannual variability of northern Borneo precipitation (grid-point centered at 3.75°N, 113.75°E, CMAP data) (Xie andArkin, 1997)plotted with the Southern Oscillation Index (http://www.cpc.noaa.gov/data/indices/). Both timeseries have been filtered with a 2–7 yrbandpass filter.
210 K.M. Cobb et al. / Earth and Planetary Science Letters 263 (2007) 207–220

Borneo precipitation (Fig. 5). Seasonal wind anomaliesin northern Borneo have a slight easterly (westerly)tendency during El Niño (La Niña) events, but the effectis not statistically significant.
The geographic and climatic setting of our researchsite means that there are several potential mechanismsfor the fractionation of rainfall oxygen isotopes. First,the presence of large mountains to the east of the sitemeans that orographic fractionation may occur (Dans-
gaard, 1964; Siegenthaler and Oeschger, 1980), where-by large isotopic depletions are driven by both enhancedrainout and cooler fractionation temperatures as an airparcel moves across a mountain range. Second, varyingmoisture trajectories could lead to fractionation viaenhanced rainout, referring to the progressive Raleigh-type distillation that occurs as isotopically enrichedrain falls from an air parcel. This latter effect is analo-gous to the “continental effect” or “degree of rainout”
Fig. 5. Regression maps for the Southern Oscillation Index (SOI) and western Pacific precipitation and wind anomalies. (A) Map of monthlyprecipitation and wind anomalies regressed on the SOI, showing that negative SOI (an El Niño event) is strongly correlated to decreased rainfall overthe western Pacific. Only precipitation anomaly correlations above 95% are plotted (significance assessed with a student's t-test using reduceddegrees of freedom to account for auto-correlation). Wind anomaly correlations are not significant above the 95% level, but are plotted nonetheless. A5 m/s wind vector (shown in white box) is plotted for reference. (B) Same as (A), but JJA precipitation and wind anomalies for the boreal summerseason preceding peak ENSO anomalies are regressed onto peak (DJF) SOI anomalies. (C) Same as (B) but for SON precipitation and wind anomalies(i.e. during fall preceding peak ENSO anomalies). (D) Same as (C) but for DJF precipitation and wind anomalies (i.e. during peak ENSO anomalies).(E) Same as (D) but for MAM precipitation and wind anomalies (i.e. during spring following peak ENSO anomalies).
211K.M. Cobb et al. / Earth and Planetary Science Letters 263 (2007) 207–220

mentioned in previous studies (Rozanski et al., 1993;Vuille and Werner, 2005). Lastly, fractionation mayoccur through a more local “amount effect”, driven byevaporation and condensation in organized deepconvection closer to the site.
4. Methods
Two distinct sets of rainfall samples were collected atGunung Mulu/Buda — one set for the 3-yr continuousmonitoring program, and another set that representssamples collected during fieldtrips. The continuousrainfall δ18O timeseries is constructed from two-weekcumulative rainfall samples collected in an oil-type, foil-covered reservoir following standard water isotopecollection protocols (Friedman et al., 1992). Bi-weekly,cumulative rainwater sampling was conducted duringisolated intervals at nearby Long Napir (4°10"N, 115°8"E) and Gunung Buda, and quasi-continuously at
Gunung Mulu from October 2003 to July 2006. Rain-fall δ18O samples taken during fieldtrips representsnapshots of single rain events, with virtually nointegration. Rainwater samples were collected in125mL glass bottles (bi-weekly samples) and 4mLglass vials (spot sampling), sealed with polyseal caps.Dripwater δ18O samples were collected in 4mL glassvials with polyseal caps. Rainwater and dripwater δ18Owas measured using a GV Isoprime-Multiprep with along-term reproducibility of ± 0.04‰ (N N 500), ascalculated by repeat measurements of an internal waterstandard calibrated against NIST-VSMOW and NIST-GISP. All δ18O data are reported with respect toVSMOW, unless otherwise stated.
A variety of climate datasets are used to provide aninterpretive framework for the rainwater δ18O variabil-ity. Daily rainfall at Gunung Mulu as measured at theMulu airport is available since June, 1998 (data obtainedfrom Sarawak Department of Irrigation and Drainage).
Fig. 6. Timeseries of rainwater, dripwater, and climate indices from October 2003 to July 2006. (A) Rainwater (circles) and dripwater (squares) δ18Ofor Gunung Mulu (red) and Gunung Buda (green). Rainwater δ18O data from nearby Long Napir (4°10"N, 115°8"E) are plotted in black circles. Thedashed line represents an ad-hoc seasonal cycle in rainfall δ18O, based on a visual fit to the data. (B) Dripwater δ18O timeseries for two drips locatedin Wind Cave, Gunung Mulu. The dashed line represents a low-amplitude version of the dashed line in panel A (same mean value and phase). (C)Drip-rate for timeseries drips plotted in (B). (D) Precipitation at Gunung Mulu airport, smoothed with a 3-month running average. The blue shadedvertical bar represents the time period associated with maximum precipitation anomalies during the 2005/2006 La Niña event.
212 K.M. Cobb et al. / Earth and Planetary Science Letters 263 (2007) 207–220

Satellite-derived gridded precipitation data (CPCMerged Analysis of Precipitation; CMAP) (Xie andArkin, 1997) are available since January, 1979 from theClimate Prediction Center. Daily rainfall data from theGlobal Precipitation Climatology Project (GPCP) dataare available since January, 1997 from NASA (http://precip.gsfc.nasa.gov/). We rely on the shorter, localMulu rainfall data for comparisons with the rainwaterand dripwater isotopic data, and use the satellite-blendeddata to investigate large-scale precipitation variabilityover the Warm Pool. NCEP-NCAR reanalysis data(Kalnay et al., 1996) are used to obtain wind speed anddirection since January, 1979, when high-quality CMAPprecipitation data are available.
5. Results
5.1. Rainfall δ18O
The 3-yr timeseries of rainfall δ18O in the vicinity ofGunung Mulu National Park covers intervals fromOctober, 2003 to July, 2006 with variable resolution(Fig. 6A). Rainfall samples collected from three nearbystations (Gunung Buda, Gunung Mulu, and Long Napir)have similar δ18O values, and are used interchangeablyin analysis of the rainfall δ18O timeseries. Rainfall δ18Ovalues range from − 11.5‰ to − 2.5‰, with a mean of− 6.7 ± 2.8‰ (1σ, N = 97). A ∼ 6‰ seasonal cycle isvisible, with lighter values (− 10‰) occurring fromAugust to October and heavier values (− 4‰) occurringfrom December to March. Significant sub-seasonalrainfall δ18O variability on the order of 4‰ is super-imposed on the seasonal cycle, likely associated withsynoptic variability (Treble et al., 2005a) that is poorlyresolved with the bi-weekly rainfall sampling scheme.
The ∼ 6‰ seasonal cycle in rainfall δ18O cannot beascribed to seasonality of precipitation amount, whichhas aweak semi-annual nature, with relative rainfall max-ima occurring in late boreal spring and from Septemberto December (Fig. 2). In fact, a low correlation betweenMulu rainfall δ18O and Mulu precipitation (R = 0.05)suggests a limited role for a local “amount effect”stemming from fractionation in a local convective event.Likewise, the observed seasonal variability cannot beexplained by variations in source water δ18O, which areless than 1‰ across theWarm Pool (Brown et al., 2006).Rather, we hypothesize that the observed rainfall δ18Oseasonality is caused by the increased rainout, and hencegreater isotopic fractionation, that occurs during lateboreal summer, and vice versa during late boreal winter.In late boreal summer, the ITCZ has reached itsnorthern-most position, and mean southeasterly winds
carry moisture from the Java Sea to Gunung Mulu,leading to significant rainout as moisture is carried longdistances over the mountainous interior (Fig. 3). Theremaining water vapor would be significantly depletedin δ18O via both the “degree of rainout” and orographicfractionation mechanisms. Conversely, during lateboreal winter, when the ITCZ lies south of Borneo,northeasterly winds carry moisture from the Sulu andSouth China Seas to Gunung Mulu (Fig. 3). The heavierrainfall δ18O values measured during late boreal winterare consistent with the relatively short moisture pathwayduring this time of year.
Rainfall δ18O values are relatively light fromFebruary to May 2006 (Fig. 6A), during the weak2005/2006 La Niña event. Indeed, the 2005/2006 LaNiña event represents the largest and most sustained SOIanomaly during the 3-yr monitoring program. Analysisof wind vectors and precipitation anomalies for the peakof the 2005/2006 La Niña reveals the canonical patternof positive precipitation anomalies over most of theWarm Pool, including northern Borneo (Fig. 7).
Fig. 7. Precipitation anomaly (colors) and wind vector (arrows) mapsfor the DJF (top) and MAM (bottom) periods during the weak 2005/2006 La Niña event. A 5 m/s wind vector (shown in white box) isplotted for reference.
213K.M. Cobb et al. / Earth and Planetary Science Letters 263 (2007) 207–220

Northeasterly winds in December–January–Februaryand easterly winds in March–April–May likely advectmoisture from areas characterized by enhanced precip-itation to the east of Borneo (Fig. 7). This residualmoisture would be isotopically depleted, having expe-rienced significant rainout, and likely contributed to thedepleted rainfall δ18O values recorded at Gunung Muluduring this interval. Of course, enhanced precipitation atGunung Mulu during the weak La Niña event couldalso result in depleted rainfall δ18O. Therefore, theENSO-related rainfall δ18O signal is likely caused by aregional and/or local ‘amount effect’, whereby positiveprecipitation anomalies are associated with lighterrainfall δ18O observed in northern Borneo during the2005/2006 La Niña event.
Variable evapotranspiration rates may also affect theδ18O of water vapor in northern Borneo, given thatevapotranspiration contributes relatively enriched watervapor to the lower troposphere (Gat and Matsui, 1991)and plays an important role in the water balance innorthern Borneo (Kumagai et al., 2005). Seasonal tointerannual changes in evapotranspiration in Borneo arecurrently unconstrained, but such estimates may even-tually come from analysis of satellite-derived measure-ments of the isotopic composition of tropospheric watervapor (e.g. Worden et al., 2007).
5.2. Dripwater δ18O
Dripwater δ18O samples were collected every fewweeks from two different drips located in Wind Cave atGunung Mulu from February, 2004 to July, 2006. Theso-called “fast drip” had a drip-rate of 10–45 drips perminute (dpm), falling from a ‘shower-type’ speleotheminto a ‘bathtub’ rimmed with new calcite growth roughly250m from the cave entrance. The “slow drip” fell at arate of 4–12dpm from a small 2cm-long stalactite onto amud bank, approximately 150m from the cave entrance.The mean δ18O values for the fast and slow drips areindistinguishable (− 7.0 ± 1.1‰ and − 6.6 ± 1.0‰,respectively) and match the mean rainfall δ18O value(− 6.7 ± 2.8‰) within error.
The fast and the slow drip δ18O timeseries bothexhibit seasonal variability on the order of 2–3‰ whichtracks the rainfall δ18O seasonal cycle (Fig. 6A and B).The fast drip δ18O timeseries exhibits higher amplitudefluctuations than the slow drip, consistent with a shorterresponse time and/or less mixing in the overlyingepikarst (Fig. 6B). The fact that sub-seasonal dripwaterδ18O variations of 1–2‰ are observed in the timeseriessuggests that dripwater must move through the karst inless than 2months, although dripwater transit times
likely vary with cumulative precipitation amount. Theirregular temporal coverage of the dripwater δ18Otimeseries prevents the attribution of any given sub-seasonal δ18O excursion to a specific precipitation event(Fig. 6D).
Large surveys of dripwater δ18O conducted duringthe three field trips confirm that the seasonal variabilityand average value of the two timeseries drips in WindCave are broadly representative of drips throughout theGunung Mulu and Gunung Buda caves (Fig. 8). Thesurvey dripwater δ18O values cluster in distinct δ18Oranges depending on the timing of the fieldtrip withrespect to the annual cycle of rainfall δ18O. The averageδ18O value of the 150 spatial survey drips (characterizedby drip-rates ranging from less than 0.1 to greater than100dpm) is − 7.0 ± 1.0‰, in agreement with the averageδ18O of the timeseries drips (− 6.8 ± 1.1‰) and rainfallδ18O (− 6.7 ± 2.8‰). The fact that the rainfall anddripwater δ18O data scatter about the same averagevalue means that minimal evaporation occurs betweenthe ground surface and the dripwater site (which is notsurprising given relative humidity values of ∼ 100%).
Dripwater δ18O values decrease during the 2005/2006 La Niña event, consistent with lower rainfall δ18Oobserved during this period (Fig. 6B). Drip δ18O valuesof − 8 to − 9‰ during January, 2006 are roughly 2‰lighter than the previous year for both fast and slowdrips, and remain low through March, with values as
Fig. 8. Histograms of spatial dripwater, timeseries dripwater, andrainwater δ18O values.
214 K.M. Cobb et al. / Earth and Planetary Science Letters 263 (2007) 207–220
low as − 6‰ replacing more typical spring δ18O valuesof − 4 to − 5‰. Unfortunately, there are no rainfall δ18Osamples for the period leading up to and including thepeak dripwater δ18O excursions in the first week ofJanuary, 2006, making it difficult to assess therelationship between the rainfall and dripwater δ18Odepartures. While a more rigorous test of the ENSO-dripwater δ18O relationship awaits the accumulation ofdata from multiple ENSO extremes over the next severalyears, the preliminary data from the 2005/2006 La Niñaevent strongly suggests that ENSO events are recordedas dripwater δ18O anomalies at Gunung Mulu.
5.3. Drip-rate
The 3-yr drip-rate timeseries are characterized bysignificant monthly-scale variability that is superim-posed on trends of increasing drip-rates through time.The slow and fast drip-rate timeseries are highlycorrelated (R = 0.67), implying that both drips areforced by the same history of karst recharge anddischarge. Monthly-scale drip-rate variability bears littleresemblance to the smoothed local precipitation time-series, and may be governed by short-lived, extremeflushing events that are aliased in the bi-weekly drip-ratedatasets (Perrin et al., 2003; Cruz et al., 2005a,b). Onlonger timescales, the 3-yr trends in both fast and slowdrip-rates reflect a pronounced trend in precipitation at
Gunung Mulu. The 2005/2006 La Niña period ischaracterized by maximum sustained drip-rates forboth the fast and slow drips, indicative of a higherhydraulic head associated with anomalously highprecipitation during this period. Therefore, even weakinterannual variability has a profound impact on karsthydrology.
Weak but significant correlations exist between drip-rate and drip δ18O for both the fast (R = 0.26) and slow(R = 0.37) drips, and reflect coherent responses tointraseasonal and interannual precipitation variability.However, the drip δ18O timeseries do not exhibit theprominent trend observed in the drip-rate timeseries.Likewise, the drip-rate timeseries lack the seasonalvariability observed in the dripwater δ18O timeseries. Inother words, dripwater δ18O variability is controlled byrainwater δ18O variability, which is only loosely tied tolocal precipitation amount on seasonal timescales. Drip-rate variability, on the other hand, appears to be directlyrelated to local precipitation amount.
5.4. High-frequency variability in rainfall δ18O,dripwater δ18O, and drip-rate
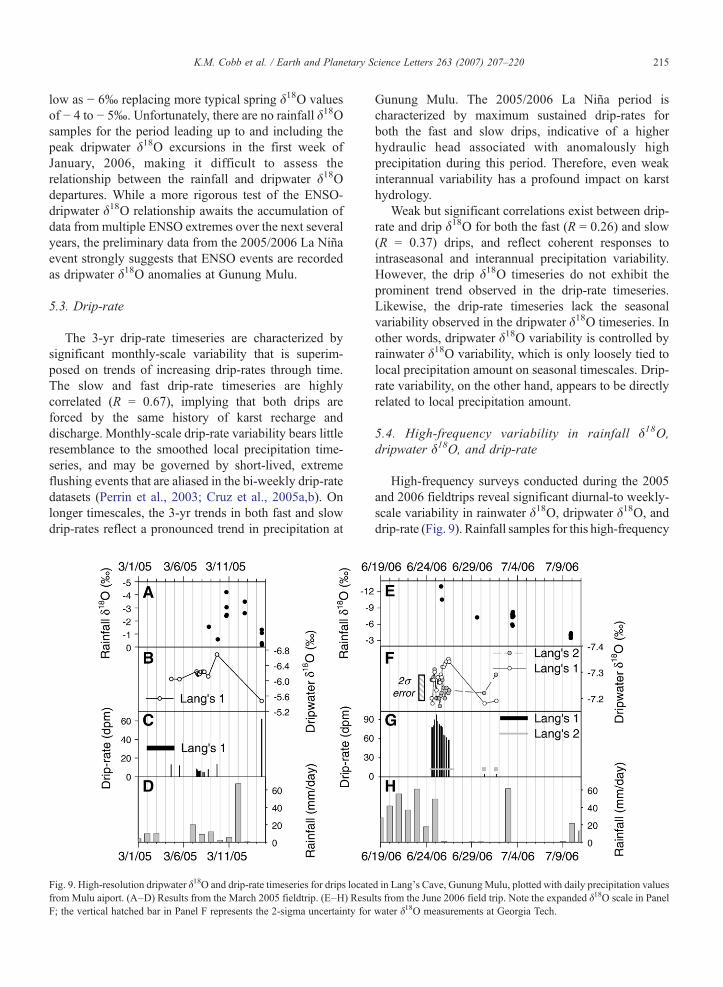
High-frequency surveys conducted during the 2005and 2006 fieldtrips reveal significant diurnal-to weekly-scale variability in rainwater δ18O, dripwater δ18O, anddrip-rate (Fig. 9). Rainfall samples for this high-frequency
Fig. 9. High-resolution dripwater δ18O and drip-rate timeseries for drips located in Lang's Cave, GunungMulu, plotted with daily precipitation valuesfrom Mulu aiport. (A–D) Results from the March 2005 fieldtrip. (E–H) Results from the June 2006 field trip. Note the expanded δ18O scale in PanelF; the vertical hatched bar in Panel F represents the 2-sigma uncertainty for water δ18O measurements at Georgia Tech.
215K.M. Cobb et al. / Earth and Planetary Science Letters 263 (2007) 207–220

study were collected in 4mL glass vials with polysealtops, and as such represent virtually no time integration(in contrast to the rainfall δ18O samples collected forthe continuous timeseries discussed above, whichrepresent rainfall integrated over a two-week period).It is important to note that on some days, rainfallsamples were collected even though no rainfall wasrecorded at theMulu airport, reflecting the patchiness ofconvective events in this area, especially during driertimes. Dripwater samples were collected in Lang'sCave every few hours over the course of 1–2days tocapture potential diurnal cycles, as well as once everyfew days during the fieldtrips' 2–3week duration toassess the impact of synoptic-scale variability.
Rainfall δ18O values during both fieldtrips exhibit2–3‰ variations in the course of a single day, and 8‰variations over the course of several weeks (Fig. 9).Rainfall δ18O during the March, 2005 fieldtrip rangesfrom − 4.2‰ to − 0.3‰, consistent with the seasonallyhigh δ18O values observed in the 3-yr rainfall δ18Otimeseries. Lighter rainfall δ18O values (− 12‰ to− 3‰) measured during the June, 2006 fieldtrip arelikewise consistent with seasonally isotopically deplet-ed rainfall. Multiple samples collected over a period ofseveral hours span from − 0.6‰ to − 4.2‰ for the 2005fieldtrip and − 5.7‰ to − 8.3‰ for the 2006 fieldtrip(Fig. 9A and E, respectively).
Heavier rainfall δ18O values likely represent moredisorganized convection from vapor closer to equilib-rium with seawater, while lighter values are indicative ofcondensation from a water vapor pool that hasexperienced significant distillation associated withprolonged, organized convection (Lawrence et al.,2004). Indeed, a rainfall δ18O trend from − 12‰ onJune 25, 2006 to − 4‰ on July 10, 2006 is associatedwith a marked decrease in precipitation — in the weekleading up to June 25th, precipitation at Mulu airportaveraged ∼ 41mm/day, whereas in the two weeksleading up to July 10th, precipitation averaged ∼ 4mm/day. The local precipitation change is linked to a large-scale shift in convective regime that occurred over thecourse of the 2006 fieldtrip, as observed in maps ofprecipitation and winds over the Maritime continentduring this period (Fig. 10). Therefore, the well-organized, persistent, regional-scale convection thatcharacterized the first days of the fieldtrip likely drovea strong depletion in water vapor δ18O, which whencombined with lower evaporative enrichment associatedwith more humid lower atmospheric conditions,explains the depleted rainfall δ18O values observed atMulu. As this convective system moved eastwards inearly July, depleted rainfall δ18O gave way to unsea-
sonably enriched rainfall δ18O values, consistent withreduced rainout (less fractionation from a seawatersource) and/or increased evaporative forcing as rain fallsfrom a cloud. The speed and eastward propagation of thelarge-scale convective anomaly is consistent withintraseasonal climate variability (Madden and Julian,1971; Madden and Julian, 1972; Knutson and Weick-mann, 1987), which has a profound impact on WarmPool precipitation, particularly during boreal summer(Hendon and Glick, 1997).
Dripwater δ18O values measured during the March,2005 and June, 2006 fieldtrips averaged − 6.15 ± 0.26‰and − 7.25 ± 0.05‰, respectively, consistent with theseasonal cycle observed in the 3-yr dripwater δ18Otimeseries (Fig. 9B and F). Continuous bi-hourlysampling conducted over 24 h during the 2005 fieldtripand over 48 h during the 2006 fieldtrip revealed nodiscernible diurnal cycle in dripwater δ18O or drip-rate.There is no obvious relationship between rainfall δ18Ovariability and dripwater δ18O variability in either dataset,although there is appreciable day-to-day dripwater δ18O
Fig. 10. (top) Map of precipitation and wind vectors averaged fromJune 25 through July 1, 2006. The analysis uses daily GPCP rainfalldata available from http://precip.gsfc.nasa.gov/ and daily 1000 mbwind data from NCEP/NCAR reanalysis. A 5 m/s wind vector isplotted in the lower left-hand corner for reference. (bottom) Same asabove but averaged from July 3 through July 9, 2006.
216 K.M. Cobb et al. / Earth and Planetary Science Letters 263 (2007) 207–220

variability in the 2005 dataset. Heavy rains on March 12,2005 trigger a flushing event (marked by drip-rates up to60dpm) that may have led to the infiltration of rainfallwith seasonally heavy δ18O values, thereby explainingrelatively heavy dripwater δ18O values observed severaldays later. Oxygen isotopic variability of the same dripduring the June, 2006 fieldtripwasmuch less pronounced,despite high-amplitude fluctuations in rainfall δ18O andprecipitation. The simultaneous monitoring of a secondslower drip (Drip 2) located approximately 20m from theoriginal drip (Drip 1) yielded results similar to Drip 1.
Day-to-day drip-rate variability for Drip 1 appears tobe tied to rainfall amount, as drip-rate responds to largerainfall events in both 2005 and 2006. Drip 1 dischargepeaks at 98dpm on June 25, 2006, immediatelyfollowing a week of high precipitation, and falls to4dpm after 10days of negligible rainfall. However, Drip2"s drip-rate remains constant over the same timeinterval. The different responses of the two drips to thelate June recharge event indicates that Drip 1 is likelyfed in part by faster ‘fissure flow’, whereas Drip 2represents slower ‘seepage flow’ whose response tohydraulic loading is significantly buffered (Ayalon et al.,1998). However, the δ18O values for both Drip 1 and 2remain relatively constant across the 2006 monitoringperiod, despite the introduction of relatively depletedrainfall δ18O (− 11‰) to the epikarst during the lateJune recharge event. The stability of dripwater δ18Oduring and after the late June recharge event implies awater residence time of greater than ∼ 2weeks for thetwo Lang's Cave study drips.
The observation that drip-rate is more responsive tospecific recharge events than dripwater δ18O is notsurprising, given that drip-rate is governed by instanta-neous hydraulic pressure changes in the water flowpathway (Genty and Deflandre, 1998; Baker andBrunsdon, 2003; Sondag et al., 2003), while dripwatercomposition reflects a cumulative mixture of pastrainfall events (Ayalon et al., 1998; Perrin et al., 2003;Cruz et al., 2005a,b).
6. Discussion
6.1. Comparison with isotope AGCMs
Atmospheric general circulation models (AGCMs)equipped with isotope trace modules are valuable toolsfor assessing the relationship between large-scaleclimate and rainfall δ18O (Jouzel et al., 1987; Hoffmannet al., 1998; Cole et al., 1999; Noone and Simmonds,2002; Vuille et al., 2005; Brown et al., 2006). Large-scale precipitation patterns are generally well-repre-
sented in the AGCMs, although the largest deficienciesoccur in tropical zones characterized by deep convection.Therefore, it is useful to compare the isotope AGCMoutput for northern Borneo with the rainfall δ18Otimeseries collected at Gunung Mulu, which representsthe only available rainfall δ18O timeseries in a 1000kmradius. The observed annual mean weighted rainfallδ18O value at GunungMulu (− 6.8‰) agrees moderatelywell with modeled annual mean weighted rainfall δ18Ovalues for northern Borneo, which range from − 6‰ in ahigh-resolution version of ECHAM-4 (Vuille et al.,2005) to − 8‰ in a low-resolution version of NASA-GISS (Cole et al., 1999). Such depleted rainwater δ18Ovalues are characteristic of zones of deep convection,where high levels of rainout lead to effective distillationof the water vapor pool. The prominent 6‰ seasonalcycle of rainfall δ18O observed at Gunung Mulu is notwell-reproduced in model results, however, which showseasonal cycles of 1–2‰ in northern Borneo (Vuilleet al., 2005; Brown et al., 2006). This discrepancy mayderive from an over-dependence of rainfall δ18O on localprecipitation amount in the AGCMs, and/or deficienciesassociated with the models' coarse resolutions, which donot adequately resolve marginal seas nor the hightopography in central Borneo.
Interannual rainfall δ18O variability is difficult toquantify in the 3-yr Gunung Mulu timeseries, butincreased precipitation during the weak 2005/2006 LaNiña event caused a N 2‰ depletion in rainfall δ18O.Models demonstrate a high sensitivity of West Pacificrainfall δ18O to ENSO variability, whereby increasedrainfall during a La Niña event leads to depleted rainfallδ18O via the amount effect (Hoffmann et al., 1998; Coleet al., 1999; Vuille et al., 2005; Brown et al., 2006) butthe magnitude of the interannual δ18O anomalies aremodel-dependent. While the models provide a usefulframework for assessing large-scale features of theclimate-rainfall δ18O relationship in the tropics, localprocesses such as topographically-driven precipitation,variable moisture trajectories, and even evapotranspira-tion likely contribute to the observed rainfall δ18Ovariability at Gunung Mulu. More realistic simulationsof rainfall δ18O over the Maritime continent likelyrequire nesting a high-resolution isotope AGCM withrealistic topography, coastlines, and land-atmospherecoupling within a coarser-resolution AGCM of the typestudied thus far.
6.2. Implications for stalagmite δ18O reconstructions
The utility of stalagmite δ18O reconstructions ofpaleoclimate depends on firm knowledge of the relationship
217K.M. Cobb et al. / Earth and Planetary Science Letters 263 (2007) 207–220

between climate and rainfall δ18O, and how rainfallδ18O signals are manifest in dripwater δ18O variability.In northern Borneo, rainfall δ18O is controlled bymoisture trajectory (which varies seasonally but notinterannually) and precipitation amount (which variesappreciably on intraseasonal and interannual time-scales but does not vary seasonally). Both of thesemechanisms involve Raleigh distillation processes,whether via regional ‘degree of rainout’ and/or morelocal ‘amount’ effects (Dansgaard, 1964; Rozanskiet al., 1993; Gat, 1996). A new daily rainfall samplingprogram at Gunung Mulu, when combined withmeteorological data from a newly-installed weatherstation, should further resolve the relationship betweenlarge-scale climate, local climate, and local rainfallδ18O on synoptic to interannual timescales.
The dripwater δ18O data demonstrate that for moder-ately fast drips (4–20dpm), dripwater δ18O variabilityrepresents a damped response to rainfall δ18O variabilityaveraged over approximately 2–3months. The averageδ18O value of rainwaters (− 6.7 ± 2.8‰), slow dripwaters(− 6.6 ± 1.0‰), and fast dripwaters (− 7.0 ± 1.1‰) agreewithin error, bolstering confidence in the interpretation ofstalagmite δ18O records as rainfall δ18O reconstructions,assuming equilibrium calcite precipitation. For theGunung Buda stalagmites analyzed so far, modern cal-cite δ18O is approximately − 9.1‰ PDB (Partin et al.,2007), in good agreement with calculated calcite δ18Ovalues in equilibrium with dripwaters at − 6.8‰SMOWand temperatures of 26°C (Kim and O'Neil, 1997).However, stalagmites from other tropical sites areassociated with significant isotopic disequilibrium effects(Mickler et al., 2004).
Fast-growing stalagmites may record the seasonalcycle in rainfall δ18O (Treble et al., 2005b; Johnsonet al., 2006), while slow-growing stalagmites wouldrecord changes in the annual average of rainfall δ18O.Changes in the strength and/or location of the ITCZcould alter annual average rainfall δ18O by shifting thebalance of seasonal rainfall δ18O extremes (currentlymore negative in boreal summer and more positive inboreal winter). Given the skewed nature of ENSOvariability (more low-amplitude La Niña events sepa-rated by fewer high-amplitude El Niño events (Burgersand Stephenson, 1999)), a change in the intensity ofENSO variability would impart a signal on long-termmean rainfall δ18O. By analogy to the observed responseof the climate-karst system to ENSO variability, heavierstalagmite δ18O values in the Gunung Mulu/Budastalagmite δ18O records reflect a reduction in deepconvection in the vicinity of Borneo, indicative ofrelatively dry conditions.
7. Conclusions
Taken together, the present study confirms thatseasonal to interannual changes in large-scale precipi-tation are reflected in both rainwater and dripwater δ18Ovariability in northern Borneo. Borneo is the largestlandmass in the Maritime Continent, and seasonalchanges in surface wind direction associated with thenorth-to-south migration of the ITCZ drive largeseasonal changes in rainfall δ18O that are recorded inmuted seasonal cycles of dripwater δ18O. Rainwater anddripwater δ18O values are lightest during late borealsummer, and heaviest during late boreal winter.Interannual rainfall and dripwater δ18O anomalies atGunung Mulu are linked to regional-scale changes inconvective activity associated with ENSO variability,whereby increased precipitation drives more negativerainfall and dripwater δ18O, consistent with the ‘amounteffect’. An 8‰ change in rainfall δ18O over the courseof two weeks dwarfs seasonal to interannual rainfallδ18O changes, and highlights the importance of large-scale (1000km) climatic controls on rainfall δ18O innorthern Borneo. Whereas dripwater δ18O is bufferedagainst high-frequency (synoptic and intraseasonal-scale) variability observed in rainfall δ18O, drip-rateexhibits a faster response time, likely driven by changesin hydraulic loading. On longer timescales, drip-rate iscorrelated to cumulative precipitation over the previousseveral months, and resembles a 6-month smoothedversion of local precipitation. Stalagmite δ18O recordsfrom Gunung Mulu likely reflect changes in the strengthand/or position of the ITCZ combined with changes inthe amplitude and/or frequency of ENSO extremes,whereby heavier δ18O is indicative of relatively dryconditions. More generally, this study demonstrates howsite-specific studies of the climate-rainfall δ18O rela-tionship can improve the paleoclimatic interpretations ofrainfall δ18O reconstructions from geologic archivessuch as ice cores, tree rings, and lake sediments.
Acknowledgements
The authors are indebted to Jenny Malang and thestaff of Gunung Mulu National Park for fieldtrip andsampling assistance, Johnny Baei Hassan for expertcaving guidance, and Prof. Andrew Tuen (UNIMAS)for permitting assistance. Joel Despain, George Prest,Shane Fryer, Jed Mosenfelder, and Brad Hackerprovided assistance during the 2003 fieldtrip. Permitsfor this work were granted by the Malaysian EconomicPlanning Unit, the Sarawak Forestry Department, andthe Sarawak State Planning Unit. Mulu airport rainfall
218 K.M. Cobb et al. / Earth and Planetary Science Letters 263 (2007) 207–220

was provided by the Sarawak Department of Irrigationand Drainage. The research was funded by NSF grantATM-0318445, and by a Comer Abrupt Climate ChangeFellowship.
References
Araguas-Araguas, L., Froehlich, K., Rozanski, K., 1998. Stableisotope composition of precipitation over southeast Asia.J. Geophys. Res. Atmos. 103, 28721–28742.
Ayalon, A., Bar-Matthews, M., Sass, E., 1998. Rainfall-rechargerelationships within a karstic terrain in the eastern Mediterraneansemi-arid region, Israel: delta O-18 and delta D characteristics.J. Hydrol. 207, 18–31.
Baker, A., Brunsdon, C., 2003. Non-linearities in drip waterhydrology: an example from Stump Cross Caverns, Yorkshire.J. Hydrol. 277, 151–163.
Bar-Matthews, M., Ayalon, A., Kaufman, A., Wasserburg, G.J., 1999.The Eastern Mediterranean paleoclimate as a reflection of regionalevents: Soreq cave, Israel. Earth Planet. Sci. Lett. 166, 85–95.
Brown, J., Simmonds, I., Noone, D., 2006. Modeling delta O-18 intropical precipitation and the surface ocean for present-day climate.J. Geophys. Res. Atmos. 111, D05105.
Burgers, G., Stephenson, D.B., 1999. The “normality” of El Nino.Geophys. Res. Lett. 26, 1027–1030.
Burns, S.J., Fleitmann, D., Mudelsee, M., Neff, U., Matter, A.,Mangini, A., 2002. A 780-year annually resolved record of IndianOcean monsoon precipitation from a speleothem from southOman. J. Geophys. Res. Atmos. 107.
Burns, S.J., Fleitmann, D., Matter, A., Kramers, J., Al-Subbary, A.A.,2003. Indian Ocean climate and an absolute chronology overDansgaard/Oeschger events 9 to 13. Science 301, 1365–1367.
Cole, J.E., Rind, D., Webb, R.S., Jouzel, J., Healy, R., 1999. Climaticcontrols on interannual variability of precipitation delta O-18:simulated influence of temperature, precipitation amount, andvapor source region. J. Geophys. Res. Atmos. 104, 14223–14235.
Cruz, F.W., Burns, S.J., Karmann, I., Sharp, W.D., Vuille, M.,Cardoso, A.O., Ferrari, J.A., Dias, P.L.S., Viana, O., 2005a.Insolation-driven changes in atmospheric circulation over the past116,000 years in subtropical Brazil. Nature 434, 63–66.
Cruz, F.W., Karmann, I., Viana, O., Burns, S.J., Ferrari, J.A., Vuille,M., Sial, A.N., Moreira, M.Z., 2005b. Stable isotope study of cavepercolation waters in subtropical Brazil: Implications for paleocli-mate inferences from speleothems. Chem. Geol. 220, 245–262.
Cruz, F.W., Burns, S.J., Karmann, I., Sharp, W.D., Vuille, M., 2006.Reconstruction of regional atmospheric circulation features duringthe late Pleistocene in subtropical Brazil from oxygen isotopecomposition of speleothems. Earth Planet. Sci. Lett. 248, 495–507.
Dansgaard, W., 1964. Stable isotopes in precipitation. Tellus 16,436–468.
Dykoski, C.A., Edwards, R.L., Cheng, H., Yuan, D.X., Cai, Y.J.,Zhang, M.L., Lin, Y.S., Qing, J.M., An, Z.S., Revenaugh, J., 2005.A high-resolution, absolute-dated Holocene and deglacial Asianmonsoon record from Dongge Cave, China. Earth Planet. Sci. Lett.233, 71–86.
Fleitmann, D., Burns, S.J., Mudelsee, M., Neff, U., Kramers, J.,Mangini, A., Matter, A., 2003. Holocene forcing of the Indianmonsoon recorded in a stalagmite from Southern Oman. Science300, 1737–1739.
Fleitmann, D., Burns, S.J., Neff, U., Mudelsee, M., Mangini, A.,Matter, A., 2004. Palaeoclimatic interpretation of high-resolution
oxygen isotope profiles derived from annually laminated spe-leothems from Southern Oman. Quat. Sci. Rev. 23, 935–945.
Friedman, I., Smith, G.I., Gleason, J.D., Warden, A., Harris, J.M.,1992. Stable isotope composition of waters in SoutheasternCalifornia. 1. Modern precipitation. J. Geophys. Res. Atmos. 97,5795–5812.
Gat, J.R., 1996. Oxygen and hydrogen isotopes in the hydrologiccycle. Annual Rev. Earth Platet. Sci. 24, 225–262.
Gat, J.R., Matsui, E., 1991. Atmospheric water-balance in the AmazonBasin — an isotopic evapotranspiration Model. J. Geophys. Res.Atmos. 96, 13179–13188.
Genty, D., Deflandre, G., 1998. Drip flow variations under a stalactiteof the Pere Noel cave (Belgium). Evidence of seasonal variationsand air pressure constraints. J. Hydrol. 211, 208–232.
Grootes, P.M., Stuiver, M., White, J.W.C., Johnsen, S., Jouzel, J.,1993. Comparison of oxygen-isotope records from the GISP2 andGRIP Greenland Ice cores. Nature 366, 552–554.
Hazebroeck, H.P., Morshidi, A.K.A., 2002. A Guide to Gunung MuluNational Park, Natural History Publications (Borneo), KotaKinabalu, 91 pp.
Hendon, H.H., Glick, J., 1997. Intraseasonal air-sea interaction in thetropical Indian and Pacific Oceans. J. Climate 10, 647–661.
Hoffmann, G., Werner, M., Heimann, M., 1998. Water isotope moduleof the ECHAM atmospheric general circulation model: a study ontimescales from days to several years. J. Geophys. Res. Atmos.103, 16871–16896.
Johnson, K.R., Hu, C.Y., Belshaw, N.S., Henderson, G.M., 2006.Seasonal trace-element and stable-isotope variations in a Chinesespeleothem: the potential for high-resolution paleomonsoonreconstruction. Earth Planet. Sci. Lett. 244, 394–407.
Jouzel, J., Russell, G.L., Suozzo, R.J., Koster, R.D., White, J.W.C.,Broecker, W.S., 1987. Simulations of the HDO and H2 O-18atmospheric cycles using the NASA GISS general-circulationmodel — the seasonal cycle for present-day conditions.J. Geophys. Res. Atmos. 92, 14739–14760.
Kalnay, E., Kanamitsu, M., Kistler, R., Collins, W., Deaven, D.,Gandin, L., Iredell, M., Saha, S., White, G., Woollen, J., Zhu, Y.,Chelliah, M., Ebisuzaki, W., Higgins, W., Janowiak, J., Mo, K.C.,Ropelewski, C., Wang, J., Leetmaa, A., Reynolds, R., Jenne, R.,Joseph, D., 1996. The NCEP/NCAR 40-year reanalysis project.Bull. Am. Meteorol. Soc. 77, 437–471.
Kim, S.-T., O'Neil, J.R., 1997. Equilibrium and non-equilibriumoxygen isotope effects in synthetic carbonates. Geochim. Cosmo-chim. Acta 61, 3461–3475.
Knutson, T.R., Weickmann, K.M., 1987. 30–60day atmosphericoscillations— composite life-cycles of convection and circulationanomalies. Mon. Weather Rev. 115, 1407–1436.
Kumagai, T., Saitoh, T.M., Sato, Y., Takahashi, H., Manfroi, O.J.,Morooka, T., Kuraji, K., Suzuki, M., Yasunari, T., Komatsu, H.,2005. Annual water balance and seasonality of evapotranspirationin a Bornean tropical rainforest. Agric. For. Meteorol. 128, 81–92.
Lachniet, M.S., Burns, S.J., Piperno, D.R., Asmerom, Y., Polyak, V.J.,Moy, C.M., Christenson, K., 2004. A 1500-year El Nino/SouthernOscillation and rainfall history for the Isthmus of Panama fromspeleothem calcite. J. Geophys. Res. Atmos. 109.
Lau, N.C., Nath, M.J., 2000. Impact of ENSO on the variability of theAsian–Australian monsoons as simulated in GCM experiments.J. Climate 13, 4287–4309.
Lau, N.C., Nath, M.J., 2003. Atmosphere-ocean variations in theIndo–Pacific sector during ENSO episodes. J. Climate 16, 3–20.
Lawrence, J.R., Gedzelman, S.D., Dexheimer, D., Cho, H.K., Carrie,G.D., Gasparini, R., Anderson, C.R., Bowman, K.P., Biggerstaff,
219K.M. Cobb et al. / Earth and Planetary Science Letters 263 (2007) 207–220

M.I., 2004. Stable isotopic composition of water vapor in thetropics. J. Geophys. Res. Atmos. 109, D06115.
Madden, R.A., Julian, P.R., 1971. Detection of a 40–50day oscillationin zonal wind in tropical pacific. J. Atmos. Sci. 28, 702–708.
Madden, R.A., Julian, P.R., 1972. Description of global-scalecirculation cells in tropics with a 40–50day period. J. Atmos.Sci. 29, 1109–1123.
McDonald, J., Drysdale, R., Hill, D., 2004. The 2002–2003 El Ninorecorded in Australian cave drip waters: implications forreconstructing rainfall histories using stalagmites. Geophys. Res.Lett. 31, L22202.
Mickler, P.J., Banner, J.L., Stern, L., Asmerom, Y., Edwards, R.L., Ito,E., 2004. Stable isotope variations in modern tropical speleothems:evaluating equilibrium vs. kinetic isotope effects. Geochim.Cosmochim. Acta 68, 4381–4393.
Noone, D., Simmonds, I., 2002. Associations between delta O-18 ofwater and climate parameters in a simulation of atmosphericcirculation for 1979–95. J. Climate 15, 3150–3169.
Partin, J.W., Cobb, K.M., Adkins, J.F., Fernandez, D.P., Clark, B.,2007.Millennial-scale trends inWest PacificWarm Pool hydrologyfrom the Last Glacial Maximum to present, Nature 499, 452–455.doi:10.1038/nature06164.
Perrin, K., Jeannin, P.Y., Zwahlen, F., 2003. Epikarst storage in a karstaquifer: a conceptual model based on isotopic data, Milandre testsite, Switzerland. J. Hydrol. 279, 106–124.
Rasmusson, E.M., Wallace, J.M., 1983. Meteorlogical aspects of the ElNiño/Southern Oscillation. Science 222, 1195–1202.
Ropelewski, C.F., Halpert, M.S., 1987. Global and regional scaleprecipitation patterns associated with the El Nino/SouthernOscillation. Mon. Weather Rev. 115, 1606–1626.
Rozanski, K., Araguas-Araguas, L., Gonfiantini, R., 1993. Isotopicpatterns in modern global precipitation. In: Swart, P.K., Lohmann,K.C., McKenzie, J. (Eds.), Climate Change in Continental IsotopicRecords. Geophysical Monograph, vol. 78. American GeophysicalUnion, Washington D.C., pp. 1–36.
Siegenthaler, U., Oeschger, H., 1980. Correlation of 18O inprecipitation with temperature and altitude. Nature 285, 314–417.
Sondag, F., van Ruymbeke, M., Soubies, F., Santos, R., Somerhausen,A., Seidel, A., Boggiani, P., 2003. Monitoring present day climaticconditions in tropical caves using an Environmental DataAcquisition System (EDAS). J. Hydrol. 273, 103–118.
Treble, P.C., Budd, W.F., Hope, P.K., Rustomji, P.K., 2005a. Synoptic-scale climate patterns associated with rainfall delta O-18 insouthern Australia. J. Hydrol. 302, 270–282.
Treble, P.C., Chappell, J., Gagan, M.K., McKeegan, K.D., Harrison,T.M., 2005b. In situ measurement of seasonal delta O-18variations and analysis of isotopic trends in a modem speleothemfrom southwest Australia. Earth Planet. Sci. Lett. 233, 17–32.
Vuille, M., Werner, M., 2005. Stable isotopes in precipitationrecording South American summer monsoon and ENSO variabil-ity: observations and model results. Clim. Dyn. 25, 410–413.
Vuille, M., Werner, M., Bradley, R.S., Keimig, F., 2005. Stableisotopes in precipitation in the Asian monsoon region. J. Geophys.Res. Atmos. 110, D23108.
Wang, Y.J., Cheng, H., Edwards, R.L., An, Z.S., Wu, J.Y., Shen, C.C.,Dorale, J.A., 2001. A high-resolution absolute-dated LatePleistocene monsoon record from Hulu Cave, China. Science294, 2345–2348.
Wang, X., Auler, A.S., Edwards, R.L., Cheng, H., Ito, E., Solheid, M.,2006. Interhemispheric anti-phasing of rainfall during the lastglacial period. Quat. Sci. Rev. 25, 3391–3403.
Worden, J., Noone, D., Bowman, K., 2007. Importance of rainevaporation and continental convection in the tropical water cycle.Nature 445, 528–532.
Xie, P.P., Arkin, P.A., 1997. Global precipitation: a 17-year monthlyanalysis based on gauge observations, satellite estimates, andnumerical model outputs. Bull. Am. Meteorol. Soc. 78, 2539–2558.
Yuan, D.X., Cheng, H., Edwards, R.L., Dykoski, C.A., Kelly, M.J.,Zhang, M.L., Qing, J.M., Lin, Y.S., Wang, Y.J., Wu, J.Y., Dorale,J.A., An, Z.S., Cai, Y.J., 2004. Timing, duration, and transitions ofthe Last Interglacial Asian Monsoon. Science 304, 575–578.
220 K.M. Cobb et al. / Earth and Planetary Science Letters 263 (2007) 207–220