Spatio-temporal variations of land surface temperature and ...
SPATIAL AND TEMPORAL VARIATIONS OF INTERNALWAVES IN THE NORTHERN SOUTH CHINA SEA
Weigen Huang (1), Johnny Johannessen (2,3), Werner Alpers (4)
Jingsong Yang (1), Xilin Gan (1)
(1) Second Institute of Oceanography, SOA, Hangzhou, China
(2) Nansen Environmental and Remote Sensing Center, Norway
(3) Geophysical Institute, University of Bergen, Norway
(4) Institute of Oceanography, University of Hamburg, Germany

Contents
1 Introduction
2 Data and methods
3 Observations of the internal waves
4 Variations of the IWs with thermocline
5 Variations of the IWs with wind
6 Conclusions

1 Introductionp Extensive studies have been made of IWs recently in the northern South China
Sea by field measurements, remotely sensed observations and numerical
modeling.
p Studies include information on the spatial distributions of the IWs,
characteristics and generation mechanisms.
p Satellite observations show that IWs in the northern South China Sea have
significant spatial and temporal variations.
p The IWs are thought to be generated via tide-topographic interaction, lee-wave
formation and shear flow instability.
p The spatial and temporal variations of the IWs have not been fully explained by
these generation mechanisms.
p It is the purpose of this paper to study the spatial and temporal variations of
the IWs using SAR images and to look for new explanations of the IW
distributions observed by SAR in the study area.

2 Data and methods
The study area:
The study area is the northern South China Sea which
extends from 110°W to 122°W longitude and from 18°N to
23°N latitude
CHINA
PHILIPINES
Taiwan
110°W 122°W
18°N
23°N

The SAR images:p ERS-1/2, ENVISAT and RADARSAT-1 SAR images
p 344 images taken over 13 years between 1995 and 2007
p provided by the Remote sensing Ground Station (RSGS)
of China and the ESA-MOST Dragon Programme
ENVISAT ASAR on 21 June 2005 Radarsat-1 SAR on 24 April 2001
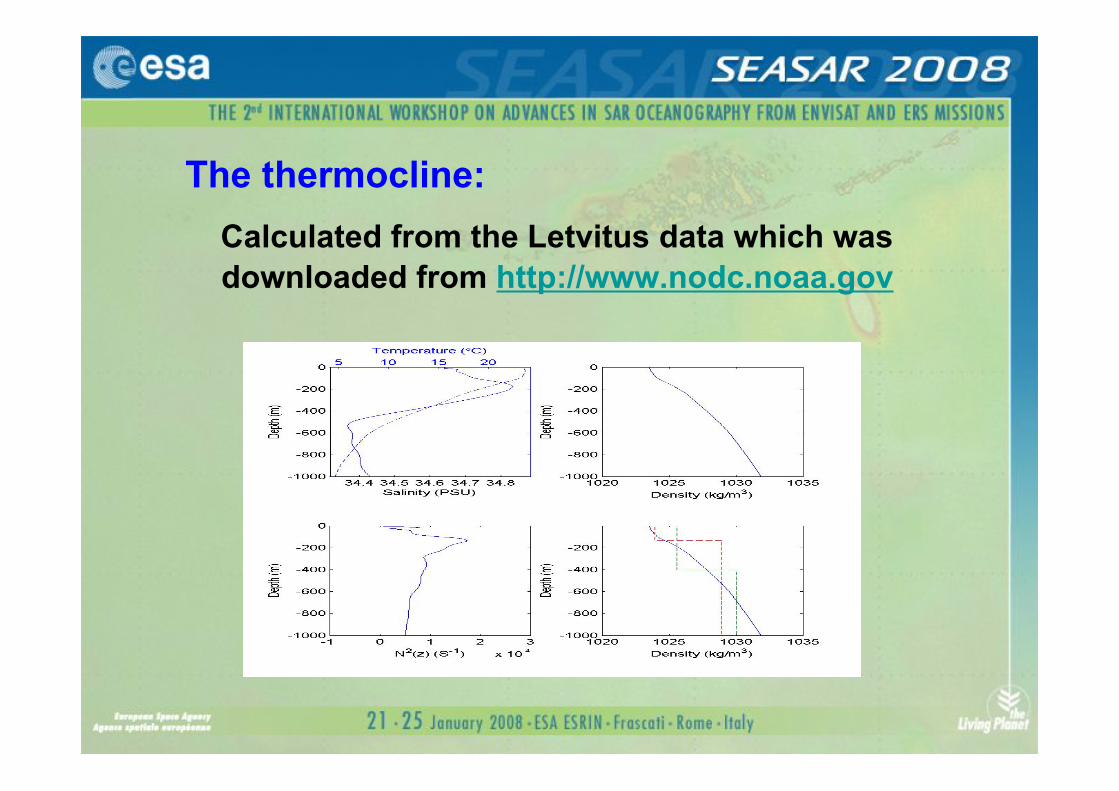
The thermocline:
Calculated from the Letvitus data which was
downloaded from http://www.nodc.noaa.gov

The wind speed:p Over each internal wave image estimated from the BlendQscat
data (downloaded from
http://dss.ucar.edu/datasets/ds744.4/data)
p The monthly mean wind speed have been downloaded from http://www.remss.com

3 Observations of the IWs
Internal waves are imaged by SAR and have signatures in
alternating bright and dark bands on SAR images. The Fig. showsan example of such SAR images of internal waves in the region ofthe Dongsha Island. The image was taken by ENVISAT ASAR on 21June 2005.
(b)(a)
(c) (d)
-2
-1
0
1
2
Ds0 (
dB)
-2
-1
0
1
2
Ds0 (
dB)
-500 -250 0 250 500
x' (m)
0
1
2
3
4
5
h (m
)
-750-500-250 0 250 500750
x' (m)
-5
-4
-3
-2
-1
0
h (m
)
Bright
DarkDark
Direction
Bright
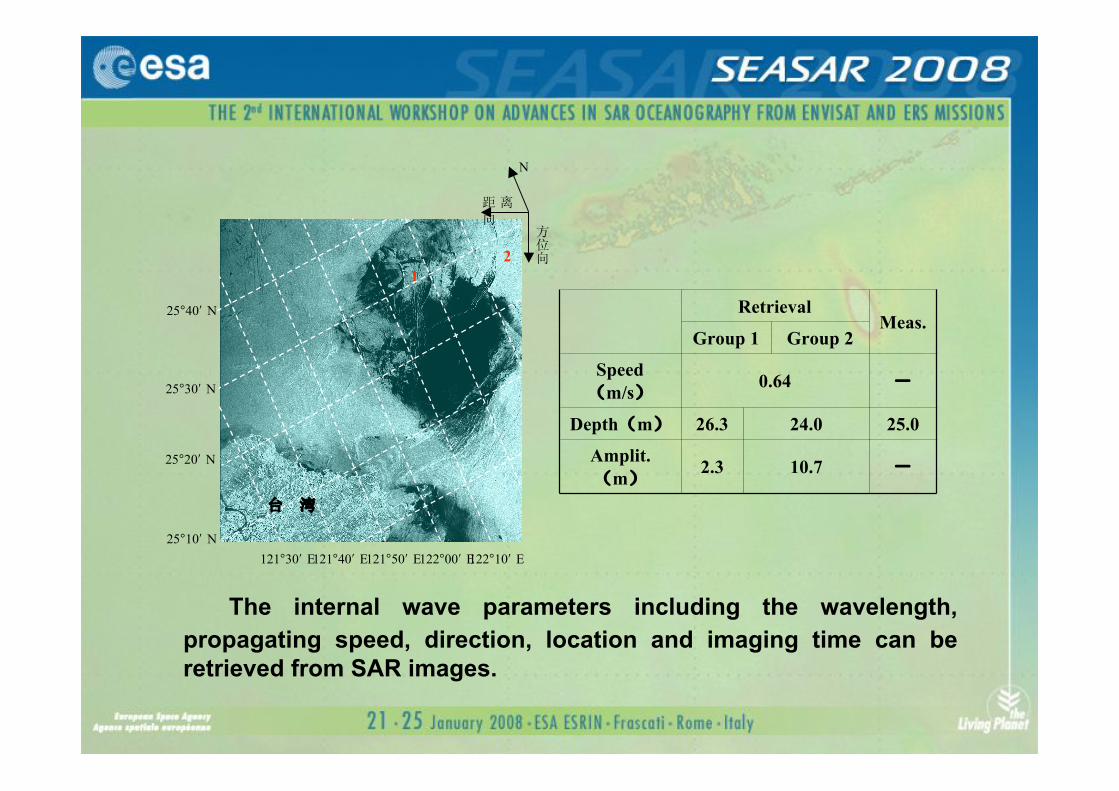
The internal wave parameters including the wavelength,
propagating speed, direction, location and imaging time can be
retrieved from SAR images.
! "
#
N
!"#
1
2
25°10! N
25°20! N
25°30! N
121°50! E122°00! E122°10! E121°30! E121°40! E
25°40! N
$%%&
'10.72.3Amplit.
(m)
25.024.026.3Depth(m)
'0.64Speed
(m/s)
Group 2Group 1Meas.
Retrieval
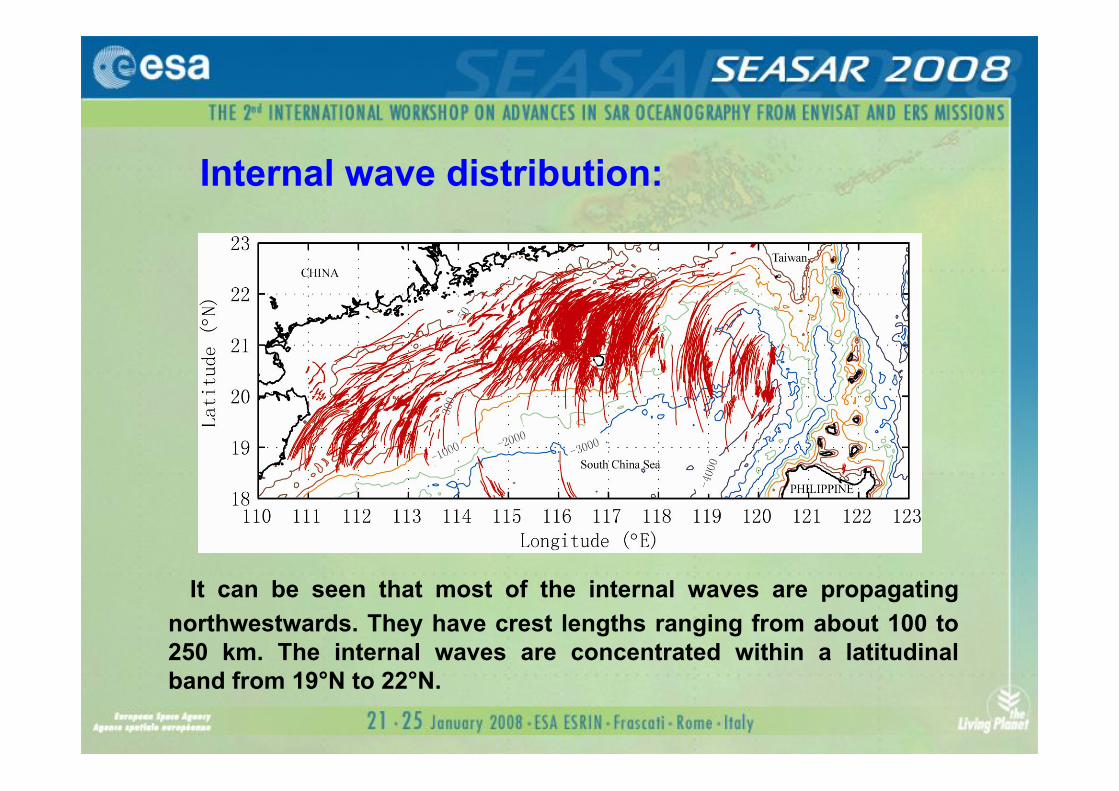
It can be seen that most of the internal waves are propagating
northwestwards. They have crest lengths ranging from about 100 to
250 km. The internal waves are concentrated within a latitudinal
band from 19°N to 22°N.
Internal wave distribution:

It can be seen that the propagating speeds of IWs range
from about 0.3 m/s to 3.0 m/s.
Propagating speed distribution:

It can be seen that the internal wave amplitudes range from
about 2 m to 150 m.
Amplitude distribution:

This is a histogram of latitudinal distribution of the IWs with a resolution of 1 degreelongitude. It is shown that there is an obvious longitudinal distribution of the IWs. TheIWs are mainly distributed between 114°E to 120°E with a high percentage of 73. About26% of IWs are concentrated within a range from 110°E to 114°E while the other 1% ofIWs appear within an area from 120°E to 123°E.
Latitudinal distribution :

This presents the seasonal distributions of the IWs. It can be
found that there exits a seasonal variation.
Seasonal distribution:

This presents the seasonal variations of the IWs. The occurrence of the
IWs reaches its seasonal maximum with a percentage of 70 in summer
and has its seasonal minimum with a percentage of 1 in winter. Spring
and autumn appear to be transit periods with percentages of 18 and 11
respectively.
Seasonal variation:
70%
18%11%
1%

Why is that?
Caused by the generation mechanisms? However, the spatial and
temporal variations of the IWs have not been fully explained by these
generation mechanisms.
Are there any decisive factors and external factors related to the spatial
and temporal variations of IWs in the study area? Thermocline? Wind?We will examine the relationships between the variations of the IWs and the
thermocline and wind.

4 Variations of IWs with thermocline
Studies have shown that the ocean vertical stratification is a
decisive factor for IW generation and propagation. The
variations of the IWs with the thermocline estimated from the
Levitus data is investigated.

The thermocline in the South China Sea is modulated by the seasonal reversing
monsoon as well as the intrusion of the Kuroshio through the Luzon Strait. This
presents the monthly mean thermocline along the 20.5°N latitude between 115.5°E
and 122.5°E. It can be seen that the thermocline exits all year round. The
thermocline ranges from 80 m to 123 m. It becomes deeper in winter due to the great
loss of heat on the surface. This indicates that it is possible to form internal waves all
the time.
Monthly mean thermocline:

It shows the monthly mean strength of the thermocline. As one would expect, the
strong thermocline occurs from June to August, corresponding well with the high
occurrence probability in summer.
Monthly mean strength of the thermocline:

Important information obtained is the correlation between the monthly
mean thermocline and the spatial variation of the internal waves. Thethermocline from April to September has a strong upwards from 119°E to115°E where there is a high occurrence probability of IWs. This mightsuggest that the strong shallowing of the thermocline provides the boundarycondition for the IW generation and propagation.
Correlation between the monthly mean
thermocline and the spatial variation of the
internal waves:

5 Variations of the IWs with wind
Sea surface wind is an important factor forinternal wave imaging according to SARimaging theories. For example, for ERS-1/2SAR the threshold wind speed which is neededto generate the resonant Bragg waves is about3.2 m/s. For the high wind speed condition, theinternal wave signal may be too weak to beobserved by SAR due to low signal-to-noiseratio.
The variations of the internal waves in thestudy area with wind is discussed.

This fig. presents the internal wave distributions with wind. It can be seen
that 96% of internal waves are observed by SAR under wind speeds of 10
m/s while only 4% of internal waves are imaged above wind speeds of 11
m/s. This result supports that low and middle wind conditions are
favorable for SAR imaging of internal waves. High wind condition is
unfavorable for SAR imaging of internal waves.
The variation of the IWs with wind over each SAR image:

This shows the monthly mean wind field from Qscat data over the study
area. Winds are dominated by the East monsoon. In summer thesouthwesterly winds with an average wind speed of 6 m/s dominate. Inwinter the wind direction totally reverses, northeasterly winds with anaverage speed of 9 m/s prevail.
The variation of the IWs with winds over the study area:
2000

This fig. shows the monthly mean wind speed over 8 years between 2000
and 2007 over the study area. It can be seen that monthly mean wind
speed from October to March is higher than the wind speed from April to
September. The monthly averaged wind speed from October to March is
about 6.5 m/s while the monthly averaged wind speed from April to
September is about 9.3 m/s. This is due to that the winter monsoon is
much stronger than the summer monsoon.

This fig. (left) is the monthly
mean internal wave
occurrence in the study area.
It is found that there is a
strong correlation between
the monthly mean wind
speed and monthly mean
internal wave occurrence.
The higher wind speeds in
autumn and winter, the lower
probability of internal waves
observed by SAR. This may
indicate that the lower
occurrence of the internal
waves in autumn and winter
is partly due to the
instrument used to observe
the internal waves.

6 Conclusionsp In this paper the spatial and temporal variations of the IWs in the
northern South China Sea and their relationships with thermocline
and wind are discussed.
p The results show that the IWs are mainly distributed between
114°E to 120°E with a high percentage of 73. About 26% of IWs are
concentrated within a range from 110°E to 114°E while the other 1%
of IWs appear within a range from 120°E to 123°E.
p The occurrence of the IWs reaches its seasonal maximum with a
percentage of 70 in summer and has its seasonal minimum with a
percentage of 1 in winter. Spring and autumn appear to be transit
periods with percentages of 18 and 11 respectively.

6 Conclusions (cont.)
p The thermocline exits all year round indicating that it is possible
to form IWs all the time. The strong upwards of the thermocline
from 119°E to 115°E where there is a high occurrence probability of
IWs might suggest that the strong shallowing of the thermocline
provides the boundary condition for the IW generation and
propagation.
p About 96% of the IWs are observed by SAR under wind speeds of
10 m/s while only 4% of IWs are imaged above wind speeds of 11
m/s. The higher wind speeds in autumn and winter, the lower
probability of the IWs observed by SAR, suggesting that the lower
occurrence of IWs in autumn and winter is partly due to the
instrument used to observe the IWs.