Regional Transportation Plan
231
Panhandle Region Transportation Coordination Study The Goodman Corporation Prepared by Final Report January 2007 Prepared for The Panhandle Regional Transportation Advisory Group Revised
description
Regional Transportation Plan - 2007
Transcript of Regional Transportation Plan

Panhandle RegionTransportation Coordination Study
The Goodman CorporationPrepared by
Final Report
January 2007Prepared for
The Panhandle RegionalTransportation Advisory Group
Revised
Table of Contents
Panhandle Transportation Coordination Study i
Table of Contents
Executive Summary.....................................................................................................................E1
Chapter 1: Geography and Demographics
Geography.................................................................................................................................... 1-1
Demographics .............................................................................................................................. 1-3
Transit Needs Index..................................................................................................................... 1-8
Chapter 2: Planning Partners
Amarillo City Transit Profile ....................................................................................................... 2-1
Panhandle Transit......................................................................................................................... 2-5
Health and Human Services Organizations ................................................................................. 2-9
History of Regional Coordination of Public Transportation .................................................... 2-33
Chapter 3: Coordinated Service Planning Process
Regional Transportation Advisory Group ................................................................................... 3-1
Work Plan ....................................................................................................................................3-3
Outreach Process.......................................................................................................................... 3-3
Chapter 4: Transit Gaps and Overlaps
Legislative Background ............................................................................................................... 4-1
Goals and Objectives ................................................................................................................... 4-2
Transit Gaps: Unmet Demand...................................................................................................... 4-2
Transit Gaps: Areas with No Service........................................................................................... 4-6
Transit Gaps: Times with No Service .......................................................................................... 4-8
Transit Gaps: Underserved Markets .......................................................................................... 4-10
Transit Overlap .......................................................................................................................... 4-11
Table of Contents
Panhandle Transportation Coordination Study ii
Chapter 5: Potential Strategies to Address Transit Gaps and Overlaps
Review of JARC and NF Funding ............................................................................................... 5-1
Coordination Strategies: General Approaches ............................................................................. 5-4
Coordination Strategies: Panhandle Examples ............................................................................ 5-5
Chapter 6: Barriers and Constraints to Coordination
Barriers......................................................................................................................................... 6-3
Constraints ................................................................................................................................. 6-17
Chapter 7: Action Plans
Job Access in Childress, Texas .................................................................................................... 7-2
Job Access in Hereford, Texas................................................................................................... 7-11
Travel Training through PILC ................................................................................................... 7-14
Same Day Medical and Essential Trip Voucher Program......................................................... 7-17
Transportation Coordination / Mobility Management ............................................................... 7-21
Flex Routing in Amarillo ........................................................................................................... 7-23
Independent Transportation Network (ITN).............................................................................. 7-25
Chapter 8: Action Plan Evaluation
JARC Eligible Projects ................................................................................................................ 8-1
NF Eligible Projects..................................................................................................................... 8-3
Chapter 9: Continuation Strategies
Plan Update / Cycle ...................................................................................................................... 9-1
Appendix A..................................................................... Demographic Values for Panhandle Region
Appendix B...............................................................................................................County Profiles
Appendix C ..................................... FY04 to FY05 Panhandle Transit: Operating Statistics by County
Appendix D................................................................................ Panhandle Region Agency Contacts
Appendix E ............................................................... Panhandle Transportation Coordination Survey

Table of Contents
Panhandle Transportation Coordination Study iii
Appendix F................................................................................................... County Officials Survey
Appendix G................................................................................................ Public Meeting Summary
Appendix H................................................................................Panhandle Transit Demand Estimate
Appendix I..............................................................................Van and Bus Pool Workshop Material
This project was funded in part through the Federal Transit Administration. The contents of this report reflect the analysis of The Goodman Corporation which is responsible for the accuracy of the data and information presented herein. The contents do not necessarily reflect the official views or policies of the Federal Transit Administration.
Executive Summary
Panhandle Transportation Coordination Study ES-1
Executive Summary
If transportation formula funding were more concerned with how much land a transit agency has
to cover than the number of people it has to serve, the Texas Panhandle would be in the money.
With 26 counties, and nearly 26,000 square miles, the Panhandle is larger than ten of the nation’s
states. However, at 403,000 people, it is also one of the least populated regions with less than
eight people per square mile in all but two counties. Combine this basic operating environment
with a population that displays a high percentage of elderly, a high incidence of disability; and
some persistent rural poverty, and these socioeconomic characteristics suggest significant
challenges to the basic activities of daily living, such as mobility.
The Panhandle Transportation Coordination Study presents transportation providers’ and users’
concerns, records a local process of information gathering, and recommends strategies to begin
meeting the challenge of effectively and efficiently improving the mobility of all the Panhandle’s
citizens, but especially those who are elderly, disabled, and/or low-income. This study was
initiated in response the Texas Legislature’s passage of H.B. 3588 and the Federal
Transportation Administration’s (FTA) guidelines regarding the planning requirements for
federal Job Access Reverse Commute (JARC) and New Freedom (NF) funding.
The study has been led by a 19-member advisory group, the Regional Transportation Advisory
Group or RTAG. The goals and objectives adopted by the RTAG are aligned with the legislative
intent of H.B. 3588 and are outlined in the table below.
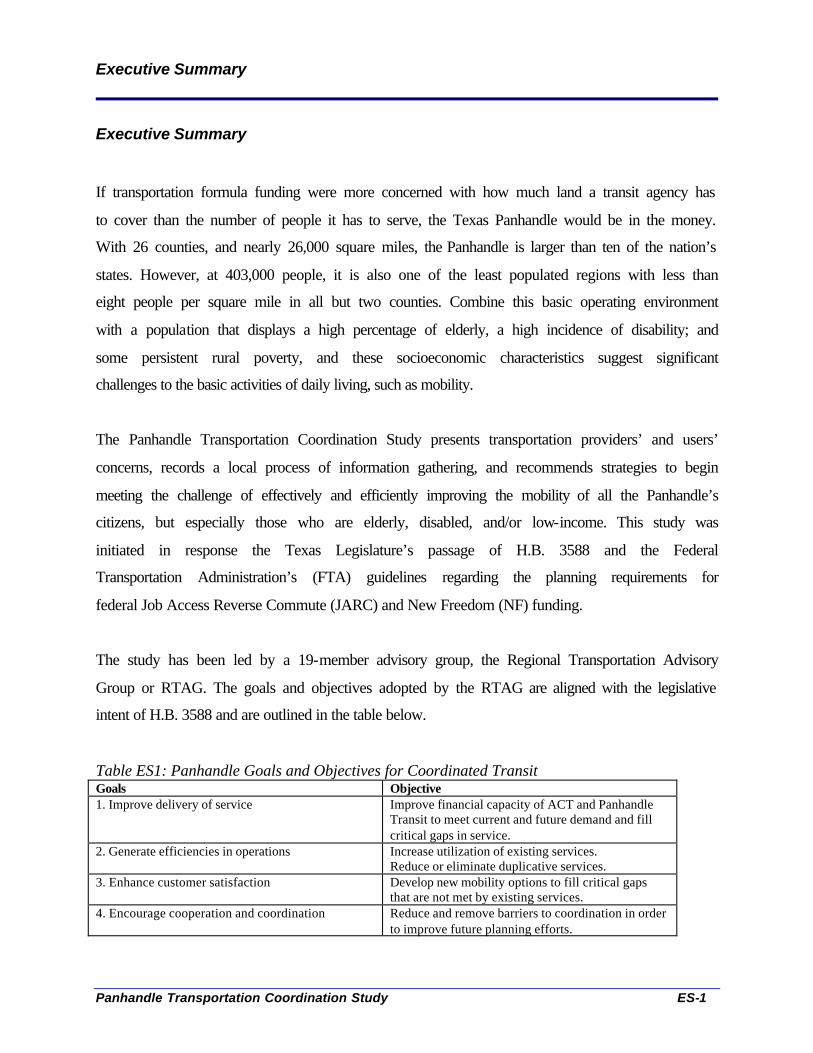
Table ES1: Panhandle Goals and Objectives for Coordinated Transit Goals Objective 1. Improve delivery of service Improve financial capacity of ACT and Panhandle
Transit to meet current and future demand and fill critical gaps in service.
2. Generate efficiencies in operations Increase utilization of existing services. Reduce or eliminate duplicative services.
3. Enhance customer satisfaction Develop new mobility options to fill critical gaps that are not met by existing services.
4. Encourage cooperation and coordination Reduce and remove barriers to coordination in order to improve future planning efforts.

Executive Summary
Panhandle Transportation Coordination Study ES-2
Transit Gaps: Amarillo City Transit (ACT) is the urban operator for the City of Amarillo. It
provides fixed route and ADA-complementary para-transit service from 6:30 am to 6:30 pm,
Monday through Saturday. Panhandle Transit is the rural operator. It provides demand-response
service to all 26 counties (excluding the City of Amarillo) from 8:00 am to 5:00 pm, Monday
through Friday. Between these two agencies, all counties have access to basic transportation
services during their normal operating hours. However, some health and human services
agencies or members of the public have expressed the needs for additional levels of service
including: 1) better access to rural job sites; 2) after-hours or same-day para-transit service for
medical or other essential trips; and 3) more flexible and/or higher levels of personal support for
senior transportation.
Transit Overlaps: Little to no transit vehicle overlap was identified in the rural areas outside of
Amarillo. In the rural regions, there is no public transportation provider besides Panhandle
Transit, including taxis. Excluding Potter County, Panhandle Transit operates 40 vehicles to
serve the remaining 25 counties. Only 19 additional vehicles were identified through the
Panhandle Transportation Inventory as being operated by other agencies. There is a higher
concentration of resources within the City of Amarillo. This is expected as it is the region’s
population center and the headquarters for many agencies. Areas where agencies have each
invested resources include maintenance facilities, travel training, and
reservation/scheduling/dispatch software. In these instances, there may be potential to share
resources; however this would require additional resources in-and-of themselves in order to
upgrade, expand, and/or hire additional personnel. At this time, the RTAG has decided to pursue
joint travel training through the Panhandle Independent Living Center.
Unmet Needs: Coordination supposes that there is a fundamentally sound system that can serve
as the core or backbone for the coordinated efforts. Within Amarillo, this is not the case. ACT is
facing an increasingly tight funding and will soon be in a position where it will need to consider
an alternative to fixed route with a complementary paratransit service. Over a period of six years
(from 2004 to 2010), ACT will experience a permanent reduction of $272,824 in state support –
from $672,980 to $400,156. Decreases in state funding are due to a recently adopted Texas
Executive Summary
Panhandle Transportation Coordination Study ES-3
Department of Transportation (TxDOT) funding formula for public transit which link funding
levels to performance, transit need, and local financial commitment to transit. Based on these
TxDOT’s standards, ACT’s funding is projected to decrease during the 2004 – 2009 timeframe.
TxDOT has indicated that it will re-evaluate its formula beginning in FY2008 at which time,
future year state funding for ACT may change.
Furthermore, ACT will potentially lose about $1.34 million in federal funding support for
operations if Amarillo’s population exceeds 200,000; this is an event expected by the 2010
census. The financial and operational health of ACT is important because, without a healthy
core, other initiatives, like coordination planning, are disadvantaged.
JARC and NF Funding: It is anticipated that there will be a call for JARC and NF projects in
early 2007 and that the funding available will include FY06 and FY07 allocations
(approximately $15.4 million). Funding for projects will be competitive across the state; projects
proposed by small urban recipients will be evaluated against their peers as will a rural recipient’s
projects. One objective of the Panhandle Transportation Coordination Study is to select multiple,
sustainable projects that reflect the transportation needs of the community; incorporate a
coordinated approach to better utilize the region’s resources; and can be reasonably
implemented. A brief description of eligible projects for each funding category follows.
Job Access and Reverse Commute (JARC): The purpose of the JARC program is to provide
funding for local programs that offer job access and reverse commute transportation services to
low-income individuals. Eligible projects include, but are not limited to:
• Demand-response van service;
• Ridesharing and carpooling activities;
• Expanding fixed-route transit service areas;
• Late-night and weekend service
• Guaranteed ride home service;
• Shuttle service; and
• Bicycling.
Executive Summary
Panhandle Transportation Coordination Study ES-4
Marketing and promotional activities to encourage use of transit by workers with non-traditional
schedules and use of transit voucher program by appropriate agencies for welfare recipients and
other low-income individuals are also eligible activities.
New Freedom (NF): The purpose of the NF is to encourage services and facility improvements
to address the transportation needs of individuals with disabilities that are either new and/or go
beyond those that are required by the ADA of 1990. Eligible projects may include, but are not
limited to:
• Purchasing vehicles and supporting accessible taxi, ride sharing, and vanpooling
programs; including staff training, administration, and maintenance;
• Administering voucher and transit pass programs for transportation services offered by
transit and human services providers;
• Administering volunteer driver and aide programs to support the management of driver
recruitment, safety, background checks, scheduling, coordination with riders and other
related support functions;
• Training for individual users on awareness, knowledge, and skills of public and
alternative transportation options available in their communities. This includes travel
training services; and
• Coordinate transportation service access beyond those served by one agency or
organization within a community. For example, a non-profit agency receiving funding
through NF could not limit the services it provides to its own clientele. These services are
intended to build cooperation with other existing providers.
The following are considered eligible mobility management activities:
• The development of coordinated plans;
• Support of state and local coordination policy bodies and councils;
• The maintenance and operation of transportation brokerages to coordinate providers,
funding agencies, and riders;

Executive Summary
Panhandle Transportation Coordination Study ES-5
• The development and maintenance of other transportation coordination bodies and their
activities, including employer-oriented Transportation Management Organizations and
neighborhood travel coordination activities;
• The development and support of one-stop transportation call centers to coordinate
transportation information on all travel modes and to manage eligibility requirements
and arrangements for customers among supporting programs; and
• The acquisition and operation of intelligent transportation technologies to help plan and
operate coordinated systems including GIS mapping, coordinated vehicle scheduling,
dispatching, and monitoring technologies, as well as technologies to track costs and
billing in a coordinated system.
Action Plans: Through a public participation process that included ten public meetings, seven
workshops, and numerous stakeholder phone interviews or site visits, seven action plans were
adopted by the RTAG for inclusion in this study. Each of these plans met or largely met the
criteria adopted by the RTAG for plan inclusion. These criteria include: 1) met the goals adopted
by the RTAG; 2) the project attempts to coordinate resources: 3) the project meets identified
needs; 4) the project has support and is realistically achievable; and 5) the project is ready to
move forward.
Actions plans adopted by the RTAG include:
• Provide job-access service in the Childress region;
• Provide job-access service in the Hereford region;
• Provide increased travel training through Panhandle Independent Living Center;
• Provide same-day, non-emergency medical transportation to Spec-Trans eligible riders
with a voucher program; and
• Institute a transit-coordination/mobility management position to sustain the development
of coordination efforts throughout the region;
• Support the implementation of flex routing by ACT; and
• Support the creation of an Independent Transportation Network by the Senior
Ambassadors Coalition.
Chapter 1: Geography and Demographics
Panhandle Transportation Coordination Study 1-1
Chapter 1: Geography and Demographics
If transportation formula funding were more concerned with how much land a transit agency has
to cover than the number of people it has to serve, the Panhandle would be in the money. With
26 counties, and nearly 26,000 square miles, the Panhandle is larger than ten of the nation’s
states. However, at 403,000 people, it is also one of the least populated regions with less than
eight people per square mile in all but two counties. Combine this basic operating environment
with a high percentage of elderly, a high incidence of disability; and some persistent rural
poverty, and these socioeconomic characteristics suggest significant challenges to the basic
activities of daily living, such as mobility.
In order to understand where mobility may represent a greater challenge, a demographic profile
has been completed for each of the counties within the Panhandle region. The county-level
profiles focus on characteristics associated with higher transit use: percentage of people who are
elderly and/or disabled; have low incomes; have higher levels of low education attainment; and
or are recent immigrants.
These and additional demographics are compiled to create a Transit Needs Index for each
county. (The Transit Needs Index is a methodology that compiles demographic characteristics
into a single value to reflect a county’s potential need for transit services.) The first section of
this chapter reviews the county-level data and is then followed by the Transit Needs Index
findings. Appendix A: Demographic Values for Panhandle Region contains the values used to
calculate the Transit Needs Index score for each study area. Appendix B: County Demographics
provides a county-by-county look at changes in population, major employers and senior services,
and transportation services.
Geography
The Texas Panhandle consists of the northernmost 26 counties in the state and is bordered by
New Mexico to the west and Oklahoma to the north and east. There are 62 cities in the
Chapter 1: Geography and Demographics
Panhandle Transportation Coordination Study 1-2
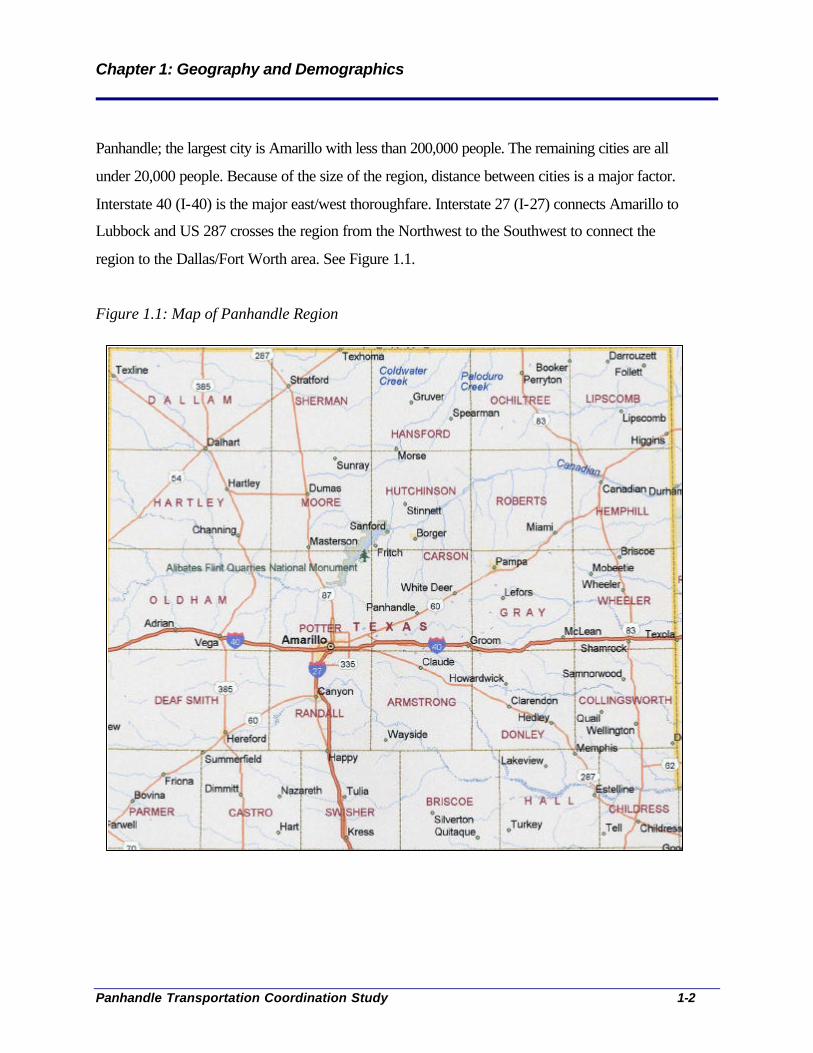
Panhandle; the largest city is Amarillo with less than 200,000 people. The remaining cities are all
under 20,000 people. Because of the size of the region, distance between cities is a major factor.
Interstate 40 (I-40) is the major east/west thoroughfare. Interstate 27 (I-27) connects Amarillo to
Lubbock and US 287 crosses the region from the Northwest to the Southwest to connect the
region to the Dallas/Fort Worth area. See Figure 1.1.
Figure 1.1: Map of Panhandle Region

Chapter 1: Geography and Demographics
Panhandle Transportation Coordination Study 1-3
Demographics
Population
One of the goals of public transit is to provide services efficiently - to provide the most people
with a good service at the most reasonable cost. Knowing where the population is concentrated
helps to determine how to allocate available transit to benefit the most users.
A major challenge to providing transit services within the Panhandle region is very low
population density throughout the region. With the exception of Potter and Randall counties, the
average density 8.00 people per square mile. Roberts County, the least populated county in the
region, has less than 1 person per square mile. By comparison, the City of Amarillo’s average
density is 2,423 people per square mile – comparable with that of Abilene, Waco, Denton, and
Port Arthur. Furthermore, between the 1990 and 2000 census, 15 counties lost population. This
decrease has affected and will continue to affect its ability to secure federal and state dollars to
fund transportation.
Figure 1.2: Panhandle Region Population by County
Chapter 1: Geography and Demographics
Panhandle Transportation Coordination Study 1-4
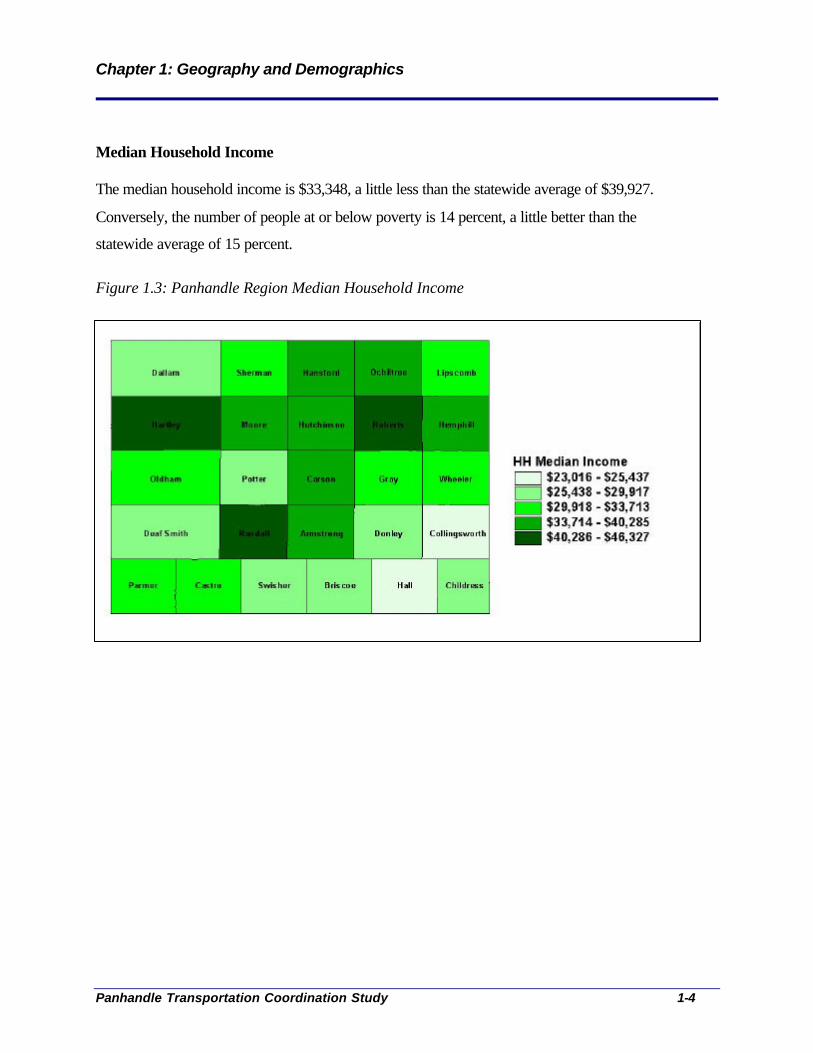
Median Household Income The median household income is $33,348, a little less than the statewide average of $39,927.
Conversely, the number of people at or below poverty is 14 percent, a little better than the
statewide average of 15 percent.
Figure 1.3: Panhandle Region Median Household Income
Chapter 1: Geography and Demographics
Panhandle Transportation Coordination Study 1-5
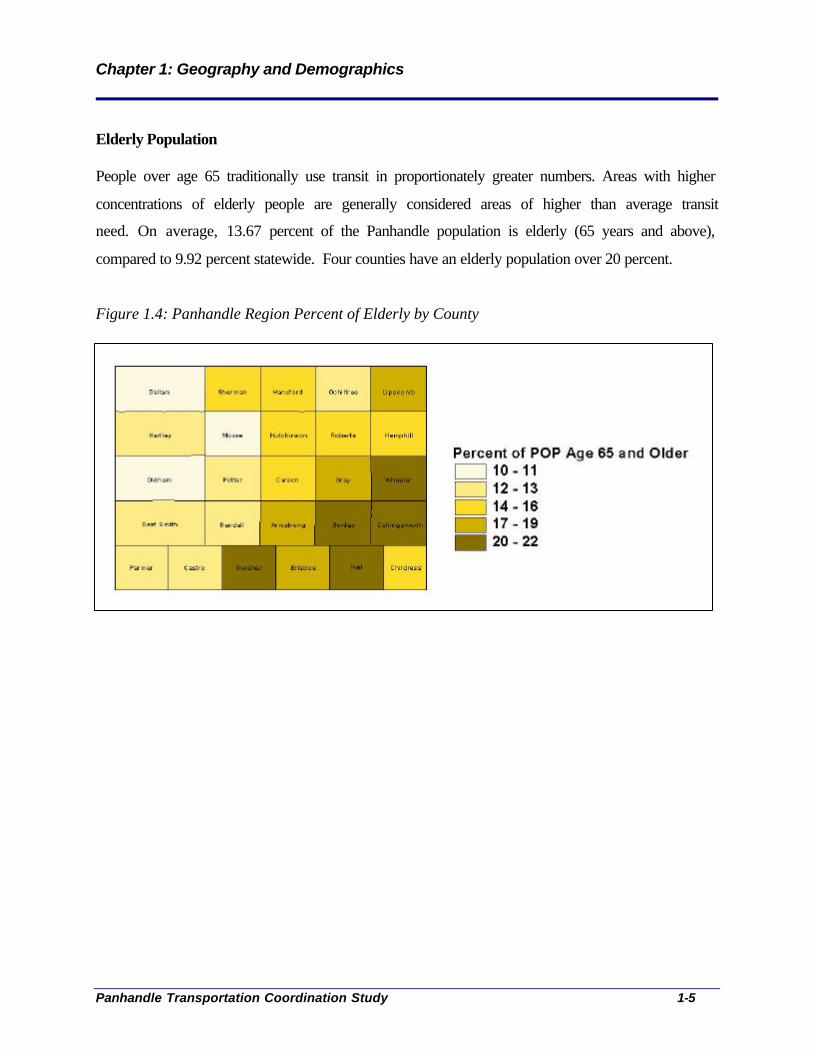
Elderly Population People over age 65 traditionally use transit in proportionately greater numbers. Areas with higher
concentrations of elderly people are generally considered areas of higher than average transit
need. On average, 13.67 percent of the Panhandle population is elderly (65 years and above),
compared to 9.92 percent statewide. Four counties have an elderly population over 20 percent.
Figure 1.4: Panhandle Region Percent of Elderly by County
Chapter 1: Geography and Demographics
Panhandle Transportation Coordination Study 1-6
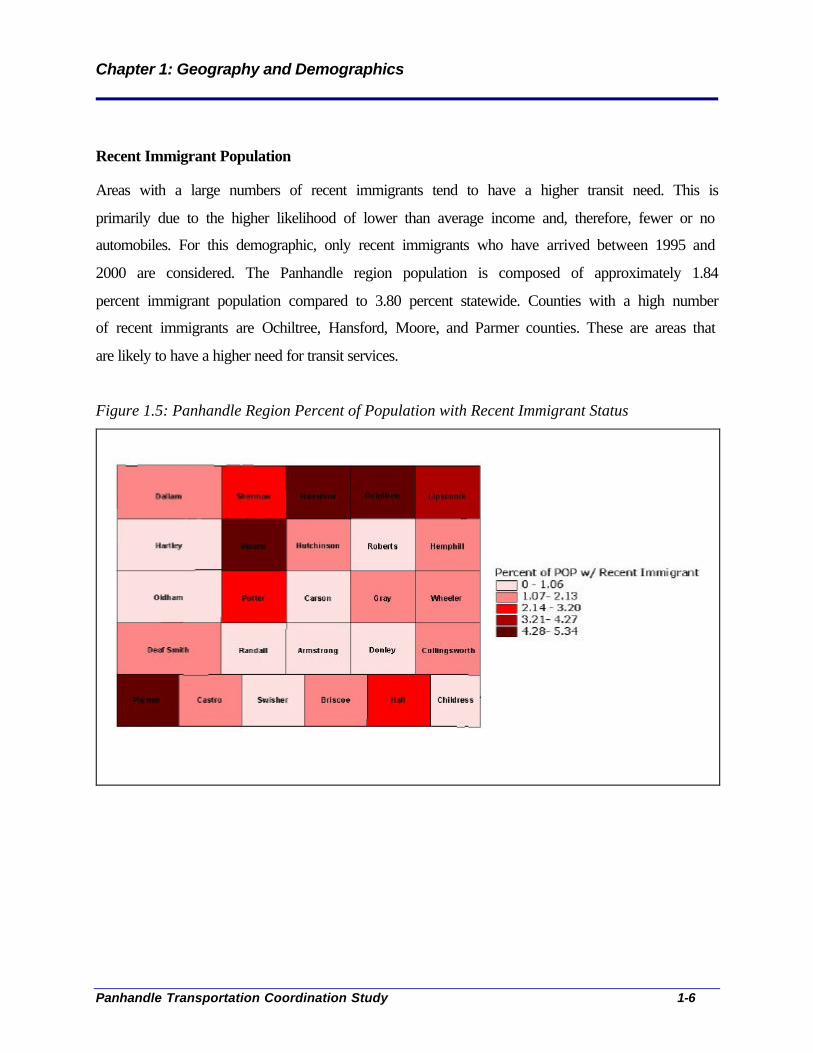
Recent Immigrant Population
Areas with a large numbers of recent immigrants tend to have a higher transit need. This is
primarily due to the higher likelihood of lower than average income and, therefore, fewer or no
automobiles. For this demographic, only recent immigrants who have arrived between 1995 and
2000 are considered. The Panhandle region population is composed of approximately 1.84
percent immigrant population compared to 3.80 percent statewide. Counties with a high number
of recent immigrants are Ochiltree, Hansford, Moore, and Parmer counties. These are areas that
are likely to have a higher need for transit services.
Figure 1.5: Panhandle Region Percent of Population with Recent Immigrant Status
Chapter 1: Geography and Demographics
Panhandle Transportation Coordination Study 1-7
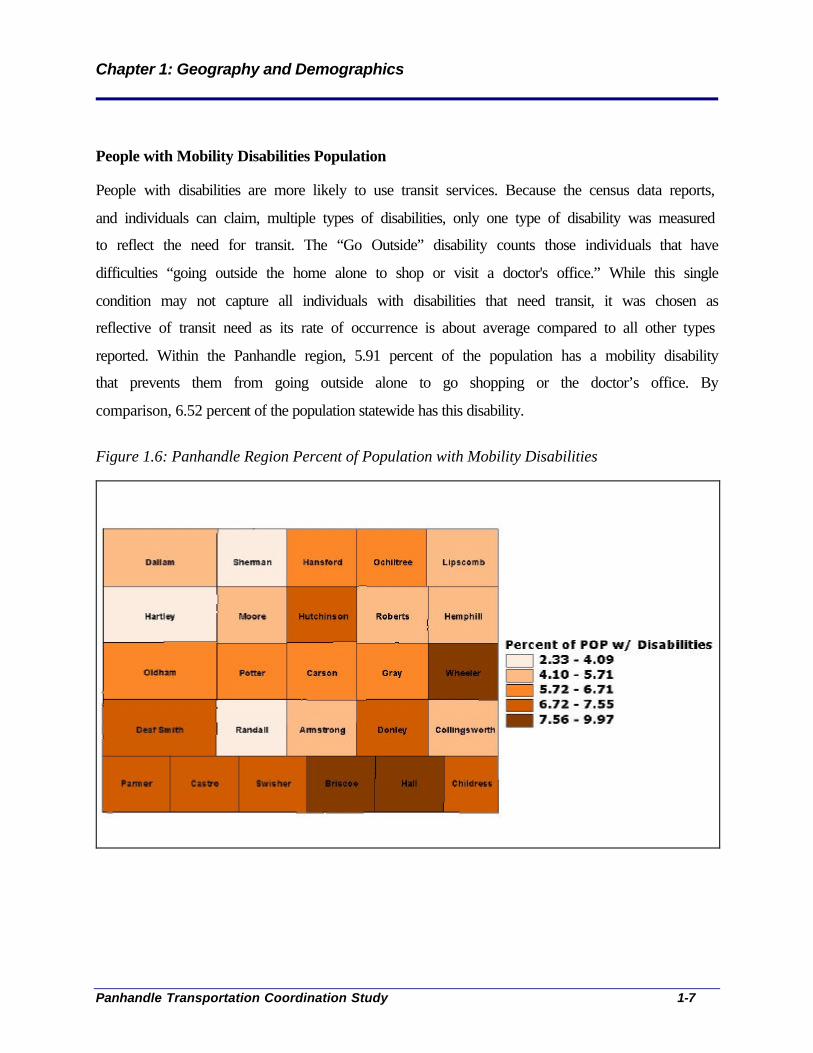
People with Mobility Disabilities Population
People with disabilities are more likely to use transit services. Because the census data reports,
and individuals can claim, multiple types of disabilities, only one type of disability was measured
to reflect the need for transit. The “Go Outside” disability counts those individuals that have
difficulties “going outside the home alone to shop or visit a doctor's office.” While this single
condition may not capture all individuals with disabilities that need transit, it was chosen as
reflective of transit need as its rate of occurrence is about average compared to all other types
reported. Within the Panhandle region, 5.91 percent of the population has a mobility disability
that prevents them from going outside alone to go shopping or the doctor’s office. By
comparison, 6.52 percent of the population statewide has this disability.
Figure 1.6: Panhandle Region Percent of Population with Mobility Disabilities
Chapter 1: Geography and Demographics
Panhandle Transportation Coordination Study 1-8
Transit Needs Index A more complete analysis of all transit market demographics is the Transit Needs Index. Bus
ridership tends to increase or decrease with changes in key demographic characteristics. For
example, income is a major determinant in who uses transit; as one moves up in income, usage
tends to decrease. Some groups are genuinely more likely to use transit irrespective of income.
These include women, minorities, immigrants (especially recent immigrants), persons without a
car, the mobility impaired, persons over the age of 65, and those with less than a full high school
education.
A Transit Needs Index is tool that captures and measures the differences in transit usage for a
particular group compared to the group norm. An index of 1.00 indicates average transit usage,
higher indicates above average usage (for example, 2.00 is twice the average), and lower
indicates less than average. Table 1.1: Typical Transit Needs Values outlines the transit-use
index for average metropolitan transit use for the key demographic groups.

Chapter 1: Geography and Demographics
Panhandle Transportation Coordination Study 1-9
Table 1.1: Typical Transit Needs Values Market Niche Transit Need Index Market Niche Transit Need Index Sex: Male Female
0.85 1.18
Household Income: Under $20K
1.15 (average)
Race & Ethnicity: White Black Hispanic Asian
0.68 2.72 1.73 1.74
Immigration Status: Non-immigrant Immigrant
0.84 2.08
Vehicle Ownership: No Car One or more Car
5.76 0.68
Limitations: Work Limitation Mobility Limitation
1.25 2.41
Age: 60-64 65-69
1.07 1.10
Education: No School Elementary Junior High Some High School
2.59 2.08 1.69 1.25
Source: Transit Cooperative Research Program. Chapter 1: Current Transit Markets
A Transit Need Index is designed to relate demographic data such as household income,
mobility-impaired/work-impaired population, auto availability, education attainment, minority
status, immigrant status and age to transit need. Research supports the theory that a positive
relationship exists between these data and higher transit usage.
All the counties within the Panhandle were evaluated and given a score for each of these eight
characteristics. Depending on the characteristic, the average or median score for the set was used
to establish the center value for the region’s relative scale. Scores where then summed to create a
composite score which was then weighted by the number of households.
Chapter 1: Geography and Demographics
Panhandle Transportation Coordination Study 1-10
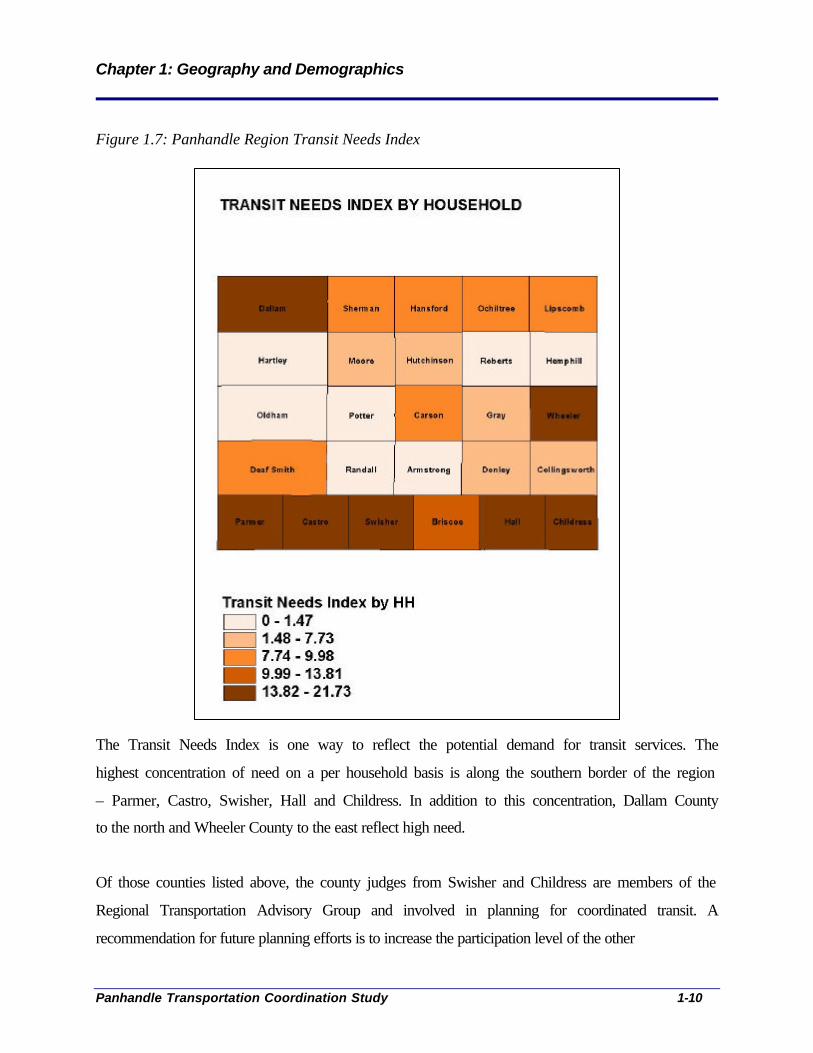
Figure 1.7: Panhandle Region Transit Needs Index The Transit Needs Index is one way to reflect the potential demand for transit services. The
highest concentration of need on a per household basis is along the southern border of the region
– Parmer, Castro, Swisher, Hall and Childress. In addition to this concentration, Dallam County
to the north and Wheeler County to the east reflect high need.
Of those counties listed above, the county judges from Swisher and Childress are members of the
Regional Transportation Advisory Group and involved in planning for coordinated transit. A
recommendation for future planning efforts is to increase the participation level of the other
Chapter 1: Geography and Demographics
Panhandle Transportation Coordination Study 1-11
counties’ officials that are identified above in order to address their transportation need.
Furthermore, the prevalence of higher-need counties along the south border points to the
potential need for a greater focus on inter-regional coordination with the South Plains District.
Chapter 2: Planning Partners
Panhandle Transportation Coordination Study 2- 1
Chapter 2: Planning Partners
There are only two public transit providers for the region’s 26 counties; Amarillo City Transit
serves the City of Amarillo and Panhandle Transit takes care of everything else. So, unlike some
of the planning regions in the state, there is less complexity in the Panhandle region because of
this clear division. Issues such as overlapping service areas or large gaps in service areas are not
present. Many of the health and human service agencies work at some level with one or both of
these agencies to meet their transportation needs.
This chapter includes a profile for Amarillo City Transit and Panhandle Transit, including
service characteristics (service area, routes, and schedules), vehicles, and budget. Following this
section, a review of the planning partners is provided. (Note: Planning partners are defined as
key or representative human service agencies that responded to the Panhandle Transportation
Coordination Survey and/or participated in follow-up phone calls or site visits. Many of these
agencies are not members of the official planning committee, the Regional Transportation
Advisory Group.)
Amarillo City Transit Organization Structure and Staffing Amarillo City Transit (ACT) is managed by the City of Amarillo. ACT’s staff includes:
• 1 director
• 2 supervisors
• 1 trainer
• 4 dispatchers
• 31 drivers (21 Fixed Route and 10 Spec-Trans)
• 1 shop supervisor
• 5 mechanics; and
• 3 maintenance personnel (staff that park and clean vehicles).

Chapter 2: Planning Partners
Panhandle Transportation Coordination Study 2- 2
Service Area
The City of Amarillo is about 87 square miles. ACT covers 85 percent area of the city and has a
service area of about 74 square miles. Areas not served by ACT include that portion of the city
east of Lakeside Drive. Both fixed route and demand response service operate within these
boundaries. See Figure 2.1: ACT Routes and Amarillo City Limits.
Figure 2.1: ACT Routes and Amarillo City Limits
Service Characteristics
ACT operates eight fixed routes within the city limits. It operates six days a week, Monday to
Saturday, from 6:30 am to 6:30 pm, with no service on Sunday. There is no service on the

Chapter 2: Planning Partners
Panhandle Transportation Coordination Study 2- 3
following holidays: New Years Day, Martin Luther King Day, Memorial Day, 4P
thP of July, Labor
Day, Thanksgiving, and Christmas.
Eight routes make up the fixed-route system with each starting in the downtown at the main
transfer point at 3P
rdP and Fillmore. The system pulses at the station every 30 minutes to allow
riders to transfer between routes. Transfers are free, cannot be used to make the return trip, and
are time-limited.
Spec-Trans is the demand-response system. It operates five vehicles and serves all points within
ACT’s service area (i.e., does not limit its service to a ¾ mile corridor abutting a fixed route).
Fare
ACT charges 75¢ for adults, 60¢ for children over the age of six; 35¢ for senior citizens, people
with disabilities, and Medicare cardholders. The Spec-Trans system charges $1.50 for adults and
75¢ for children. Personal care attendants ride for free.
Fleet Characteristics
ACT’s has 17 30-foot buses to serve its fixed route. During peak service periods, it operates 12
vehicles, leaving five spare. All the vehicles are equipped with wheelchair lifts and audio and
visual information systems for impaired persons. Five of the vehicles have “kneeling”
capability. Each vehicle has a seating capacity of 23. ACT operates seven minibuses (less than
30 feet) to serve Spec-Trans eligible riders. During peak-service periods, it operates five
vehicles, leaving two spare. All the Spec-Trans vehicles are wheelchair accessible with a seating
capacity of eight.
Chapter 2: Planning Partners
Panhandle Transportation Coordination Study 2- 4
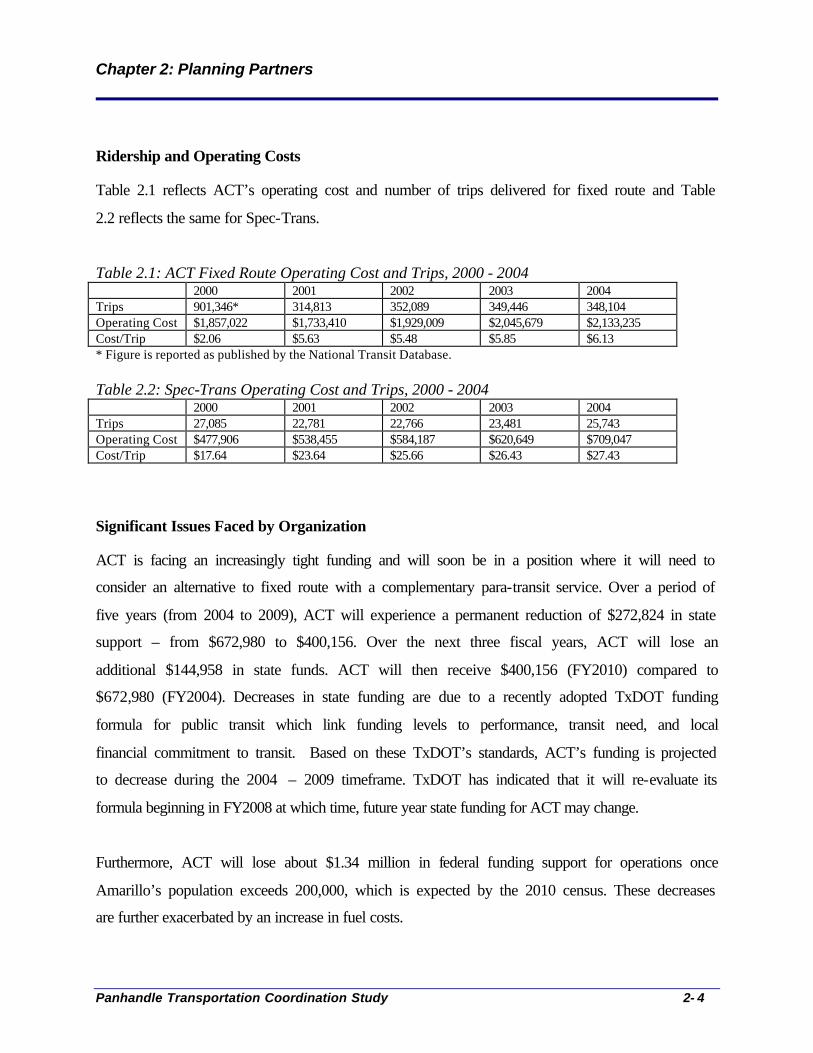
Ridership and Operating Costs
Table 2.1 reflects ACT’s operating cost and number of trips delivered for fixed route and Table
2.2 reflects the same for Spec-Trans.
Table 2.1: ACT Fixed Route Operating Cost and Trips, 2000 - 2004 2000 2001 2002 2003 2004 Trips 901,346* 314,813 352,089 349,446 348,104 Operating Cost $1,857,022 $1,733,410 $1,929,009 $2,045,679 $2,133,235 Cost/Trip $2.06 $5.63 $5.48 $5.85 $6.13 * Figure is reported as published by the National Transit Database. Table 2.2: Spec-Trans Operating Cost and Trips, 2000 - 2004 2000 2001 2002 2003 2004 Trips 27,085 22,781 22,766 23,481 25,743 Operating Cost $477,906 $538,455 $584,187 $620,649 $709,047 Cost/Trip $17.64 $23.64 $25.66 $26.43 $27.43
Significant Issues Faced by Organization
ACT is facing an increasingly tight funding and will soon be in a position where it will need to
consider an alternative to fixed route with a complementary para-transit service. Over a period of
five years (from 2004 to 2009), ACT will experience a permanent reduction of $272,824 in state
support – from $672,980 to $400,156. Over the next three fiscal years, ACT will lose an
additional $144,958 in state funds. ACT will then receive $400,156 (FY2010) compared to
$672,980 (FY2004). Decreases in state funding are due to a recently adopted TxDOT funding
formula for public transit which link funding levels to performance, transit need, and local
financial commitment to transit. Based on these TxDOT’s standards, ACT’s funding is projected
to decrease during the 2004 – 2009 timeframe. TxDOT has indicated that it will re-evaluate its
formula beginning in FY2008 at which time, future year state funding for ACT may change.
Furthermore, ACT will lose about $1.34 million in federal funding support for operations once
Amarillo’s population exceeds 200,000, which is expected by the 2010 census. These decreases
are further exacerbated by an increase in fuel costs.

Chapter 2: Planning Partners
Panhandle Transportation Coordination Study 2- 5
Staffing is another significant issue faced by ACT. New drivers at ACT start at $8.53 an hour;
this increases to $9.30 for full-time permanent drivers. This salary level makes it very difficult
to attract and retain qualified employees. Consequently, ACT faces a turnover rate of about 50
percent each year. High turnover affects ACT by generating high overtime costs. In 2005, ACT
expended $68,000 in overtime for fixed route and $27,000 for demand response.
Chapter 2: Planning Partners
Panhandle Transportation Coordination Study 2- 6
Panhandle Transit Panhandle Transit is the name of the service operated by the Panhandle Rural Transit District.
Panhandle Transit is one program under the management of Panhandle Community Services, a
nonprofit organization that provides human and social service assistance to low-income
individuals in the Panhandle.
Service Area
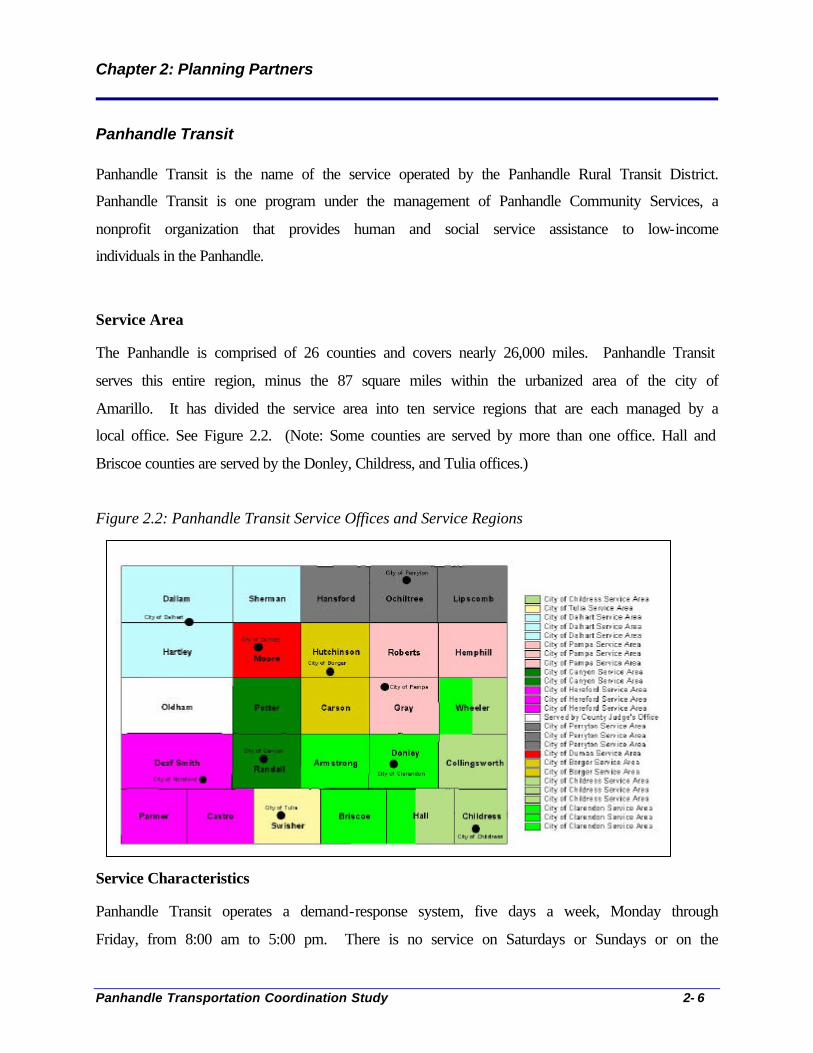
The Panhandle is comprised of 26 counties and covers nearly 26,000 miles. Panhandle Transit
serves this entire region, minus the 87 square miles within the urbanized area of the city of
Amarillo. It has divided the service area into ten service regions that are each managed by a
local office. See Figure 2.2. (Note: Some counties are served by more than one office. Hall and
Briscoe counties are served by the Donley, Childress, and Tulia offices.)
Figure 2.2: Panhandle Transit Service Offices and Service Regions
Service Characteristics
Panhandle Transit operates a demand-response system, five days a week, Monday through
Friday, from 8:00 am to 5:00 pm. There is no service on Saturdays or Sundays or on the

Chapter 2: Planning Partners
Panhandle Transportation Coordination Study 2- 7
following holidays: New Years Day, Martin Luther King Day, Memorial Day, 4P
thP of July, Labor
Day, Thanksgiving, Christmas, and New Year’s Eve. Characteristics for each of the regional
offices are described in Tables 2.3 to 2.11.
Table 2.3: City of Borger serving Carson and Hutchinson counties Number of Vehicles 4 Number of Employees 3 drivers; shared office staff with PCS Schedule for out of county trips Amarillo MWF; Hutchinson TTh Notes on Service Provided Medicaid; Borger TPMHMR satellite workshop
daily; regular work trips for about 9 clients; local college; Crisis Center for Domestic Violence
Table 2.4: City of Clarendon serving Armstrong, Brisco, Donley and Hall counties Number of Vehicles 3 Number of Employees 3 drivers; shared office staff with PCS Schedule for out of county trips Amarillo MWF Notes on Service Provided Medicaid to Amarillo M-F; school trips M-F Table 2.5: City of Hereford serving Deaf Smith, Castro and Parmer counties Number of Vehicles 4 (1 minivan with no lift; 2 cut-away with lift; 1
high-mileage solid body 15-passenger van with lift) Number of Employees 3 drivers; shared office staff with PCS Schedule for out of county trips Amarillo MWF Notes on Service Provided Medicaid to Amarillo M-F; school trips M-F;
Hereford Satellite Center; some trips to Hereford Senior Center and nursing homes
Table 2.6: City of Childress serving Collingsworth, Wheeler and Hall counties Number of Vehicles 3 (15-passenger with lift; one minivan without lift; 6
passenger van) Number of Employees 2 FT drivers; 2 Panhandle Transit drivers; shared
office staff with PCS Schedule for out of county trips Amarillo MWF; Lubbock T or Th and switching off
with Plainview T or Th; Quanah T or Th as needed Notes on Service Provided Medicaid to Amarillo M-F; school trips M-F in
Memphis
Chapter 2: Planning Partners
Panhandle Transportation Coordination Study 2- 8
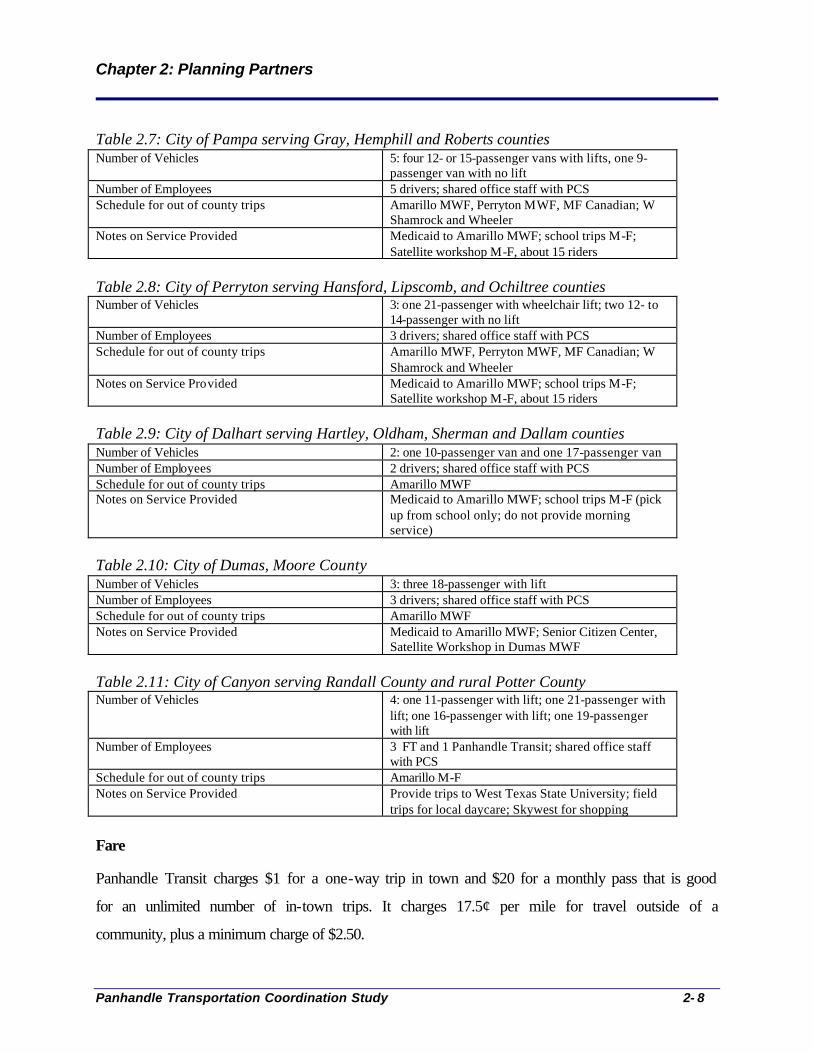
Table 2.7: City of Pampa serving Gray, Hemphill and Roberts counties Number of Vehicles 5: four 12- or 15-passenger vans with lifts, one 9-
passenger van with no lift Number of Employees 5 drivers; shared office staff with PCS Schedule for out of county trips Amarillo MWF, Perryton MWF, MF Canadian; W
Shamrock and Wheeler Notes on Service Provided Medicaid to Amarillo MWF; school trips M-F;
Satellite workshop M-F, about 15 riders Table 2.8: City of Perryton serving Hansford, Lipscomb, and Ochiltree counties Number of Vehicles 3: one 21-passenger with wheelchair lift; two 12- to
14-passenger with no lift Number of Employees 3 drivers; shared office staff with PCS Schedule for out of county trips Amarillo MWF, Perryton MWF, MF Canadian; W
Shamrock and Wheeler Notes on Service Provided Medicaid to Amarillo MWF; school trips M-F;
Satellite workshop M-F, about 15 riders Table 2.9: City of Dalhart serving Hartley, Oldham, Sherman and Dallam counties Number of Vehicles 2: one 10-passenger van and one 17-passenger van Number of Employees 2 drivers; shared office staff with PCS Schedule for out of county trips Amarillo MWF Notes on Service Provided Medicaid to Amarillo MWF; school trips M-F (pick
up from school only; do not provide morning service)
Table 2.10: City of Dumas, Moore County Number of Vehicles 3: three 18-passenger with lift Number of Employees 3 drivers; shared office staff with PCS Schedule for out of county trips Amarillo MWF Notes on Service Provided Medicaid to Amarillo MWF; Senior Citizen Center,
Satellite Workshop in Dumas MWF Table 2.11: City of Canyon serving Randall County and rural Potter County Number of Vehicles 4: one 11-passenger with lift; one 21-passenger with
lift; one 16-passenger with lift; one 19-passenger with lift
Number of Employees 3 FT and 1 Panhandle Transit; shared office staff with PCS
Schedule for out of county trips Amarillo M-F Notes on Service Provided Provide trips to West Texas State University; field
trips for local daycare; Skywest for shopping Fare
Panhandle Transit charges $1 for a one-way trip in town and $20 for a monthly pass that is good
for an unlimited number of in-town trips. It charges 17.5¢ per mile for travel outside of a
community, plus a minimum charge of $2.50.
Chapter 2: Planning Partners
Panhandle Transportation Coordination Study 2- 9
Fleet Characteristics
Panhandle Transit has a fleet of 52 cut-away style vans in its fleet. Forty-one of these vehicles,
or 77 percent, are wheelchair accessible; ten are spares/high-mileage vehicles.
Ridership and Operating Costs
During the 2004 – 2005 operating period, Panhandle Transit delivered 139,784 one-way trips at a
cost of approximately $1.4 million, or $10.30 per trip. See Appendix C: FY04 to FY05
Panhandle Transit Operating Statistics by County.
Significant Issues Faced by Organization
Like ACT, Panhandle Transit is facing difficulties attracting and retaining qualified drivers. The
recent change to the Medicaid contract has worsened this situation as drivers may now be asked
to work non-traditional hours; in fact, some are being asked to start work at 2:00 am or 3:00 am
in order to get dialysis patients to the clinic for early morning sessions. With beginning pay at
$6.15 an hour, it cannot find drivers willing to work these hours for this pay.
Vehicles are another issue for Panhandle Transit. Given the size of the region, its vehicles are
worked very hard and have a significant mileage on them; for example, eight vehicles have over
200,000 miles. It has $360,000 in local funds that it will use to purchase new vehicles and has
recently requested a Letter of No Prejudice from the Federal Transit Administration in order to
capture and leverage this value against potential future federal funds up to $1.8 million.

Chapter 2: Planning Partners
Panhandle Transportation Coordination Study 2- 10
Planning Partners – Health and Human Services Organizations Amarillo High Plains Dialysis Center
Program: The Amarillo High Plains Dialysis Center provides dialysis treatment. It operates
from 8:00 am to 10:00 pm on Monday, Wednesday, and Friday, and from 8:00 to 5:30 pm on
Tuesday, Thursday, and Saturday. (In order to meet the needs of all of its patients, it has to have
Saturday service. The lack of public transportation on Saturdays creates a barrier to receiving
treatment.) There are two centers in Amarillo; one in Pampa and one in Hereford. For each of
the four centers, 200 to 225 people are served daily.
Transit Resources: The center does not directly provide transportation but assists patients to
access transportation resources if needed. The center depends upon Medicaid transportation,
Amarillo City Transit (especially Spec-Trans), Jan Werner Transportation, and Panhandle
Transit. The Center has no financial resources available to provide or support transportation.
However, the Texas Kidney Health is a state program available to patients. Texas Kidney Health
reimburses drivers 13¢ per mile for transportation costs. In order to qualify for this program,
patients must make under $60,000 annually and the reimbursement limit is $200 per month.
Transit Needs: Between 600 - 800 kidney dialysis patients use some form of public
transportation three times a week; this equates to 1,800 – 2,400 trips per week. Amarillo High
Plains Dialysis Center reports the greatest transportation challenge has been delivering service on
Saturdays and holidays when the public systems are not running. However, AMR, the Medicaid
contractor for the region since June 2006, now provides service on Saturdays through its two
sub-contractors. (The National Kidney Foundation will provide for taxi service on holidays but
does not provide funding otherwise.)
Similarly, patients were provided with curb-to-curb service; this lower level of service can be a
problem for some patients if they are in a weakened state after treatment. Now, AMR provides
door-to-door service through its sub-contractors.
Chapter 2: Planning Partners
Panhandle Transportation Coordination Study 2- 11
No subscription service is available. Appointments must be set every week.
Coordination Issues: At one time, the center investigated the feasibility of establishing a
brokerage in Amarillo. Insurance costs, training needs to meet insurance specification, staffing
issues (who would drive, coordinate and dispatch) stalled the project. Prior to this, some level of
coordinated service was provided through the Panhandle Transportation Consortium.
Other issues with coordination include:
• Public Acceptance: Patients believe there is a stigma with riding a bus.
• Level of Service: Patients want point-to-point service; especially after receiving
treatment, they are medically fragile and need to return home quickly. If the coordination
resulted in a longer trip, coordination of services would not serve dialysis patients well.
Desired Outcomes from Coordination Study: More accessibility and availability, especially in
areas outside of Amarillo; more trips by Panhandle Transit

Chapter 2: Planning Partners
Panhandle Transportation Coordination Study 2- 12
Amarillo Senior Citizens Association
Program: The Amarillo Senior Citizens Association (ASCA) is a non-profit organization that
provides congregate meals, support services, and recreation to the seniors of Amarillo and Potter
and Randall counties. It has 1,200 members who pay a $35 annual membership fee; however,
services are available to nonmembers as well. Last year ASCA provided its service to 5,380
individuals. The ASCA is open to the public for congregate meals which are available free-of-
charge but a $5 donation is strongly encouraged. The ASCA receives funding from private
foundations and a small amount through a federal employment program for senior citizens
(Senior Aid Program). It receives no funding support from the city or state.
Transit Resources: The ASCA does not provide transportation. Its staff of 20 includes a
resource/referral clerk who is charged with reviewing members’ needs and ensuring that
appointments and resources are coordinated to ensure the needs are met. Transportation is one of
the needs that may be reviewed. The resource/referral clerk will arrange transportation for
members through its buddy system – other ASCA members who are willing to pick-up and take
people to the center or an appointment. At its core, the buddy system reflects the friendship
between people at the center and is fairly limited. On average, between 20 and 25 trips are
provided each month through this buddy system.
Transit Needs: The ASCA owned a van that was used for group outings but that was sold about
one year ago when the ASCA didn’t have the funds to operate it – rising insurance and fuel costs
were of particular concern. The ASCA estimates it spent approximately $2,000 annually on
insurance and maintenance costs and felt like it did not use the van enough to warrant the
expense. The ASCA used to have a contract with Jan Werner Transportation but this was
allowed to expire as the ASCA had some concerns with the level of service that Jan Werner was
able to provide. (Jan Werner’s service was in high demand and trips would be booked up two
weeks in advance. Preference was given to medical trips and some members could not
conveniently schedule personal or shopping trips that ASCA wanted to take.)
Chapter 2: Planning Partners
Panhandle Transportation Coordination Study 2- 13
The ASCA felt like many members did not use public transportation because: 1) the fixed-route
schedule was too structured; 2) bus stops were difficult to access; 3) the Spec-Trans service is
perceived by members as charity and they do not want to accept charity.
Coordination Issues: The ASCA is a member of the Seniors Ambassador Program and would
be interested in exploring a volunteer program directed toward providing service to seniors. The
ASCA may have resources that it can access through its Senior Aid Program that could help
cover overhead costs.
Desired Outcome(s) from Coordination Study: A transit program directed toward seniors that
provides a higher level of service and greater flexibility.
Chapter 2: Planning Partners
Panhandle Transportation Coordination Study 2- 14
American Medical Response (AMR) Program: AMR is the Medicaid contractor for Region 1 since June 2006. AMR is a
transportation broker and is able to optimize Medicaid transportation by using multiple sub-
contractors whose vehicles are routed through its RouteMatch system.
Transit Resources: AMR is the transportation broker for the Medicaid contract in Region 1. As
such, AMR does not directly own or operate any vehicles but instead relies on its network of
subcontractors. In Region 1 this includes LeFleur Transportation, Taxi Pro, and Panhandle
Transit.
Transit Needs: A brokerage benefits from a large pool of subcontractors that compete for
business. The participation of more qualified taxi and transportation providers will improve the
cost-effectiveness of the service.
Coordination Issues: The timing of the award for the Medicaid contract in Spring 2006 resulted
in a disruption to the coordination process, further exacerbated by a lack of adequate
communication between the prior Medicaid-contract holder, Panhandle Transit and AMR. At
the beginning of AMR’s contract, the company requested that all ten taxi companies and
Panhandle Transit be part of the AMR provider network. Some of these entities did not
communicate with AMR during that period, as the contract award was regarded as a
“contingency award.” AMR had an obligation to meet the contractual requirements. However,
TxDOT had not communicated with Panhandle Transit to inform them that its bid had been
considered non-responsive at this point. Thus, LeFleur was subcontracted.
Desired Outcome(s) from Coordination Study: A larger AMR provider network
Chapter 2: Planning Partners
Panhandle Transportation Coordination Study 2- 15
Area Agency on the Aging of the Panhandle
Program: The Area Agency on the Aging of the Panhandle (AAAP) provides support services
to individuals 60 years and older. The AAAP provides the planning, coordination and
implementation of many services, such as: congregate and home delivered meals, emergency
response services, adult day care, minor home repairs/modifications, homemaker services,
personal care assistance, legal assistance/representation, and transportation. Most of AAAP’s
clients are low-income.
Transit Resources: AAAP does not directly provide transportation but coordinates with
Amarillo City Transit, Panhandle Transit, and Jan Werner Transportation. AAAP may pay for
100 percent of the cost of the trip or may share the cost with the client, depending on client’s
income level. AAAP directly purchases service through an open bid. In 2006, AAAP budgeted
$90,000 for transportation that calculates to 5,389 one-way trips at a cost of $16.70 per one-way
trip.
Transit Needs: The biggest challenges are: addressing trip cancellations; trips that need to be
scheduled with less than a 24-hour advance reservation; and prejudice against riding the bus
(“cultural expectations”). Another issue is finding drivers for its congregate meals program.
Coordination Issues: AAAP currently sits on the Senior Ambassador Coalition/ transportation
task force (SAC). The SAC has investigated the feasibility of establishing an Independent
Transportation Network earlier in 2006. However, SAC has since delayed implementing this
program because of high start-up costs ($250,000) and high fares (at least $10/trip and an
additional mileage charge).
Desired Outcome for Coordination Study: More flexible and higher level of service for
seniors
Chapter 2: Planning Partners
Panhandle Transportation Coordination Study 2- 16
American Cancer Society, Road to Recovery Program
Program: The Road to Recovery Program (RRP) is a volunteer program that provides medical
trips to cancer patients. It is organized under the American Cancer Society. The service is free-
of-charge, however, clients must be referred to the program through a practitioner. The
American Cancer Society will reimburse volunteer drivers for costs; however, most drivers do
not take advantage of this or ask for minimal reimbursement. Clients must be ambulatory to use
the service since people are using their personal cars.
Transit Resources: RRP relies on volunteers who supply their own vehicles to drive patients to
their medical appointments and the pharmacy. The American Cancer Society will indemnify the
driver and provide training. It currently has five drivers who work in Hereford, Clarendon,
Memphis, Pampa, Borger as well as Amarillo. RRP will take clients to any destination. Lubbock
and Wichita Falls are common destinations outside of the 26-county Panhandle region. The
program is funded 100 percent from public donations.
Transit Needs: The RRP coordinator feels that there is a large, unmet need but does not have a
measure of how many trips are unmet. There are approximately three clients that cannot be
helped for every one that is. (In Amarillo, there are about 15 clients in the program. That would
equate to 45 clients who need, but cannot access transportation services.) The common
denominator among the RRP clients is that they do not have anyone else that they can turn to.
Coordination Issues: Many of the clients cannot take public transit because they are in such a
weakened state and need help getting into their homes. RRP is seen as the last resource. RRP
staffers will move patients out of RRP into existing transport programs once it is feasible
because of the high demand. RRP works with the Retired Senior Volunteer Program to find
volunteer drivers.
Desired Outcome for Coordination Study: Assistance in filling volunteer driver positions

Chapter 2: Planning Partners
Panhandle Transportation Coordination Study 2- 17
ASC Industries
Program: Texas Panhandle Mental Health Mental Retardation (TPMHMR) has served
individuals of the Texas Panhandle with mental illness, mental retardation or developmental
delays since the mid-1960s. The Amarillo Service Center (ASC) has workshops located in seven
locations in the Texas Panhandle: Amarillo, Borger, Clarendon, Dumas, Hereford, Pampa and
Perryton. ASC offers Employment Assistance. This program secures competitive employment
in the community. The program includes job development, employment planning and assistance
in obtaining employment.
Transit Resources: ASC relies on Spec Trans to provide work trips to clients who do not live in
foster homes. Some clients live in one of 15 group homes. Group homes typically have one van
that is driven by the attendant who provides transportation to that home’s residents. ASC also
owns sedans that are used for site visits. ASC encourages clients to use Fixed Route, if possible,
and ASC provides this travel training certification. ASC performs all its vehicle maintenance in-
house. It is not known how much is spent on transportation because it is not accounted for as a
line item. Overall, the sources of funding include: DSHS/DADS; MHMR; other state programs;
Medicaid/Medicare, local funding and federal funding.
Transit Needs:
It is difficult to schedule a trip on short notice when there is an urgent need but not an issue that
would normally be considered an emergency; for example, a client may have an acute case of the
flu and needs to see a doctor that day. If they are unable to reserve a ride through Spec-Trans on
short-notice, they have in the past called an ambulance to provide the trip.
Transportation is impossible to access before 6:30 am or after 6:30 pm. Many of ASC clients
work schedules outside of transit operating hours.
Transportation is very difficult or impossible to access in the River Road area of Amarillo.
ASC vehicles may or may not have a wheelchair lift; however the ones with the lifts are in bad
shape. It lacks the funds to purchase enough new vehicles.
Chapter 2: Planning Partners
Panhandle Transportation Coordination Study 2- 18
In rural areas, there are times when clients are unable to get to work or are stranded at work if the
weather is bad and Panhandle Transit is not running.
Coordination Issues: 1) Spec-Trans typically delivers over 500 trips to ASC clients each month.
The average monthly ridership is about 2,000 trips; therefore, about one-quarter of all trips are in
support of a single state agency. A one-way Spec-Trans trip costs ACT $31.00 to provide and the
fare is $1.50. Each trip is therefore subsidized at $29.50/trip. At 500 trips a month, this
represents at $14,750 subsidy per month that is provided by the public transit system. 2) Van
pools would be difficult for ASC clients since they cannot exceed 3 percent of the workplace.
Without a higher concentration of clients, vanpools would not be feasible.
Desired Outcomes from Coordination Study: Service that can respond to trips with a short-
term notice (less than 24 hours)
Chapter 2: Planning Partners
Panhandle Transportation Coordination Study 2- 19
Baptist Saint Anthony Home Care
Program: Baptist Saint Anthony Outreach Home Care (BSA) provides services and support
during short, critical health periods. The program sends social workers to patient’s home to
check on their health and make sure they are in a safe condition. Because of this contact, BSA
outreach workers become aware of the transportation needs of its clients although the
organization does not provide transportation.
Transit Resources: BSA does not provide transportation but the social worker will help the
client to access transportation resources if needed. BSA has an occupational therapist that is
trained in analyzing a patient’s driving skills.
Transit Needs: Elderly people or those with medical issues need more flexible scheduling that
does not require 24-hour advance notice. This need stems from people who may not be able to
keep appointments because of their more fragile state of health. For example, on the day the
appointment is made, the client feels fine but, on the day of appointment, he/she may be feeling
unwell. Also, a client may need a medical appointment on short-notice (less than 24 hour) but
one that would not ordinarily require an EMS trip.
There are perception issues regarding transit services. Some clients feel like there is a stigma
attached to riding and there is a perception on the behalf of the BSA that feelings of pride
prevent clients from using the bus. There are restrictions on the number of trips that can be made
under one reservation and there is no service on Sunday (when many elderly people want to
attend church). Also, there is a need for more flexible (extensive) service and service on
Sundays. BSA clients and some elderly people need a higher level of transit service than that
which is provided by Spec Trans, such as help getting into their homes and with packages.

Chapter 2: Planning Partners
Panhandle Transportation Coordination Study 2- 20
Coordination Issues: The BSA is a member of the Senior Ambassador Program. A
subcommittee of this group, the Senior Citizen Ambassador Transportation Task Force focuses
on transportation issues for seniors. This group has recently formed a non-profit corporation in
order to address the transit needs it sees and may base its program on the Independent
Transportation Network model (T Uhttp://www.itnamerica.org/ U T). One challenge identified thus far
in setting up an ITN includes recruiting volunteers. Another is the cost of the program may
prohibit access to people on a fixed income.
Desired Outcome(s) from Coordination Study: More flexible service for seniors

Chapter 2: Planning Partners
Panhandle Transportation Coordination Study 2- 21
Craig Methodist Retirement Community
Program: The Craig Methodist Retirement Community (CMRC) provides long-term nursing
care and assisted living services for over 350 clients. It is organized on a model of progressive
care where there are different facilities available to help clients to transition between phases of
dependency. The facility includes cottages, apartments, licensed assisted-living and nursing-care
centers. Other facilities include a pharmacy and an Alzheimer’s care unit.
Transit Resources: CMRC provides transportation to its clients. It operates one 18-passenger
bus and one nine-passenger van, both with lifts. It employs 1.75 full-time equivalents to provide
transportation service; one full-time employee who drives the bus and one who assists with
scheduling and paperwork. Regular trips for grocery shopping are scheduled on Wednesday
morning and personal trips are scheduled for Wednesday afternoon. Medical trips take up the
capacity on Monday, Tuesday, and Thursday. CMRC has received funding support from
TxDOT to purchase one vehicle.
Transit Needs: Given its resources, CMRC is limited to providing 13 trips per day. The transit
coordinator estimates that it cannot meet about five trip requests each week. However, the
coordinator feels like residents of the facility would not want to take public transportation but
instead would like to receive more services that are restricted to members of the CMRC facility.
Coordination Issues: There is not much use of ACT services by CMRC clients. It wants to
continue to provide specialized services from within the CMRC community.
Desired Outcome(s) from Coordination Study: None at this time
Chapter 2: Planning Partners
Panhandle Transportation Coordination Study 2- 22
Department of Rehabilitative Services (DARS)
Program: DARS provides rehabilitative services to enable people to return to employment.
Eligibility for DARS assistance is determined by the presence of a disability. DARS serves about
2,000 clients annually. DARS does not directly provide transportation to clients but provides
support for the purchase of transportation as long as the trip is related to training or rehabilitation
for employment. DARS will also provide modifications to personal vehicles to assist with
mobility. The DARS Independent Living Services Program will help with adaptive equipment.
Transit Resources: DARS provides a commute subsidy up to $50 per week to help offset a
client’s transportation costs. The amount of the subsidy is determined by the distance traveled.
DARS purchases about $3,000 of transportation annually from Panhandle Transit, ACT fixed
route, and Spec-Trans. Occasionally, it will purchase taxicab services.
Transit Needs: It is estimated that about 95 percent of DARS’ clients have transportation. The
five percent of clients without transportation is estimated to be about 40 individuals. The largest
transit need is for fixed route, after-hours services.
Coordination Issues: DARS frequently coordinates with the Texas Workforce Commission on a
broad range of employment issues but has not focused explicitly on transportation.
Desired Outcome(s) from Coordination Study: Extended fixed route hours

Chapter 2: Planning Partners
Panhandle Transportation Coordination Study 2- 23
Health and Human Services Commission
Program: This description reflects the insights of the Medicaid and Temporary Aid to Needy
Families (TANF) eligibility oversight manager. This office oversees the Amarillo and Canyon
offices and the hospital-based staff in Amarillo. In 2005, it served over 15,000 unduplicated
clients.
Transit Resources: The HHSC arranges for transportation as part of the support it provides to
its clients but it does not fund any transportation. It directs clients to United Way’s 2-1-1 referral
service if a client needs transportation.
Transit Needs:
The HHSC does not tabulate the number of clients it refers to transit but estimates that services
for the low-income are in great need. In the HHSC office, welfare-to work support services is
one of the biggest needs in the Panhandle region. For example, in April 2006, there were 8,334
active cases. For low-income workers or those trying to move from welfare to work,
transportation between the work site, child care facilities and home is very difficult.
The limitations of the ACT fixed route and its schedule is a limitation to some clients and there is
also a gap in service between the cities of Canyon and Amarillo (i.e. inside of city of limits of
Amarillo but outside of the ACT service area. However, because it is in the city limits, the area
cannot be served by the rural transit provider, Panhandle Transit.)
Coordination Issues: The HHSC believes that there could be a useful partnership between the
HHSC and the Texas Workforce to fill the child-care transportation gap. In particular, there is an
interest in exploring the use of Work Source funding to transport children to day-care.
Desired Outcome(s) from Coordination Study: HHSC would like to see a greater recognition
among all the stakeholders of the need for more and improved transportation. HHSC would like
to see greater transportation resources available for child care for low-income families.

Chapter 2: Planning Partners
Panhandle Transportation Coordination Study 2- 24
Hereford Senior Citizens Center
Program: The Hereford Senior Citizens Center (HSCC) provides recreation, support and
congregate meals to people 55 years old and above who live in the Hereford area. The program is
operated by a paid staff of 12 and a regular volunteer staff between 20 and 25 who assist in the
home-delivered meals program.
Transit Resources: The HSCC has four vehicles. Three vans are used to deliver meals and one
van is used for client transportation. The delivery vans are used from 10 am to 12 pm. The client
van is used from 8 am to 4 pm and will take clients to medical, shopping, or other personal
appointments locally. Approximately 1.5 full-time equivalents are dedicated to providing
transportation. Currently, about $350 per month is budgeted for transportation (this includes
meal delivery transportation costs).
Transit Needs: In the past, HSCC provided trips into Amarillo but this service has been
discontinued because it was too costly. The HSCC would resume this service if it had the
operating funds and capital to purchase an additional vehicle.
The HSCC feels like Panhandle Transit has limited usefulness for its clients because of the need
for a higher level of service. At the HSCC, the driver will also serve as a personnel attendant if
needed. The HSCC will also provide last-minute trips and/or use private vehicle if needed.
Meeting trip needs after 4:00 p.m. is difficult.
Coordination Issues: The HSCC is working with the Retired Senior Volunteer Program (RSVP)
to recruit volunteers for all of its programs. The HSCC may be interested in working with
Panhandle Transit to resume HSCC’s service to Amarillo if its vehicles are needed.
Desired Outcome(s) from Coordination Study: Higher level of service and more
responsiveness for trips for seniors
Chapter 2: Planning Partners
Panhandle Transportation Coordination Study 2- 25
Jan Werner Adult Day Care / Transportation
Program: Jan Werner Adult Day Care was formed in 1978. It is a nonprofit organization that
serves 143 daycare clients. It delivers service under the Department of Aging and Disability’s
PACE Program (Program for All-Inclusive Care for the Elderly). It has 135 PACE clients. Jan
Werner provides door-through-door transportation to its clients. Certified Nurses Assistants
(CNA) act as drivers and provide a very high level of assistance to riders. It provides trips for
the Area Agency on Aging. Service is provided from 8:00 am until 5:00 pm, Monday through
Friday.
Transit Resources: Jan Werner Transportation operates 25 vehicles; nine of these vehicles
were purchased by Jan Werner and the remaining vehicles are TxDOT vehicles. All of the most-
recent vehicle purchases were made by Jan Werner. TxDOT last awarded a vehicle to Jan
Werner in 2000. Since then, Jan Werner has purchased eight vehicles with its own resources.
There are five additional vehicles on inventory but they are not in use. It maintains its own
vehicles at an on-site shop and operates a fueling station. There are three drivers and 13 CNA’s
that serve as Adult Day Care part-time drivers.
Last year, Jan Werner delivered about 65,000 trips and had operating costs of $374,481 (or
$5.76/trip). However, these operating costs do not allocate the hours CNAs spend driving as
transportation expenses. Consequently, the cost per trip is under-reported.
Transit Needs: There is a need for more vehicles. (Currently, Jan Werner sells old vehicles to
agencies like the Catholic Family Services.)
Coordination Issues: Jan Werner is able to be as efficient as it is because it can utilize its CNAs
as drivers. If Jan Werner were to provide service under a coordinated system, it would want to
maintain this operating model. Numerous and cumbersome regulations are also a coordination
issue. If Jan Werner had to comply with all the regulations and rules, it would be very difficult
to provide the same high-level of service that they currently provide. For example, Jan Werner
Chapter 2: Planning Partners
Panhandle Transportation Coordination Study 2- 26
wants to continue to provide door-through-door service. If it were to provide service to the city,
it would no longer be able to provide door-through-door service because of a prohibition against
losing sight of the vehicle.
Desired Outcome(s) from Coordination Study: Jan Werner would like to see a program like
the Panhandle Transportation Consortium 5310 program resumed. This program was
streamlined, open to all agencies, and very popular.
Chapter 2: Planning Partners
Panhandle Transportation Coordination Study 2- 27
Kings Manor
Program: Kings Manor is nonprofit nursing facility located in Hereford, Texas. An affiliated
program to Kings Manor is the Good Samaritan that provides hospice care.
Transit Resources: Kings Manor owns a 1997 van and a 2005 van with a lift that was donated.
The Good Samaritan operates three sedans. It employs four part-time van drivers who together
work two full-time equivalents. Many of the drivers are nursing assistances and provide an
additional level of assistance. Most the trips are medical or shopping trips. It will take clients to
Amarillo or Lubbock, if needed for medical purposes. In the past, Kings Manor has received
funding support from TxDOT to purchase two vehicles.
Transit Needs: The Kings Manor transportation supervisor believes it has enough resources to
fill its needs. It believes that it needs to keep some level of transportation services available at
the center because it needs to respond to after-hours or short-notice trips.
Coordination Issues: The Kings Manor transportation supervisor expressed a concern that it
would be too difficult to coordinate trips with her clients and those of other agencies. Since
many of the clients are in fragile health and have a high need for assistance, there is a concern
about mixing them with other riders.
Desired Outcome(s) from Coordination Study: None at this time
Chapter 2: Planning Partners
Panhandle Transportation Coordination Study 2- 28
Mom Mobile
Program: Mom Mobile is a program under the Northwest Texas Healthcare System (NWTHS).
It provides free transportation medical appointments to low-income mothers and their children.
If transportation is a barrier to medical care, NWTHS believes that it is more cost-effective to
provide for the transportation now rather than pay for costly health problems later. Mom Mobile
will take the client to any medical, Women-Infants-Children, or Department of Health Services
facility within Amarillo or Canyon. It provides service Monday to Friday, 7:00 am to 2:00 pm.
Transit Resources: Mom Mobile manages a $42,000 operating budget. It owns and operates
one vehicle – a 1998 Ford 350 van that is not wheelchair accessible and has one driver. It is
submitting a grant for a new vehicle and hope to be able to expand service in the future. Mom
Mobile will purchase bus passes or taxi vouchers if it cannot meet the demand. Many of the
clients that are served by the Mom Mobile would be eligible for Medicaid transportation.
Transit Needs: The program functions well but needs more funds to expand. It is supported
entirely through private foundations and private funding from the hospital.
Coordination Issues: The program’s director does not perceive any significant coordination
between agencies is currently ongoing as he believes that most trips are Medicaid-eligible and/or
being served by Amarillo City Transit through Spec Trans. If a coordinated system were in
place that met his clients’ needs, he would like to be “out of the transportation business all
together.” However, at this time this is not feasible. If a coordinated system were in place, he
would be concerned that the program would be flexible enough to meet his clients’ needs. For
example, it would need to be able to respond to short-notice trips; many of his clients do not
have good organization skills. He would not like to see them without transportation because they
failed to schedule something in advance.
Desired Outcome(s) from Coordination Study: The program director would like to see more
education/information about what services are currently available.
Chapter 2: Planning Partners
Panhandle Transportation Coordination Study 2- 29
Panhandle Independent Living Center Program: The Panhandle Independent Living Center (PILC) provides training, advocacy, and
peer counseling to help individuals with disabilities lead independent lives. It is funded through
the Department of Rehabilitative Services, the Department of Education, and private
foundations. All clients that are served have some disability and 75 percent are elderly. Last
year, it served 175 unduplicated clients.
Transit Resources: PILC budgets approximately $8,000 for transportation (excluding salary).
These funds come from federal sources (50 percent), state (25 percent) and private grants (25
percent). It operates two vehicles that it uses to directly provide transportation to its center – a
1994 12-passenger van with a lift and 250,000 miles and a 1993 5-passenger van with a ramp
with 120,000 miles. PILC also obtains service from other providers. It operates a summer youth
program and Laidlaw Transportation has provided transit services to this program. Panhandle
Transit has donated transportation to the PILC for various events in the past. PILC purchases bus
tickets from ACT (last year: 100 fixed route and 430 Spec-Trans).
Transit Needs: PILC’s greatest need for transportation is before 6:00 am and after 5:00 pm.
About fifty percent of the trips PILC provides fall into this category. Trips to the airport are
another need because there is no accessible transportation to the airport.
Coordination Issues: Through United Way referrals, the PILC has provided transportation for
people in wheelchairs that need a trip that is critical but does not warrant an emergency call. It
does not advertise this service because it does not have the capacity to fill trip demand. PILC
would like to be more available to the public but its insurance limits it to short trips. Conversely,
it does not want to become a “taxi service” and would rather work together with existing
providers. For example, PILC would be interested working with a private provider such as a taxi
service to provide wheelchair accessible trips to the airport.
Chapter 2: Planning Partners
Panhandle Transportation Coordination Study 2- 30
The PILC works with the city’s transit system on a number of issues. The PILC works with ACT
to complete eligibility reviews for Spec-Trans service and it provides personal travel training to 3
or 4 people per month.
Other coordination efforts include an initiative in 2002. Here, PILC worked with Easter Seals to
provide transportation and mobility training to Easter Seals staff in a “Train the Trainer”
workshop. The purpose of the workshop was to move people from the Spec-Trans service to
fixed route. The program was considered a success by PILC and it had about 12 clients.
Desired Outcome(s) from Coordination Study: After-hours service or longer hours of service;
an accessible service to the airport
Chapter 2: Planning Partners
Panhandle Transportation Coordination Study 2- 31
Panhandle Regional Planning Commission – Workforce Development Centers
Program: Workforce Development Centers provide employment and training support to help
people find and retain employment.
Transit Resources: The Panhandle Workforce Development Center (PWDC) provides clients
with gas vouchers to subsidize transportation costs for job-related trips or payment authorizations
for public transportation. In 2005, the PWDC spent about $120,000 in gas sales and $12,000 in
bus vouchers and personal car repair.
Transit Needs : Access to job sites that are outside of the existing transit service areas or
operating hours are one of the biggest transit needs for those seeking employment. Service to
Amarillo College East Campus is needed since much of the training and resources used by
PWDC clients is located here, and currently, this campus is not included on the Amarillo City
Transit route. However, all other Amarillo College campuses are served by ACT. Lastly, many
low-income workers need access to day care that is convenient to transit. Currently, the Amarillo
College West Campus has a day-care center.
Coordination Issues: Gas vouchers have worked well in the past because they best respond to
the multiple trip needs for a client’s personal work plan. The public transit system was not
considered feasible because of the length of the trip, the difficulty in making multiple trips, lack
of access to some areas, etc. However, the gas vouchers are becoming an increasingly difficult
approach because of the rising cost of gas and the difficulty in preventing abuse. (That is, once a
client has received a voucher, it is very difficult to control how it is spent.)
Desired Outcome(s) from Coordination Study: Expanded hours of service in Amarillo; and
service to Amarillo College east campus 1
T P
1P T During later discussions, desired outcomes was expanded to include better public transit service. Gas vouchers are
difficult to control and can be easily be abused and spent for uses other than employment-related trips. A pilot
Chapter 2: Planning Partners
Panhandle Transportation Coordination Study 2- 32
Park Central – Baptist Community Services
Program: Park Central is one in a family of nursing and assisted living centers owned and
operated through the Baptist Community Services. Other facilities include The Continental,
Ware Living Center, Harrington Living Center, The Talmage, Plemons Court and The Arbors. It
is one of the largest assisted living and nursing facilities in the region.
Transit Resources: Park Central provides transportation for a fee from 8:00 to 5:00 p.m.,
Monday through Friday. It provides approximately 24,000 trips annually. It operates four
sedans, two vans with lifts, and one 30-passenger bus. Transportation staff includes three full-
time drivers, four part-time drivers, and five transportation aides. (Transportation aides assist the
rider to prepare for the trip 20 minutes prior to departure, transports the person to the vehicle,
and completes all paperwork.) Park Central will accept Medicaid/Medicare for residents who
have been long-term clients and are now facing a change in finances.
Transit Needs: Park Central needs a 30-passenger vehicle with room for four wheelchairs to
meet the needs of the increasing number of clients who are not ambulatory.
Coordination Issues: Park Central is meeting the needs of its clients very well. The
organization does not rely on federal or state funding for transportation and does not see at this
time how it can be involved in a coordinated system since it is dedicated to providing a high
level of service to its residents.
Desired Outcome(s) from Coordination Study: None identified at this time.
project in Hereford, Texas, is being developed by Panhandle Transit, Hereford Workforce Center and other stakeholders start a modest fixed route.
Chapter 2: Planning Partners
Panhandle Transportation Coordination Study 2- 33
History of Regional Coordination of Public Transportation
Past and Current Planning Activities
There are three bodies that address the range of human services transportation within Amarillo
and the Panhandle:
• Panhandle Transportation Consortium (PTC): This group formed in 1995 to maximize
the efficiency of funds available for transportation and to review requests for Section
5310 vehicles. Agencies that participated in the PTC included the Area Agency on Aging
of the Panhandle, Canyon Retirement Center, Texas Department of Transportation; City
of Amarillo/Amarillo City Transit; Jan Werner Adult Day Care; Jan Werner
Transportation; Amarillo MPO; Texas Department of Health and Human Services, and
some participation for Friona Estate and Edward Abraham nursing homes. Many of the
agencies that participated on the PTC are now serving on the Regional Transportation
Advisory Group that is overseeing this study.
• Senior Ambassadors Coalition: The Senior Ambassadors Coalition (SAC) is about nine
years old. Participating agencies include Baptist St Anthony Hospital, Area Agency on
Aging, Alzheimers Organization, Adult Protective Care, Texas A&M University School
of Nursing, Texas Tech Health Science Center, and nursing and assisted care facilities.
Transportation is a key concern for the group and it has formed the Transportation Task
Force to discuss strategies to increase the availability and quality of transportation
services for seniors.
• Advisory Commission for People with Disabilities (ACPD): The ACPD is a group of
Amarillo citizens with disabilities that discuss, evaluate and advise the City Commission
on matters and issues that affect persons with disabilities. ACT attends the ACPD
monthly meeting for transportation issues.
Chapter 2: Planning Partners
Panhandle Transportation Coordination Study 2- 34
Current and Past Implemented Projects
PTC Section 5310 Purchase of Service
Beginning in 2000, Amarillo was granted an exception from Section 5310’s requirement that the
funds be allocated to capital equipment or preventative maintenance. From 2000 to 2004, the
PTC oversaw the expenditure of $382,547 from Section 5310 funds for purchase of service.
The purchase of service was not considered an unqualified success by all the agencies that
contracted for service. The contract was awarded to Jan Werner Transportation, a subsidiary of
Jan Werner Adult Day Care. Jan Werner used its vehicles and adult day care staff to deliver the
service. Participating agencies paid a flat fee for the service for unlimited rides. However, the
service was very popular and agencies had trouble getting its clients on the vehicles; and vehicles
would be completely booked up at least two weeks in advance. There were also questions about
the efficiency of the service because hours were limited and at times the vehicles were
underutilized. (This happened because Jan Werner used its care attendants to also serve as
drivers and these staff members were busy with other duties at these times.) In the fall of 2004,
the purchase for service agreement discontinued. Prior to this date, the PTC used toll credits as
its local match. In 2004, it was not successful in acquiring toll credits and could not come up
with the local match.
Amarillo Kidney Dialysis Center Transportation Brokerage
At one time, the Amarillo Kidney Dialysis Center investigated the feasibility of establishing a
brokerage. Insurance costs, training needs to meet insurance specification, staffing issues (who
would drive, coordinate and dispatch) stalled the project.
Public Transportation Agency Ticket Sales
Both ACT and Panhandle Transit sell tickets and passes to agencies and organizations. Tickets
are priced at the public rate and do not require a written contract. See Table 2.12: ACT Ticket
Sales, Prior 12 Months and Table 2.13: Panhandle Transit Agencies Served.
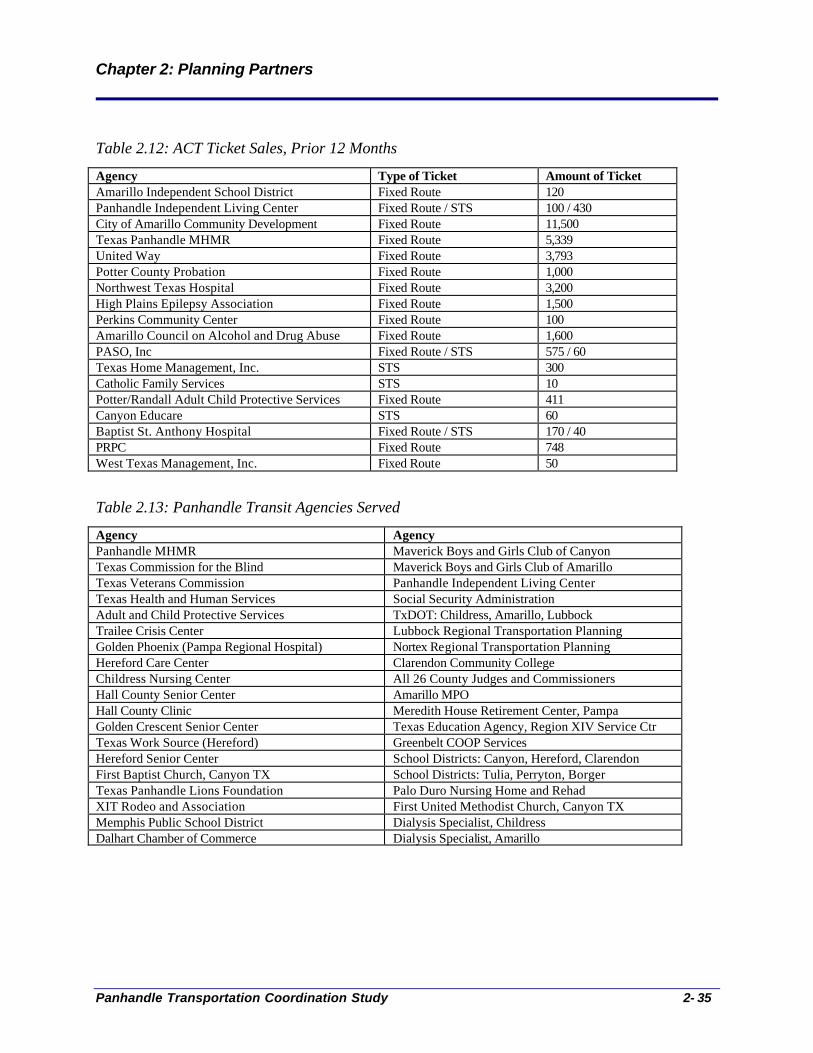
Chapter 2: Planning Partners
Panhandle Transportation Coordination Study 2- 35
Table 2.12: ACT Ticket Sales, Prior 12 Months
Agency Type of Ticket Amount of Ticket Amarillo Independent School District Fixed Route 120 Panhandle Independent Living Center Fixed Route / STS 100 / 430 City of Amarillo Community Development Fixed Route 11,500 Texas Panhandle MHMR Fixed Route 5,339 United Way Fixed Route 3,793 Potter County Probation Fixed Route 1,000 Northwest Texas Hospital Fixed Route 3,200 High Plains Epilepsy Association Fixed Route 1,500 Perkins Community Center Fixed Route 100 Amarillo Council on Alcohol and Drug Abuse Fixed Route 1,600 PASO, Inc Fixed Route / STS 575 / 60 Texas Home Management, Inc. STS 300 Catholic Family Services STS 10 Potter/Randall Adult Child Protective Services Fixed Route 411 Canyon Educare STS 60 Baptist St. Anthony Hospital Fixed Route / STS 170 / 40 PRPC Fixed Route 748 West Texas Management, Inc. Fixed Route 50
Table 2.13: Panhandle Transit Agencies Served
Agency Agency Panhandle MHMR Maverick Boys and Girls Club of Canyon Texas Commission for the Blind Maverick Boys and Girls Club of Amarillo Texas Veterans Commission Panhandle Independent Living Center Texas Health and Human Services Social Security Administration Adult and Child Protective Services TxDOT: Childress, Amarillo, Lubbock Trailee Crisis Center Lubbock Regional Transportation Planning Golden Phoenix (Pampa Regional Hospital) Nortex Regional Transportation Planning Hereford Care Center Clarendon Community College Childress Nursing Center All 26 County Judges and Commissioners Hall County Senior Center Amarillo MPO Hall County Clinic Meredith House Retirement Center, Pampa Golden Crescent Senior Center Texas Education Agency, Region XIV Service Ctr Texas Work Source (Hereford) Greenbelt COOP Services Hereford Senior Center School Districts: Canyon, Hereford, Clarendon First Baptist Church, Canyon TX School Districts: Tulia, Perryton, Borger Texas Panhandle Lions Foundation Palo Duro Nursing Home and Rehad XIT Rodeo and Association First United Methodist Church, Canyon TX Memphis Public School District Dialysis Specialist, Childress Dalhart Chamber of Commerce Dialysis Specialist, Amarillo
Chapter 3: Coordinated Service Planning Process
Panhandle Transportation Coordination Study 3-1
Chapter 3: Coordinated Service Planning Process
At the beginning of this coordination study, more than once the question “But, what is there to
coordinate?” was heard. Given that there are only two public transportation agencies for a region
that exceeds a fifth of this nation’s states, that these agencies provide transportation to many of
the region’s human service organizations, and that they do it on a lean budget, there is little
wonder as to what prompts the question. In a nutshell, coordination has always been the
approach in the Panhandle; and, like much that takes place in rural areas and small towns, much
of it is grassroots.
The approach to the Panhandle’s coordination planning has been fairly straightforward. There is
one committee overseeing the work of a hired consultant. The effort has not included a lot of
committees and sub-committees hashing out details, but instead a single lead group that is small
enough to be manageable, yet diverse enough to represent key constituencies. The Regional
Transportation Advisory Group (RTAG) is the name of the committee charged with overseeing
the completion of the plan. Given the region’s size, the structure and organization of the planning
approach emphasized the need to maximize the time committee members spent in meetings, as
travel is expensive and time-consuming.
Regional Transportation Advisory Group
In addition to loosely organized, grassroots coordination efforts, there is a history of a more
formalized approach that has its roots in the Panhandle Transportation Consortium. This is a
committee that got its start about ten years ago and is the basis for the RTAG. Beyond the
RTAG, there are no special committees or advisory groups. Organizations and businesses that
may be affected by changes stemming from this coordination plan provided information and
feedback, attended workshops and meetings, but did not take a formalized role in the RTAG.
The RTAG is a committee of 19 individuals charged with overseeing the completion of this
study. Its members include:

Chapter 3: Coordinated Service Planning Process
Panhandle Transportation Coordination Study 3-2
• Three representatives from Texas Department of Transportation: The Panhandle region
touches the Amarillo, Lubbock, and Childress TxDOT districts. Susan Stockett
represents the Amarillo District. Lynn Castle represents the Lubbock District and Kim
Butler represents the Childress District.
• Two representatives from the transit agencies: Judy Phelps, Director of Amarillo City
Transit represents her department for the City of Amarillo and Gerald Payton, Director of
Transportation for Panhandle Community Services, represents Panhandle Transit.
• Two representatives from other key transportation providers: Jim Chilcote is the
transportation director for Jan Werner Transportation and Carl McMillan represents the
Panhandle Independent Living Center.
• One representative from the Texas Workforce Commission: Johnny Smith represents the
Panhandle Workforce Development Board.
• One representative from the Health and Human Services Commission: Cindy Vandiver,
originally represented the HHSC. Ms. Vandiver was later replaced by Claudia Stanford
due to a change in jobs.
• Five representatives that are locally elected government officials: Positions were filled by
Judge Richard Peet from Gray County, Judge Vernon Cook from Roberts County, Judge
Kari Campbell from Moore County, Judge Jay Mayden from Childress County, and
Judge Harold Keeter from Swisher County.
• Two mobility-impaired individuals: Julie Curbo filled one of the positions and the second
position remained vacant.
• One local citizen: Elaine King Miller filled the position for citizens utilizing public
transportation in Amarillo.
• One representative from the Area Agency on Aging for the Panhandle: David Green,
executive director of AAA, was later replaced by Melissa Carter due to a job change.

Chapter 3: Coordinated Service Planning Process
Panhandle Transportation Coordination Study 3-3
• One representative from the Metropolitan Planning Organization: Phet
Xoumphonphakdy.
Work Plan The work plan for the study is outlined in the table below. Table 3.1: Panhandle Transportation Coordination Study Work Plan Goal Actions Research Current Conditions Timeframe: April to May 31
Create Transportation Coordination Survey Identify agencies and collect contact information Create and distribute hard-copy and web-based survey Place follow-up phone calls and site visits Send TTI survey to appropriate agencies
Perform Public Outreach Timeframe: June
Conduct 10 public meetings across the region
Identify Transit Gaps and Overlaps Timeframe: July - August
Analyze survey and public outreach results
Identify Strategies for Gaps & Overlaps Timeframe: September – October
Conduct workshops to identify likely strategies to address transit needs and approaches to addressing gaps and overlaps.
Create Action Plans Timeframe: October - November
Identify lead agencies, resources, and implementation schedules
Outreach Process Surveys
Information was gathered using a multi-pronged approach. First, stakeholders in the Panhandle
region were identified using the RTAG’s network of contacts and the United Way 2-1-1
Resource Directory. In all, 221 organizations were identified in the Panhandle region as either
likely to provide or need transportation services. Types of organizations contacted include transit
agencies, health and human service agencies, nonprofit organizations, senior citizen centers,
county and city officials, for-profit and non-profit assisted living and nursing care centers and
community organizations. See Appendix D: Panhandle Region Agency Contacts for the list of
organizations identified.

Chapter 3: Coordinated Service Planning Process
Panhandle Transportation Coordination Study 3-4
Initial stakeholder contact was made with an introductory letter from the RTAG accompanied by
a short survey that was developed by the consultant team and based upon researched conducted
by the Transportation Cooperation Research Project (TCRP) and the Texas Transportation
Institute (TTI). TTI is a political subdivision of the State of Texas that provides transportation,
technical planning and engineering support services to the Texas Department of Transportation.
The survey sought to establish the type of agency, service area, client type and size,
transportation needs (including number, type, and scheduled trips and unmet trips), current
method of meeting transportation needs, and general interest in coordination strategies. The
survey was made available in hard-copy and on-line in order to encourage a higher response rate.
The surveys, along with an introductory letter from the Regional Transportation Advisory Group,
were mailed and emailed on Wednesday, April 26, 2006. To solicit more responses, a reminder
postcard and email message was sent on Tuesday, May 16th to non-responsive agencies. Fifty-
four responses (a 24% response rate) had been collected when short survey was closed on May
31st. See Appendix E: Panhandle Transportation Survey Results.
For those organizations that directly provide transportation, respondents were asked to complete
a second survey by Texas Transportation Institute (TTI) designed to collect more detailed
information regarding transportation resources and specific coordination strategies.1 The
invitation to complete the TTI survey was sent to 35 agencies, of which 11 responded (33%
response rate).
Phone interviews were attempted with the each of the region’s 24 county judge’s offices and ten
city manager’s offices. Fourteen interviews were completed with county judges’ offices and five
interviews with city managers’ offices. The interviews served to inform and educate officials
about the regional planning process, solicit feedback about transportation needs, and address a
gap in response from the municipal and county officials to the Panhandle Transportation Needs
Survey. See Appendix F: County Official Survey.
1 TTI is a transportation research center organized under the Texas A&M University. TxDOT contracted with TTI to provide technical support to the statewide transportation coordination study effort.

Chapter 3: Coordinated Service Planning Process
Panhandle Transportation Coordination Study 3-5
Follow-up phone calls were made to 122 agencies to explain the study and encourage response to
the Panhandle Transportation Coordination Survey. The results of these attempts ranged from no
response (messages left and calls not returned or repeatedly told to call back later) to more
insightful (brief discussions of transportation issues faced by human and social service More in-
depth phone interviews were conducted with key agencies whose contact person was unavailable
for a face-to-face meeting. Lastly, twenty on-site visits were made. See Table 3.2: Agency
Contact List – Phone Interviews; and Table 3.3 Agency Contact List – On-Site Visit.
Table 3.2: Agency Contact List – Phone Interviews Agency Contact Department of Aging and Disability Desha Henderson, Program Administrator Northwest Texas Healthcare System Mark Miracle, Director of Mobile Mom Program American Red Cross, Panhandle Vicky Richmond, Executive Director Pampa Regional Medical Center Terry Barnes, Marketing Director Amarillo City College Adult Students Program Director Goodwill Industries Mary Smith and Rory Brown, Executive Director Experience Works Mary Parker, Director Coalition of Health Care Services Dorinda Bates, Director Don & Sybil Harrington Center Jim Wade, Director Table 3.3: Agency Contact List – On-Site Visit Agency Contact Jan Werner Adult Day Care Jim Chilcote, Director Transportation Panhandle Rural Transit Gerald Payton, Director Transportation Amarillo City Transit Judy Phelps, Director Amarillo Health & Humans Services Division
Cindy Vandiver,
Texas Workforce Commission Johnny Smith, Program Specialist Baptist Saint Anthony Hospital Laura Rehyer, Patient Relations Amarillo Area Agency on Aging David Green, Executive Director, American Cancer Society: Road to Recovery Terri Prescott, Program Director Amarillo High Plains Dialysis Center Rebecca Carr, Texas Panhandle Mental Health Mental Retardation ASC Industries
Eloise Hanes, Exe cutive Director
Department of Rehabilitative Services Jim Haile, Area Manager Baptist Community Services Tom Ewing, Transportation Supervisor Dumas Nursing & Rehabilitation Center Laurel English, Administrator Hereford Senior Citizen Center Jackie McNeese, Executive Director Kings Manor Stella Delgato, Director Transportation Craig Methodist Cindy Long, Director Environ Services Amarillo Senior Citizen Center Judi Solley, Executive Director Panhandle Community Service - Dalhart Billie Harruf, Center Coordinator Panhandle Community Services – Dumas Caroline Hawkins, Center Coordinator Panhandle Community Services – Hereford Celia Serrano, Center Coordinator
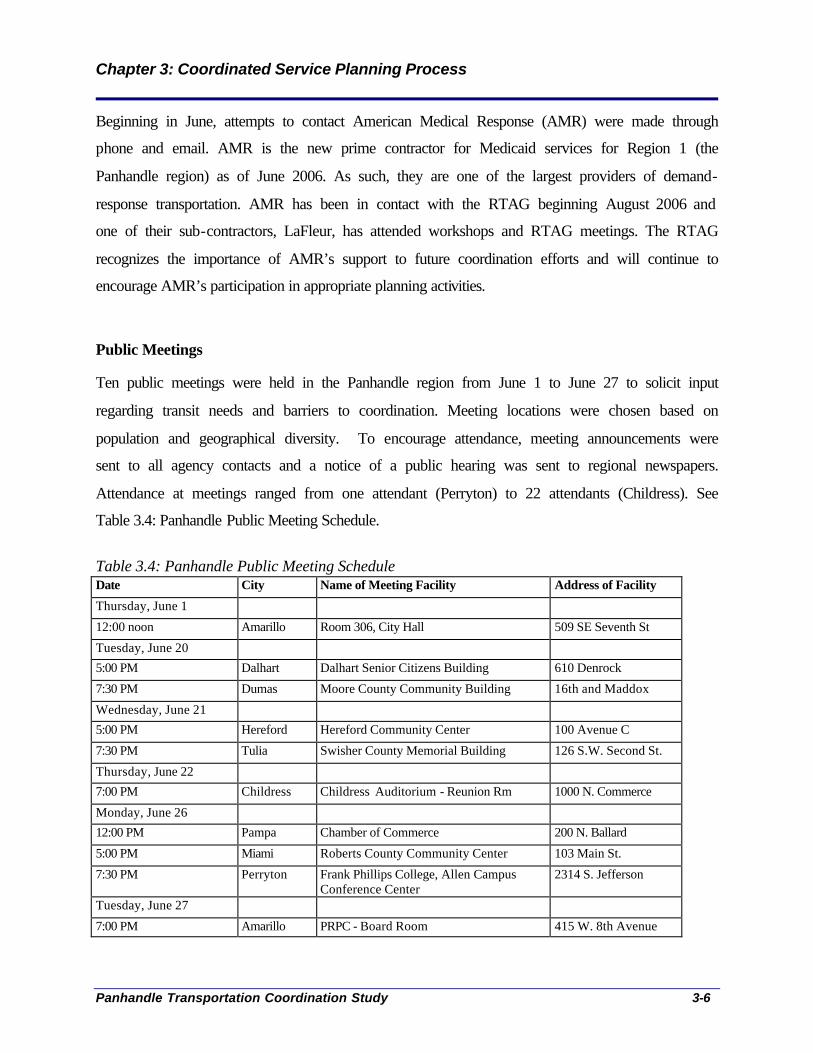
Chapter 3: Coordinated Service Planning Process
Panhandle Transportation Coordination Study 3-6
Beginning in June, attempts to contact American Medical Response (AMR) were made through
phone and email. AMR is the new prime contractor for Medicaid services for Region 1 (the
Panhandle region) as of June 2006. As such, they are one of the largest providers of demand-
response transportation. AMR has been in contact with the RTAG beginning August 2006 and
one of their sub-contractors, LaFleur, has attended workshops and RTAG meetings. The RTAG
recognizes the importance of AMR’s support to future coordination efforts and will continue to
encourage AMR’s participation in appropriate planning activities.
Public Meetings
Ten public meetings were held in the Panhandle region from June 1 to June 27 to solicit input
regarding transit needs and barriers to coordination. Meeting locations were chosen based on
population and geographical diversity. To encourage attendance, meeting announcements were
sent to all agency contacts and a notice of a public hearing was sent to regional newspapers.
Attendance at meetings ranged from one attendant (Perryton) to 22 attendants (Childress). See
Table 3.4: Panhandle Public Meeting Schedule.
Table 3.4: Panhandle Public Meeting Schedule Date City Name of Meeting Facility Address of Facility
Thursday, June 1
12:00 noon Amarillo Room 306, City Hall 509 SE Seventh St
Tuesday, June 20
5:00 PM Dalhart Dalhart Senior Citizens Building 610 Denrock
7:30 PM Dumas Moore County Community Building 16th and Maddox
Wednesday, June 21
5:00 PM Hereford Hereford Community Center 100 Avenue C
7:30 PM Tulia Swisher County Memorial Building 126 S.W. Second St.
Thursday, June 22
7:00 PM Childress Childress Auditorium - Reunion Rm 1000 N. Commerce
Monday, June 26
12:00 PM Pampa Chamber of Commerce 200 N. Ballard
5:00 PM Miami Roberts County Community Center 103 Main St.
7:30 PM Perryton Frank Phillips College, Allen Campus Conference Center
2314 S. Jefferson
Tuesday, June 27
7:00 PM Amarillo PRPC - Board Room 415 W. 8th Avenue
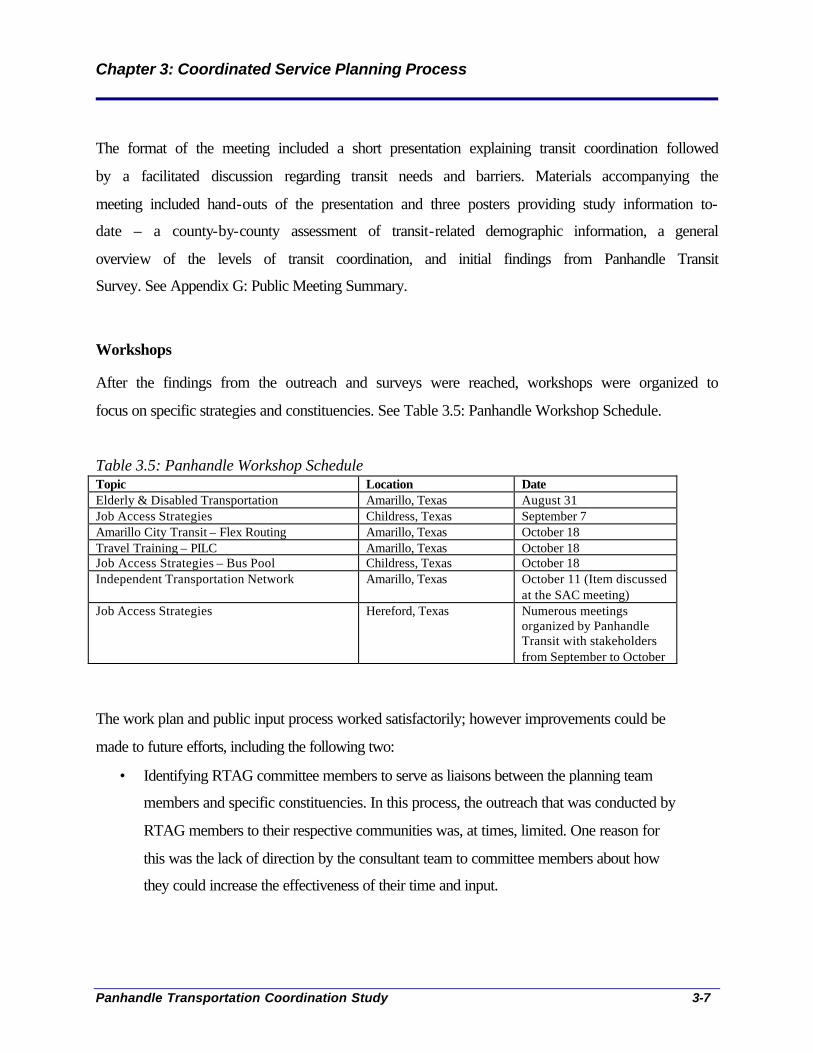
Chapter 3: Coordinated Service Planning Process
Panhandle Transportation Coordination Study 3-7
The format of the meeting included a short presentation explaining transit coordination followed
by a facilitated discussion regarding transit needs and barriers. Materials accompanying the
meeting included hand-outs of the presentation and three posters providing study information to-
date – a county-by-county assessment of transit-related demographic information, a general
overview of the levels of transit coordination, and initial findings from Panhandle Transit
Survey. See Appendix G: Public Meeting Summary.
Workshops
After the findings from the outreach and surveys were reached, workshops were organized to
focus on specific strategies and constituencies. See Table 3.5: Panhandle Workshop Schedule.
Table 3.5: Panhandle Workshop Schedule Topic Location Date Elderly & Disabled Transportation Amarillo, Texas August 31 Job Access Strategies Childress, Texas September 7 Amarillo City Transit – Flex Routing Amarillo, Texas October 18 Travel Training – PILC Amarillo, Texas October 18 Job Access Strategies – Bus Pool Childress, Texas October 18 Independent Transportation Network Amarillo, Texas October 11 (Item discussed
at the SAC meeting) Job Access Strategies Hereford, Texas Numerous meetings
organized by Panhandle Transit with stakeholders from September to October
The work plan and public input process worked satisfactorily; however improvements could be
made to future efforts, including the following two:
• Identifying RTAG committee members to serve as liaisons between the planning team
members and specific constituencies. In this process, the outreach that was conducted by
RTAG members to their respective communities was, at times, limited. One reason for
this was the lack of direction by the consultant team to committee members about how
they could increase the effectiveness of their time and input.

Chapter 3: Coordinated Service Planning Process
Panhandle Transportation Coordination Study 3-8
• Earlier attention to specific solutions for the region. Because this was an initial attempt to
create a cohesive coordinated plan for the whole region, about one-third of the time was
spent learning about providers and educating them about coordinated transportation. This
emphasis created a time-crunch when it came to getting down to the details of the
specific action plans/pilot projects. For future iterations, forming working groups early on
in the process to address specific strategies and constituencies earlier may create a greater
level of involvement and generate better crafted plans.

Chapter 4: Transit Gaps and Overlaps
Panhandle Transportation Coordination Study 4- 1
Chapter 4: Transit Gaps and Overlaps
All chapters prior to this were providing the context in which the regional coordinated plan was
formed. This chapter now begins to address the findings and recommendations from that
research. It begins with a review of the RTAG adopted goals and objectives.
Legislative Background
The legislative foundation upon which the RTAG’s coordinated plan is laid can be found in
House Bill 3588, Article 13: Statewide Coordination of Public Transportation, Section 461.003:
Public transportation services are provided in this state by many different entities, both
public and private. The multiplicity of public transportation providers and services,
coupled with a lack of coordination between state oversight agencies, has generated
inefficiencies, overlaps in service, and confusion for consumers. It is the intent of this
chapter:
1. To eliminate waste in the provision of public transportation services;
2. To generate efficiencies that will permit increased levels of service; and
3. To further the state's efforts to reduce air pollution.
This is further defined in Public Transportation Code, Section 461.004(a):
The plan shall consider and address separately:
1. Overlaps and gaps in the provision of public transportation services;
2. Underused equipment owned by public transportation providers; and
3. Inefficiencies in the provision of public transportation services.
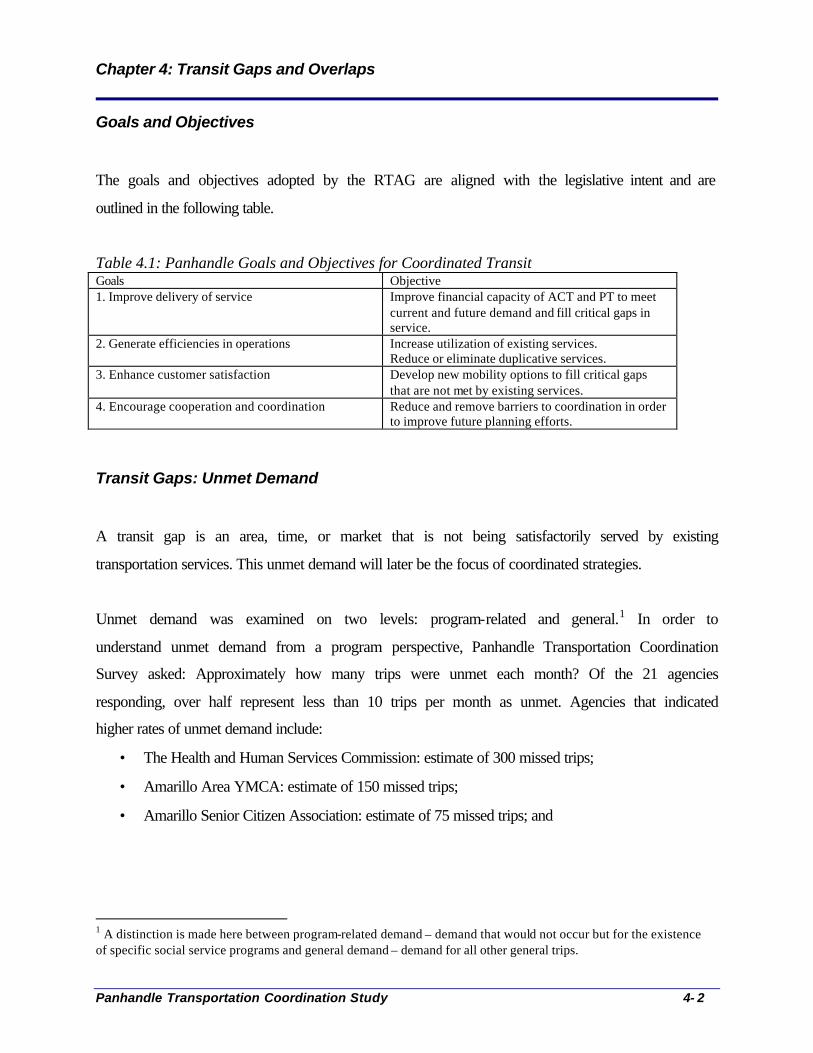
Chapter 4: Transit Gaps and Overlaps
Panhandle Transportation Coordination Study 4- 2
Goals and Objectives
The goals and objectives adopted by the RTAG are aligned with the legislative intent and are
outlined in the following table.
Table 4.1: Panhandle Goals and Objectives for Coordinated Transit Goals Objective 1. Improve delivery of service Improve financial capacity of ACT and PT to meet
current and future demand and fill critical gaps in service.
2. Generate efficiencies in operations Increase utilization of existing services. Reduce or eliminate duplicative services.
3. Enhance customer satisfaction Develop new mobility options to fill critical gaps that are not met by existing services.
4. Encourage cooperation and coordination Reduce and remove barriers to coordination in order to improve future planning efforts.
Transit Gaps: Unmet Demand
A transit gap is an area, time, or market that is not being satisfactorily served by existing
transportation services. This unmet demand will later be the focus of coordinated strategies.
Unmet demand was examined on two levels: program-related and general.1 In order to
understand unmet demand from a program perspective, Panhandle Transportation Coordination
Survey asked: Approximately how many trips were unmet each month? Of the 21 agencies
responding, over half represent less than 10 trips per month as unmet. Agencies that indicated
higher rates of unmet demand include:
• The Health and Human Services Commission: estimate of 300 missed trips;
• Amarillo Area YMCA: estimate of 150 missed trips;
• Amarillo Senior Citizen Association: estimate of 75 missed trips; and
1 A distinction is made here between program-related demand – demand that would not occur but for the existence of specific social service programs and general demand – demand for all other general trips.
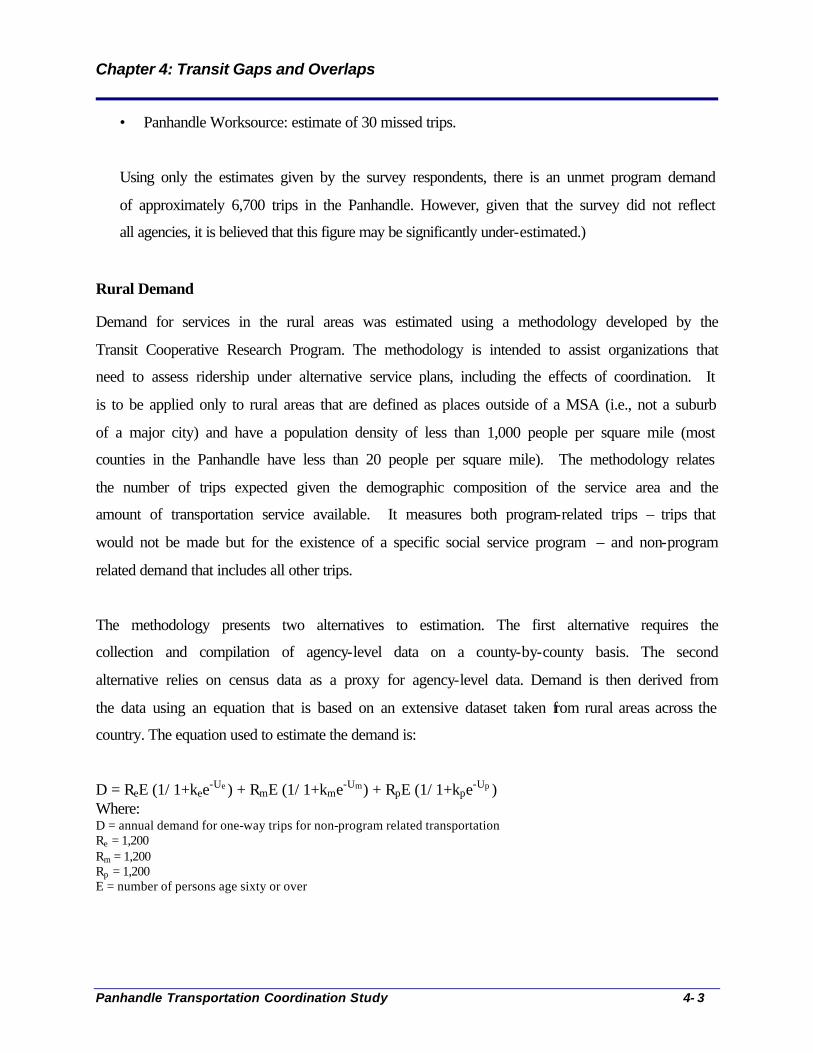
Chapter 4: Transit Gaps and Overlaps
Panhandle Transportation Coordination Study 4- 3
• Panhandle Worksource: estimate of 30 missed trips.
Using only the estimates given by the survey respondents, there is an unmet program demand
of approximately 6,700 trips in the Panhandle. However, given that the survey did not reflect
all agencies, it is believed that this figure may be significantly under-estimated.)
Rural Demand
Demand for services in the rural areas was estimated using a methodology developed by the
Transit Cooperative Research Program. The methodology is intended to assist organizations that
need to assess ridership under alternative service plans, including the effects of coordination. It
is to be applied only to rural areas that are defined as places outside of a MSA (i.e., not a suburb
of a major city) and have a population density of less than 1,000 people per square mile (most
counties in the Panhandle have less than 20 people per square mile). The methodology relates
the number of trips expected given the demographic composition of the service area and the
amount of transportation service available. It measures both program-related trips – trips that
would not be made but for the existence of a specific social service program – and non-program
related demand that includes all other trips.
The methodology presents two alternatives to estimation. The first alternative requires the
collection and compilation of agency-level data on a county-by-county basis. The second
alternative relies on census data as a proxy for agency-level data. Demand is then derived from
the data using an equation that is based on an extensive dataset taken from rural areas across the
country. The equation used to estimate the demand is:
D = ReE (1/ 1+kee-Ue ) + RmE (1/ 1+kme-Um ) + RpE (1/ 1+kpe-Up ) Where: D = annual demand for one-way trips for non-program related transportation Re = 1,200 Rm = 1,200 Rp = 1,200 E = number of persons age sixty or over

Chapter 4: Transit Gaps and Overlaps
Panhandle Transportation Coordination Study 4- 4
Definitions, continued M = number of mobility limited persons age 16 to 64 P = number of persons, age 64 or less, in families with incomes below the poverty level ke = e6.38 km = e6.41 kp = e6.63 Ue = 0.000510 * (Annual Vehicle Miles Available to Elderly Market / Area of County) Um = 0.000400 * (Annual Vehicle Miles Available to Mobility Limited / Area of County) Ue = 0.000490 * (Annual Vehicle Miles Available to Low Income / Area of County)2 e = natural logarithm with a value of approximately 2.71828.
In applying this equation to the Panhandle region, “M” was defined as individuals who indicated
a “go outside” disability in the U.S. Census. This disability is defined as one that prevents a
person from attending to daily activities outside the home by him/her. Annual Vehicle Miles was
defined as the miles of service that Panhandle Transit provided to each county during the FY04 –
FY05 operating year and is the same figure for the elderly, mobility limited and low-income
markets.
Using this methodology, it is estimated that there is demand for approximately 607,000 trips
annually in the rural counties (excluding Potter and Randall counties). During FY04–FY05,
Panhandle Transit provided 130,074 trips. This represents service to about 21 percent of the
potential market for transit. In other words, there are about 477,000 trips annually for which
there is potential demand. See Appendix H: Panhandle Transit Demand Estimate.
Urban Demand Unlike rural systems, urban systems report their activities to the National Transit Database
Project. This FTA research agency collects and reports on transit systems across the U.S. and can
be used by operators and researchers to estimate the effectiveness and efficiency of peer systems.
So unlike the equation-based methodology that was used to measure the latent in the Panhandle’s
rural counties, the estimate for demand for services in Amarillo is based on a peer comparison.
Amarillo City Transit’s performance was compared against six peers systems – Abilene (City
Link), Hill Country Transit (The HOP), Port Arthur (PAT), and Waco (WTS), San Angelo
2 TCRP Report 3: Workbook for Estimating Demand for Rural Passenger Transportation. SG Associates Inc., Leigh, Scott & Cleary Inc., and C.M. Research, Inc. National Academy Press. Washington D.C. 1995.
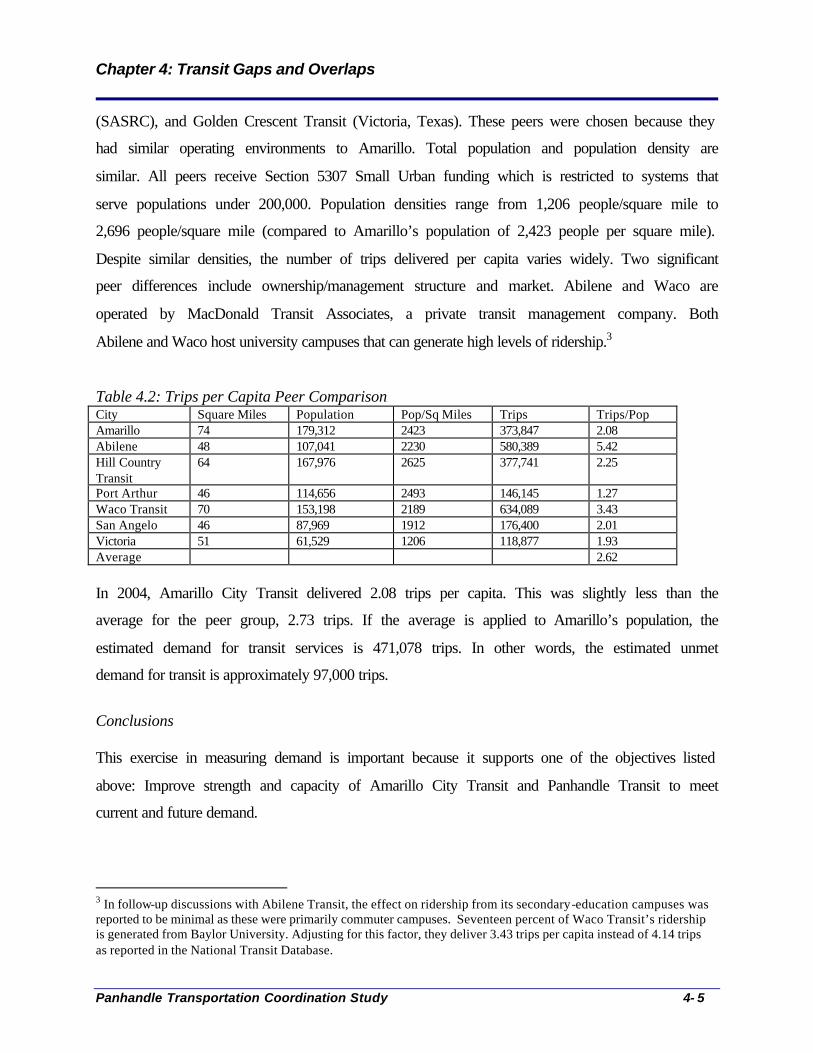
Chapter 4: Transit Gaps and Overlaps
Panhandle Transportation Coordination Study 4- 5
(SASRC), and Golden Crescent Transit (Victoria, Texas). These peers were chosen because they
had similar operating environments to Amarillo. Total population and population density are
similar. All peers receive Section 5307 Small Urban funding which is restricted to systems that
serve populations under 200,000. Population densities range from 1,206 people/square mile to
2,696 people/square mile (compared to Amarillo’s population of 2,423 people per square mile).
Despite similar densities, the number of trips delivered per capita varies widely. Two significant
peer differences include ownership/management structure and market. Abilene and Waco are
operated by MacDonald Transit Associates, a private transit management company. Both
Abilene and Waco host university campuses that can generate high levels of ridership.3
Table 4.2: Trips per Capita Peer Comparison City Square Miles Population Pop/Sq Miles Trips Trips/Pop Amarillo 74 179,312 2423 373,847 2.08 Abilene 48 107,041 2230 580,389 5.42 Hill Country Transit
64 167,976 2625 377,741 2.25
Port Arthur 46 114,656 2493 146,145 1.27 Waco Transit 70 153,198 2189 634,089 3.43 San Angelo 46 87,969 1912 176,400 2.01 Victoria 51 61,529 1206 118,877 1.93 Average 2.62 In 2004, Amarillo City Transit delivered 2.08 trips per capita. This was slightly less than the
average for the peer group, 2.73 trips. If the average is applied to Amarillo’s population, the
estimated demand for transit services is 471,078 trips. In other words, the estimated unmet
demand for transit is approximately 97,000 trips.
Conclusions This exercise in measuring demand is important because it supports one of the objectives listed
above: Improve strength and capacity of Amarillo City Transit and Panhandle Transit to meet
current and future demand.
3 In follow-up discussions with Abilene Transit, the effect on ridership from its secondary-education campuses was reported to be minimal as these were primarily commuter campuses. Seventeen percent of Waco Transit’s ridership is generated from Baylor University. Adjusting for this factor, they deliver 3.43 trips per capita instead of 4.14 trips as reported in the National Transit Database.
Chapter 4: Transit Gaps and Overlaps
Panhandle Transportation Coordination Study 4- 6
Currently, local offices of Panhandle Transit feel that they are meeting the demands of their
service area. However, it may be that there is considerable latent demand that Panhandle Transit
is unaware of. This could be due to potential riders being unaware that there is a transit service
available to them, that they no longer contact Panhandle Transit because Panhandle Transit
cannot meet their transit needs, or that they are receiving service from some other provider.
Conversely, ACT is aware of the need for more service within the City of Amarillo. In this
context, the definition of “more” includes: extended service area, extended hours, and short
headways. However, ACT is limited in its ability to meet these needs due to funding constraints.
As discussed in Chapter 5: Strategies to Address Gaps and Needs, ACT is facing a significant
decrease in funding, thus limiting its ability to fill unmet demand. Part of this plan will assist
ACT as it investigates strategies to meet this challenge.
Transit Gaps: Areas with No Service
There are no rural areas throughout the 26-counties without access to some transit services
through Panhandle Transit. It provides in-county service Monday through Friday, from 8:00 am
to 5:00 pm in the following 17 counties: Childress, Dallam, Deaf Smith, Donley, Gray, Hall,
Hartley, Hemphill, Hutchinson, Lipscomb, Moore, Ochiltree, Oldham, Parmer, Potter, Randall,
and Swisher counties.
Counties that do not have regular Monday through Friday service include: Armstrong, Brisco,
Carson, Castro, Collingsworth, Hansford, Roberts, and Wheeler. However service from these
counties to Amarillo or adjacent counties is available either Monday, Wednesday, Friday or
Tuesday, Thursday. See Figure 4.1: Panhandle Transit Days of Service by County.

Chapter 4: Transit Gaps and Overlaps
Panhandle Transportation Coordination Study 4- 7
Figure 4.1: Panhandle Transit Days of Service by County
In Amarillo, there is a gap in service for those areas that lie within the city limits (and thus,
cannot be served by Panhandle Transit), yet outside of Amarillo City Transit’s service area.
Some destinations that are outside the service area yet of interest to riders are the Amarillo
International Airport and the East Campus of the Amarillo City College. See Figure 4.2:
Amarillo City Transit Routes and Amarillo City Limits.
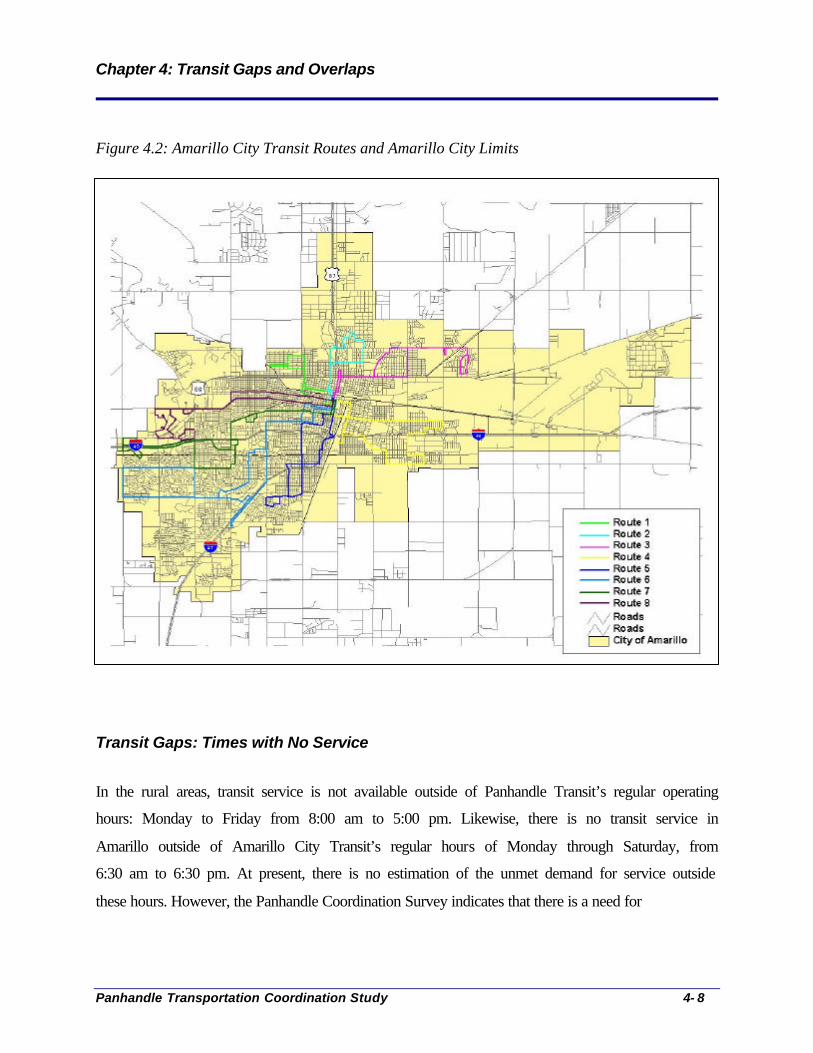
Chapter 4: Transit Gaps and Overlaps
Panhandle Transportation Coordination Study 4- 8
Figure 4.2: Amarillo City Transit Routes and Amarillo City Limits
Transit Gaps: Times with No Service
In the rural areas, transit service is not available outside of Panhandle Transit’s regular operating
hours: Monday to Friday from 8:00 am to 5:00 pm. Likewise, there is no transit service in
Amarillo outside of Amarillo City Transit’s regular hours of Monday through Saturday, from
6:30 am to 6:30 pm. At present, there is no estimation of the unmet demand for service outside
these hours. However, the Panhandle Coordination Survey indicates that there is a need for
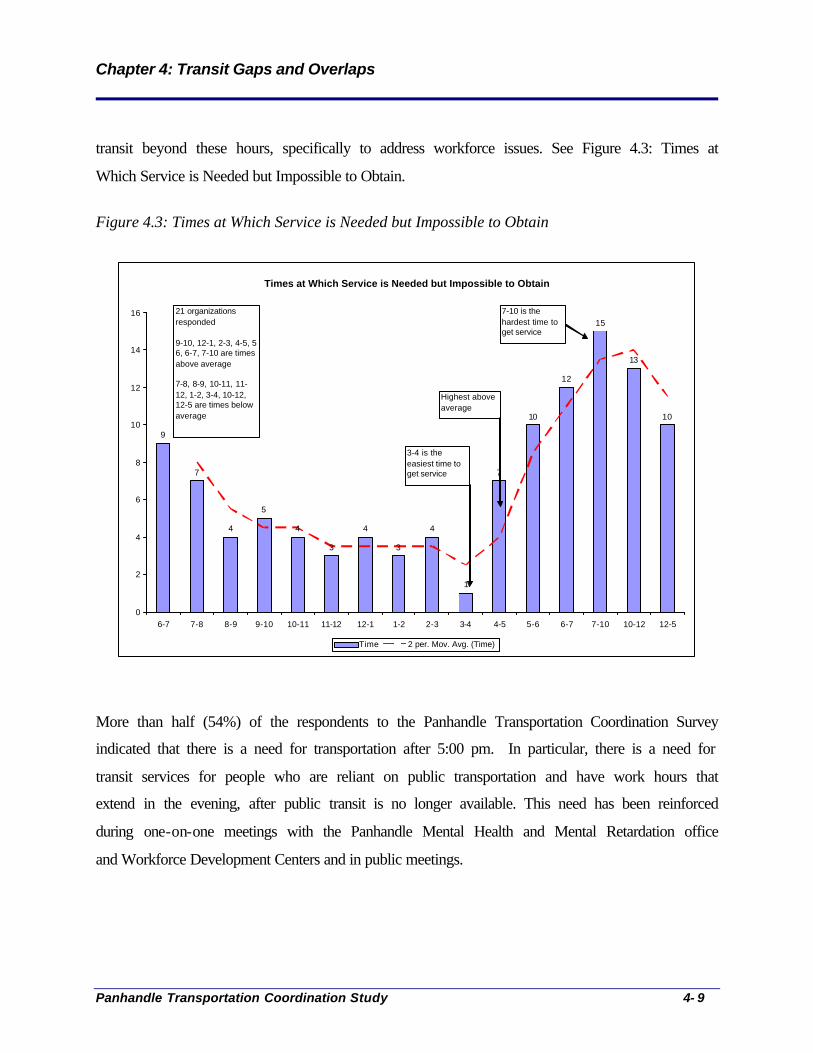
Chapter 4: Transit Gaps and Overlaps
Panhandle Transportation Coordination Study 4- 9
transit beyond these hours, specifically to address workforce issues. See Figure 4.3: Times at
Which Service is Needed but Impossible to Obtain.
Figure 4.3: Times at Which Service is Needed but Impossible to Obtain
More than half (54%) of the respondents to the Panhandle Transportation Coordination Survey
indicated that there is a need for transportation after 5:00 pm. In particular, there is a need for
transit services for people who are reliant on public transportation and have work hours that
extend in the evening, after public transit is no longer available. This need has been reinforced
during one-on-one meetings with the Panhandle Mental Health and Mental Retardation office
and Workforce Development Centers and in public meetings.
Times at Which Service is Needed but Impossible to Obtain
9
7
4
5
4
3
4
3
4
1
7
10
12
15
13
10
0
2
4
6
8
10
12
14
16
6-7 7-8 8-9 9-10 10-11 11-12 12-1 1-2 2-3 3-4 4-5 5-6 6-7 7-10 10-12 12-5
Time 2 per. Mov. Avg. (Time)
3-4 is the easiest time to get service
7-10 is the hardest time to get service
21 organizations responded
9-10, 12-1, 2-3, 4-5, 5-6, 6-7, 7-10 are times above average
7-8, 8-9, 10-11, 11-12, 1-2, 3-4, 10-12, 12-5 are times below average
Highest above average
Chapter 4: Transit Gaps and Overlaps
Panhandle Transportation Coordination Study 4- 10
Transit Gaps – Under Served Urban and Rural Markets
In addition to the need to extend transit into under served areas and beyond the existing schedule,
there are specific gaps that are related to markets that are heavy transit users: the elderly, people
with disabilities, and people with low-incomes. The following gaps in service may address only
one, but in many cases, all these markets are addressed.
Limited ability to fill short-term trip needs: Agencies that serve disabled and senior citizens
cited difficulty in addressing trip needs with less than a 24-hour advance notice concern. One
result of this is unmet demand is trips are being pushed to emergency transportation services at a
much higher cost.
Limited ability to fill trip needs that require a higher level of service: Agencies that serve
disabled or senior citizens may be reluctant to rely on existing transit services because the level
of assistance that may be offered is inadequate for their client’s needs or there is the perception
that the level of service is inadequate.
Limited ability to serve job training and employment trips: Job opportunities for shift-work
employment are located off the fixed route in Amarillo. For example, employment centers with
shift-work and a large number of workers, such as the Tyson meat packing plant, the Pantex
Nuclear Plant, and electric generation plants, are located on the outskirts of town. Other
employment-related transit gaps include a need for transit services after 6:30 pm; difficulty in
accessing child care when the parent is transit-dependent; and transportation to Amarillo City
College East Campus for job training.
Limited capacity on public transportation to provide wheel-chair accessible transportation
to the Amarillo International Airport: There is no wheel-chair accessible taxi in Amarillo.

Chapter 4: Transit Gaps and Overlaps
Panhandle Transportation Coordination Study 4- 11
Limited ability to serve trips for youth programs in Amarillo: The YMCA, Maverick’s Boys
and Girls Club, and Region 16 Head Start/Early Head Start Program each cited a need for more
transit support for special programs.
Transit Overlap
Vehicles
Little to no transit vehicle overlap was identified outside of Amarillo. In the rural regions, there
is no public transportation provider besides Panhandle Transit, including taxis. Excluding Potter
County, Panhandle Transit operates 40 vehicles to serve the remaining 25 counties and only 19
additional vehicles were identified through the Panhandle Transportation Inventory as being
operated by other agencies.
There is a higher concentration of resources within the City of Amarillo. This is expected as the
city is the headquarters for many agencies and has the highest population. Fifteen of the
organizations which responded to the survey or a phone call provided some level of social
services transportation. Table 4.3 below outlines the number of vehicles by organization for
Amarillo.
Table 4.3: Demand Response-type Vehicles in Amarillo Organization Number of Vehicles based in Amarillo Amarillo City Transit (ACT) 23 Panhandle Transit (PT) 19 (Note: Estimate of vehicles making scheduled
MWF trips; trips T,Th as needed for Medicaid.) Jan Werner Transportation 29 ASC Industries 15 LeFleur Transportation (Medicaid Subcontractor) 7 (five active/wheelchair , with two spare) TaxiPro (Medicaid Subcontractor) 5 (no vehicles are wheelchair accessible) Baptis t Community / Park Central 7 Maverick Boys and Girls Club 4 Panhandle Independent Living 2 Wesley Senior Program 2 Opportunity School 1 Palo Duro Nursing, Seville Estates, Kirklands Court, Martha’s Home
1 each
Chapter 4: Transit Gaps and Overlaps
Panhandle Transportation Coordination Study 4- 12
Other
Other sources of duplicated transportation resources include maintenance facilities, driver
training, and reservation/scheduling/dispatch software. Where duplication exists, there may exist
a potential to share resources; however in order to do so will require additional resources in-and-
of themselves in order to upgrade, expand, and/or hire additional personnel.
• Maintenance: Several agencies manage maintenance centers to service their vehicles.
However, each system currently lacks the capacity to expand maintenance operations to
include other agency’s vehicles. For example, ACT is constrained by the lack of space
and the number of qualified mechanics that can be hired given its payscale.4 The Texas
Panhandle MHMR operates a maintenance center that is sufficient to handle their vehicle
load as does Jan Werner Transportation; however, in each case, there is no excess
capacity.
• Software: ACT uses Trapeze and Jan Werner Transportation and Panhandle Transit use
Shaw software. Migration to a common software platform may facilitate future ride-
sharing. Of the two packages, the Trapeze software is more powerful. However, at this
time, ACT’s license is at its maximum and any establishment of a common platform
would require additional resources.5
• Driver Training: Each program maintains its own driver training program that is tailored
to their specific market. For example, Jan Werner Transportation drivers also serve as
personal care attendants and their training reflects a higher level of service from that of
ACT or Panhandle Transit.
• Travel Training: Texas Panhandle MHMR, Goodwill, and the Panhandle Independent
Living Center, and ACT are just a few of the agencies that provide travel training to their
clients.
4 The ACT starts their mechanics at $9.50 per hour or $19,760 annually. The estimated starting salary for auto mechanics is $16.90 or about $33,700. 5 Annual license fee for Trapeze is $32,000.

Chapter 5: Potential Strategies to Address Transit Gaps and Overlaps
Panhandle Transportation Coordination Study 5-1
Chapter 5: Potential Strategies to Address Transit Gaps and Overlaps
Review of JARC and NF Funding
The Safe, Accountable, Flexible, and Efficient Transportation Equity Act – a Legacy for Users
(SAFETEA-LU) re-authorized federal transportation funding programs through 2009. Two
programs from that legislation are Job Access and Reverse Commute (JARC) and New Freedom
(NF). Table 5.1 outlines the program allocations for Texas by recipient type for FY2006.1
Allocations for FY2007 are not yet available but it is anticipated that they will be largely
equivalent to FY2006 allocations.
Table 5.1: FY2006 JARC and NF Allocation by Recipient Type2
Federal Funding Program & Eligible Recipient Type Estimated Amount to be Allocated to Texas FY06 JARC Small Urban $3,065,349 FY06 NF Small Urban $1,396,426 FY06 JARC Rural $2,180,328 FY06 NF Rural $1,070,248
Total $7,712,351
It is anticipated that there will be a call for JARC and NF projects in early 2007 and that the
funding available will include both FY2006 and FY2007 allocations (approximately
$15.4 million). Funding for projects will be competitive across the state; projects proposed by
small urban recipients will be evaluated against their peers as will rural recipients’ projects. One
objective of the Panhandle Transportation Coordination Study is to select multiple, sustainable
projects that reflect the transportation needs of the community; incorporate a coordinated
approach to better utilize the region’s resources; and can be reasonably implemented. A brief
description of projects that are eligible under each funding category follows.
Job Access and Reverse Commute (JARC): The purpose of the JARC program is to provide
funding for local programs that offer job access and reverse commute transportation services to
low-income individuals. Eligible projects include, but are not limited to, the following:
1 Amounts are apportioned to State Governors for small urban areas with populations between 50,000 and 199,999 and for rural areas with populations less than 50,000. 2 Amounts reported in Federal Register, Friday, February 3, 2006
Chapter 5: Potential Strategies to Address Transit Gaps and Overlaps
Panhandle Transportation Coordination Study 5-2
• Demand-response van service;
• Ridesharing and carpooling activities;
• Expanding fixed-route transit service areas;
• Late-night and weekend service
• Guaranteed ride-home service;
• Shuttle service; and
• Bicycling.
Marketing and promotional activities to encourage use of transit by workers with non-traditional
schedules and use of transit voucher program by appropriate agencies for welfare recipients and
other low-income individuals are also eligible activities.
New Freedom (NF): The purpose of the NF is to encourage services and facility improvements
to address the transportation needs of individuals with disabilities that are either new and/or go
beyond those that are required by the ADA requirements of 1990. Eligible projects may include,
but are not limited to:
• Purchasing vehicles and supporting accessible taxi, ride sharing, and vanpooling
programs; including staff training, administration, and maintenance;
• Administering voucher and transit pass programs for transportation services offered by
transit and human services providers;
• Administering volunteer driver and aide programs to support the management of driver
recruitment, safety, background checks, scheduling, coordination with riders and other
related support functions;
• Training for individual users on awareness, knowledge, and skills of public and
alternative transportation options available in their communities. This includes travel
training services; and
• Coordinate transportation service access beyond those served by one agency or
organization within a community. For example, a non-profit agency receiving funding
through NF could not limit the services it provides to its own clientele. These services are
intended to build cooperation with other existing providers.

Chapter 5: Potential Strategies to Address Transit Gaps and Overlaps
Panhandle Transportation Coordination Study 5-3
The following are considered eligible mobility management activities:
• The development of coordinated plans;
• Support of state and local coordination policy bodies and councils;
• The maintenance and operation of transportation brokerages to coordinate providers,
funding agencies, and riders;
• The development and maintenance of other transportation coordination bodies and their
activities, including employer-oriented Transportation Management Organizations and
neighborhood travel coordination activities;
• The development and support of one-stop transportation call centers to coordinate
transportation information on all travel modes and to manage eligibility requirements
and arrangements for customers among supporting programs; and
• The acquisition and operation of intelligent transportation technologies to help plan and
operate coordinated systems including GIS mapping, coordinated vehicle scheduling,
dispatching, and monitoring technologies, as well as technologies to track costs and
billing in a coordinated system.
This section outlines potential strategies that may be suitable to address transit gaps and overlaps
that have been identified during the regional assessment. The strategies are examples of possible
courses of action within the Panhandle region. They may be considered by the RTAG or other
stakeholders now or in the future. Alternatively, they may never be seriously considered due to
overwhelming barriers or constraints. At this stage, specific implementation details are not
developed – their potential cost, benefits, key participants are not defined – as these are examples
of courses of action. Potential strategies that generate initial interest on the behalf of RTAG
members or interested agencies will become candidates for further development. This approach
is adopted because the resources to develop details for all potential strategies are not available.
The first section of this chapter describes general approaches to coordination that have yielded
high cost savings or service improvements. The second section reviews more specific strategies
that may be adopted in the Panhandle region.
Chapter 5: Potential Strategies to Address Transit Gaps and Overlaps
Panhandle Transportation Coordination Study 5-4
Coordination Strategies – General Approaches3
High-impact strategies can be classified under four general categories: business expansion, cost
reduction, synthesis/synergy and productivity enhancement. The approaches below have been
demonstrated to deliver significant economic and service improvement benefits for both public
transit operators and health and human service organizations.
Business Expansion
Moving Medicaid trips to Fixed Route: Transit providers can contract to provide Medicaid trips
and other human service agency trips on fixed route. By moving only a small percentage of
Medicaid trips from demand response to fixed route, considerable cost savings are realized and
increased revenues for the transit provider are earned at no additional operating costs. A
partnership between the prime Medicaid contractor and a public transit agency to provide travel-
training targeted specifically at Medicaid clients with the goal to move these riders from demand
response to fixed route service is one strategy to increase the use of fixed route by Medicaid
recipients. Other business expansion opportunities for public transit providers include
coordinating with welfare-to-work programs and/or local school districts to transport students for
regular classes and special events.
Cost Reduction
Moving demand response trips to other health and human service agencies: In some cases,
health and human service agencies can provide demand response trips more economically than
the transit agency. Typically, as a nonprofit organization, these agencies have cost structures
that are less expensive than those of the transit agency. Furthermore, volunteer drivers and staff
drivers who also have other duties can substantially lower the cost of providing this ADA-
mandated transportation. Within the Panhandle region, the cost of demand-response type
service differs among agencies accordingly: $5.76 per trip for Jan Werner Transportation (non-
3 Transportation Cooperative Research Program, TCRP Report 101: Toolkit for Rural Community Coordinated Transportation Services. Washington, D.C., 2004, pages 95 – 103.
Chapter 5: Potential Strategies to Address Transit Gaps and Overlaps
Panhandle Transportation Coordination Study 5-5
profit adult-day care center); $10.30 per trip for Panhandle Transit (non-profit public
transportation provider for rural Panhandle region); and $27.43 for ACT.4
Productivity Enhancement
Instituting community-wide coordinated dispatching: “Often entitled “ridesharing,” this
technique ensures the most cost-effective application of driver and vehicle resources. Correctly
applied, it can eliminate the typical pre-coordination situation of overlapping and inefficient
routes and schedules. In particular, the benefits of providing trips for ADA paratransit clients at
the same time and on the same vehicles as other travelers create much lower costs per trips.”5
Synergy/Synthesis
Coordinating or consolidating separate transportation service to create a general transportation
system: Health and human service organizations and transit agencies can band together to form
one transportation system. This strategy can result in cost reductions, service enhancement, and
greater range of mobility solutions through the consolidation of operations and resources.
Coordination Strategies – Panhandle Examples
Potential strategies are presented in relation to RTAG-adopted goals and objectives. For ease of
reference, the goals and objectives outlined in Chapter 4 are repeated in Table 5.2: Panhandle
Goals and Objectives for Coordinated Transit.
Table 5.2: Panhandle Goals and Objectives for Coordinated Transit Goals Objective
1. Improve delivery of service Improve capacity of ACT and PT to meet current and future demand and fill critical gaps in service.
2. Generate efficiencies in operations Increase utilization of existing services. Reduce or eliminate duplicative services.
3. Enhance customer satisfaction Develop new mobility options to fill critical gaps that are not met by existing services.
4. Encourage cooperation and coordination Reduce and remove barriers to coordination in order to improve future planning efforts.
4 FY04 Operating Statistics 5 Transportation Cooperative Research Program, TCRP Report 101: Toolkit for Rural Community Coordinated Transportation Services. Washington, D.C., 2004, pages 97-98.

Chapter 5: Potential Strategies to Address Transit Gaps and Overlaps
Panhandle Transportation Coordination Study 5-6
Goal 1: Improve delivery of service
Objective: Improve ACT’s capacity to meet current and future demands.
Background: Coordination supposes that there is a fundamentally sound system that can serve
as the core or backbone for the coordinated efforts. Within Amarillo, this is not the case. ACT is
facing an increasingly difficult financial picture and will soon be in a position where it will be
forced to adapt current level of services to decreases in funding.
Since 2004, ACT’s state funding has decreased from $672,980 for FY2004 to $545,114 for
FY2007. Over the next four years, ACT will continue to loose an addition $144,958, from
$545,114 to $400,156 by FY2010. Decreases in state funding are due to a recently adopted state
funding formula for public transit that is based on performance, transit need, and local financial
commitment to transit. ACT’s performance, based on Texas Department of Transportation’s
(TxDOT) standards, is projected to decrease the amount of state funding award to ACT;
however, TxDOT has indicated that it will reevaluate its formula beginning in FY2008.
Furthermore, ACT will potentially lose about $1.34 million in federal funding support for
operations if Amarillo’s population exceeds 200,000; this is an event expected by the 2010
census. These decreases are exacerbated by fuel cost increases. The financial and operational
health of ACT is important because, without a healthy core, other initiatives like coordination
plans are disadvantaged.
Ideas for Achieving Objective
• Contracting with human service agencies to provide service at a rate that more closely
reflects ACT’s cost: The current cost to provide a one-way trip on Spec-Trans is $31 but
ACT only charges $1.50. ACT is allowed by law to establish contracts for service with
state agencies. ACT can charge a rate between the public fare of $1.50 but no more than
its current cost, $31. Currently, agency trips constitute approximately 40 percent of all
Spec-Trans rides and ACT subsidizes $69,000 annually for these trips. By contracting
Chapter 5: Potential Strategies to Address Transit Gaps and Overlaps
Panhandle Transportation Coordination Study 5-7
with human service agencies, ACT could re-capture a percentage of this subsidization.
However, contracting for a higher price is difficult because ACT does not have the legal
authority to require agencies to contract at a higher rate. Therefore, it has no leverage to
enforce this change.
• Adjusting fares for fixed route and Spec-Trans service to reflect rising operating costs:
By increasing fares, Spec-Trans could increase in revenues, albeit this would provide
only minimal relief. Fare revenues represent approximately 6 percent of ACT’s funding.
In FY04, this amount was $175,046. Assuming fixed route increase from 75 cents to
$1.00 and Spec Trans from $1.50 to $2.00, the expected increase in revenue is about
$10,000 for fixed route and about $20,000 for Spec Trans. This is assuming that all riders
continue to use the service. This would compensate for less than 16 percent of the state
funding reductions.
• Changing from a fixed route/demand response system to a flex route system: Currently
ACT provides demand response throughout its service area. However, it is legally
obligated to provide demand response only along a ¾ corridor adjacent to its fixed route.
ACT may be able to decrease its operating costs by moving to a flex route system – a
system in which a vehicle operates along a regular route and according to a schedule but
with the ability to flex off that route slightly. The vehicle will flex if a Spec-Trans
eligible rider makes a reservation to be picked up or dropped off within ¾ of an existing
route. If the person lives outside of the ¾ corridor, no service may not be available.
Flex routing may be difficult to operate and sufficient cost savings may be difficult to
achieve. First, an analysis by ACT indicates that over 90 percent of its Spec-Trans riders
reside within the ¾ corridor. If so, moving to flex route may not relieve Spec-Trans of
much of its demand response load. Second, well-functioning fixed routes would be
eliminated and ridership could suffer from this. Fixed routes appeal to riders because of
their dependability and flex routing can decrease this dependability.
Chapter 5: Potential Strategies to Address Transit Gaps and Overlaps
Panhandle Transportation Coordination Study 5-8
• Charging a premium for Spec-Trans service outside of the ¾ mile corridor: As
mentioned above, ACT is legally obligated to provide demand response service only
within a ¾ mile corridor. Service outside this corridor could be considered a premium
service and ACT could charge more.
• Investing in more rigorous demand-management techniques to control the growth in the
Spec-Trans service: For over a year, ACT has been in the process of re-certifying its
Spec-Trans riders. However, ACT does not require a physical test for certification. A
cost-benefit analysis would be needed to understand if the increased costs for re-
certification using a physical test would be offset by the estimated decrease in the number
of Spec-Trans eligible riders and trips.
• Analyzing the financial and operational implications of contracting for service from
third-party providers: Contracting for service with a private company may allow ACT to
lower its costs for ADA para-transit trips and claim capital cost of contracting. Capital
cost of contracting (CCC) applies to grant funds made available under Sections 5307
5311, and 5310. By separating the capital and operating components of transit service
contracts with private providers and allowing reimbursement of the capital portion at the
capital rate, CCC permits a grantee to apply for additional federal resources to these
activities.
Objective: Improve the financial capacity of Panhandle Transit. Background: According to Panhandle Transit’s quarterly reports, funding consists of state and
federal grants, private foundation grants, fare box revenue and Medicaid contract or sub-contract
revenue. In the future, Panhandle Transit may seek to diversify their sources of revenue.
Ideas for Achieving Objective:
• Exploring grant funding and partnerships opportunities: Through partnerships with
complementary human service agencies and nonprofit organizations, Panhandle Transit
may access grant funds to expand service to under- and un-served populations. As
Chapter 5: Potential Strategies to Address Transit Gaps and Overlaps
Panhandle Transportation Coordination Study 5-9
discussed in Chapter 4, there is a potential for a sizeable unmet demand of over 600,000
trips annually throughout the Panhandle’s rural counties (excluding Potter and Randall
counties). In order to meet this demand, Panhandle Transit must tap into new funding
resources. Similarly, Panhandle Transit may seek support from for-profit businesses.
• Providing charter service in markets where there is no private charter service offered: In
the past, a few of the Panhandle Transit offices provided charter service for special
occasions. This process could be resumed to supplement Panhandle Transit’s revenue
stream.
Goal 2: Generate Efficiencies in Operations Objective: Increase utilization of existing Panhandle Transit service.
Background: The Panhandle Transportation Coordination survey asked, “What are the greatest
challenges to providing transportation to your clients?” After “lack of adequate funding” and
“rural area,” respondents cited “People are unaware of the transportation services that are
available to them.” The lack of awareness also came up in public meetings, especially in the rural
counties. In fact, Panhandle Transit may be one of the best kept secrets out in the counties!
(However there is some concern that if their profile is raised, there will be a flood of demand that
cannot be met). Regardless, there remains unused capacity on Panhandle Transit vehicles that, if
filled, would improve Panhandle Transit’s revenue and generate operational efficiencies.
Ideas for Achieving Objective
• Developing a Panhandle Transit website and promote its use among client agencies and
potential clients: Panhandle Transit owns the rights to use the domain name
panhandletransit.com but currently there is no web page developed. A web page with, at
a minimum, schedule, route, and fare information should be developed. A link should be
provided from the Panhandle Transit’s website to ACT’s website.
• Creating promotional materials tailored to specific client groups, including schedules
and ride guides: For example, promotional materials geared toward seniors may use a

Chapter 5: Potential Strategies to Address Transit Gaps and Overlaps
Panhandle Transportation Coordination Study 5-10
larger font size and include examples of people and activities that are likely to be of
interest to seniors. Promotional materials may help in overcoming the impression of some
that Panhandle Transit is “not a service for them,” or “only for people who are sick or on
welfare.”
• Providing schedules and ride guides to human service agencies and county judge’s
offices: In the elected official survey conducted by the consultant team, some county
judges were much more aware of the transit available to the citizen’s of their county than
others.
• Increasing Utilization of Panhandle Transit Vehicles within Amarillo: About nine
Panhandle Transit vehicles make regularly scheduled trips to Amarillo from the rural
counties on Monday, Wednesday and Fridays. These trips are primarily for dialysis
patients. After dropping off riders at the clinic, many of these vehicles are available to
make additional trips within Amarillo. In addition, seven vehicles are stationed in the
City of Canyon and make regular trips into Amarillo.
Panhandle Transit’s excess capacity may relieve some of Spec-Trans’ excess demand.
Panhandle Transit was successful in its request to utilize Amarillo’s apportionment of
Section 5310 funding (about $155,000). Panhandle Transit intends to use these funds to
purchase a vehicle. In exchange, Panhandle Transit may supply some demand response
trips within Amarillo. However, one issue is that Panhandle Transit cannot use it rural
operating funds to make trips within the urbanized area – other funding sources will have
to be accessed. Another issue is the time of vehicle availability; Panhandle Transit
vehicles are most available from 9:30 am to 1:00 pm. Spec-Trans demand is highest
from 7:30 am to 9:00 am and 11:00 am to 1:30 pm. Panhandle Transit would be most
available to fill the need in the second time slot. However, it may not be available to
make both legs of the trip. Panhandle Transit’s limited availability does not respond to
the need for a provider very early or later in the day, the times when trips are in greater
demand.
Chapter 5: Potential Strategies to Address Transit Gaps and Overlaps
Panhandle Transportation Coordination Study 5-11
Objective: Increase utilization of other service provider programs or private resources.
Background: Little to no transit vehicle overlap was identified outside of Amarillo. In the rural
regions, there is no public transportation provider besides Panhandle Transit, including taxis.
There is a higher concentration of transportation resources within the City of Amarillo. This is
expected as the city is the headquarters for many agencies and has the highest population. As a
result, there is greater potential to improve resource utilization within the City of Amarillo.
However, without additional resources to organize, manage, and supply a program, the city’s
providers are delivering as much service as resources will allow.
Ideas for Achieving Objective
• Increasing utilization of existing traveling training program through Panhandle
Independent Living Center: The PILC already provides travel training to ACT but it does
not have the resources to fill all travel training demands. Furthermore, travel training is
also provided by Goodwill, the TPMHMR, as well as other organizations. By increasing
the capacity of PILC to fulfill all the travel training demands of ACT, it will also be in a
position to provide additional support to other organizations as well.
• Establishing a rideshare program between partnering agencies to deliver para-transit
and/or agency trips: For example, in 2005 Jan Werner Transportation provided
approximately 65,000 trips for their adult-day care clients. They are able to achieve high
efficiency because many of their trips are regular or daily trips to a common destination -
the Jan Werner Adult Day Care Facility and they are concentrated in the morning and
afternoon hours. During the mid-day, vehicles may be idle and typically are scheduled for
maintenance. A rideshare program would expand the number of agencies and clients who
could potentially use Jan Werner Transportation through the establishment of a shared
reservation, scheduling, and dispatch system. (Note: Jan Werner Transportation is only
presented as an example and the organization is not prepared to establish or participate in
such a ride-sharing program. For example, if Jan Werner Transportation were to
participate in a rideshare project, it may require that the vehicle maintenance schedule be
re-assessed. Furthermore, because Jan Werner Transportation uses its Certified Nurse
Chapter 5: Potential Strategies to Address Transit Gaps and Overlaps
Panhandle Transportation Coordination Study 5-12
Assistants (CNAs) in its pool of drivers and CNAs have duties beyond driving, an
expansion of their service would require a reassessment of the role of CNAs.)
• Researching benefits and costs of contracting with a private taxi or non-emergency
medical transportation provider to deliver Spec-Trans trips: Private providers may be
able to provide ADA-Para transit trips at a lower cost than Spec-Trans. Subsidized taxi
programs have been used effectively by some agencies to help seniors and other demand-
response clients make trips at a reduced fare, with sponsoring agencies making up the
difference between what the rider can pay and the cost of the trip. Agencies can set their
own eligibility requirements and restrictions on the number or type of trips that can be
subsidized. Issues that have been identified that may prevent the use of private providers
as a part of the service delivery mix include accountability and quality of the service.
• Addressing inter-regional coordination issues that make it difficult to share passengers
between regions: A potential strategy is the sharing of schedule and fare information
through the Panhandle Transit website with South Plains Management District and
Rolling Plains Management District. The regions will need to establish the fare for inter-
regional passengers, pick-up and drop-off points and coordination of exchange times.
Goal 3: To enhance customer service satisfaction Objective: Develop new mobility options
Background: Mobility for seniors and people with disabilities is an issue of personal freedom as
well as public safety. Far too many seniors may continue driving past a point when it is wise to
do so. Unfortunately, many seniors are also reluctant to use public transit. Likewise, travel by
people with disabilities is limited in the times by the ACT or Panhandle Transit hours of
operation and regions that they cover. There is no evening service in the region, no service on
Sunday, and some important destinations, such as the Amarillo International Airport, are not
served. Panhandle Transit and ACT are limited to the degree to which they can respond to these
needs.

Chapter 5: Potential Strategies to Address Transit Gaps and Overlaps
Panhandle Transportation Coordination Study 5-13
Ideas for Achieving Objective:
• Support the establishment of an Independent Transportation Network nonprofit that is
being pursued through the Senior Ambassador’s Coalition: The Independent
Transportation Network (ITN) is a model developed in Portland, Maine, that is being
repeated throughout the U.S. The ITN a national non-profit transportation solution for
older people who wish to limit or stop driving without losing their independence or
compromising their community activity. More information about the ITN can be found at
www.itnamerica.org.
• Establish a more formalized ride-matching service (i.e. carpooling) to pair seniors in
need of a ride with volunteers. Currently ride-matching is happening de-facto around
churches and organizations such as senior centers. This pilot project would formalize
those efforts and promote ride-sharing as an alternative for more agencies, organizations
and people.
• Explore the feasibility of constructing a new multi-modal terminal for Amarillo that
would serve intercity carriers and local bus service. The downtown bus terminal is an
aging facility in need of renovation. If an effort to establish a new multi-modal terminal
were begun, potential partners would include the intercity carriers like Greyhound or
Coach USA, ACT, and complementary nonprofit services. (Through FTA joint
development provisions, complementary organizations and services can be incorporated
into a multi-modal building plan. For example, day-care is one service that is increasingly
incorporated into facilities. By co-locating services, transit users are not required to make
as many bus trips to meet their needs. In the case of day-care for example, co-location
would address some critical concerns of TANF and other low-wage workers who rely on
transit and use day-care.)
Objective: Fill critical gaps in service
Ideas for Achieving Objective:
• Provide same-day medical trips and other essential trips for Spec-Trans eligible clients.
Currently, there is a taxi-voucher program already in place to provide trips for emergency

Chapter 5: Potential Strategies to Address Transit Gaps and Overlaps
Panhandle Transportation Coordination Study 5-14
care. Hospitals and insurance providers support this program because, in appropriate
situations where ambulance service is not considered critical, it provides for a less
expensive transportation option than an ambulance. At an average of $600 per ambulance
trip, this program represents significant cost savings.
The proposed new program would expand this type of voucher service to provide non-
emergency medical trips and other essential trips to Spec-Trans eligible clients. Typical
destinations may be to a doctor’s office, pharmacy, or medical clinic. Many agencies
cited the need for same-day para-transit service because it is very difficult to schedule an
appointment on Spec-Trans with less than one-day’s notice.
• Address the need for job access, especially to large worksites that are located outside of
small urban/rural and urban areas. A van- or bus-pool project may address the regional
needs of rural employers who draw their labor pool from a large area. This program may
be structured a van-pool service to take advantage of Panhandle Transit vehicles that will
be removed from their inventory (estimated 8 vehicles). These vehicles could then be
leased and operated by the employees. Alternatively, it may be structured as a bus-pool
service that would use active Panhandle Transit vehicles and drivers to provide a
commuter-type service from the region into work sites.
• Ensuring that there is a wheelchair accessible taxi for Amarillo. According to a
representative that attended the workshop on Elderly and Disabled Transportation on
August 31, Yellow Cab Company has access to wheelchair accessible vehicles but these
vehicles are not yet stationed in Amarillo. Yellow Cab is planning securing 3 wheelchair-
accessible vehicles for Amarillo in early 2007. They anticipate charging a base fee of
$2.00 and $1.50 per mile and $0.50 per bag.
• Addressing the need for wheelchair accessible vehicles for trips to the airport. Panhandle
Transit, through their utilization of Amarillo’s 5310 apportionment, would be able to
provide trips to the airport on a limited basis during the mid-day. When Yellow Cab
Company brings in wheelchair-accessible vehicles, this would expand available service
to the airport to 24-hours a day.
Chapter 5: Potential Strategies to Address Transit Gaps and Overlaps
Panhandle Transportation Coordination Study 5-15
Goal 4: To encourage cooperation and coordination
Objective: Remove and reduce barriers for future planning efforts
Ideas for Achieving Objective:
• Establish a Transportation Coordination / Mobility Management function to serve as
bridge between transit agencies and health and human services. Responsibilities under
this function could include: ongoing collection of existing coordinating data;
quantification of local expenditures that are currently not captured and that could be used
as leverage for funding; coordinating the dissemination of information to riders about
appropriate transit options; coordinating information between agencies regarding
potential to work together (organize shared training sessions, opportunities for joint grant
development); establishing a standardized accounting approach to capturing
transportation data.
Chapter 6: Barriers and Constraints to Coordination
Panhandle Transportation Coordination Study 6-1
Chapter 6: Barriers and Constraints to Coordination
This chapter applies the definitions of barrier and constraint that were presented during the Texas
Department of Transportation (TxDOT) Coordination Best Practices Session on June 29 and 30,
2006. A barrier is a regulation, rule, statute, or ordinance that prevents agencies from
coordinating transportation. A constraint is a restriction or limitation but it is not imposed by a
regulation, rule, etc. The source of the constraint can include historical practice, misinformation,
reaction to a perceived barrier, reluctance to change, institutional conflicts, and personality
conflicts. Where possible, the source of the barrier has been noted or a local solution has been
identified.
Fourteen issues were identified as barriers and nineteen as constraints. These are listed in Table
6.1 and Table 6.2. Following this listing, detail on each issue is provided. (Note: Tables 6.1 and
6.2 do not represent the RTAG’s ranking of issues. Rather, they reflect the consultant team’s
understanding of regional concerns. This understanding is based on the amount of discussion
and interest generated by a topic and/or its potential to significantly hinder/improve
coordination efforts.)
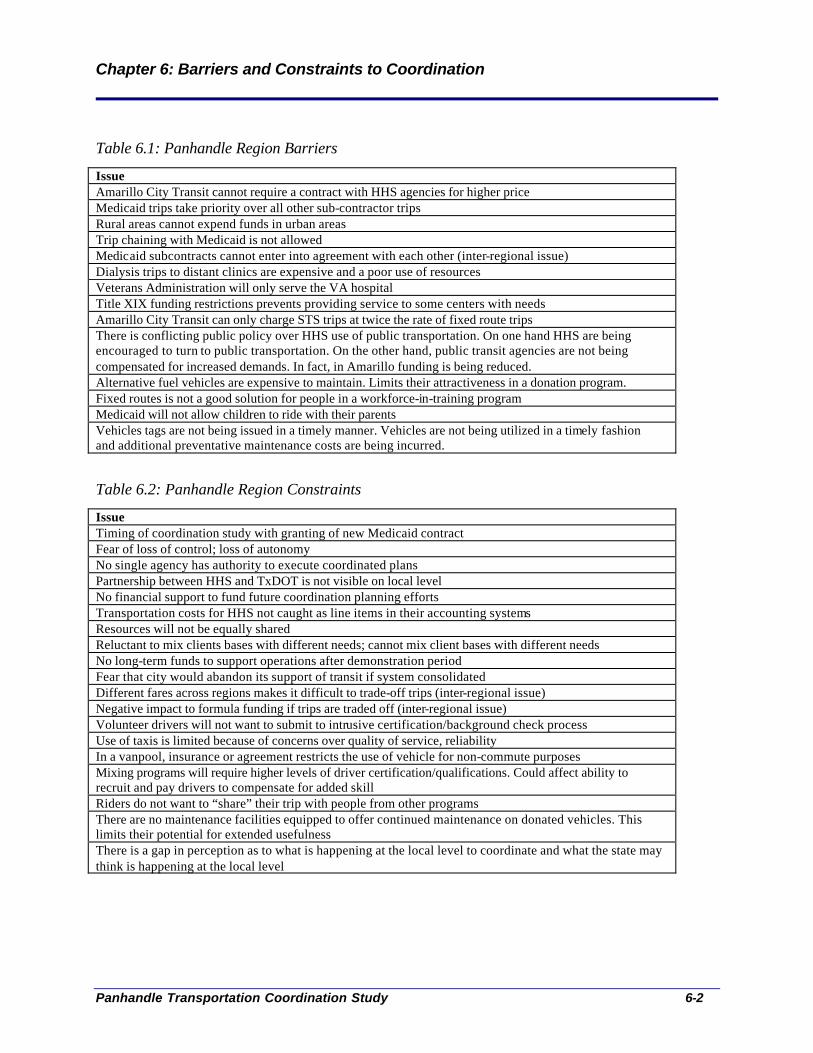
Chapter 6: Barriers and Constraints to Coordination
Panhandle Transportation Coordination Study 6-2
Table 6.1: Panhandle Region Barriers
Issue Amarillo City Transit cannot require a contract with HHS agencies for higher price Medicaid trips take priority over all other sub-contractor trips Rural areas cannot expend funds in urban areas Trip chaining with Medicaid is not allowed Medicaid subcontracts cannot enter into agreement with each other (inter-regional issue) Dialysis trips to distant clinics are expensive and a poor use of resources Veterans Administration will only serve the VA hospital Title XIX funding restrictions prevents providing service to some centers with needs Amarillo City Transit can only charge STS trips at twice the rate of fixed route trips There is conflicting public policy over HHS use of public transportation. On one hand HHS are being encouraged to turn to public transportation. On the other hand, public transit agencies are not being compensated for increased demands. In fact, in Amarillo funding is being reduced. Alternative fuel vehicles are expensive to maintain. Limits their attractiveness in a donation program. Fixed routes is not a good solution for people in a workforce-in-training program Medicaid will not allow children to ride with their parents Vehicles tags are not being issued in a timely manner. Vehicles are not being utilized in a timely fashion and additional preventative maintenance costs are being incurred.
Table 6.2: Panhandle Region Constraints
Issue Timing of coordination study with granting of new Medicaid contract Fear of loss of control; loss of autonomy No single agency has authority to execute coordinated plans Partnership between HHS and TxDOT is not visible on local level No financial support to fund future coordination planning efforts Transportation costs for HHS not caught as line items in their accounting systems Resources will not be equally shared Reluctant to mix clients bases with different needs; cannot mix client bases with different needs No long-term funds to support operations after demonstration period Fear that city would abandon its support of transit if system consolidated Different fares across regions makes it difficult to trade-off trips (inter-regional issue) Negative impact to formula funding if trips are traded off (inter-regional issue) Volunteer drivers will not want to submit to intrusive certification/background check process Use of taxis is limited because of concerns over quality of service, reliability In a vanpool, insurance or agreement restricts the use of vehicle for non-commute purposes Mixing programs will require higher levels of driver certification/qualifications. Could affect ability to recruit and pay drivers to compensate for added skill Riders do not want to “share” their trip with people from other programs There are no maintenance facilities equipped to offer continued maintenance on donated vehicles. This limits their potential for extended usefulness There is a gap in perception as to what is happening at the local level to coordinate and what the state may think is happening at the local level

Chapter 6: Barriers and Constraints to Coordination
Panhandle Transportation Coordination Study 6-3
Barrier 1: There is a lack of incentives/leverage that a public transportation provider has at its
disposal to bring health and human services agencies as active and engaged partners to the
process of coordinating social service transportation.
Source of Barrier: ADA regulations
How is obstructing regional coordinated service: A public transportation provider cannot
require a public agency to pay the fully allocated cost of a client’s trip; it can only ask. As the
regulation is written, a public transportation provider has no leverage if it wishes to recover more
of its costs in its provision of services to another public agency. Similarly, it has no protection if
another public agency wishes to shift the costs of its service onto the public transportation
provider.
Forty percent of Spec-Trans rides are agency trips – these are trips that are provided by a public
transportation service that is intended to serve and benefit the general public. Public resources
are being re-directed and concentrated to benefit a narrower group of agencies that then overload
the system and make it difficult to meet general public trips. For example, ACT has experience
with a senior home that will request paratransit applications en masse. When ACT explains that
its service is not intended to replace its responsibility to deliver the transportation for which the
agency is receiving state support, clients are instructed to call the ACT each individually as a
way to circumvent the restriction. ACT has no recourse in this situation and it enables the
client’s agency to shift its cost of transportation to the ACT. Trips provided to the Amarillo
State Center and Workshop (ASC) is another example. Each month, ACT provides over 550
one-way trips to ASC agency. This represents 25 percent of ACT’s volume. Given that each
rider is charged at $1.50 per trip and the cost to deliver a trip is $31.00 per trip, at the current
volume of service delivery, this equates to a subsidization of $16,225 that is re-directed to
support a single agency. These are funds that are not available to serve the general public.
Person Identifying: Judy Phelps, ACT Director
Chapter 6: Barriers and Constraints to Coordination
Panhandle Transportation Coordination Study 6-4
Barrier 2: A Medicaid trip takes priority over all other trips a sub-contractor provides.
Source of Barrier: Medicaid contract
How it is obstructing regional coordinated service: A Medicaid trip must be delivered on the
day and at the time scheduled by the Medicaid Transportation Services office. Since all trips
statewide are scheduled through only a few call centers, it is easy to see why Medicaid has
created this inflexibility. It would be a scheduling nightmare if a few centralized offices had to
deal with optimizing scheduling and routing for all the region’s contractors and sub-contractors.
However, this monolithic approach denies local regions any ability to try to optimize their
systems.
Sometimes, the scheduling of a Medicaid trip can create a loss of service in a local area. This is
particularly true of the rural regions where there may be only one or two vehicles. Where a
scheduling change may alleviate the condition that would create a loss of service, local providers
are not provided the option of attempting to develop a solution that would create the highest
benefit to all transit riders affected. Instead they are required to provide the trip regardless of
whether it requires additional vehicles.
In response, AMR reports that a Medicaid trip is, in most instances, different from a general
public trip by virtue of the needs; i.e. some Medicaid transportation is for life-saving treatment
like dialysis. Historically, these trips account for 22 to 28 percent of all Medicaid system
demand. Granted, some Medicaid trips are even for simple medical follow-ups however the
majority of riders are medically fragile individuals with chronic health problems. In these cases,
a missed or delayed medical appointment may result in future health conditions of a more serious
nature.
Person Identifying: Gerald Payton, Director of Panhandle Transit
Chapter 6: Barriers and Constraints to Coordination
Panhandle Transportation Coordination Study 6-5
Barrier 3: Rural providers cannot expend rural operating funds within the urbanized area.
Source of Barrier: Federal regulations for Section 5311 funding
How it is obstructing regional coordinated service: Panhandle Transit is the rural transit
provider for the Panhandle region. However, Panhandle Transit frequently travels to the City of
Amarillo so that their riders can access regional health care and other services. During the time
that Panhandle Transit is in Amarillo, they are restricted from operating within the city limits for
any trip that begins and ends within the urban area. These restrictions are: 1) Panhandle Transit
can expend capital assets (i.e. vehicles) if the operating expense is covered by a funding source
other than Section 5311; 2) no service is denied from the rural area; and 3) the trip has a rural
origin.
This rule obstructs regional coordination in two ways: 1) During the time that Panhandle Transit
is within the City of Amarillo, it has excess vehicle capacity that it could use to deliver STS trips
(urban origin – urban destination). However, federal funding regulations restrict Panhandle
Transit from delivering urban-to-urban trips. Panhandle Transit believes it could subsidize its
rural operation if it were allowed to earn fares while its vehicles were sitting idle within the city
limits; and 2) Panhandle Transit serves Canyon, Texas. Canyon sits just south of Amarillo.
Nearly every day, it picks up riders in Canyon to take them to Amarillo. However, they are not
allowed to pick up additional riders that live within the City of Amarillo that may need a ride and
that live on-route. If a person lives within ACT’s service area, that person must be served by
ACT. This restriction creates a duplication of services. If the person lives outside of ACT’s
service area, this creates a transit gap between Amarillo and Canyon as no transit is available.
Person Identifying: Gerald Payton, Director of Panhandle Transit
Chapter 6: Barriers and Constraints to Coordination
Panhandle Transportation Coordination Study 6-6
Barrier 4: Trip-chaining is not allowed on Medicaid trips.
Source of Barrier: Texas Administrative Code, Title I, Part 15, Chapter 380, Subchapter C:
Clients Rights. (5) Recipients must not use authorized medical transportation for purposes other
than travel to and from health care services.
How it is obstructing regional coordinated service: By disallowing trip-chaining, riders are
required to return to their origin before taking another trip on public transportation. During the
2005 - 2006 contract period, Panhandle Transit delivered about 30,000 trips Medicaid trips. In
the prior contract period, Panhandle Transit sought and received relief from this regulation
during contract negotiations. Specifically, relief allowed that the Medicaid rider could receive
two legs of a trip under Medicaid – origin to Medicaid destination and the Medicaid destination
to second destination. The second destination could be to any destination Panhandle Transit
would normally serve - the rider’s home, pharmacy, shopping – as long as the trip length of the
second leg was equitable to the first leg.
AMR and LeFleur respond that there is a provision to add other destinations if they are related to
the original trip, e.g. blood work, x-rays, etc. Moreover, they support the TxDOT policy of
restricting trip purpose in an effort to eliminate abuse.
Person Identifying: Gerald Payton, Director of Panhandle Transit
Potential Solution: Allow the second destination be any approved trip of equitable distance to
the first trip.
Chapter 6: Barriers and Constraints to Coordination
Panhandle Transportation Coordination Study 6-7
Barrier 5: Medicaid does not allow transit service provider sub-contractors to “sub-contract”
with another service provider.
Source of Barrier: Medicaid contract provisions
How it is obstructing regional coordinated service: Medicaid riders have freedom of choice
when it comes to choosing where they will receive medical services. Within the Panhandle, this
can mean that a rider may wish to go to Dallas, Lubbock, Wichita Falls, Houston, Kansas, New
Mexico, etc. Once a prime contractor has assigned a trip to the sub-contractor, that sub-
contractor must deliver the entire trip; it cannot sub-contract portions of this trip to other services
providers in other regions, unless those other providers are also under contract with the prime.
For example, Panhandle Transit would like to be able to coordinate with its counterpart, South
Plains Transit District, to share the long-distance trips between regions but they could not do this
unless South Plains Transit District were also under contract with the prime.
In response to this, AMR emphasizes the prime contractor’s responsibility to ensure quality of
service and the Medicaid client’s safety. As such, it is the prime contractor’s responsibility to
credential vehicles and drivers and subcontractors are not charged with doing so.
Person Identifying: Gerald Payton, Director of Panhandle Transit

Chapter 6: Barriers and Constraints to Coordination
Panhandle Transportation Coordination Study 6-8
Barrier 6: Dialysis trips are determined by the patient’s doctor and sometimes are scheduled for
distant clinics even if there is an available seat at a closer clinic.
Source of Barrier: Patient’s freedom of choice and doctor/client relationship
How it is obstructing regional coordinated service: Patients are being assigned to dialysis
clinics that are located far from their homes even when there is an available seat at a closer
clinic. According to some of the feedback that the consultant team gathered during this study,
these assignments are made by care-providers and are based not on convenience to the patient
but rather on the potential for monetary remuneration to the care provider from the clinic. In
some cases, people reporting this barrier believed that care providers were part-owners of clinics
to which they would send their patients.
Dialysis is such a heavy consumer of transit resources – each client going Monday, Wednesday,
and Friday every week. Moreover, traveling long distances is potentially harmful to a client;
several bus drivers spoke of witnessing a visible deterioration of a patient’s health as he/she
underwent dialysis and the long bus trips its schedule required. Because of these two factors, the
ability of transit agencies to work with dialysis patients and doctors to schedule at nearby clinics
if there is an open seat would be beneficial to patients and the transit system alike.
Person Identifying: Judge Jay Mayden, Childress County
Chapter 6: Barriers and Constraints to Coordination
Panhandle Transportation Coordination Study 6-9
Barrier 7: Veterans Administration vehicles are only allowed to travel from the passenger pick-
up point to a veteran’s medical facility.
Source of Barrier: Federal Agency Regulation (Conversation with Lynn Woodward, Director of
Patient Relations, Amarillo VA Hospital)
How it is obstructing regional coordinated service: Riders who take trips into an urbanized
area, like Amarillo, from a rural area will frequently need to make trips to satisfy a number of
needs – shopping, personal, etc. For veterans that take the VA bus, they are only allowed a trip to
a veteran’s medical facility. The result of the silo-ing of resources is two-fold. One is that the VA
resources are underutilized. Frequently, rural-urban-rural trips can take an entire day as all
passengers must wait for the last passenger to be finished with his/her appointment before
returning home. During this time, the VA buses are idle. Second is that the trips are shifted onto
the public transportation. Spec-Trans provides about 60 trips per month to the VA. This shifting
of trips may equate into a less efficient use of public funds since the VA cost per trip is likely to
be less than that of Spec-Trans. (The VA uses donated equipment or General Services
Administration equipment that has been transferred to VA and, in some instances, volunteer
drivers.) Additionally, this may result in lower customer satisfaction if riders are forced to make
more connections and take more of their time arranging for and taking transportation.
One barrier that was mentioned during public hearings and was later dispelled by Ms. Woodward
was the prohibition against picking up any riders within a 100 radius of the final destination.
According to Ms. Woodward, no such prohibition exists.
Person Identifying: Judy Phelps, ACT Director; Gerald Payton, Director of Panhandle Transit
Chapter 6: Barriers and Constraints to Coordination
Panhandle Transportation Coordination Study 6-10
Barrier 8: Medicaid transportation provider cannot service health and human service centers
that receive Title XIX Funding.
Source of Barrier: Texas Regulation (Administrative Code, for example): Title 1, Part 15,
Chapter 380, Subchapter B, RULE §380.207 Program Limitations
How it is obstructing regional coordinated service: Adult day care centers may receive Title
XIX funding, a percentage of which is intended to support transportation services. However, the
specific amount of funding is often not known because it is bundled into other expenses.
However, the transportation funding does not appear to be enough to cover all the costs of
transportation for some centers. Some centers may like to rely on the Medicaid provider to
deliver services to eligible recipients. However, it is prohibited because it is seen as “double-
dipping,” that is, funding is being provided twice, once to the center and once to the Medicaid
provider, to provide for the same trip.
Person Identifying: Lynn Castle, TxDOT Lubbock region
Potential Solution: One solution to this may be that a center could chose to forego that portion
of its funding dedicated to transportation if it could receive Medicaid service in return.
Chapter 6: Barriers and Constraints to Coordination
Panhandle Transportation Coordination Study 6-11
Barrier 9: An STS trip can only be charged at rate twice that of a regular fixed route trip.
Source of Barrier: Federal Regulations
How it is obstructing regional coordinated service: ACT charges only 75 cents for its fixed
route and therefore only $1.50 for an STS trip. The very low cost of an STS trip has created a
situation where the demand does not equal supply – there are far too many STS trips required
than there are funds to provide them. This creates a drain on the public transportation system’s
finances that ultimately may weaken and force a contraction of the whole system.
This pricing linkage between fixed route STS fare creates a situation where an agency may be
forced to increase its fixed route fares just so that it can increase its STS fare. If one of the goals
of coordination is to utilize resources efficiently, any move to encourage higher use of the less
expensive, more efficient fixed route system should be encouraged. However, if you have to
raise fixed route rates to get riders to move from demand response to fixed route, a perverse
incentive has been created.
Person Identifying: Judy Phelps, ACT Director
Possible Solution: One solution that may be tried at the local level is offering free bus passes to
all Spec-Trans eligible riders that use fixed route.
Another approach is to re-classify some of STS service as a premium service. STS was originally
intended as a temporary measure to be in place only as long as it took to make all fixed route
stops accessible. ACT now has 100 percent accessible stops. If it were to continue to provide
STS, curb-to-curb service, all trips outside of the ¾ service corridor should be considered a
premium service and charged at a higher rate.
Chapter 6: Barriers and Constraints to Coordination
Panhandle Transportation Coordination Study 6-12
Barrier 10: Conflicting public policy that creates additional financial strain on already cash-
strapped public transit agencies.
Source of Barrier: Unknown
How it is obstructing regional coordinated service: HHS departments are required to use
public transportation even though they may have the transportation resources to meet their
clients’ needs and this is the most effective solution. For example, there was a HHS agency in
Amarillo that was given a “deficiency” during its agency review because they did not use public
transportation but instead relied on its vehicles even though the agency saw the use of its
vehicles as the most effective way to serve their clients. From the perspective of ACT, the
agency’s use of its vehicles was also the most effective way to deliver the trip because ACT’s
cost per trip for STS service is $31.00, higher than the agency’s cost per trip. Despite this, the
agency earned the deficiency. This situation is compounded by Amarillo’s reduction funding. In
essence, the public transit agencies are having their funding reduced while there are efforts to
increase agency-related demand.
Person Identifying: Carla Hughes, staff member of ADVO

Chapter 6: Barriers and Constraints to Coordination
Panhandle Transportation Coordination Study 6-13
Barrier 11: Vehicles that are purchased through the state are required to be propane- or
alternative fuel vehicles.
Source of Barrier: Texas Department of Transportation Policy
How it is obstructing regional coordinated service: The requirement to purchase alternative
fuel vehicles generates higher fuel and maintenance costs. This makes it more difficult to extend
the useful service of the equipment. One way this relates to coordination is that a transit agency
will donate vehicles that have exceeded their useful life to nonprofit or human service agencies.
Sometimes it is difficult to donate standard vehicles if they have high mileage because the
agencies are fearful that they will not be able to afford the maintenance of the vehicle. However,
transit agencies do what they can to encourage the continued usage of the equipment as it
removes a burden from their system. However, with alternative fuel vehicles, the fear of high
maintenance and fuel costs makes it even more difficult to donate these vehicles.
Person Identifying: Gerald Payton, Director of Panhandle Transit
Chapter 6: Barriers and Constraints to Coordination
Panhandle Transportation Coordination Study 6-14
Barrier 12: Fixed-route transportation is not a suitable transportation solution for clients in job
access/welfare to work programs.
Source of Barrier: Texas Workforce Development Board
How it is obstructing regional coordinated service: Welfare-to-work program requires
recipients to make multiple trips in order to fulfill their personal work plans. They may need to
attend training, apply for numerous jobs, and schedule and make interviews. For example, a
person who is enrolled in the CHOICES program must seek 15 jobs each week. Currently, the
Panhandle Workforce Development Centers gives clients gas vouchers to pay for their
transportation. A gas voucher is seen as the most efficient transportation solution since clients
must meet these multiple appointments. A move away from gas vouchers and to use of the public
transportation system creates another barrier to the person who is trying to move from welfare to
work. This is because a ride on the ACT can easily consume an hour for a one-way trip. Without
a fixed route service with reasonable headways, the ability of workforce clients to use the system
is limited.
Person Identifying: Johnny Smith, Texas Workforce Development Board

Chapter 6: Barriers and Constraints to Coordination
Panhandle Transportation Coordination Study 6-15
Barrier 13: Medicaid only allows recipients and their attendants to ride. In cases where the
recipient is a parent and day-care is not available, children are not allowed to ride with the
parent.
Source of Barrier: Title 1, Part 15, Chapter 380, Subchapter B: (3) transportation for an
attendant(s); if the health care provider documents the need, the recipient is a minor, or a
language or other barrier to communication or mobility exists that necessitates such assistance.
How it is obstructing regional coordinated service: If a goal of coordinated transportation is to
increase customer satisfaction, by denying a rider to have her/his children accompany the parent
to an approved appointment, customer service satisfaction is decreased. If approved Medicaid
riders cannot bring those under their care with them, riders may choose to forego an
appointment. If that is the case, additional public health costs could eventually be incurred.
Alternatively, the rider could rely upon public transportation to deliver a child to day-care. If that
is the case, the rule is requiring the Medicaid rider make two additional trips – one to deliver the
children to day-care and one to pick the children up. This requirement will consume more time
and energy and will generate additional day-care costs that the Medicaid recipient is likely not in
a position to bear easily.
Person Identifying: Gerald Payton, Director of Panhandle Transit
Chapter 6: Barriers and Constraints to Coordination
Panhandle Transportation Coordination Study 6-16
Barrier 14: Tags for public transportation vehicles expire before plates arrive, resulting in the
new vehicles sitting parked and unused for a period of about six weeks.
Source of Barrier: TxDOT Policy or Work Practice
How it is obstructing regional coordinated service: Public transportation providers like
Panhandle Transit are receiving new vehicles that are issued with 20 day tags. However, the
plates to the new vehicles are not arriving until about six weeks after the tags expire. During this
time, the vehicle will sit unused. In addition to creating a situation of under-utilized resources,
this lag can also generate higher maintenance costs (inefficient use of resources) as the
transportation provider must continue to pay for the higher costs of maintenance for high mileage
vehicles.
Person Identifying: Gerald Payton, Director of Panhandle Transit
Potential Solution: Two solutions have been proposed: 1) allow the local TxDOT office to issue
an extension of the tags; or 2) allow tags to be transferred between vehicles.

Chapter 6: Barriers and Constraints to Coordination
Panhandle Transportation Coordination Study 6-17
Constraint 1: Timing of the Medicaid contract awards diverted attention away from the
coordination process at a critical time.
How constraint is obstructing regional coordinated service: Given that Commissioner
Andrade has already addressed the timing, process and resultant backlash of the award of
Medicaid contracts and its effect on the coordination study process, not much can be added to
this point. However, it warrants documentation that it created a diversion of time and attention at
a critical time. Instead of beginning the coordination study on a positive note and cultivating a
good working environment, the timing of the Medicaid contracts awards created a diversion from
the broader goals of the study and a more adversarial environment.
How constraint is being addressed at local level: The representatives from the RTAG met with
the new Medicaid contractor, AMR, on October 23rd, 2006, and discussed misconceptions and
misrepresentations that had been made as a result of a lack of communication and a poor
working relationship. Both parties agreed that a better working relationship would only benefit
the Panhandle region as would an increase in the number of transportation providers.

Chapter 6: Barriers and Constraints to Coordination
Panhandle Transportation Coordination Study 6-18
Constraint 2: Potentially beneficial coordination projects may be foregone because the partners’
fear of change and the loss of autonomy/control.
How constraint is obstructing regional coordinated service: It is difficult to address an
organization’s long-term culture and practices in a short period. If partners are asked to
significantly change how they do business, they must be building upon a foundation of trust.
This is an issue that will be faced in an incremental manner as projects are identified,
partnerships are formed, challenges are met with an open and supportive process, and success is
achieved and shared.
How is constraint being addressed at local level: The pilot projects that are chosen for
implementation in the Panhandle Regional Transit Coordination Study are constrained in order to
heighten their potential for success. After the regional partners become more educated about
coordination and see examples of local success, the region can use the momentum of those
successes to propel other, more ambitious projects forward.
Chapter 6: Barriers and Constraints to Coordination
Panhandle Transportation Coordination Study 6-19
Constraint 3: No single agency has the authority to implement coordination plans.
How constraint is obstructing regional coordinated service: No agency is given the authority,
responsibility, and resources to ensure coordinated service. Currently, no agency has the
authority to ensure:
• Require agencies participate;
• Capture data to ensure local match is accurately reflected; and
• Dedicate resources to achieving coordination goals.
Coordination can be encouraged through discretionary funding. In fact, the execution of many of
the coordination action plans may be dependent upon successfully securing discretionary funds.
However, if a region is unsuccessful in its attempts to secure such funding, the momentum to
achieve coordination goals may fizzle.
How constraint is being addressed at local level: Some members of the RTAG are most
interested in developing projects that do not rely on discretionary funding. This approach is
taken, in part, because the region has historically been unsuccessful in securing discretionary
funding.
Chapter 6: Barriers and Constraints to Coordination
Panhandle Transportation Coordination Study 6-20
Constraint 4: Partnership between TxDOT and Texas Department of HHS to coordinate is not
visible at local level.
How constraint is obstructing regional coordinated service: The difficulty in coordinating
health and human services agencies with the transportation agencies is evident at both the state
and local levels. For instance, it appears that the partnership between the state offices of TxDOT
and HHS is not strong. Top-level policymakers for the Texas Department of HHS did not have a
strong presence at the best practices session held in June. Requests to TxDOT asking for
information regarding transportation funding to HHS agencies were not successful. At the local
level, many agencies were unaware H.B. 3588’s mandate to coordinate.
Lack of support for coordination at the state level has made it more difficult at the local level to
achieve coordination. First, there is the issue of credibility; local offices are going to be most
responsive to their governing regional or state offices. This process lacks some credibility if the
message to coordinate is coming from a public transit provider, a Council of Governments, or
TxDOT (regardless of the fact that TxDOT is now in control of a portion of their funds). Second,
there is the issue of education and information. At the local level, a significant amount of time
was spent simply educating agencies about coordination and trying to bring them into the process
– and despite best efforts, many are still only marginally involved. If there was a more
comprehensive, shared and statewide approach to educating both sides about coordination, the
local efforts could focus more on solutions and less on identifying, educating, and encouraging
agencies to participate.
How is constraint being addressed at local level: Efforts were made and continue to be made
to contact and inform human services providers about coordination and how it can affect their
delivery of services.
Chapter 6: Barriers and Constraints to Coordination
Panhandle Transportation Coordination Study 6-21
Constraint 5: No financial resources to support future coordination planning. Success is
frequently a measure of effort. Consistent efforts will take consistent resources. If efforts are
sporadic, success is likely to be the same.
How constraint is obstructing regional coordinated service: There is the concern in the
Panhandle that the results from the coordinated planning effort will be minimal and short-lived.
Furthermore, there is some concern that the commitment to coordinated transportation from
TxDOT may be fleeting and participants point to the lack of additional resources to support
future planning efforts as evidence of this. These two sub-currents create a dynamic where
reticent participants to coordination are inclined to remain disengaged.
How constraint is being addressed at local level: Research supports and local experience
confirms that coordination is a long and difficult process. Not because there are no solutions –
but because it is, at its heart, a long political process that is built upon experience and trust.
Because coordination is being directed at the state level down to the regional level, it will take
time to build regional commitment. In fact, the Panhandle is still in search of project champions
to spearhead projects that are priorities for the region. The approach of the Regional
Transportation Advisory Group is to build on small successes. Therefore, this first plan will be
fairly constrained in its ambitions.
However, one pilot project that is being considered is the establishment of a Transportation
Coordinator position. This position would be tasked with carrying on the work of this study and
addressing some of the long-term needs that were not achievable within its timeframe. The
Transportation Coordinator (TC) is a planning position that would serve as a bridge between
health and human service agencies and transit providers. The TC would develop trip-information
database for both health and human services agencies; collect and document local-share that is
currently under-reported; support on-going and new coordination efforts; and assist in
identifying and developing new grant or public-private opportunities.
Chapter 6: Barriers and Constraints to Coordination
Panhandle Transportation Coordination Study 6-22
Failing the funding of this position, the plan will outline activities that can be undertaken within
agencies, given their current resources. The approach may follow the six P’s that have been
articulated by Michael Norris of North Central Texas Council of Governments:
• Policy: What are agencies’ policies regarding coordinated transportation and do these
policies need to be changed?
• Programs: What programs need to reflect coordinated transportation?
• Plans: What plans need to reflect coordinated transportation?
• Projects: What are the priority projects that need to pursued and that address the goals
and objectives of coordinated transportation for the Panhandle region?
• Performance: What are the benchmarks that the plans need to address?
• Partnership: Who are the important players in this region that need to be invested in
pursuing and maintaining a coordinated system?
Chapter 6: Barriers and Constraints to Coordination
Panhandle Transportation Coordination Study 6-23
Constraint 6: Transportation costs and benefits are not captured in the HHS record-keeping
systems as distinct line items. They are blended into other costs.
How constraint is obstructing regional coordinated service: Because transportation costs are
not distinct line items for many human service agencies, it is difficult to measure how much is
being spent. Because many human service agencies do not measure how many trips are being
delivered, it is difficult to measure how effective their services are. Lastly, because some human
service agencies deliver transportation-related services as part of a bundle of services they
provide to a client, it is difficult to measure whether the segregation of transportation from that
bundle will result in a net loss or gain in overall delivery of service to that client. Without this
type of detailed cost and service delivery information, the benefit (or loss of benefit) resulting
from any coordination effort may be very difficult to capture. Without the ability to demonstrate
an improved level of service to a client, many potential partners will be unwilling to come to the
table.
How is constraint being addressed at local level: One coordination project that has been
suggested is the creation of a position to address coordination issues like the one described
above.

Chapter 6: Barriers and Constraints to Coordination
Panhandle Transportation Coordination Study 6-24
Constraint 7: Resources will not be fairly shared in a coordinated system.
How constraint is obstructing regional coordinated service: Those who have resources will
be unwilling to share for fear that they will not be adequately compensated. For example, Jan
Werner Transportation provides service to those clients of Jan Werner Daycare and the PACE
program. They deliver more than twice the number of Spec-Trans trips. They are able to do this
because their schedule is very predictable with trips sharing many common destinations, like the
Jan Werner Adult Day Care Center.
For example, should these Jan Werner vehicles be brought into a coordinated system, not only is
there a concern about adequate compensation for the direct capital and operating expense, but
compensation for the disruption to general operations. For example, vehicles are currently
maintained during mid-day hours when trip demand is low. Should these vehicles be
incorporated into a coordinated system, the maintenance program would have to adjust and this
could create additional expenses. Another example is that Jan Werner uses its health care
providers as drivers. Should the vehicles be brought into a coordinated system, these health care
providers could no longer serve as drivers since their priority is to provide care for Jan Werner
clients – not provide trips to other agencies or the general public. Jan Werner would now be in
the position to hire drivers. However, this removes one of their cost advantages – being able to
leverage health care workers time and salary to deliver transportation.
Lastly, there needs to be an incentive for agencies and organizations that are resource-rich to
participate in coordinated projects. Recently, Jan Werner has relied more on its own resources
and less on TxDOT for the purchase of vehicles. At this point, there is no compelling benefit to
Jan Werner to change its service delivery model.
How constraint is being addressed at local level: One project that is being proposed in the plan
is the creation of the Transportation Coordinator position. This position would be able to
research the potential for coordination projects that would be a win-win for both agencies.
Chapter 6: Barriers and Constraints to Coordination
Panhandle Transportation Coordination Study 6-25
Constraint 8: Agencies are reluctant to mix different client bases because they have different
needs.
How constraint is obstructing regional coordinated service: Coordinating demand response
service for Spec-Trans eligible clients and clients of Jan Werner Adult Day Care was discussed.
Jan Werner delivers about 65,000 trips annually and Spec Trans delivers about 26,000 trips.
Because of the volume of trips, the coordination of these two programs merited investigation.
Spec-Trans provides curb-to-curb service and will not assist a rider with his/her packages. Jan
Werner provides door-through-door service and will assist a rider with his/her packages and
provide additional assistance to the extent possible. Spec-Trans is unable to increase its level of
service and still be economically viable. At $31.00 per trip, any additional cost generated by
increased service will represent a significant burden. On the other hand, Jan Werner is committed
to providing a very high level of service; their clients both expect and need more than curb-to-
curb service.
In addition to the differing client needs, coordination is hindered because Jan Werner uses its
vehicles most heavily during the morning hours and late afternoon hours. During the mid-day,
vehicles are maintained. Spec Trans experiences it highest volume from 7:30 am to 9:00 am and
then from 11:00 am to 1:30 pm. Jan Werner would not be available to support additional trips
during the morning peak. Vehicles are not in use and potentially available for the afternoon peak
however, it would require a change in the maintenance program. At this time, that change is not
being considered.
How constraint is being addressed at local level: At this time, the coordination of Jan Werner
and Spec Trans is not being considered due to the issues discussed above.
Chapter 6: Barriers and Constraints to Coordination
Panhandle Transportation Coordination Study 6-26
Constraint 9: Lack of funds to sustain projects after demonstration period expires.
How constraint is obstructing regional coordinated service: Similar to the constraint “No
financial resources to support future coordination planning,” agencies are reluctant to create a
demand for services that they will not able to maintain in the long-run. Public transit services and
health and human agency transportation is subsidized because it is not supported through the
market alone. Under a coordinated system, it could be argued that no new resources are needed
because the subsidy is merely shifted from two efforts to a shared effort. However, the degree to
which this shifting of subsidies is a one-to-one shift will likely be a factor of time. Early phases
may be expected to less efficient – possibly even costing more than the original approach – as
coordination goes through a trial and error phase.
How constraint is being addressed at local level: The RTAG has approached its project
selection conservatively – in at least two cases, selecting projects that will not rely on
discretionary funding. However, this approach is not possible for all the projects. In the cases
where additional funding is needed, the RTAG is concerned about creating expectations for new
services when it does not have total control over the resources to deliver those services.
Their concern is partially based in how well the region has fared in the past. Typically, the
Panhandle does not compete as well as other regions just because they do not have the
population of other areas and therefore cannot demonstrate the same kind of “bang for the buck.”
This being said, regional equity needs to a consideration as well as a project’s
effectiveness/efficiency projections.
Chapter 6: Barriers and Constraints to Coordination
Panhandle Transportation Coordination Study 6-27
Constraint 10: Fear that city will completely abandon public transit if urban and rural systems
were to consolidate into a single transit district.
How constraint is obstructing regional coordinated service: Consolidation of the urban and
rural system into one transit district is not seen as a viable coordination strategy because it runs
the risk of destroying what public transportation is left in Amarillo. It is a concern that if the
service was no longer under city management, the city would no longer recognize an obligation
to support public transit. Furthermore, if the service were to experience a cost over-run, the
consolidated district would not have access to city funds to see it through a cash-flow or budget
crunch.
How constraint is being addressed at local level: Consolidation of services is not being
pursued within the Panhandle region.
Chapter 6: Barriers and Constraints to Coordination
Panhandle Transportation Coordination Study 6-28
Constraint 11: Different fares between regions make it difficult to share service-delivery for
inter-regional trips.
How constraint is obstructing regional coordinated service: In the past when Panhandle
Transit has tried to coordinated service with its eastern counterpart, Rolling Plains Management
District, there have been significant differences in the fare charged to the rider. In one instance,
the Panhandle Transit passenger was charged about $5 for the east-bound leg. The return trip
under Rolling Plains was $60. If these discrepancies in rates persist, Panhandle Transit will
deliver the entire trip rather than expose their riders to significantly higher fares.
How constraint is being addressed at local level: During a 5310 meeting in the Childress
District Office in September 2006, Panhandle Transit and Rolling Plains Management District
met to discuss their interest in developing an agreement for better coordination of services
between the two regions.
Chapter 6: Barriers and Constraints to Coordination
Panhandle Transportation Coordination Study 6-29
Constraint 12: The ability to coordinate trips inter-regionally is made more difficult because
formula funding may be decreased if trips are shared between providers.
How constraint is obstructing regional coordinated service: In discussions between
Panhandle Transit and Citibus of Lubbock, there is the concern that if an agency were to give
one of its trips to another system through an inter-regional agreement, then the originating
system would be harmed in its formula funding because it would be reflected as a decrease in
volume.
How constraint is being addressed at local level: Panhandle Transit, South Plains Management
District, and Citibus will meet to discuss the ramifications of trip-sharing and how to establish a
system for sharing trips.
Chapter 6: Barriers and Constraints to Coordination
Panhandle Transportation Coordination Study 6-30
Constraint 13: Volunteer drivers are reluctant to undergo the required background checks that
are needed to provide transportation to the public.
How constraint is obstructing regional coordinated service: Two projects that are being
considered for the Panhandle region - the Independent Transportation Network (ITN) and ride-
matching - rely on volunteer drivers. However, it is very difficult to attract and keep volunteer
drivers. The one volunteer driver program currently in place in the Panhandle is the Road to
Recovery – a transportation program for cancer patients that is directed by the American Cancer
Society. According to Terri Prescott, director of the program, attracting and retaining volunteers
is an on-going struggle. This struggle is made more difficult by the background checks that
volunteers are required to undergo if they are to provide transportation to the public. Well-
meaning volunteers may feel that their privacy is being invaded if they must consent to a
criminal background check.
How constraint is being addressed at local level: Background checks are essential to
protecting the riding public and should be continued. Agencies who rely on volunteers can
educate their pool of volunteers as to the necessity of the checks. It is possible that the
background check serves as a “gateway” that will differentiate between those who will be good
and reliable volunteers from those that have only a superficial interest. If that is the case, this
“weeding out” will save funds in the long run as agencies are not wasting resources on people
who will not stick with the program.
Chapter 6: Barriers and Constraints to Coordination
Panhandle Transportation Coordination Study 6-31
Constraint 14: The role of private taxi companies to provide ADA paratransit service within
Amarillo is limited due to concerns with quality of service delivery and issues of trip
verification.
How constraint is obstructing regional coordinated service: The cost of a demand response
trip on Spec-Trans is approximately $31 per trip. If a private taxi can provide the trip for less
than $31, Spec-Trans may realize a cost savings if the taxi’s cost is less than Spec-Trans variable
cost. However, there is the perception that taxis are unreliable. This perception creates the fear
that the ACT will need to verify each trip that is assigned to a taxi. ACT currently does not have
the staff or the funds to provide verification. In addition to this, there is the perception that taxis
companies are prone to commit fraud – requesting payment for trips that were not delivered.
How is constraint being addressed at local level: At this time, taxis are not seen as a desirable
part to the solution for improved demand response service.

Chapter 6: Barriers and Constraints to Coordination
Panhandle Transportation Coordination Study 6-32
Constraint 15: Insurance (or lease agreement) prohibits the use of equipment for other than
original program purpose.
How constraint is obstructing regional coordinated service: Van pools utilize volunteer
drivers. It is difficult to attract volunteer drivers for van pools but the offer of incentives helps.
One incentive that could be offered is the limited use of the vehicle for non-work-related trips.
However, insurance companies that were contacted about providing van pool insurance required
that the trips be restricted to commute purposes.
How is constraint being addressed at local level: The Panhandle region is exploring the
feasibility of a bus pool that is operated through Panhandle Transit and uses professional drivers
(instead of a van pool that relies on volunteer drivers). This strategy addresses the above concern
and provides additional capacity for rural trips.

Chapter 6: Barriers and Constraints to Coordination
Panhandle Transportation Coordination Study 6-33
Constraint 16: Depending on the agency, drivers require different levels of certification.
How constraint is obstructing regional coordinated service: Drivers must receive the highest
level of certification across a coordinated system. This may result in a higher pay being
warranted. Agencies may not have the funds to increase driver pay. Drivers for Panhandle
Transit start at about $6.15 an hour. Drivers for ACT start at about $8.13 an hour. Both
agencies report that their operating budgets do not allow them to pay their drivers any more than
that; if fact, if they could pay them more, they would. Currently, both agencies are having a very
hard time finding and recruiting drivers, period. So, if drivers are more highly qualified – or if
become more qualified – these individuals may leave the agencies and seek higher paying jobs in
the private sector. Similarly, some drivers under one system may not qualify under another
system and could lose their jobs.
How constraint is being addressed at local level: This constraint is not being addressed at this
time.
Chapter 6: Barriers and Constraints to Coordination
Panhandle Transportation Coordination Study 6-34
Constraint 17: Participants of one program will not be willing to ride with those of another
program. For many riders, their bus trips are a big part of their social lives. They are reluctant to
see this change.
How constraint is obstructing regional coordinated service: It is likely that all people who
are in the business of providing help to others would tend to empathize quite a bit with their
clients. If so, they are reluctant to participate in what could be perceived as a decreased quality
of life for their clients. That is, changing a service that provides community and fun to one that
does not and these providers will be reluctant to participate in coordination projects.
How constraint is being addressed at local level: This issue is not being addressed at this
time.

Chapter 6: Barriers and Constraints to Coordination
Panhandle Transportation Coordination Study 6-35
Constraint 18: It is difficult to realize more service out of high-mileage vehicles that are
donated to nonprofits and health and human service agencies without an adequate maintenance
plan/maintenance facility to make the donation more attractive.
How constraint is obstructing regional coordinated service: One suggestion that was briefly
explored for the Panhandle was a program of extending the useful life of donated vehicles. Based
a model implemented in King County, Washington, vehicles are donated to agencies under an
agreement that the agency provide a certain number of STS-eligible trips during the contract
period. In exchange, their donated vehicle qualifies for free maintenance at the transit agency’s
facility. This idea was presented to ACT but deemed infeasible because ACT does not have the
maintenance capacity to serve any additional vehicles.
How is constraint being addressed at local level: This idea is not moving forward at this time
as ACT is not interested in expanding its maintenance operations.
Chapter 6: Barriers and Constraints to Coordination
Panhandle Transportation Coordination Study 6-36
Constraint 19: Lack of knowledge/involvement on state level regarding what is already being
done to coordinate locally creates the perception at the local level that mandates are needlessly
taking away resources that could support much needed operating funds.
How constraint is obstructing regional coordinated service: For a number of years, the
Panhandle has been coordinating transit issues with a number of groups, including:
• The Panhandle Transportation Consortium: a group of transit providers and agencies that
have worked on coordinated efforts in the past;
• The Senior Ambassadors Coalition – Transportation Task Force; and
• Advisory Commission for People with Disabilities.
The perception locally is not that there is a lack of coordination – it is already happening in many
circumstances where it is feasible – but rather that operating funds are being reduced at the same
time that the agencies are being asked to fulfill more of the demand through a coordinated
system.
How constraint is being addressed at local level: This issue is not being addressed at this time.

Chapter 7: Action Plans
Panhandle Transportation Coordination Study 7-1
Chapter 7: Action Plans
This section outlines the following actions plans that the RTAG voted to include in this study at
the September 7th meeting.1:
• Provide job-access service in the Childress region;
• Provide job-access service in the Hereford region;
• Provide increased travel training through Panhandle Independent Living Center;
• Provide same-day, non-emergency medical and other essential transportation to Spec-
Trans eligible riders using a voucher program;
• Institute a transit-coordination/mobility management position to sustain the development
of coordination efforts throughout the region;
• Support the implementation of flex routing by ACT; and
• Support the creation of an Independent Transportation Network by the Senior
Ambassadors Coalition.
For each action plan, the following information is provided: description of service, lead agency,
supporting/partnering agencies; estimates of resources needed and available, recommended
performance measures; and next steps. This background information is developed to assist lead
agencies in the preparation of project proposals requesting Job Access Reverse Commute
(JARC) or New Freedom (NF) funding.
In addition to the above, the following information must be prepared for each proposal:
• In order to be an eligible project for JARC funding, the proposal must: 1) contain goals
and objectives; 2) discuss rider origination location and employment; 3) describe how it
implements the regional service plan; 4) explain how the project will maximize use of
existing transportation service providers; 5) provide a cost estimate; and 6) identify match
sources including employer-provided or employer-assisted transportation service
strategies incorporated in the project. 1 At the October 23rd meeting, the RTAG voted to consolidate the Childress and Hereford job-access programs into a single proposal.
Chapter 7: Action Plans
Panhandle Transportation Coordination Study 7-2
• In order to be an eligible project for NF funding, the proposal must include a detailed
description of: 1) the project and the need for the project; 2) how the award of NF funds
will expand the availability of transportation services or provide new transportation
services for persons with disabilities; 3) how the project will promote the development
and maintenance of a network of transportation services for persons with disabilities; 4)
how the project will expand economic opportunities for individuals with disabilities; 5)
how the project will be integrated into other programs designed to serve similar
populations; and 6) improve the efficiency, effectiveness and safety of transportation
services for persons with disabilities.
Provide Job Access Service in Childress, Texas
Description of Service: Typical job access projects include extended service hours to serve
workers with non-typical shifts, van- or bus-pools, and ridesharing programs. Interest in
establishing a job-access project in Childress, Texas, has come from employers and local
government agencies. Employers who have expressed an interest in the project include: the
Texas Department of Criminal Justice T.L Roach Unit (TDCJ), Texas Department of
Transportation (TxDOT), the Childress Regional Hospital, and the new Super Wal-Mart. Local
government agencies include: the City of Childress City Manager’s office, Childress Economic
Development Corporation, and Childress County Judge’s Office.
Based on two workshops held in Childress, a preliminary decision was made to extend
Panhandle Transit hours of operation instead of creating a targeted bus-pool project. However, as
operation and cost information is developed, it should be measured against the alternative
approaches so that the most efficient approach is adopted and the most competitive funding
proposal is developed. Additionally, as the project moves forward, gaining employer support –
both financially and through promotion of the program – is very important to program success
and sustainability. To gain an understanding of the feasibility of a job-access project, a survey
was conducted with the city’s major employers. The findings from that survey follow.
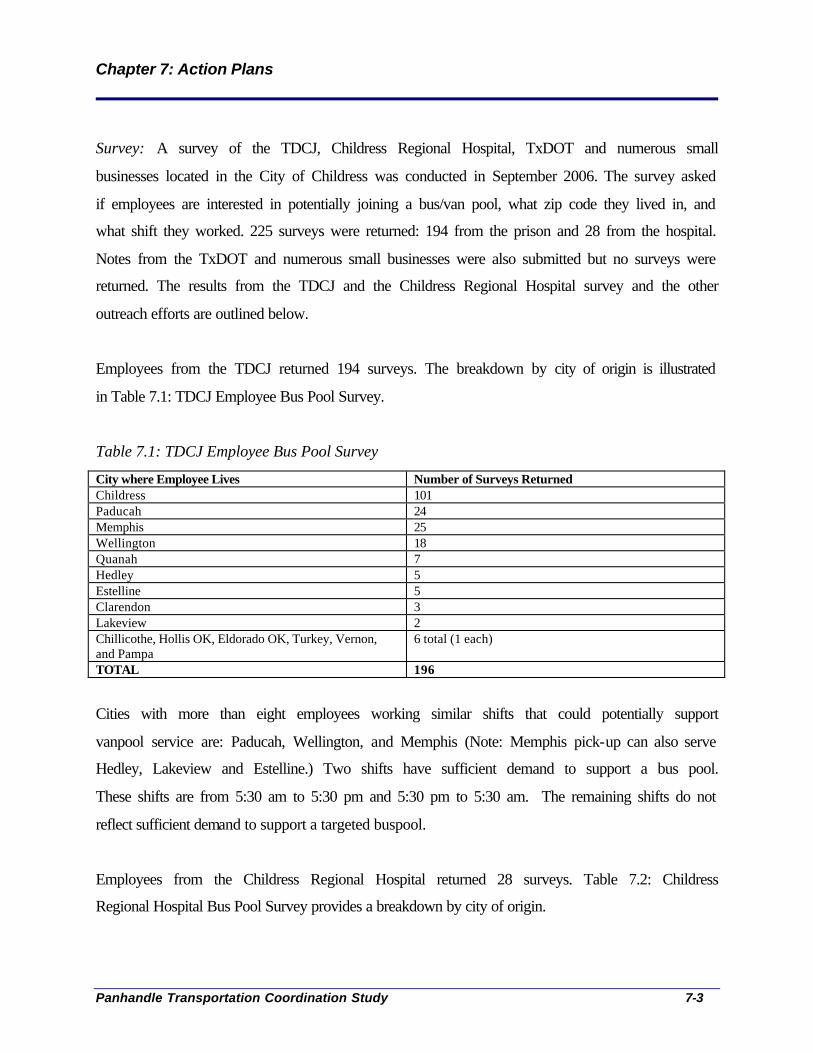
Chapter 7: Action Plans
Panhandle Transportation Coordination Study 7-3
Survey: A survey of the TDCJ, Childress Regional Hospital, TxDOT and numerous small
businesses located in the City of Childress was conducted in September 2006. The survey asked
if employees are interested in potentially joining a bus/van pool, what zip code they lived in, and
what shift they worked. 225 surveys were returned: 194 from the prison and 28 from the hospital.
Notes from the TxDOT and numerous small businesses were also submitted but no surveys were
returned. The results from the TDCJ and the Childress Regional Hospital survey and the other
outreach efforts are outlined below.
Employees from the TDCJ returned 194 surveys. The breakdown by city of origin is illustrated
in Table 7.1: TDCJ Employee Bus Pool Survey.
Table 7.1: TDCJ Employee Bus Pool Survey
City where Employee Lives Number of Surveys Returned Childress 101 Paducah 24 Memphis 25 Wellington 18 Quanah 7 Hedley 5 Estelline 5 Clarendon 3 Lakeview 2 Chillicothe, Hollis OK, Eldorado OK, Turkey, Vernon, and Pampa
6 total (1 each)
TOTAL 196
Cities with more than eight employees working similar shifts that could potentially support
vanpool service are: Paducah, Wellington, and Memphis (Note: Memphis pick-up can also serve
Hedley, Lakeview and Estelline.) Two shifts have sufficient demand to support a bus pool.
These shifts are from 5:30 am to 5:30 pm and 5:30 pm to 5:30 am. The remaining shifts do not
reflect sufficient demand to support a targeted buspool.
Employees from the Childress Regional Hospital returned 28 surveys. Table 7.2: Childress
Regional Hospital Bus Pool Survey provides a breakdown by city of origin.
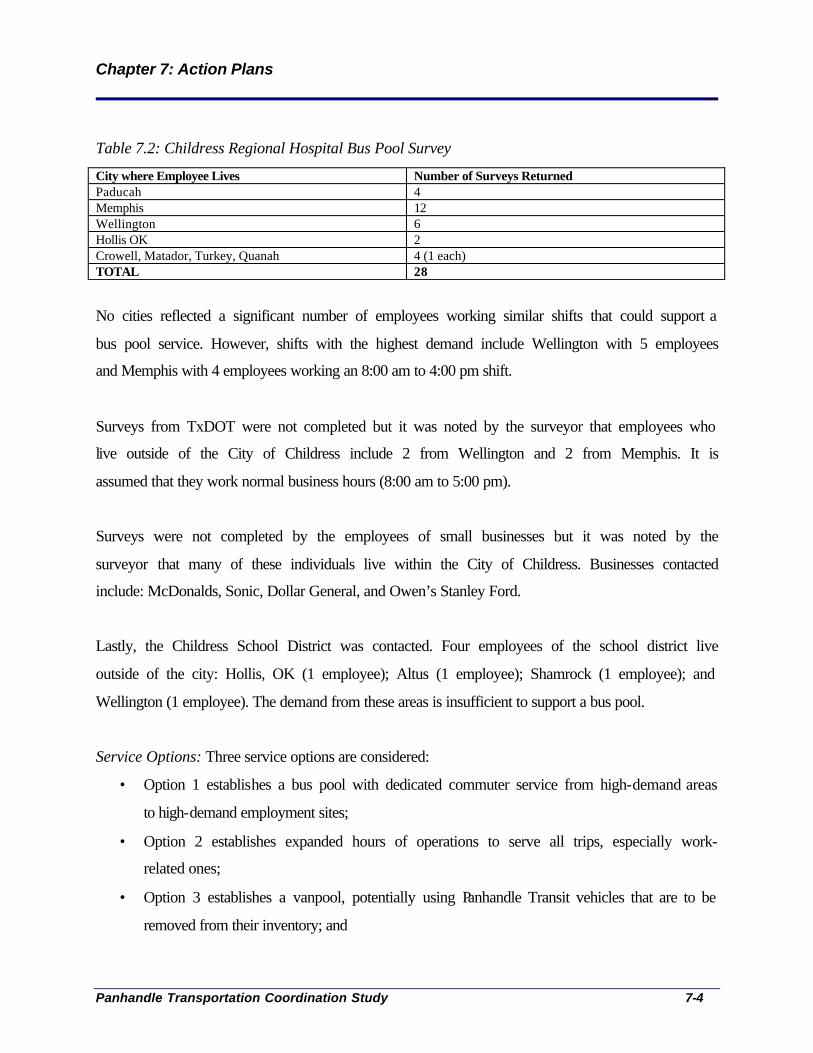
Chapter 7: Action Plans
Panhandle Transportation Coordination Study 7-4
Table 7.2: Childress Regional Hospital Bus Pool Survey
City where Employee Lives Number of Surveys Returned Paducah 4 Memphis 12 Wellington 6 Hollis OK 2 Crowell, Matador, Turkey, Quanah 4 (1 each) TOTAL 28
No cities reflected a significant number of employees working similar shifts that could support a
bus pool service. However, shifts with the highest demand include Wellington with 5 employees
and Memphis with 4 employees working an 8:00 am to 4:00 pm shift.
Surveys from TxDOT were not completed but it was noted by the surveyor that employees who
live outside of the City of Childress include 2 from Wellington and 2 from Memphis. It is
assumed that they work normal business hours (8:00 am to 5:00 pm).
Surveys were not completed by the employees of small businesses but it was noted by the
surveyor that many of these individuals live within the City of Childress. Businesses contacted
include: McDonalds, Sonic, Dollar General, and Owen’s Stanley Ford.
Lastly, the Childress School District was contacted. Four employees of the school district live
outside of the city: Hollis, OK (1 employee); Altus (1 employee); Shamrock (1 employee); and
Wellington (1 employee). The demand from these areas is insufficient to support a bus pool.
Service Options: Three service options are considered:
• Option 1 establishes a bus pool with dedicated commuter service from high-demand areas
to high-demand employment sites;
• Option 2 establishes expanded hours of operations to serve all trips, especially work-
related ones;
• Option 3 establishes a vanpool, potentially using Panhandle Transit vehicles that are to be
removed from their inventory; and

Chapter 7: Action Plans
Panhandle Transportation Coordination Study 7-5
• Option 4 establishes a ride-sharing program to support carpooling.
Option 1 establishes a bus pool with dedicated service from Paducah, Wellington, and Memphis
to the TDCJ. It will provide transportation for the largest shifts: from 5:30 am to 5:30 pm and
5:30 pm to 5:30 am and be designed as park-and-pool to eliminate lengthy pick-up times.
Cost: The estimated cost to provide this service is outlined in Table 7.3: Budget for Bus Pool
Service to Childress from Memphis, Paducah, and Wellington. It is assumed that the service can
be supplied using existing vehicle inventory thus no capital costs are reflected here. Assumptions
include: passengers will use the service three times a week, 48 weeks per year; fare is $2.00 one-
way; and service requires three vehicles. Under these assumptions, operating costs are estimated
to be $15.85 per trip for about 6,000 annual trips. The operating cost is $95,862 and the local
match for operating is estimated to be $41,833 annually.
Table 7.3: Budget for Bus Pool Service to Childress from Memphis, Paducah, and Wellington
Extended Hours of Service per vehicle (from 5 am to 8 am / 5 pm to 7 pm) 5 Number of Vehicles Needed to Provide Service 3 Annual Total Increase in Hours of Service (Service provided 5 days a week) 3,900 Cost per Operating Hour (average of FY2005) $24.58 Annual Total Operating Cost $95,862 Estimated Passengers per Vehicle 7 Estimated Total Number of Passengers 21 Estimated Number of One-Way Trips per Passenger per Year (3/week for 48 week) 288 Estimated Total One-Way Trips 6,048 Estimated Cost per Trip $15.85 Cost $95,862 Less Fares (assume a $2.00 one-way fare) $12,096 Net Operating Cost $83,766 Eligible for Federal Funding (50% of Net Operating Cost) $41,883 Local Share Required (50% of Net Operating Cost) $41,833
Option 1 advantages and disadvantages are outlined below:
• Advantages:

Chapter 7: Action Plans
Panhandle Transportation Coordination Study 7-6
o Dedicated service to work place will attract more riders through decreased travel
times;
o Dedicated service to work place may attract employer financial support;
o Fewer vehicles needed and therefore lower capital expense;
o Lower operating risk since it is a small, targeted project; and
o For those employees who work in shifts of insufficient numbers to justify a bus
pool and work during normal Panhandle Transit operating hours, Panhandle
Transit could promote their existing demand response service. This would
increase the utilization of the existing system without incurring additional costs.
• Disadvantages:
o Decreased ability to serve additional early morning or early evening trips.
Option 2 extends Panhandle Transit service hours from 5:00 am to 8:00 am and from 5:00 pm to
7:00 pm in order to serve all additional trips within the region. Service is promoted heavily to
provide work-related trips.
Cost: The estimated operating cost to provide this service is outlined in Table 7.4: Budget for
Extended Service Hours. It is assumed that the service can be supplied using existing vehicle
inventory thus no capital costs are reflected here. Assumptions include: job-access passengers
will use the service 3 times a week, 48 weeks per year; fare is $1.00 one-way for trips within
Childress and $3.00 for trips outside Childress.2 The service will require five additional vehicles.
Under these assumptions, operating costs are estimated to be $15.85 per trip for about 10,080
annual trips. The operating cost is $159,770 and the local match for operating is estimated to be
$69,805 annually.
2 Note: This is less than the fare that would be charged under the current fare structure; normally out of county trips are $1.00 and an additional .175 cents per mile. Assuming a one-way trip is 40 miles, the fare would come to $8.00 one-way. This cost is higher than the cost of driving a privately owned vehicle ($5.75 one-way). The fare for job-access clients ($3.00) must be less than regular fare ($8.00) or the service will not attract riders. One option includes issuing transit vouchers to job-access clients to cover the difference in fares.
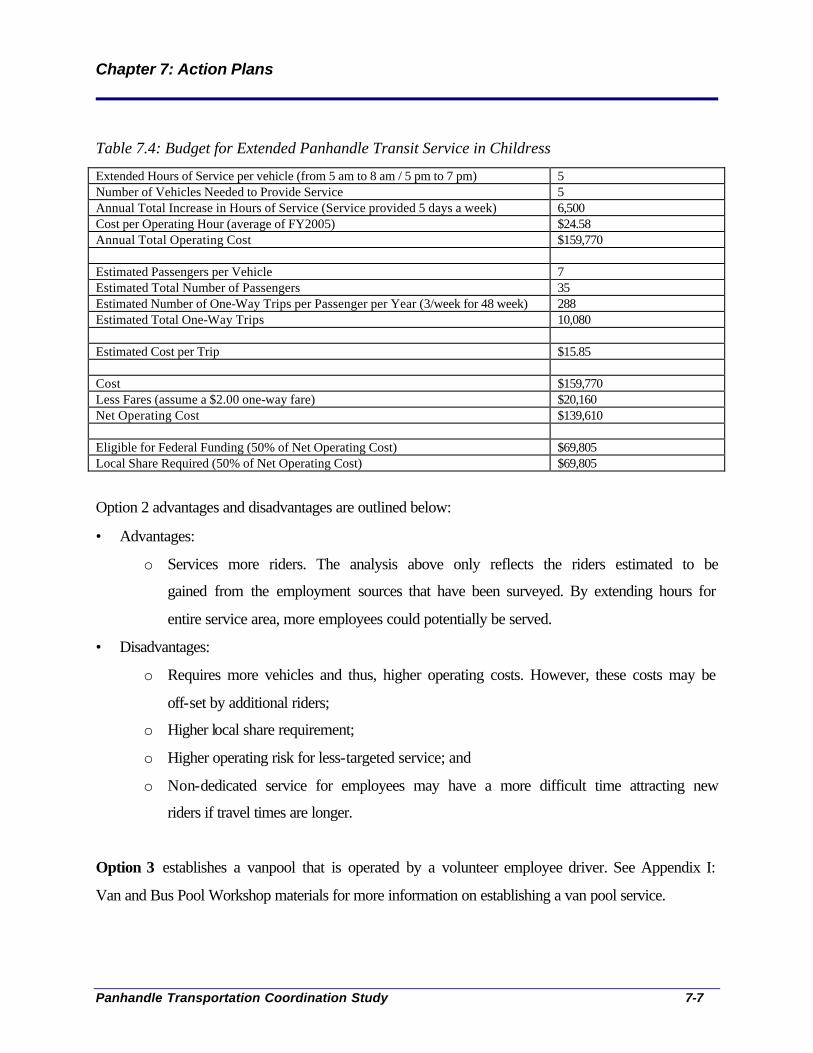
Chapter 7: Action Plans
Panhandle Transportation Coordination Study 7-7
Table 7.4: Budget for Extended Panhandle Transit Service in Childress
Extended Hours of Service per vehicle (from 5 am to 8 am / 5 pm to 7 pm) 5 Number of Vehicles Needed to Provide Service 5 Annual Total Increase in Hours of Service (Service provided 5 days a week) 6,500 Cost per Operating Hour (average of FY2005) $24.58 Annual Total Operating Cost $159,770 Estimated Passengers per Vehicle 7 Estimated Total Number of Passengers 35 Estimated Number of One-Way Trips per Passenger per Year (3/week for 48 week) 288 Estimated Total One-Way Trips 10,080 Estimated Cost per Trip $15.85 Cost $159,770 Less Fares (assume a $2.00 one-way fare) $20,160 Net Operating Cost $139,610 Eligible for Federal Funding (50% of Net Operating Cost) $69,805 Local Share Required (50% of Net Operating Cost) $69,805
Option 2 advantages and disadvantages are outlined below:
• Advantages:
o Services more riders. The analysis above only reflects the riders estimated to be
gained from the employment sources that have been surveyed. By extending hours for
entire service area, more employees could potentially be served.
• Disadvantages:
o Requires more vehicles and thus, higher operating costs. However, these costs may be
off-set by additional riders;
o Higher local share requirement;
o Higher operating risk for less-targeted service; and
o Non-dedicated service for employees may have a more difficult time attracting new
riders if travel times are longer.
Option 3 establishes a vanpool that is operated by a volunteer employee driver. See Appendix I:
Van and Bus Pool Workshop materials for more information on establishing a van pool service.
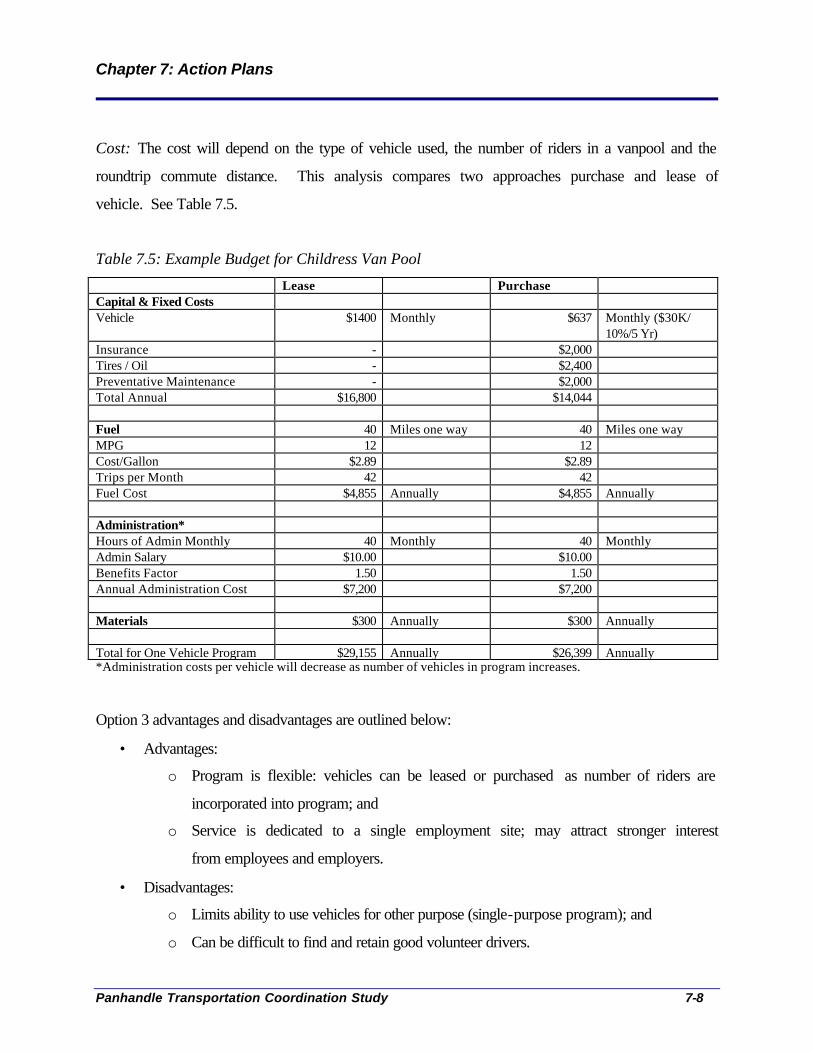
Chapter 7: Action Plans
Panhandle Transportation Coordination Study 7-8
Cost: The cost will depend on the type of vehicle used, the number of riders in a vanpool and the
roundtrip commute distance. This analysis compares two approaches purchase and lease of
vehicle. See Table 7.5.
Table 7.5: Example Budget for Childress Van Pool
Lease Purchase Capital & Fixed Costs Vehicle $1400 Monthly $637 Monthly ($30K/
10%/5 Yr) Insurance - $2,000 Tires / Oil - $2,400 Preventative Maintenance - $2,000 Total Annual $16,800 $14,044 Fuel 40 Miles one way 40 Miles one way MPG 12 12 Cost/Gallon $2.89 $2.89 Trips per Month 42 42 Fuel Cost $4,855 Annually $4,855 Annually Administration* Hours of Admin Monthly 40 Monthly 40 Monthly Admin Salary $10.00 $10.00 Benefits Factor 1.50 1.50 Annual Administration Cost $7,200 $7,200 Materials $300 Annually $300 Annually Total for One Vehicle Program $29,155 Annually $26,399 Annually *Administration costs per vehicle will decrease as number of vehicles in program increases.
Option 3 advantages and disadvantages are outlined below:
• Advantages:
o Program is flexible: vehicles can be leased or purchased as number of riders are
incorporated into program; and
o Service is dedicated to a single employment site; may attract stronger interest
from employees and employers.
• Disadvantages:
o Limits ability to use vehicles for other purpose (single-purpose program); and
o Can be difficult to find and retain good volunteer drivers.
Chapter 7: Action Plans
Panhandle Transportation Coordination Study 7-9
Option 4 establishes a ride-sharing database with an appropriate agency like Panhandle Transit
to support and encourage carpooling within the region. Employees could register for the service,
either requesting or offering a ride. The database would provide matching information based on
registered applicant’s criteria (origin, destination, shift, day, etc.) This is the simplest and lowest
cost option; however, it may be the least effective if it is not vigorously promoted among
employers and leading agency.
Lead Agency: Panhandle Transit
Supporting Agencies: City of Childress, Childress County, TDCJ, Childress Regional Hospital,
Childress Workforce Development Center, Childress Economic Development Corporation
Resources Needed: The project may be eligible for Job Access Reverse Commute (JARC)
funding. Organizations that can apply for JARC funding include: workforce development boards,
local governments, public transit agencies, private non-profit organizations, and state units of
government. The project will require a 50% local match for operating expenses. State funds are
eligible but a strong proposal will include support from private employers, workforce
development, etc.
Resources Available: Panhandle Transit has the organizational infrastructure that can house the
program and may apply its available state funds as local match to support the project.
Performance Measures/Performance Standards:
• Service Utilization: Number of passengers per vehicle per trip
• Cost Efficiency: Cost per Vehicle Trip
• Cost Effectiveness: Number of passenger per cost of vehicle trip
• Economic Impact: Number of low-income individuals served
• Economic Impact: Number of jobs created/supported by transit
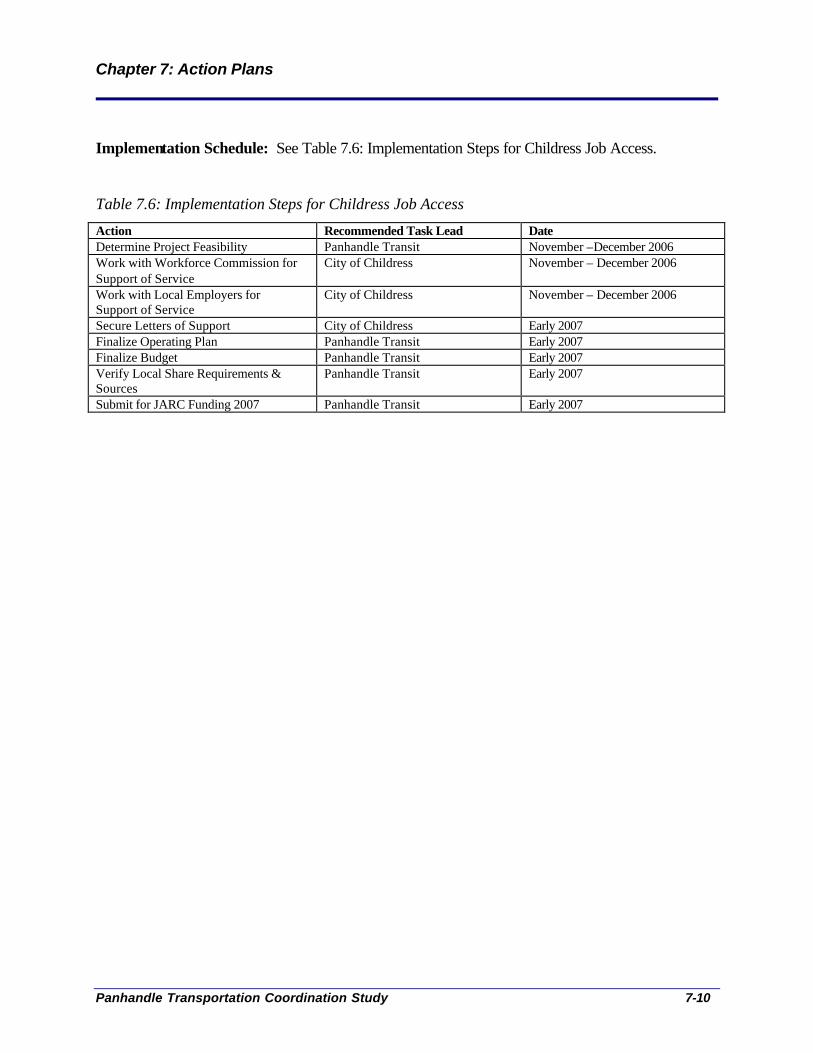
Chapter 7: Action Plans
Panhandle Transportation Coordination Study 7-10
Implementation Schedule: See Table 7.6: Implementation Steps for Childress Job Access.
Table 7.6: Implementation Steps for Childress Job Access
Action Recommended Task Lead Date Determine Project Feasibility Panhandle Transit November –December 2006 Work with Workforce Commission for Support of Service
City of Childress November – December 2006
Work with Local Employers for Support of Service
City of Childress November – December 2006
Secure Letters of Support City of Childress Early 2007 Finalize Operating Plan Panhandle Transit Early 2007 Finalize Budget Panhandle Transit Early 2007 Verify Local Share Requirements & Sources
Panhandle Transit Early 2007
Submit for JARC Funding 2007 Panhandle Transit Early 2007
Chapter 7: Action Plans
Panhandle Transportation Coordination Study 7-11
Provide Job Access Service in Hereford, Texas
Description of Service: Panhandle Transit will establish more regular service in Hereford,
Texas. Two vehicles will provide service from 6:30 am to 6:30 pm (these hours are extended
from regular Panhandle Transit hours 8:00 am to 5:00 pm) in order to serve more early-hour and
early-evening work trips. The service will provide general public transportation and is intended
to more effectively provide job-training/job-searching trips for clients of the Hereford Workforce
Development office than that agency’s current gas-voucher program. Panhandle Transit will
continue to provide its demand-response service within Hereford. In the second phase of the
service, Panhandle Transit will extend its service to include job-access trips to outlying
employment centers, such as Cargill.
Lead Agency: Panhandle Transit
Supporting Agencies: City of Hereford, Hereford Workforce Commission
Cost: Panhandle Transit operating cost per revenue hour is approximately $24.58 (average of
FY05 operating statistics). Assuming two vehicles provide service from 6:30 am to 6:30 pm,
and that the service is provided Monday through Friday (260 days per year), the estimated cost
of providing the fixed route service is approximately $153,379. Net operating cost after 6 percent
fare box recovery is $144,176. It is assumed that sufficient vehicles are available in the area to
provide service and that there are no additional capital costs for vehicles.
Resources Needed: This project may qualify for JARC funding to support the transportation
needs of qualified low-income individuals or those seeking employment. Federal funding is
eligible to cover 50 percent of operating costs, or $72,088. Local share is required to cover the
remaining $72,088.
Chapter 7: Action Plans
Panhandle Transportation Coordination Study 7-12
Resources Available: It is assumed that Panhandle Transit has vehicles to commit to service.
Panhandle Transit may also have local match available through its state funds to support its
application for JARC funding. Additional financial support may be provided by the Hereford
Workforce Development, which currently issues gas vouchers to its clients for travel associated
with training and job search. Last year, gas vouchers worth $7,500 were issued in Hereford and
may convert some of these funds into bus passes.
Expected Outcomes/Performance Measures:
System performance should be measured using standard transit performance measurements,
including:
• Service Utilization: Number of passengers per vehicle per trip
• Cost Efficiency: Cost per Vehicle Trip
• Cost Effectiveness: Number of passenger per cost of vehicle trip
• Economic Impact: Number of low-income individuals served by service
• Economic Impact: Number of jobs created/supported by transit
The pilot project will also test whether the establishment of a fixed route service in a small urban
area (population of 14,500) is a more cost-effective method to serve job-access and training
needs than the gas voucher program. The efficiency/effectiveness of the fixed route should also
be measured against the efficiency/effectiveness of demand response service. That is, is a fixed
route more effective than demand response service to serve job-access transportation needs for
small urban areas?
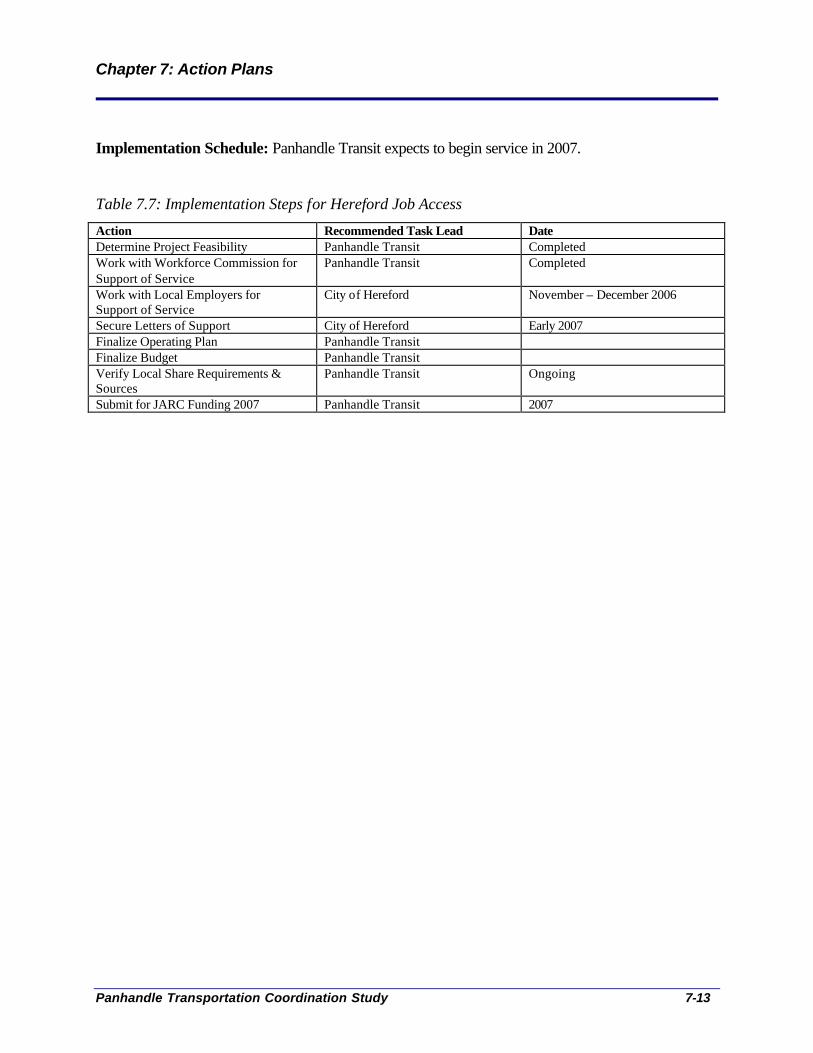
Chapter 7: Action Plans
Panhandle Transportation Coordination Study 7-13
Implementation Schedule: Panhandle Transit expects to begin service in 2007.
Table 7.7: Implementation Steps for Hereford Job Access
Action Recommended Task Lead Date Determine Project Feasibility Panhandle Transit Completed Work with Workforce Commission for Support of Service
Panhandle Transit Completed
Work with Local Employers for Support of Service
City of Hereford November – December 2006
Secure Letters of Support City of Hereford Early 2007 Finalize Operating Plan Panhandle Transit Finalize Budget Panhandle Transit Verify Local Share Requirements & Sources
Panhandle Transit Ongoing
Submit for JARC Funding 2007 Panhandle Transit 2007
Chapter 7: Action Plans
Panhandle Transportation Coordination Study 7-14
Increase Travel Training Available through Panhandle Independent Living Center
Description of Service: This project will increase capacity to deliver one-on-one travel training
through the Panhandle Independent Living Center and general/informational training through
other human service agencies. One objective of the project is to increase the use of ACT fixed
route service / decrease use of Spec-Trans. Another objective is to prepare the clients of various
human services agencies for the potential implementation of flex routing by ACT.
Agencies that currently provide travel training include:
• PILC: It provides one-on-one training. At a minimum, each individual receives about 12
hours of training divided into three sessions of 4 hours each. Each training session begins
at the person’s home and involves an actual trip on the bus and then a return trip home.
Personnel cost to provide service is estimated at $216 per client.
• Goodwill provides general/informational training and assists clients to read schedules and
routes, etc. Each client participates in about three, 45-minute sessions. The cost to
provide the training is $42 per client.
• Texas Panhandle Mental Health Mental Retardation: TPMHMR provides travel training
as a part of their holistic approach to life skills teaching. It was reported that it would be
difficult to pull-out and segregate travel training from other life skills and that it would be
difficult to coordinate its travel training with other agencies.
• Amarillo City Transit provides general/informational training through group
presentations. They have made presentations to Craig Methodist, the Bivens Center, other
senior centers, human service agencies, etc., amenities of the system, instructions on how
to use the system, etc.
Lead Agency: Panhandle Independent Living Center
Supporting Agencies: Amarillo City Transit, Goodwill Industries
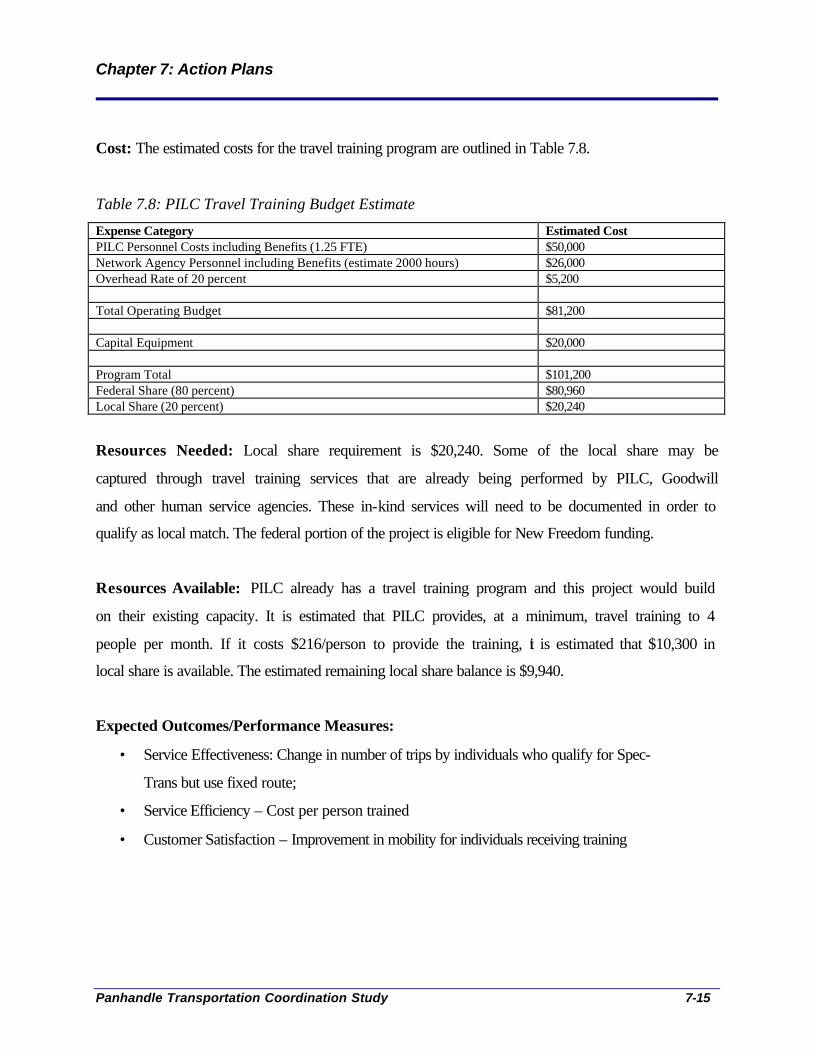
Chapter 7: Action Plans
Panhandle Transportation Coordination Study 7-15
Cost: The estimated costs for the travel training program are outlined in Table 7.8.
Table 7.8: PILC Travel Training Budget Estimate
Expense Category Estimated Cost PILC Personnel Costs including Benefits (1.25 FTE) $50,000 Network Agency Personnel including Benefits (estimate 2000 hours) $26,000 Overhead Rate of 20 percent $5,200 Total Operating Budget $81,200 Capital Equipment $20,000 Program Total $101,200 Federal Share (80 percent) $80,960 Local Share (20 percent) $20,240
Resources Needed: Local share requirement is $20,240. Some of the local share may be
captured through travel training services that are already being performed by PILC, Goodwill
and other human service agencies. These in-kind services will need to be documented in order to
qualify as local match. The federal portion of the project is eligible for New Freedom funding.
Resources Available: PILC already has a travel training program and this project would build
on their existing capacity. It is estimated that PILC provides, at a minimum, travel training to 4
people per month. If it costs $216/person to provide the training, it is estimated that $10,300 in
local share is available. The estimated remaining local share balance is $9,940.
Expected Outcomes/Performance Measures:
• Service Effectiveness: Change in number of trips by individuals who qualify for Spec-
Trans but use fixed route;
• Service Efficiency – Cost per person trained
• Customer Satisfaction – Improvement in mobility for individuals receiving training
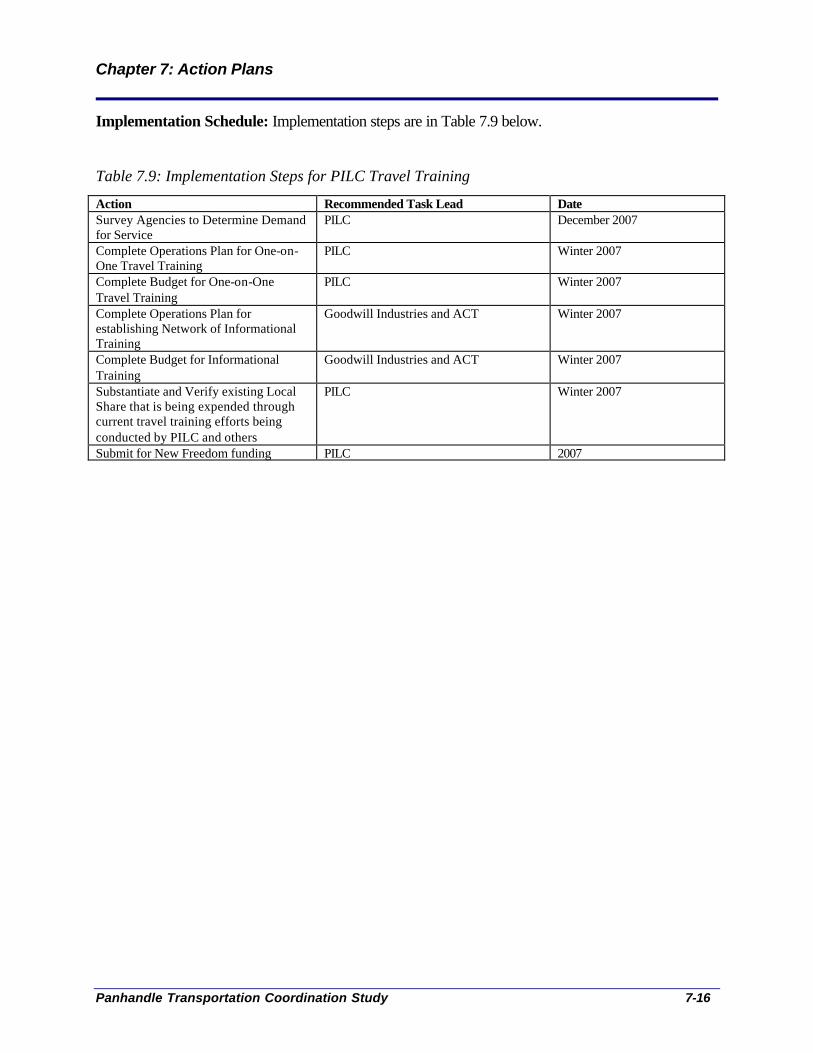
Chapter 7: Action Plans
Panhandle Transportation Coordination Study 7-16
Implementation Schedule: Implementation steps are in Table 7.9 below.
Table 7.9: Implementation Steps for PILC Travel Training
Action Recommended Task Lead Date Survey Agencies to Determine Demand for Service
PILC December 2007
Complete Operations Plan for One-on-One Travel Training
PILC Winter 2007
Complete Budget for One-on-One Travel Training
PILC Winter 2007
Complete Operations Plan for establishing Network of Informational Training
Goodwill Industries and ACT Winter 2007
Complete Budget for Informational Training
Goodwill Industries and ACT Winter 2007
Substantiate and Verify existing Local Share that is being expended through current travel training efforts being conducted by PILC and others
PILC Winter 2007
Submit for New Freedom funding PILC 2007
Chapter 7: Action Plans
Panhandle Transportation Coordination Study 7-17
Institute Voucher Program to Provide Same-Day Service for Medical and Other
Essential Trips
Description of Service: This project would provide eligible clients access to non-emergency
medical and other “essential” trips through a voucher program. The purpose of the program is to
provide reasonably priced service during times when public transportation is not available or to
destinations not served (e.g. Amarillo International Airport). Trips may be provided by taxi
service, private non-emergency medical transportation, nonprofit organization, or public
transportation provider. Same-day service for medical and other essential trips was a need that
was cited in both stakeholder and public meetings. Currently, there is no capacity within Spec-
Trans to service same-day trip requests.
The following discussion outlines service details to be considered when implementing a voucher
program.
• Administration of Program: Administration of the program may include the design and
implementation of the service; preparing periodic funding and performance reports for
funding and partnering agencies; marketing of the program; providing support to
participating agencies; contract oversight including monitoring of service quality and
reconciliation of invoices.
• Eligibility Requirements: The program will need to define who is eligible to receive
services. Eligibility guidelines may restrict/allow service based on: 1) age of individual;
2) presence of a disability; 3) low-income status; 4) client of a participating agency; and
5) place of residence. Sources of funding, participating agencies, and extent of need may
influence final eligibility criteria.
• Enrollment Procedures: Typically, clients may enroll in the program through any
participating agency using standardized paperwork developed by the lead agency.
Enrollment can be restricted, at a minimum, to the eligibility requirements established by
the lead agency but participating agencies may choose to be more restrictive. Enrollment
Chapter 7: Action Plans
Panhandle Transportation Coordination Study 7-18
may be either a paper-based system or a web-based system. The advantage of a web-
based system is that it may streamline data collection and reporting.
• Contracting with service providers: Service cost, performance expectations, and
presence/absence of contract incentives or penalties, and procedures and policies
regarding missed trips or fraudulent trips will need to be considered. Reporting and
reimbursement procedures will need to be defined.
• Scheduling Procedures: Since this project is not attempting to share rides among human
service agencies (i.e. a TPMHMR van will also provide a trip to another agency client)
scheduling of rides is relatively straightforward. Riders will call the service providers
under contract for a trip. Minimum notification requirements should be established with
providers during the contract negotiation. In future stages, the feasibility of expanding the
voucher program to include transportation provided by health and human service
agencies (i.e. ridesharing) may be considered.
• Fares: Fares may be flat-fee or based on mileage. Agencies may choose to subsidize the
whole cost of a voucher or require client participation.
• Service Description: Definition of type of service provided may include: 1) curb-to-
curb/door-to-door/ or door-through-door; 2) no-show policy; 3) restriction of program to
only those who can be safely transported and not in need of ambulance service; 4)
complaint procedure; and 5) policy on acceptance of gratuities.
• Restrictions: Service restrictions will need to be defined. For example, will clients be
allowed to take attendants or other passengers if there is a single destination? Will there
be limitations on the number of packages or size of packages allowed?
Lead Agency: Senior Ambassadors Coalition
Supporting Agencies: Partnering organizations may include health and human service agencies
serving seniors, people with disabilities, and low-income populations. Examples include agency
members of the Senior Ambassador’s Coalition, HSHC, and the Panhandle Independent Living
Center. Other potential partners may include healthcare providers such as Northwest Texas
Chapter 7: Action Plans
Panhandle Transportation Coordination Study 7-19
Healthcare or BSA Hospital (if the program can produce a cost-savings through decreased
ambulance trips or use of emergency facilities.)
Budget: To be determined by the local match available to leverage federal funds. Typically,
administration costs should be approximately 15 to 20 percent of the cost of program.
Resources Needed: Because a voucher program is easily scaled, the federal resources sought
may be based on local funds available to leverage.
Resources Available: Local share of partnering agencies will need to be identified and verified;
for example, transportation funds of SAC agencies may be available. Additionally, the funds that
are expended for the emergency-room voucher program may be leveraged if this service is
incorporated into the program. A voucher program is an eligible use of Section 5310 funds and
may be used to support program in future years. Estimates of 5310 allocations are: FY07
$156,713; FY08 $171,770; and FY09 $181,556.3
Expected Outcomes/Performance Measures:
• Cost Efficiency: Cost per Vehicle Trip; Cost per passenger mile
• Cost Effectiveness: Passenger miles per trip
• Fare box Recover Ratio
3 Historically, Section 5310 funding in Amarillo has been restricted to capital expenses and preventative maintenance. However, FTA does not restrict funding to these uses and the purchase of transportation services under contract is an eligible use of Section 5310 funds. At one time, Amarillo used its apportionment to pay for services through Jan Werner Transportation.
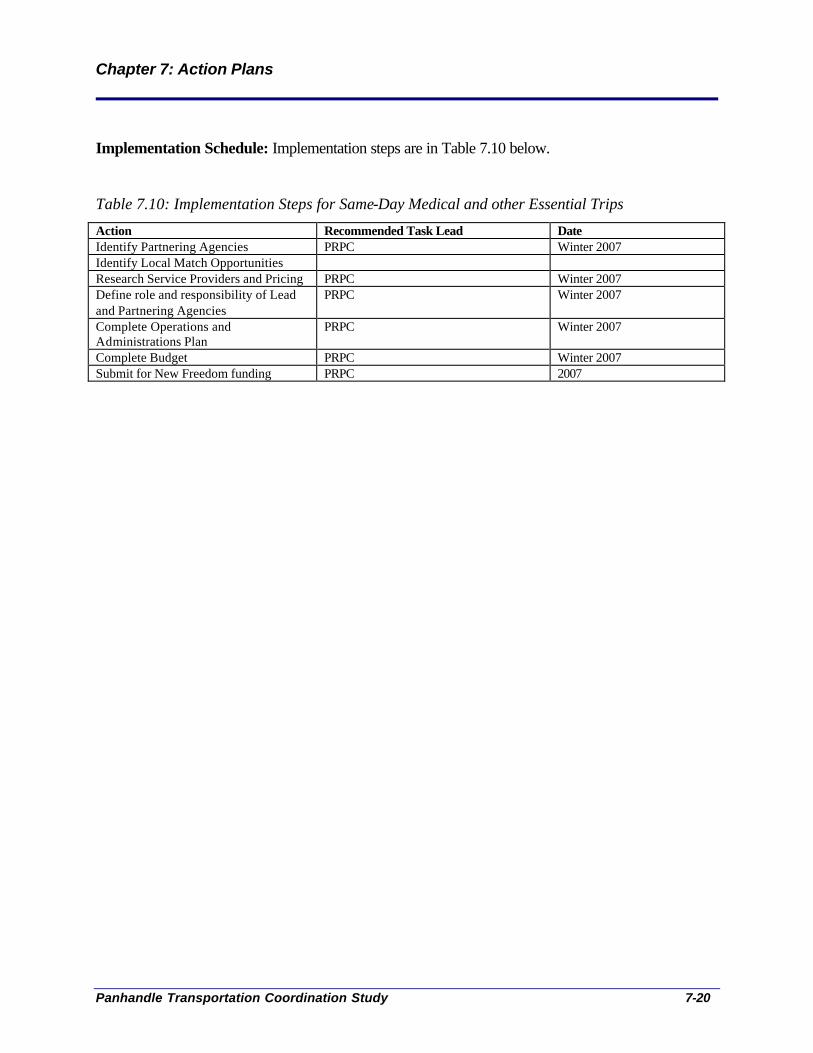
Chapter 7: Action Plans
Panhandle Transportation Coordination Study 7-20
Implementation Schedule: Implementation steps are in Table 7.10 below.
Table 7.10: Implementation Steps for Same-Day Medical and other Essential Trips
Action Recommended Task Lead Date Identify Partnering Agencies PRPC Winter 2007 Identify Local Match Opportunities Research Service Providers and Pricing PRPC Winter 2007 Define role and responsibility of Lead and Partnering Agencies
PRPC Winter 2007
Complete Operations and Administrations Plan
PRPC Winter 2007
Complete Budget PRPC Winter 2007 Submit for New Freedom funding PRPC 2007
Chapter 7: Action Plans
Panhandle Transportation Coordination Study 7-21
Transportation Coordination / Mobility Management
Description of Service: The Panhandle Transportation Coordination / Mobility Management
position will further the work begun with the Panhandle Transportation Coordination Study. The
program will continue to work with regional stakeholders to: 1) identify new opportunities to
coordinate resources and programs to expand the transportation options available in the City of
Amarillo and the Panhandle region. (This function will be very critical should ACT lose its
federal funding in 2010); 2) provide planning support to agencies leading transportation
coordination pilot projects, including identification of local match opportunities and performance
reporting; 3) market and promote transportation options; 4) provide assistance to community- or
volunteer-based transportation programs; 5) provide planning support to incorporate city- or
region-wide technological improvements that support future coordination efforts – for example,
shared billing, multi-provider trip reservation system for ride sharing, and one-stop
clearinghouse for transportation information and end-consumer trip planning; and 6) provide
input during land-use development process to ensure that patterns support efficient and effective
transportation.
Lead Agency: Panhandle Regional Planning Commission (The PRPC serves as an umbrella
group for the Panhandle Area Agency on Aging and Workforce Development Centers.)
Supporting Agencies: Amarillo City Transit, Panhandle Transit
Budget: $90,000 (including benefits and overhead)
Resources Needed: To the extent the position improves and extends transportation options for
ADA-eligible individuals, the program may be supported with NF funds. Typically, planning
activities are eligible for funding at an 80 percent level.
Resources Available: The PRPC has the organizational structure to support the position.
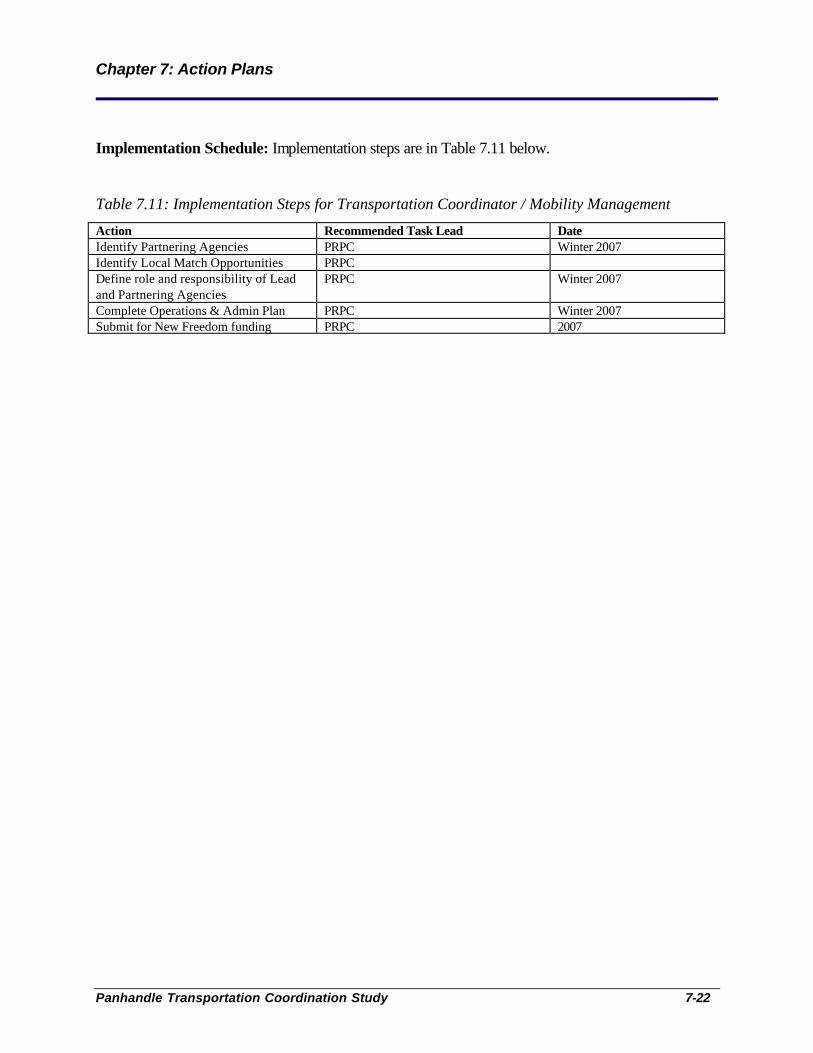
Chapter 7: Action Plans
Panhandle Transportation Coordination Study 7-22
Implementation Schedule: Implementation steps are in Table 7.11 below.
Table 7.11: Implementation Steps for Transportation Coordinator / Mobility Management
Action Recommended Task Lead Date Identify Partnering Agencies PRPC Winter 2007 Identify Local Match Opportunities PRPC Define role and responsibility of Lead and Partnering Agencies
PRPC Winter 2007
Complete Operations & Admin Plan PRPC Winter 2007 Submit for New Freedom funding PRPC 2007
Chapter 7: Action Plans
Panhandle Transportation Coordination Study 7-23
Support Flex Routing in Amarillo, Texas
Description of Service: ACT system expects to lose $272,824 in state funding between FY2004
and FY2010. State funding in FY2004 was $672,980. By FY2007, this has decreased to
$545,114 for a total of loss of $127,866. ACT expects to lose an additional $144,958 when fund
levels decrease from $545,114 to $400,156 by FY2010. The net result is a total loss of $272,824.
To prepare for these losses, ACT is investigating flex routing as a more sustainable system given
the new financial constraints. If flex routing is adopted, the objective will be to operate a single
service that can deviate off route if needed and to eliminate the need for and the cost of a
complementary para-transit system. Looking ahead, ACT may lose federal funding as well if its
population exceeds 200,000 as determined by the 2010 census. Should this occur, the continued
viability of ACT as a whole is in jeopardy if no new sources of funding are developed.
As ACT continues to plan its course, it is critical that health and human service agencies
embrace the changes that may occur in the near future and plan accordingly themselves. This 3
to 5 year planning is critical to ensuring that transportation services to their clients are available
should ACT lose federal funding. Strategies that health and human service agencies may
consider include: ridesharing, joint-purchase of private-sector transportation; establishment of
volunteer-based community services, and facilitation of carpooling.
Two projects that are included in this plan are intended to support the move to flex routing and to
prepare for future changes to ACT if federal funding is lost. These projects are: 1) increased
travel training through PILC; and 2) the establishment of a transportation / coordination position
in the PRPC.
Lead Agency: ACT
Supporting Agencies: To date, ACT has met with the following agencies to educate and inform
them of the challenges ACT is facing and the potential changes:

Chapter 7: Action Plans
Panhandle Transportation Coordination Study 7-24
• DARS – Division of Blind Services
• DARS – Division of Rehab Services
• TPMHMR
• Panhandle Independent Living Center
• Tyler Street Resource Center (ADVO)
• Dialysis Centers
• MS Society
• Area Agency on Aging
• Baptist Saint Anthony
• Northwest Texas Hospital, Patient and Family Services
• Amarillo Independent School District, Job Coaches and Placement Counselors
Resources Needed: A flex route study is needed to develop operations plans and resources.
Resources Available: ACT has already purchased the Trapeze software to institute flex routing.
Implementation Schedule: ACT may institute a flex route study in 2007.
Chapter 7: Action Plans
Panhandle Transportation Coordination Study 7-25
Support Creation of an Independent Transit Network
Description of Service: An Independent Transportation Network (ITN) is a replicable nonprofit
model that began in Portland, Maine. In return for donating their car to the ITN, seniors receive a
number of rides, based on the value of the vehicle. The Senior Ambassadors Coalition has a
long-term interest in potential development of an ITN in Amarillo because:
• Many seniors may be reluctant to ask for favors or receive what they would consider
charity. The ITN program is based upon a “fair” exchange of goods for services.
• The program is designed to be economically sustainable supported through user fees and
the ability of volunteers to “bank” trips for later use; and
• The nonprofit would be able to provide a higher level of assistance – assistance with
packages, for instance - that many seniors want.
Each ITN is an independent 501c (3) nonprofit corporation and will have the following service
characteristics:
• Uses private automobiles to provide rides 24 hours a day, 7 days a week;
• Available for any purpose, without restriction to all ITN members;
• Sustainable through fares from those who use the service and voluntary local community
support, without the use of taxpayer dollars;
• Connected to and served by ITNRides!™ information system technology;
• Serves seniors 65 years of age or older and people with visual impairments of any age.
Lead Agency: Senior Ambassadors Coalition (SAC)
Supporting Agencies: Members of the SAC include Jan Werner Adult Day Care, Baptist Saint
Anthony Hospital, Silver Hair Legislature, private nursing facilities, West Texas A&M
University School of Nursing, Alzheimer Association
Chapter 7: Action Plans
Panhandle Transportation Coordination Study 7-26
Expected Outcomes/Performance Measures: Expected Outcomes/Performance Measures:
System performance measurements for the ITN may be unique; however typical transportation
related measures that may be important include
• Cost Efficiency: Cost per Vehicle Trip or Passenger Trip
• Service Impact: Number of persons served
• Economic Impact: Number of low-income individuals served
• Customer Satisfaction
Implementation Schedule: Due to the high cost of implementation, the SAC is considering the
ITN as a future strategy that will be developed in the long-term; consequently, there is no short-
term implementation schedule.
Chapter 8: Action Plan Evaluation
Panhandle Transportation Coordination Study 8- 1
Chapter 8: Action Plan Evaluation
As noted in Chapter 5: Strategies, JARC and NF awards are competitive. An objective approach
to selecting and evaluating potential action plans/pilot projects will ensure that the best projects
for the region are chosen. The best projects will address the goals adopted by the RTAG1,
coordinate resources, meet demonstrated transit needs and demands, have support from key
players, be realistically achievable given available resources and potential resources, and project
a balance across the region. In the following section, each project will be briefly reviewed in
respect to these criteria.
JARC-Eligible Projects
Job Access in Childress, Texas
Criteria 1: Does project meet the goals adopted by RTAG?
1. To Improve Existing Delivery of Service: Yes – By extending hours of service, new
riders would be served.
2. To Generate Efficiencies in Operations: Yes – A project designed to utilize existing
vehicles to serve high-productivity commuter trips will improve efficiency. If the project
requires new vehicles, the project will be less competitive and it will be a more difficult
to obtain JARC funding.
3. To Enhance Customer Satisfaction: Yes – A survey conducted with employers indicates
that there is a high interest in the service.
4. To Encourage Cooperation and Coordination: The project does not directly address this
goal. However, it will involve the cooperation of Panhandle Transit, City of Childress,
Childress Regional Hospital, the Childress Prison, and Workforce Development.
1 The goals adopted by the RTAG are the same goals reflected in H.B. 3588: 1) improve existing delivery of service; 2) generate efficiencies in operations; 3) enhance customer satisfaction; and 4) encourage cooperation and coordination.

Chapter 8: Action Plan Evaluation
Panhandle Transportation Coordination Study 8- 2
Criteria 2: Does the project coordinate resources? Possibly – A project that can be executed
using existing Panhandle Transit vehicles will be a stronger project than one that would require
new vehicles. Furthermore, the participation of Childress Workforce Development (CWD) has
yet to be secured. It is estimated the CWD spends about $5,200 annually in gas vouchers. The
commitment of some these funds to a transit program would create a stronger, more competitive
project. Lastly, it is recommended that the lead agency work with area employers to gain their
financial support for the program.2
Criteria 3: Does the project meet identified needs? Yes – Job access was the second highest need
that was indicated on the Panhandle Transportation Coordination Survey.
Criteria 4: Does the project have support and is it realistically achievable? Yes – The project has
strong support for the City of Childress, Childress Economic Development Corporation,
Panhandle Transit, Childress Prison, and Childress Regional Hospital. Other large employers,
including Wal-Mart, have expressed their support for the project as well but have yet to commit
financially.
Criteria 5: Is the project ready to move forward? Yes – Critical tasks to be completed include
operations and financial planning and securing of employer support.
Job Access in Hereford, Texas
Criteria 1: Does project meet the goals adopted by RTAG?
1. To Improve Existing Delivery of Service: Yes – By extending hours of service, new
riders would be served.
2. To Generate Efficiencies in Operations: Unknown – The project will test the
effectiveness of fixed route over demand response in a very small urban setting (less than
15,000). Typically, industry standards recommend a minimum of 4 households per acre
2One source of information for employers regarding tax-free commuter benefits for their employees can be found at http://www.commuterchoice.com/
Chapter 8: Action Plan Evaluation
Panhandle Transportation Coordination Study 8- 3
to support a minimum level of local, fixed route bus service. Hereford is substantially less
dense with approximately 1.35 households per acre.
3. To Enhance Customer Satisfaction: Yes – a fixed route will allow riders greater
flexibility because they will no longer need to schedule a trip for in-town service.
4. To Encourage Cooperation and Coordination: The project does not directly address this
goal. However, it will involve the cooperation of Panhandle Transit, City of Hereford,
local employers, and the Hereford Workforce Development office.
Criteria 2: Does the project coordinate resources? Yes – The Hereford Workforce Development
office is a strong supporter of the project and has indicated that it is willing to commit some of
its estimated $7,500 in gas voucher funds for support.
Criteria 3: Does the project meet identified needs? Yes – Job access was the second highest need
that was indicated on the Panhandle Transportation Coordination Survey.
Criteria 4: Does the project have support and is it realistically achievable? Yes – The project has
strong support for the City of Hereford, Panhandle Transit, Hereford Workforce Development,
and local employers.
Criteria 5: Is the project ready to move forward? Yes – Planning continues for fixed route and
complementary paratransit operations.
NF-Eligible Projects
Travel Training through the Panhandle Independent Living Center
Criteria 1: Does project meet the goals adopted by RTAG?
1. To Improve Existing Delivery of Service: Yes – The project will build on the existing
capacity of the PILC’s travel training program.

Chapter 8: Action Plan Evaluation
Panhandle Transportation Coordination Study 8- 4
2. To Generate Efficiencies in Operations: Yes – The project will encourage higher use of
ACT’s more cost-effective fixed-route system over the more costly ADA paratransit
system.
3. To Enhance Customer Satisfaction: Unknown – The need for travel training has been
expressed most strongly at the agency level in anticipation of flex routing in the future
and the dissolution of the traditional fixed route / complementary paratransit service.
Should flex routing be instituted, it is anticipated that there will be significant demand by
customers for travel training on the new system.
4. To Encourage Cooperation and Coordination: The project does not directly address this
goal. However, it will involve the cooperation of ACT, PILC, Goodwill Industries,
TPMHMR, and all other agencies whose clients currently depend on Spec-Trans service.
Criteria 2: Does the project coordinate resources? Yes – It coordinates the existing travel
training capacity of PILC, Goodwill, and ACT.
Criteria 3: Does the project meet identified needs? Yes – As mentioned previously, travel
training will become critical regardless if flex routing is instituted because of the need to lower
Spec-Trans demand and costs.
Criteria 4: Does the project have support and is it realistically achievable? Yes – PILC has been
identified as the lead agency and ACT and Goodwill are in support.
Criteria 5: Is the project ready to move forward? Yes – Critical tasks to be completed include
identification and verification of local share. It is estimated that PILC may spend about $10,300
annually in its provision of travel training. These expenses are eligible as local share. Other local
share opportunities include health and human service agencies that provide travel training as
well.

Chapter 8: Action Plan Evaluation
Panhandle Transportation Coordination Study 8- 5
Voucher Project for Same-Day Medical and Essential Needs Trips
Criteria 1: Does project meet the goals adopted by RTAG?
1. To Improve Existing Delivery of Service: Yes – The project will would provide essential
trips at times and to destinations not currently served by ACT.
2. To Generate Efficiencies in Operations: Unknown – Providers may contract with non-
emergency medical transportation provider LeFleur or private taxi companies.
3. To Enhance Customer Satisfaction: Yes – The project was supported by a majority of
attendees at the Amarillo Workshop on August 31. Increased access to medical trips was
ranked as the first concern in the Transportation Needs Survey.
4. To Encourage Cooperation and Coordination: The project does not directly address this
goal. However, it has the capacity to form working relationships between the public
sector agencies and private sector providers.
Criteria 2: Does the project coordinate resources? Yes – The project would coordinate the small
transportation funds of a number of agencies to participate in a voucher program. In future years,
the program may be increased through the application of Section 5310 funds. Lastly, there is an
opportunity to increase the utilization of Panhandle Transit vehicles if they can be contracted to
deliver trips during idle times when vehicles are waiting in Amarillo for return-trips.
Criteria 3: Does the project meet identified needs? Yes – As mentioned previously, same-day
medical trips was the top priority in the Transportation Needs Survey.
Criteria 4: Does the project have support and is it realistically achievable? Yes – Senior
Ambassadors Coalition has been identified as the lead agency. Furthermore, member agencies of
the Senior Ambassadors have expressed an interest in a voucher program.
Criteria 5: Is the project ready to move forward? Yes – Critical tasks to be completed include
identification of participating agencies; and transportation funding available from participating
agencies that can be applied toward local share.

Chapter 8: Action Plan Evaluation
Panhandle Transportation Coordination Study 8- 6
Transportation Coordinator / Mobility Manager Position
Criteria 1: Does project meet the goals adopted by RTAG?
1. To Improve Existing Delivery of Service: Yes – The position would be tasked with
developing new opportunities to coordinate service.
2. To Generate Efficiencies in Operations: Yes – The position would be tasked with
developing new opportunities to coordinate service to improve efficiencies in operations.
3. To Enhance Customer Satisfaction: Yes – The position would be tasked with supporting
current efforts and developing new opportunities to improve customer satisfaction.
4. To Encourage Cooperation and Coordination: Yes – The position would be responsible
for developing a regional network of coordinated transportation. This position would
serve as a bridge for transit providers and health and human service agencies as these
organizations continue to meet the requirements of H.B. 3588.
Criteria 2: Does the project coordinate resources? Yes – The position would support planning
efforts of organizations such as the Amarillo MPO, ACT, DARS, DADS, TPMHMR, HSHC,
PRPC, Panhandle Transit to include coordination objectives in their community and mobility
planning.
Criteria 3: Does the project meet identified needs? Yes – There is low awareness at the local
level of the need for coordinated planning and this project did not receive strong support or
interest during the August 31 workshop. However, there is awareness within some agencies that
the coordination of resources will be necessary if transportation funding levels continue to
decrease. This position would be an investment in the long-term potential of the Panhandle
region to succeed together by working together.
Criteria 4: Does the project have support and is it realistically achievable? Yes – PRPC has been
identified as the lead agency. However, it is anticipated that a mobility manager-type project may
be a proposal that is repeated in a number of regions. If so, there is currently nothing in this
project’s development that may make it unique from its competitors.
Chapter 8: Action Plan Evaluation
Panhandle Transportation Coordination Study 8- 7
Criteria 5: Is the project ready to move forward? Yes – Critical tasks to be completed include
identification of local share.

Chapter 9: Continuation Strategies
Panhandle Transportation Coordination Study 9- 1
Chapter 9: Continuation Strategies
A key constraint inhibiting the development of coordination projects and systems is continued
funding, resources, and leadership. Undoubtedly, in its early stages, the success of a single
coordination project may be the result of an individual’s vision to realize personal goals and
objectives. From there, future projects may grow. Ultimately, this process may produce a
coordinated transportation network that binds the region. However, early dependence upon the
driving force of one person risks the sustainability of coordination as that person may leave the
region, retire, or take another job. In order for a coordination network to develop in Panhandle
region, it is a perspective that must be expanded from a personal to an institutional context.
Plan Update / Cycle
It is anticipated that TxDOT will require a full update of the plan every two years. One action
plan included in this study is the establishment of a Transportation Coordinator / Mobility
Management position. This position would provide support and planning for future coordination
efforts; a responsibility that would logically fall under this position would be the update for the
Panhandle Transportation Coordination Study.
Barring funding for this position, the RTAG may choose to adopt the “Six Ps” as a framework
for addressing coordination planning in the future. This framework was articulated by Michael
Norris of the North Central Texas Council of Governments during the Best Practices Roundtable
in June 2006. It includes six topics that address the how coordinated transportation is
incorporated into each agency’s policies and procedures. These topics include:
• Policies: What policies need to be modified to reflect the need for mobility coordination?
• Planning: What planning documents need to reflect a coordinated approach, e.g. the
Transportation Improvement Plan, the Long Range Plan, the Texas Workforce Annual
Plan, the TPMHMR Local Plan, etc.
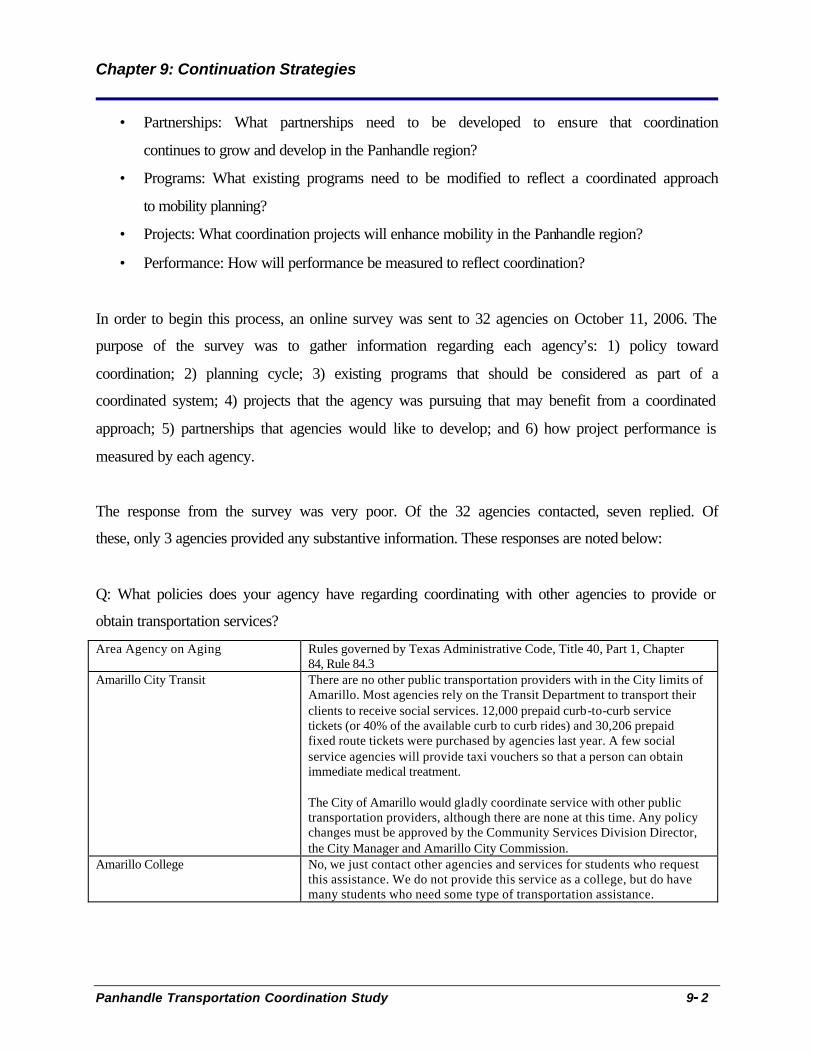
Chapter 9: Continuation Strategies
Panhandle Transportation Coordination Study 9- 2
• Partnerships: What partnerships need to be developed to ensure that coordination
continues to grow and develop in the Panhandle region?
• Programs: What existing programs need to be modified to reflect a coordinated approach
to mobility planning?
• Projects: What coordination projects will enhance mobility in the Panhandle region?
• Performance: How will performance be measured to reflect coordination?
In order to begin this process, an online survey was sent to 32 agencies on October 11, 2006. The
purpose of the survey was to gather information regarding each agency’s: 1) policy toward
coordination; 2) planning cycle; 3) existing programs that should be considered as part of a
coordinated system; 4) projects that the agency was pursuing that may benefit from a coordinated
approach; 5) partnerships that agencies would like to develop; and 6) how project performance is
measured by each agency.
The response from the survey was very poor. Of the 32 agencies contacted, seven replied. Of
these, only 3 agencies provided any substantive information. These responses are noted below:
Q: What policies does your agency have regarding coordinating with other agencies to provide or
obtain transportation services?
Area Agency on Aging Rules governed by Texas Administrative Code, Title 40, Part 1, Chapter 84, Rule 84.3
Amarillo City Transit There are no other public transportation providers with in the City limits of Amarillo. Most agencies rely on the Transit Department to transport their clients to receive social services. 12,000 prepaid curb-to-curb service tickets (or 40% of the available curb to curb rides) and 30,206 prepaid fixed route tickets were purchased by agencies last year. A few social service agencies will provide taxi vouchers so that a person can obtain immediate medical treatment. The City of Amarillo would gladly coordinate service with other public transportation providers, although there are none at this time. Any policy changes must be approved by the Community Services Division Director, the City Manager and Amarillo City Commission.
Amarillo College No, we just contact other agencies and services for students who request this assistance. We do not provide this service as a college, but do have many students who need some type of transportation assistance.

Chapter 9: Continuation Strategies
Panhandle Transportation Coordination Study 9- 3
Q: What planning documents does your agency prepare on a regular basis that reflects either
your agency’s delivery or purchase of service?
Area Agency on Aging The next update for our Area Plan is due in May 2007 and is rewritten every three years. The vendor contract is updated every year during the late summer months and takes effect at the beginning of the new fiscal year which is October 1st annually.
Amarillo City Transit The MPO Annual Report is updated on an annual basis and the next update is January.
Amarillo College
Q: What partnerships would you like to see developed so that coordination of service improves
in the Panhandle?
Area Agency on Aging I am not real familiar with all the other transportation programs since we only deal with the elderly. I just would like to see coordination where we might be able to utilize some of the other programs that are less expensive and do not have to be medically related so we can stretch our small allocation as far as possible for our clients benefit. I am not sure if this is something that we could work with the taxi services in town or not. This would allow curb to curb service for the elderly to be able to go the grocery store or other shopping and may not be limited to just 8-5. I realize they are not able to handle mobility-impaired clients yet but that may be something to discuss with them for the future. This would also ease the requirement that the client schedules the trip 2 weeks in advance.
Amarillo City Transit The Panhandle region needs more operating assistance. The region does not have enough resources and has lost significant State Transportation funds. Because of the loss of State funds, the City is considering consolidating the fixed route and curb-to-curb services into a flex/fixed route system. There are no other public transportation providers to partner with.
Amarillo College We have students attending school who need to use public transportation. Many need the bus or Special Transit Services. We also have students who come to Amarillo College from the surrounding area and they need transit services as well. Currently, we do not have any transportation service to the East Campus. This type of transportation could also be very useful to students needing to attend classes on that campus. We do not have transportation assistance for s tudents in the evening and this is also a need for many students.
Q: Does your agency measure the effectiveness/efficiency of your transportation program? If so,
what performance measurements do you use?
Area Agency on Aging We require our transportation provider to submit monthly reports on each eligible client and how many trips they had for that month and we only reimburse for clients that we have authorized ahead of time. It is tricky to do this, so we estimate the number of trips that the maximum amount of money the provider could receive and divide it by the unit rate then take

Chapter 9: Continuation Strategies
Panhandle Transportation Coordination Study 9- 4
that number and divide it by 12 months and that is the average number of trips we would reimburse for in a month. It is flexible due to the fact that we never know when the client will need rides or not, so one month they may fall short of the average number while other months they may exceed the average number of trips. This methodology allows us to ensure that the funding is being spent on actual trips. The provider also has a no-show policy; if they miss 2 or 3 trips in a month then they are put on hold until the next month. The client is also sent letters explaining what could happen if they fail to cancel the trip so they will be warned that they are in jeopardy of losing access to the service for the rest of the month. Another thing we do is have the provider report to us the amount of client contributions received for that month and we purchase units with that money first then use Title III funds to pay the rest. This ensures that the program is as financially efficient as possible. We have to submit performance projections to the State Unit on Aging for transportation so this also help us ensure the effectivness/effeciency of the program. If we do not meet our projections we are penalized. So we strive to meet these goals.
Amarillo City Transit The City of Amarillo is a very conservative operation. The City scrutinizes every program during the budgeting process. The City of Amarillo uses Powerplan Budgeting Software.
Amarillo College Disability Services No response.
At this time, the resources have not been identified and committed to update the Panhandle
Transportation Coordination Study. As mentioned, should funding be obtained for a
transportation coordination / mobility management position, the update may be the responsibility
of that position. Alternatively, some members of the RTAG have indicated a continued interest
in maintaining the group. Should the RTAG remain a viable planning committee, future updates
may be completed through the collective action of RTAG members.

Appendix A: Demographic Values for Panhandle Region
Panhandle Transportation Coordination Study A-1
Population Total Households
Median Income
Go Outside Disability
Noncitizen 65 & Older No HS Degree
No Car
Armstrong 2,148 802 38,194 59 12 413 305 2.6%Briscoe 1,790 724 29,917 85 58 345 298 5.7%Carson 6,516 2,470 40,285 229 116 1,023 751 3.2%Castro 8,285 2,761 30,619 237 608 1,052 1,685 6.3%Childress 7,688 2,474 27,457 247 200 1,212 1,813 7.8%Collingsworth 3,206 1,294 25,437 94 56 704 619 6.6%Dallam 6,222 2,317 27,946 160 377 638 1,295 5.6%Deaf Smith 18,561 6,180 29,601 394 1,373 2,248 4,120 8.9%Donley 3,828 1,578 29,006 143 49 832 565 5.3%Gray 22,744 8,793 31,368 853 687 4,125 3,813 6.0%Hall 3,782 1,548 23,016 209 258 813 967 8.3%Hansford 5,369 2,005 35,438 159 625 818 1,030 2.9%Hartley 5,537 1,604 46,327 83 103 658 938 4.9%Hemphill 3,351 1,280 35,456 66 148 494 440 2.7%Hutchinson 23,857 9,283 36,588 664 1,035 3,721 3,122 5.1%Lipscomb 3,057 1,205 31,964 85 272 563 521 4.8%Moore 20,121 6,774 34,852 342 3,269 2,124 4,339 4.8%Ochiltree 9,006 3,261 38,013 187 1,209 1,050 2,977 3.1%Oldham 2,185 735 33,713 38 81 246 244 5.3%Parmer 10,016 3,322 30,813 258 1,332 1,274 2,304 4.4%Potter 113,546 40,760 29,492 2,614 6,834 13,302 20,082 8.8%Randall 104,312 41,240 42,712 1,943 1,565 12,414 6,877 3.4%Roberts 887 362 44,792 26 2 128 62 1.9%Sherman 3,186 1,124 33,179 46 272 434 530 1.5%Swisher 8,378 2,925 29,846 224 255 1,838 1,576 7.3%Wheeler 5,284 2,152 31,029 232 194 1,103 1,007 5.5%
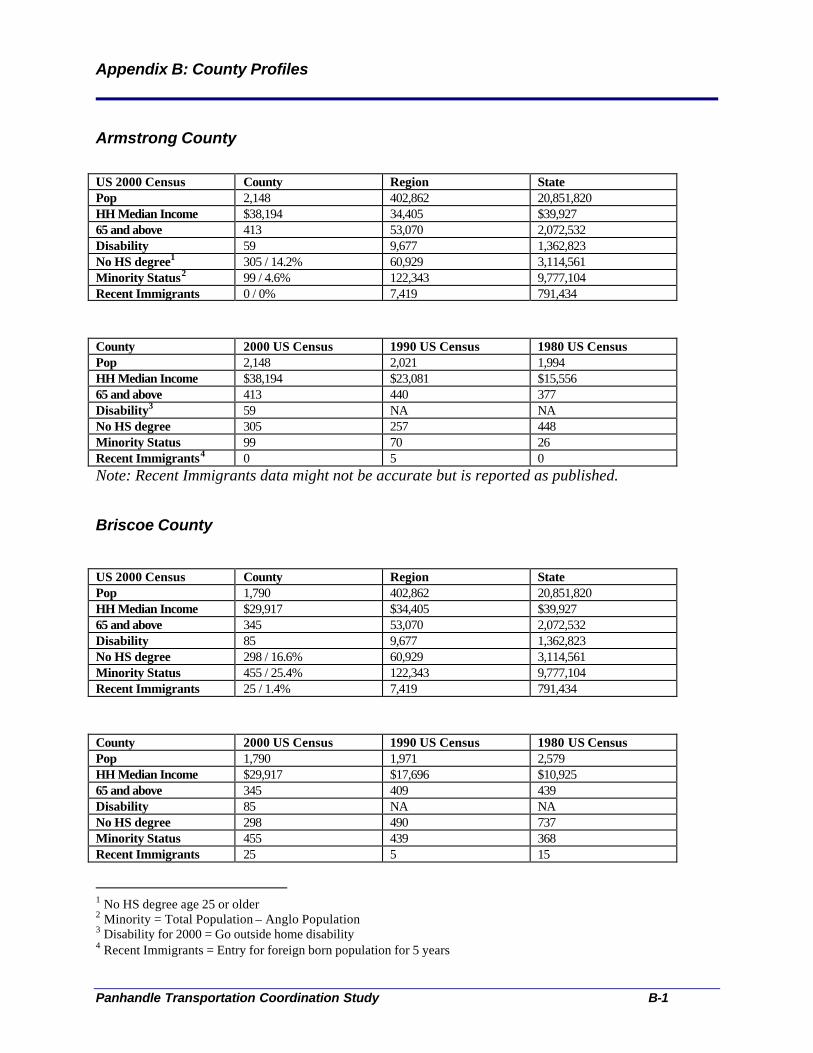
Appendix B: County Profiles
Panhandle Transportation Coordination Study B-1
Armstrong County
US 2000 Census County Region State Pop 2,148 402,862 20,851,820 HH Median Income $38,194 34,405 $39,927 65 and above 413 53,070 2,072,532 Disability 59 9,677 1,362,823 No HS degree1 305 / 14.2% 60,929 3,114,561 Minority Status2 99 / 4.6% 122,343 9,777,104 Recent Immigrants 0 / 0% 7,419 791,434 County 2000 US Census 1990 US Census 1980 US Census Pop 2,148 2,021 1,994 HH Median Income $38,194 $23,081 $15,556 65 and above 413 440 377 Disability3 59 NA NA No HS degree 305 257 448 Minority Status 99 70 26 Recent Immigrants4 0 5 0 Note: Recent Immigrants data might not be accurate but is reported as published.
Briscoe County
US 2000 Census County Region State Pop 1,790 402,862 20,851,820 HH Median Income $29,917 $34,405 $39,927 65 and above 345 53,070 2,072,532 Disability 85 9,677 1,362,823 No HS degree 298 / 16.6% 60,929 3,114,561 Minority Status 455 / 25.4% 122,343 9,777,104 Recent Immigrants 25 / 1.4% 7,419 791,434 County 2000 US Census 1990 US Census 1980 US Census Pop 1,790 1,971 2,579 HH Median Income $29,917 $17,696 $10,925 65 and above 345 409 439 Disability 85 NA NA No HS degree 298 490 737 Minority Status 455 439 368 Recent Immigrants 25 5 15
1 No HS degree age 25 or older 2 Minority = Total Population – Anglo Population 3 Disability for 2000 = Go outside home disability 4 Recent Immigrants = Entry for foreign born population for 5 years
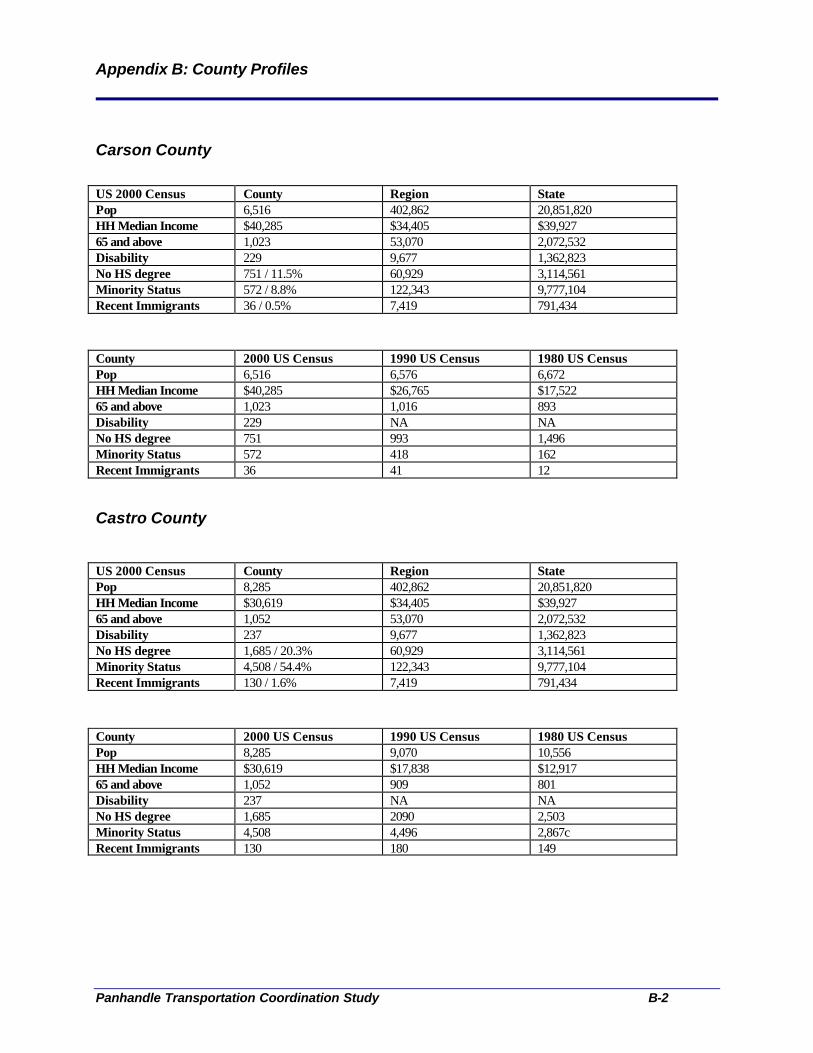
Appendix B: County Profiles
Panhandle Transportation Coordination Study B-2
Carson County
US 2000 Census County Region State Pop 6,516 402,862 20,851,820 HH Median Income $40,285 $34,405 $39,927 65 and above 1,023 53,070 2,072,532 Disability 229 9,677 1,362,823 No HS degree 751 / 11.5% 60,929 3,114,561 Minority Status 572 / 8.8% 122,343 9,777,104 Recent Immigrants 36 / 0.5% 7,419 791,434 County 2000 US Census 1990 US Census 1980 US Census Pop 6,516 6,576 6,672 HH Median Income $40,285 $26,765 $17,522 65 and above 1,023 1,016 893 Disability 229 NA NA No HS degree 751 993 1,496 Minority Status 572 418 162 Recent Immigrants 36 41 12
Castro County
US 2000 Census County Region State Pop 8,285 402,862 20,851,820 HH Median Income $30,619 $34,405 $39,927 65 and above 1,052 53,070 2,072,532 Disability 237 9,677 1,362,823 No HS degree 1,685 / 20.3% 60,929 3,114,561 Minority Status 4,508 / 54.4% 122,343 9,777,104 Recent Immigrants 130 / 1.6% 7,419 791,434 County 2000 US Census 1990 US Census 1980 US Census Pop 8,285 9,070 10,556 HH Median Income $30,619 $17,838 $12,917 65 and above 1,052 909 801 Disability 237 NA NA No HS degree 1,685 2090 2,503 Minority Status 4,508 4,496 2,867c Recent Immigrants 130 180 149
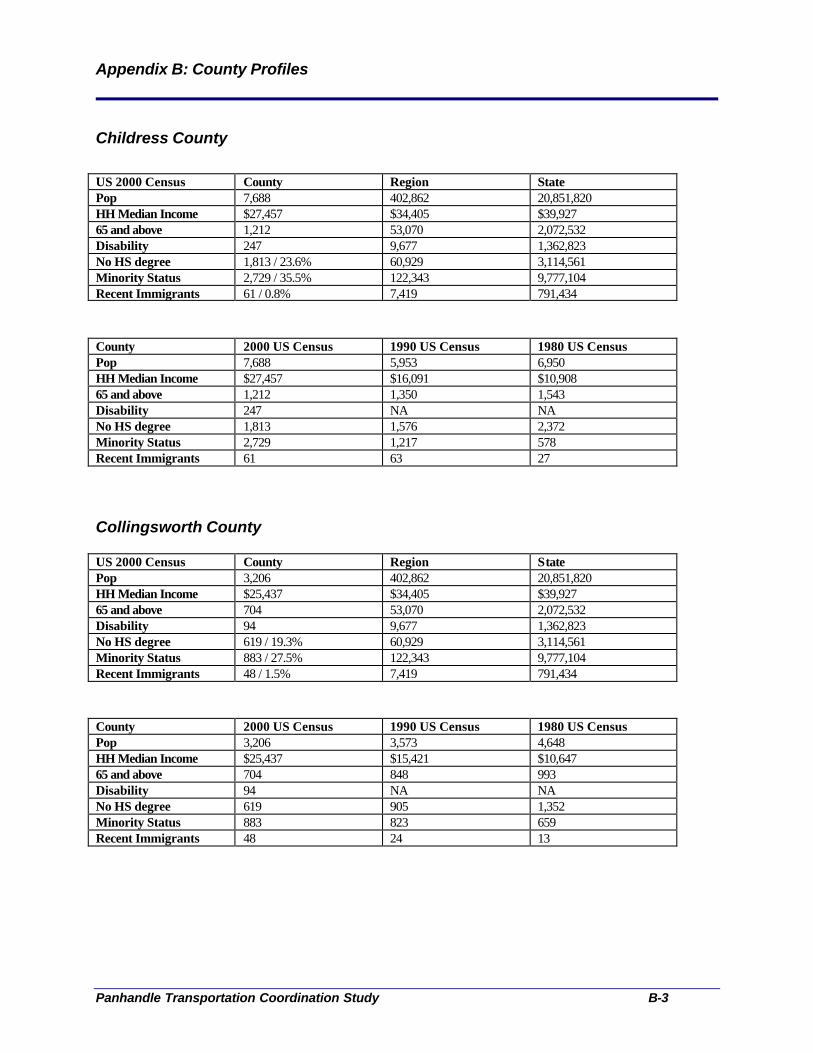
Appendix B: County Profiles
Panhandle Transportation Coordination Study B-3
Childress County
US 2000 Census County Region State Pop 7,688 402,862 20,851,820 HH Median Income $27,457 $34,405 $39,927 65 and above 1,212 53,070 2,072,532 Disability 247 9,677 1,362,823 No HS degree 1,813 / 23.6% 60,929 3,114,561 Minority Status 2,729 / 35.5% 122,343 9,777,104 Recent Immigrants 61 / 0.8% 7,419 791,434 County 2000 US Census 1990 US Census 1980 US Census Pop 7,688 5,953 6,950 HH Median Income $27,457 $16,091 $10,908 65 and above 1,212 1,350 1,543 Disability 247 NA NA No HS degree 1,813 1,576 2,372 Minority Status 2,729 1,217 578 Recent Immigrants 61 63 27
Collingsworth County
US 2000 Census County Region State Pop 3,206 402,862 20,851,820 HH Median Income $25,437 $34,405 $39,927 65 and above 704 53,070 2,072,532 Disability 94 9,677 1,362,823 No HS degree 619 / 19.3% 60,929 3,114,561 Minority Status 883 / 27.5% 122,343 9,777,104 Recent Immigrants 48 / 1.5% 7,419 791,434 County 2000 US Census 1990 US Census 1980 US Census Pop 3,206 3,573 4,648 HH Median Income $25,437 $15,421 $10,647 65 and above 704 848 993 Disability 94 NA NA No HS degree 619 905 1,352 Minority Status 883 823 659 Recent Immigrants 48 24 13

Appendix B: County Profiles
Panhandle Transportation Coordination Study B-4
Dallam County
US 2000 Census County Region State Pop 6,222 402,862 20,851,820 HH Median Income $27,946 $34,405 $39,927 65 and above 638 53,070 2,072,532 Disability 160 9,677 1,362,823 No HS degree 1,295 / 20.8% 60,929 3,114,561 Minority Status 1,932 / 31.1% 122,343 9,777,104 Recent Immigrants 88 / 1.4% 7,419 791,434 County 2000 US Census 1990 US Census 1980 US Census Pop 6,222 5,461 6,531 HH Median Income $27,946 $19,764 $11,659 65 and above 638 795 802 Disability 160 NA NA No HS degree 1,295 1,177 1,537 Minority Status 1,932 1,304 678 Recent Immigrants 88 85 79
Deaf Smith County
US 2000 Census County Region State Pop 18,561 402,862 20,851,820 HH Median Income $29,601 $34,405 $39,927 65 and above 2,248 53,070 2,072,532 Disability 394 9,677 1,362,823 No HS degree 4,120 / 22.2% 60,929 3,114,561 Minority Status 11,026 / 59.4% 122,343 9,777,104 Recent Immigrants 363 / 2.0% 7,419 791,434 County 2000 US Census 1990 US Census 1980 US Census Pop 18,561 19,153 21,165 HH Median Income $29,601 $21,177 $14,784 65 and above 2,248 2,071 1,799 Disability 394 NA NA No HS degree 4,120 4,551 5,195 Minority Status 11,026 9,736 3,424 Recent Immigrants 363 377 178
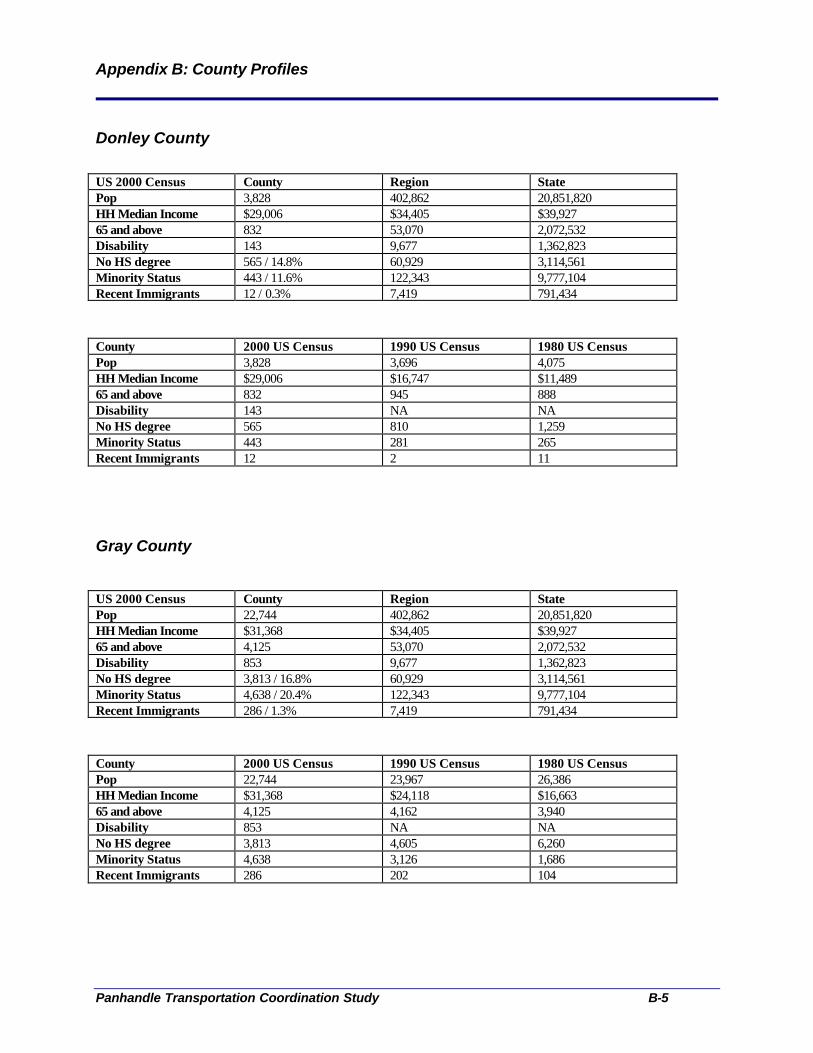
Appendix B: County Profiles
Panhandle Transportation Coordination Study B-5
Donley County
US 2000 Census County Region State Pop 3,828 402,862 20,851,820 HH Median Income $29,006 $34,405 $39,927 65 and above 832 53,070 2,072,532 Disability 143 9,677 1,362,823 No HS degree 565 / 14.8% 60,929 3,114,561 Minority Status 443 / 11.6% 122,343 9,777,104 Recent Immigrants 12 / 0.3% 7,419 791,434 County 2000 US Census 1990 US Census 1980 US Census Pop 3,828 3,696 4,075 HH Median Income $29,006 $16,747 $11,489 65 and above 832 945 888 Disability 143 NA NA No HS degree 565 810 1,259 Minority Status 443 281 265 Recent Immigrants 12 2 11
Gray County
US 2000 Census County Region State Pop 22,744 402,862 20,851,820 HH Median Income $31,368 $34,405 $39,927 65 and above 4,125 53,070 2,072,532 Disability 853 9,677 1,362,823 No HS degree 3,813 / 16.8% 60,929 3,114,561 Minority Status 4,638 / 20.4% 122,343 9,777,104 Recent Immigrants 286 / 1.3% 7,419 791,434 County 2000 US Census 1990 US Census 1980 US Census Pop 22,744 23,967 26,386 HH Median Income $31,368 $24,118 $16,663 65 and above 4,125 4,162 3,940 Disability 853 NA NA No HS degree 3,813 4,605 6,260 Minority Status 4,638 3,126 1,686 Recent Immigrants 286 202 104

Appendix B: County Profiles
Panhandle Transportation Coordination Study B-6
Hall County
US 2000 Census County Region State Pop 3,782 402,862 20,851,820 HH Median Income $23,016 $34,405 $39,927 65 and above 813 53,070 2,072,532 Disability 209 9,677 1,362,823 No HS degree 967 / 25.6% 60,929 3,114,561 Minority Status 1,366 / 36.1% 122,343 9,777,104 Recent Immigrants 84 / 2.2% 7,419 791,434 County 2000 US Census 1990 US Census 1980 US Census Pop 3,782 3,905 5,594 HH Median Income $23,016 $13,987 $10,072 65 and above 813 1,032 1,205 Disability 209 NA NA No HS degree 967 1,053 1,873 Minority Status 1,366 1,055 811 Recent Immigrants 84 23 44
Hansford County
US 2000 Census County Region State Pop 5,369 402,862 20,851,820 HH Median Income $35,438 $34,405 $39,927 65 and above 818 53,070 2,072,532 Disability 159 9,677 1,362,823 No HS degree 1,030 / 19.2% 60,929 3,114,561 Minority Status 1,737 / 32.4% 122,343 9,777,104 Recent Immigrants 275 / 5.1% 7,419 791,434 County 2000 US Census 1990 US Census 1980 US Census Pop 5,369 5,848 6,209 HH Median Income $35,438 $25,787 $17,801 65 and above 818 751 600 Disability 159 NA NA No HS degree 1,030 1,026 1,203 Minority Status 1,737 1,211 456 Recent Immigrants 275 70 88
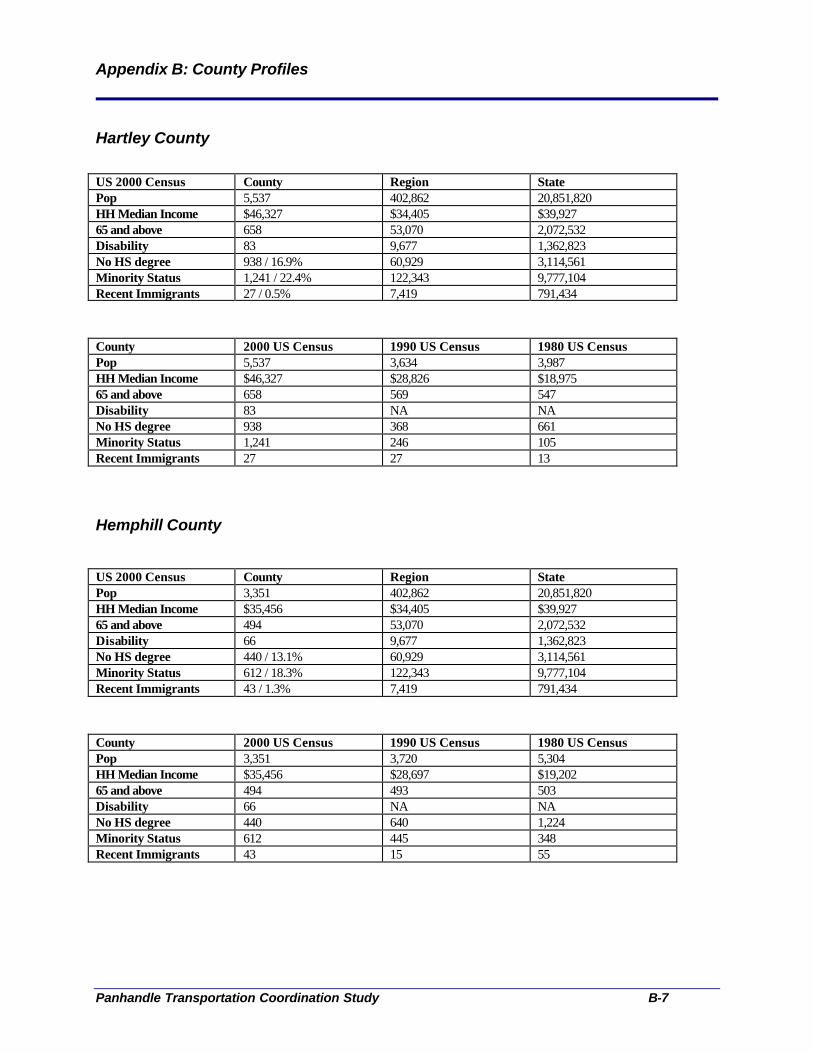
Appendix B: County Profiles
Panhandle Transportation Coordination Study B-7
Hartley County
US 2000 Census County Region State Pop 5,537 402,862 20,851,820 HH Median Income $46,327 $34,405 $39,927 65 and above 658 53,070 2,072,532 Disability 83 9,677 1,362,823 No HS degree 938 / 16.9% 60,929 3,114,561 Minority Status 1,241 / 22.4% 122,343 9,777,104 Recent Immigrants 27 / 0.5% 7,419 791,434 County 2000 US Census 1990 US Census 1980 US Census Pop 5,537 3,634 3,987 HH Median Income $46,327 $28,826 $18,975 65 and above 658 569 547 Disability 83 NA NA No HS degree 938 368 661 Minority Status 1,241 246 105 Recent Immigrants 27 27 13
Hemphill County
US 2000 Census County Region State Pop 3,351 402,862 20,851,820 HH Median Income $35,456 $34,405 $39,927 65 and above 494 53,070 2,072,532 Disability 66 9,677 1,362,823 No HS degree 440 / 13.1% 60,929 3,114,561 Minority Status 612 / 18.3% 122,343 9,777,104 Recent Immigrants 43 / 1.3% 7,419 791,434 County 2000 US Census 1990 US Census 1980 US Census Pop 3,351 3,720 5,304 HH Median Income $35,456 $28,697 $19,202 65 and above 494 493 503 Disability 66 NA NA No HS degree 440 640 1,224 Minority Status 612 445 348 Recent Immigrants 43 15 55
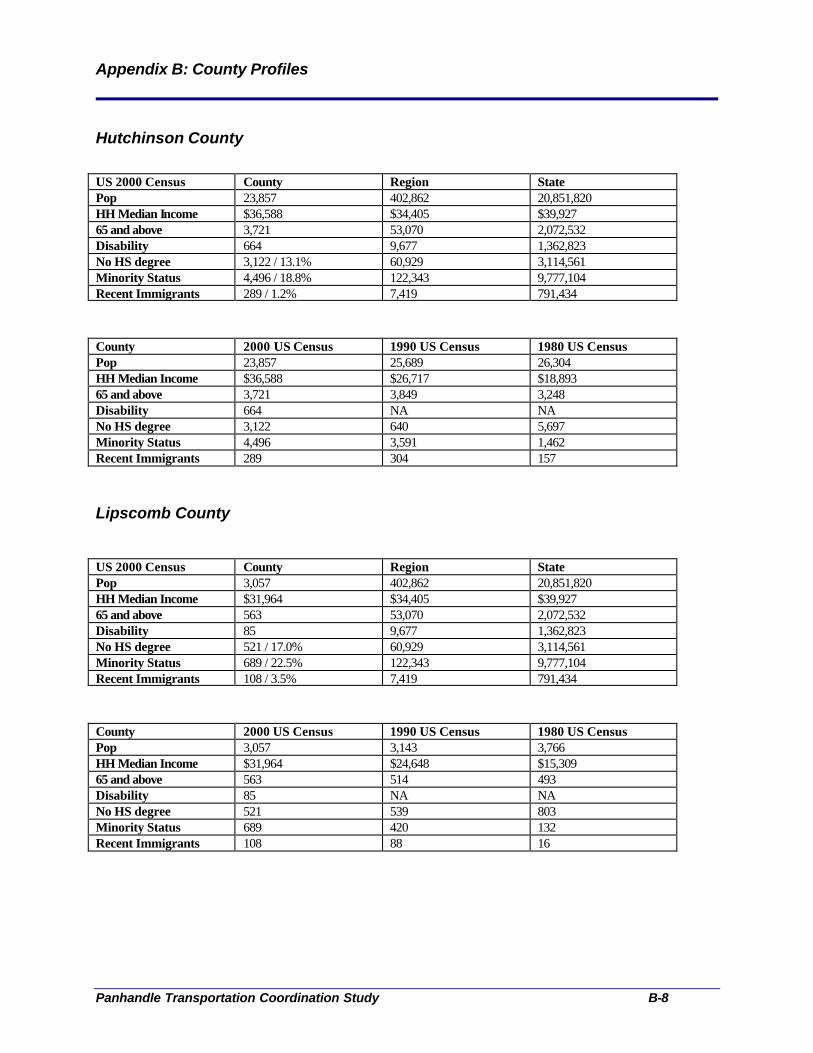
Appendix B: County Profiles
Panhandle Transportation Coordination Study B-8
Hutchinson County
US 2000 Census County Region State Pop 23,857 402,862 20,851,820 HH Median Income $36,588 $34,405 $39,927 65 and above 3,721 53,070 2,072,532 Disability 664 9,677 1,362,823 No HS degree 3,122 / 13.1% 60,929 3,114,561 Minority Status 4,496 / 18.8% 122,343 9,777,104 Recent Immigrants 289 / 1.2% 7,419 791,434 County 2000 US Census 1990 US Census 1980 US Census Pop 23,857 25,689 26,304 HH Median Income $36,588 $26,717 $18,893 65 and above 3,721 3,849 3,248 Disability 664 NA NA No HS degree 3,122 640 5,697 Minority Status 4,496 3,591 1,462 Recent Immigrants 289 304 157 Lipscomb County US 2000 Census County Region State Pop 3,057 402,862 20,851,820 HH Median Income $31,964 $34,405 $39,927 65 and above 563 53,070 2,072,532 Disability 85 9,677 1,362,823 No HS degree 521 / 17.0% 60,929 3,114,561 Minority Status 689 / 22.5% 122,343 9,777,104 Recent Immigrants 108 / 3.5% 7,419 791,434 County 2000 US Census 1990 US Census 1980 US Census Pop 3,057 3,143 3,766 HH Median Income $31,964 $24,648 $15,309 65 and above 563 514 493 Disability 85 NA NA No HS degree 521 539 803 Minority Status 689 420 132 Recent Immigrants 108 88 16
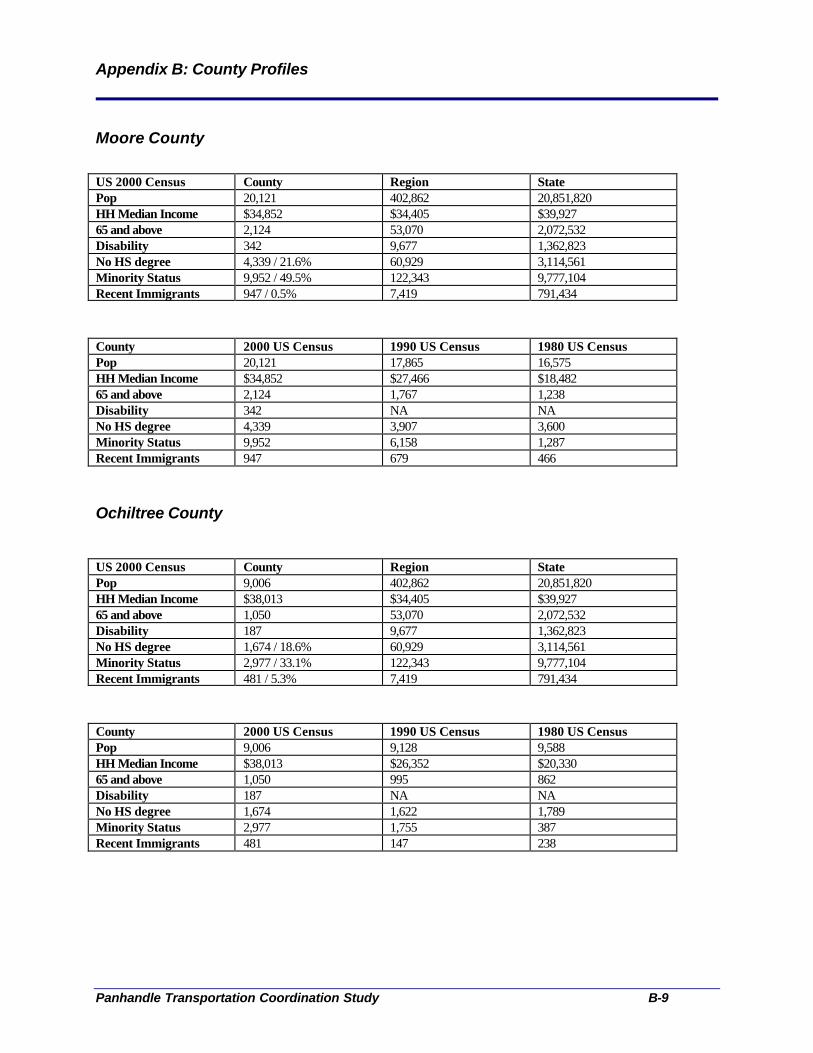
Appendix B: County Profiles
Panhandle Transportation Coordination Study B-9
Moore County
US 2000 Census County Region State Pop 20,121 402,862 20,851,820 HH Median Income $34,852 $34,405 $39,927 65 and above 2,124 53,070 2,072,532 Disability 342 9,677 1,362,823 No HS degree 4,339 / 21.6% 60,929 3,114,561 Minority Status 9,952 / 49.5% 122,343 9,777,104 Recent Immigrants 947 / 0.5% 7,419 791,434 County 2000 US Census 1990 US Census 1980 US Census Pop 20,121 17,865 16,575 HH Median Income $34,852 $27,466 $18,482 65 and above 2,124 1,767 1,238 Disability 342 NA NA No HS degree 4,339 3,907 3,600 Minority Status 9,952 6,158 1,287 Recent Immigrants 947 679 466 Ochiltree County US 2000 Census County Region State Pop 9,006 402,862 20,851,820 HH Median Income $38,013 $34,405 $39,927 65 and above 1,050 53,070 2,072,532 Disability 187 9,677 1,362,823 No HS degree 1,674 / 18.6% 60,929 3,114,561 Minority Status 2,977 / 33.1% 122,343 9,777,104 Recent Immigrants 481 / 5.3% 7,419 791,434 County 2000 US Census 1990 US Census 1980 US Census Pop 9,006 9,128 9,588 HH Median Income $38,013 $26,352 $20,330 65 and above 1,050 995 862 Disability 187 NA NA No HS degree 1,674 1,622 1,789 Minority Status 2,977 1,755 387 Recent Immigrants 481 147 238

Appendix B: County Profiles
Panhandle Transportation Coordination Study B-10
Oldham County
US 2000 Census County Region State Pop 2,185 402,862 20,851,820 HH Median Income $33,713 $34,405 $39,927 65 and above 246 53,070 2,072,532 Disability 38 9,677 1,362,823 No HS degree 244 / 11.1% 60,929 3,114,561 Minority Status 325 / 14.9% 122,343 9,777,104 Recent Immigrants 19 / 0.8% 7,419 791,434 County 2000 US Census 1990 US Census 1980 US Census Pop 2,185 2,278 2,283 HH Median Income $33,713 $28,167 $13,656 65 and above 246 240 194 Disability 38 NA NA No HS degree 244 323 411 Minority Status 325 258 65 Recent Immigrants 19 24 28 Parmer County US 2000 Census County Region State Pop 10,016 402,862 20,851,820 HH Median Income $30,813 $34,405 $39,927 65 and above 1,274 53,070 2,072,532 Disability 258 9,677 1,362,823 No HS degree 2,304 / 23.0% 60,929 3,114,561 Minority Status 5,091 / 50.8% 122,343 9,777,104 Recent Immigrants 432 / 4.3% 7,419 791,434 County 2000 US Census 1990 US Census 1980 US Census Pop 10,016 9,863 11,038 HH Median Income $30,813 $19,742 $14,026 65 and above 1,274 1,231 1,049 Disability 258 NA NA No HS degree 2,304 2,568 2,816 Minority Status 5,091 4,263 1,952 Recent Immigrants 432 386 268
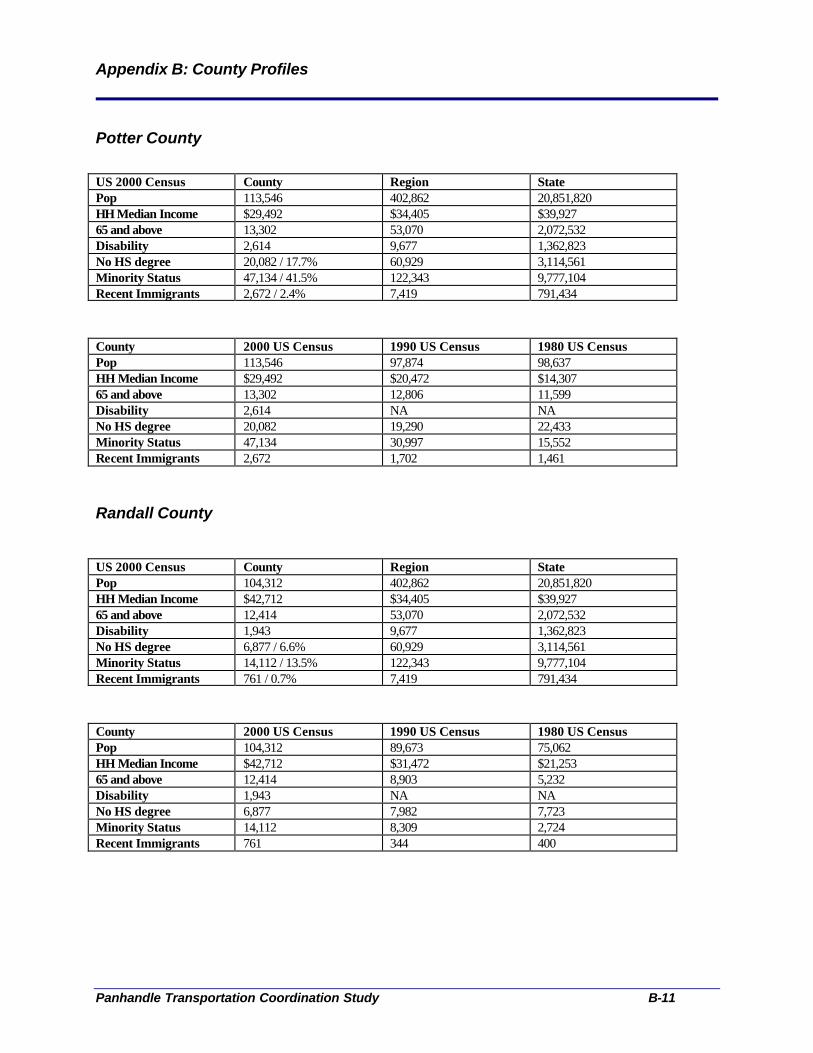
Appendix B: County Profiles
Panhandle Transportation Coordination Study B-11
Potter County
US 2000 Census County Region State Pop 113,546 402,862 20,851,820 HH Median Income $29,492 $34,405 $39,927 65 and above 13,302 53,070 2,072,532 Disability 2,614 9,677 1,362,823 No HS degree 20,082 / 17.7% 60,929 3,114,561 Minority Status 47,134 / 41.5% 122,343 9,777,104 Recent Immigrants 2,672 / 2.4% 7,419 791,434 County 2000 US Census 1990 US Census 1980 US Census Pop 113,546 97,874 98,637 HH Median Income $29,492 $20,472 $14,307 65 and above 13,302 12,806 11,599 Disability 2,614 NA NA No HS degree 20,082 19,290 22,433 Minority Status 47,134 30,997 15,552 Recent Immigrants 2,672 1,702 1,461 Randall County US 2000 Census County Region State Pop 104,312 402,862 20,851,820 HH Median Income $42,712 $34,405 $39,927 65 and above 12,414 53,070 2,072,532 Disability 1,943 9,677 1,362,823 No HS degree 6,877 / 6.6% 60,929 3,114,561 Minority Status 14,112 / 13.5% 122,343 9,777,104 Recent Immigrants 761 / 0.7% 7,419 791,434 County 2000 US Census 1990 US Census 1980 US Census Pop 104,312 89,673 75,062 HH Median Income $42,712 $31,472 $21,253 65 and above 12,414 8,903 5,232 Disability 1,943 NA NA No HS degree 6,877 7,982 7,723 Minority Status 14,112 8,309 2,724 Recent Immigrants 761 344 400

Appendix B: County Profiles
Panhandle Transportation Coordination Study B-12
Roberts County
US 2000 Census County Region State Pop 887 402,862 20,851,820 HH Median Income $44,792 $34,405 $39,927 65 and above 128 53,070 2,072,532 Disability 26 9,677 1,362,823 No HS degree 62 / 7.0% 60,929 3,114,561 Minority Status 32 / 3.6% 122,343 9,777,104 Recent Immigrants 2 / 0.2% 7,419 791,434 County 2000 US Census 1990 US Census 1980 US Census Pop 887 1,025 1,187 HH Median Income $44,792 $30,203 $17,370 65 and above 128 117 151 Disability 26 NA NA No HS degree 62 125 249 Minority Status 32 37 16 Recent Immigrants 2 0 0 Sherman County US 2000 Census County Region State Pop 3,186 402,862 20,851,820 HH Median Income $33,179 $34,405 $39,927 65 and above 434 53,070 2,072,532 Disability 46 9,677 1,362,823 No HS degree 530 / 16.6% 60,929 3,114,561 Minority Status 907 / 28.5% 122,343 9,777,104 Recent Immigrants 97 / 3.0% 7,419 791,434 County 2000 US Census 1990 US Census 1980 US Census Pop 3,186 2,858 3,174 HH Median Income $33,179 $23,005 $16,590 65 and above 434 389 393 Disability 46 NA NA No HS degree 530 529 675 Minority Status 907 556 174 Recent Immigrants 97 76 40
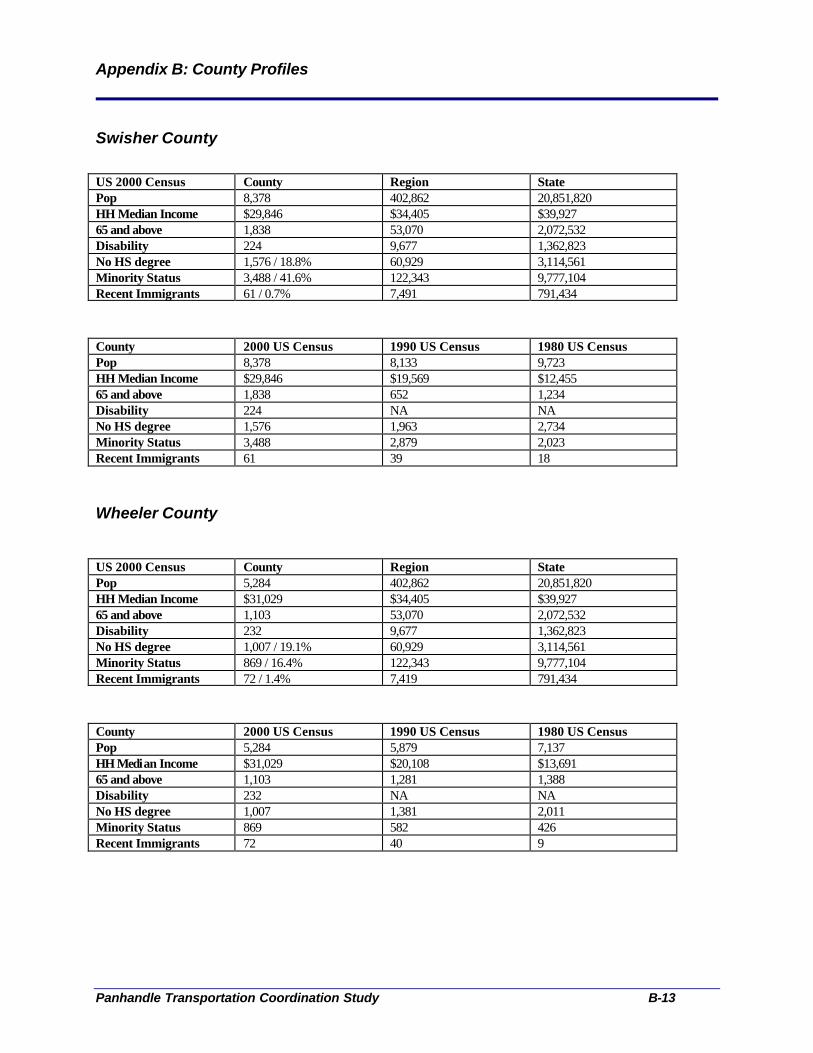
Appendix B: County Profiles
Panhandle Transportation Coordination Study B-13
Swisher County
US 2000 Census County Region State Pop 8,378 402,862 20,851,820 HH Median Income $29,846 $34,405 $39,927 65 and above 1,838 53,070 2,072,532 Disability 224 9,677 1,362,823 No HS degree 1,576 / 18.8% 60,929 3,114,561 Minority Status 3,488 / 41.6% 122,343 9,777,104 Recent Immigrants 61 / 0.7% 7,491 791,434 County 2000 US Census 1990 US Census 1980 US Census Pop 8,378 8,133 9,723 HH Median Income $29,846 $19,569 $12,455 65 and above 1,838 652 1,234 Disability 224 NA NA No HS degree 1,576 1,963 2,734 Minority Status 3,488 2,879 2,023 Recent Immigrants 61 39 18 Wheeler County US 2000 Census County Region State Pop 5,284 402,862 20,851,820 HH Median Income $31,029 $34,405 $39,927 65 and above 1,103 53,070 2,072,532 Disability 232 9,677 1,362,823 No HS degree 1,007 / 19.1% 60,929 3,114,561 Minority Status 869 / 16.4% 122,343 9,777,104 Recent Immigrants 72 / 1.4% 7,419 791,434 County 2000 US Census 1990 US Census 1980 US Census Pop 5,284 5,879 7,137 HH Median Income $31,029 $20,108 $13,691 65 and above 1,103 1,281 1,388 Disability 232 NA NA No HS degree 1,007 1,381 2,011 Minority Status 869 582 426 Recent Immigrants 72 40 9

Panhandle Transportation Coordination Study C-1
Appendix C: FY04 to FY05 Panhandle Transit Operating Statistics by County
TOTAL ARMSTRONG BRISCOE CARSON CASTRO CHILDRESS COLLING. DALLAM DEAF SMITH DONLEY9/01/2004-8/31/2005 1 2 3 4 5 6 7 8 9PT STATISTICSTotal Vehicle Miles 699,847 - 3,789 1,964 25,925 35,792 2,890 33,137 45,474 13,852Total Passenger Miles 1,514,083 169 3,048 2,087 40,828 40,754 12,651 56,240 98,425 63,494Total Deadhead Miles 194,224 - 890 79 6,012 6,642 1,546 4,943 7,112 4,415Oneway Passenger Trips 139,784 10 54 54 1,315 6,509 396 2,746 18,103 8,180Number of CSBG Trips 5,173 0 0 0 17 529 10 8 51 955Total Medical Trips 29,306 10 50 50 1,088 1,153 310 1,022 1,574 643Medicaid Trips 18,788 0 46 19 795 726 307 535 938 450Elderly Trips 28,754 10 2 40 904 3,632 247 573 2,579 514Handicapped Trips 43,665 10 28 48 940 2,402 268 868 3,851 562School Trips 63,039 0 0 0 37 12 11 542 10,407 6,368Person Served 92,739 3 27 27 1,187 3,075 167 1,673 15,066 5,365Value Coupons Sold $24,023.00 - - - $26.50 $449.00 $4.00 $637.00 $75.50 $3.00Value Coupons Collected $68,885.07 - - - $210.30 $2,612.00 - $609.00 $13,457.25 $6,794.00Client Payment-Cash $49,395.73 $15.90 $25.00 $121.00 $475.92 $3,575.24 $70.00 $1,266.24 $3,599.81 $634.13Client Payment-Check $32,090.07 - - $106.00 - $893.25 - $520.06 $121.00 $1,390.82
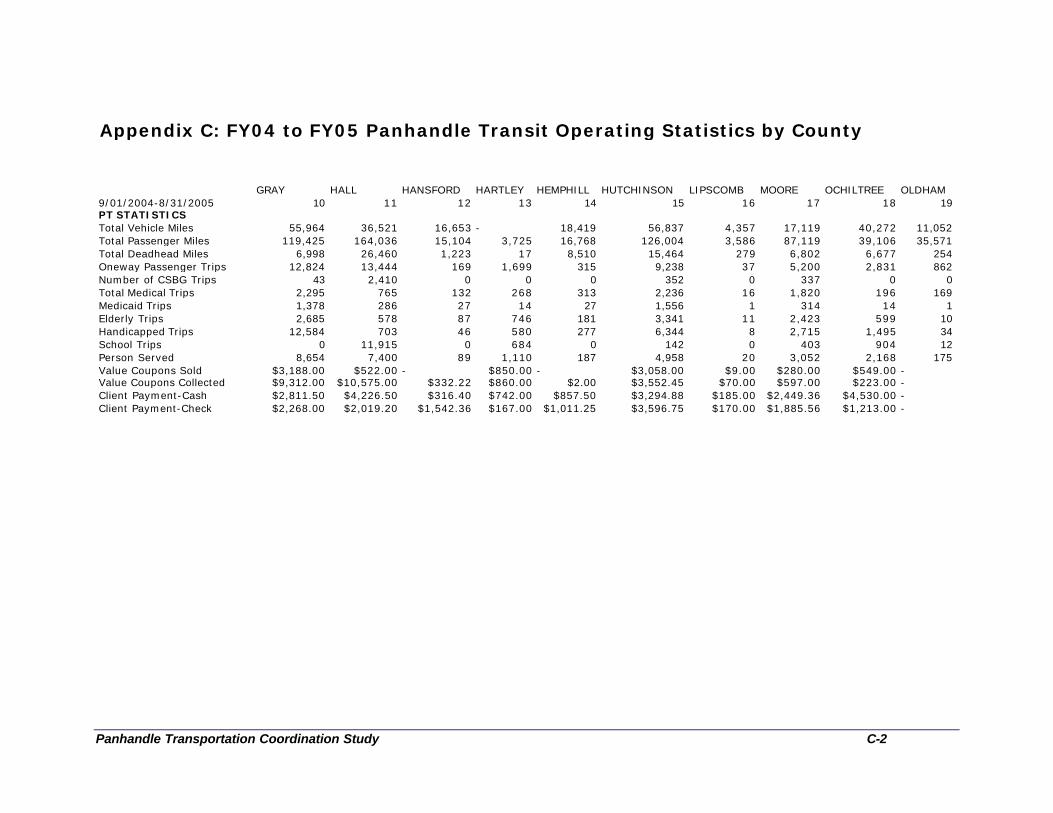
Panhandle Transportation Coordination Study C-2
Appendix C: FY04 to FY05 Panhandle Transit Operating Statistics by County
GRAY HALL HANSFORD HARTLEY HEMPHILL HUTCHINSON LIPSCOMB MOORE OCHILTREE OLDHAM9/01/2004-8/31/2005 10 11 12 13 14 15 16 17 18 19PT STATISTICSTotal Vehicle Miles 55,964 36,521 16,653 - 18,419 56,837 4,357 17,119 40,272 11,052Total Passenger Miles 119,425 164,036 15,104 3,725 16,768 126,004 3,586 87,119 39,106 35,571Total Deadhead Miles 6,998 26,460 1,223 17 8,510 15,464 279 6,802 6,677 254Oneway Passenger Trips 12,824 13,444 169 1,699 315 9,238 37 5,200 2,831 862Number of CSBG Trips 43 2,410 0 0 0 352 0 337 0 0Total Medical Trips 2,295 765 132 268 313 2,236 16 1,820 196 169Medicaid Trips 1,378 286 27 14 27 1,556 1 314 14 1Elderly Trips 2,685 578 87 746 181 3,341 11 2,423 599 10Handicapped Trips 12,584 703 46 580 277 6,344 8 2,715 1,495 34School Trips 0 11,915 0 684 0 142 0 403 904 12Person Served 8,654 7,400 89 1,110 187 4,958 20 3,052 2,168 175Value Coupons Sold $3,188.00 $522.00 - $850.00 - $3,058.00 $9.00 $280.00 $549.00 -Value Coupons Collected $9,312.00 $10,575.00 $332.22 $860.00 $2.00 $3,552.45 $70.00 $597.00 $223.00 -Client Payment-Cash $2,811.50 $4,226.50 $316.40 $742.00 $857.50 $3,294.88 $185.00 $2,449.36 $4,530.00 -Client Payment-Check $2,268.00 $2,019.20 $1,542.36 $167.00 $1,011.25 $3,596.75 $170.00 $1,885.56 $1,213.00 -
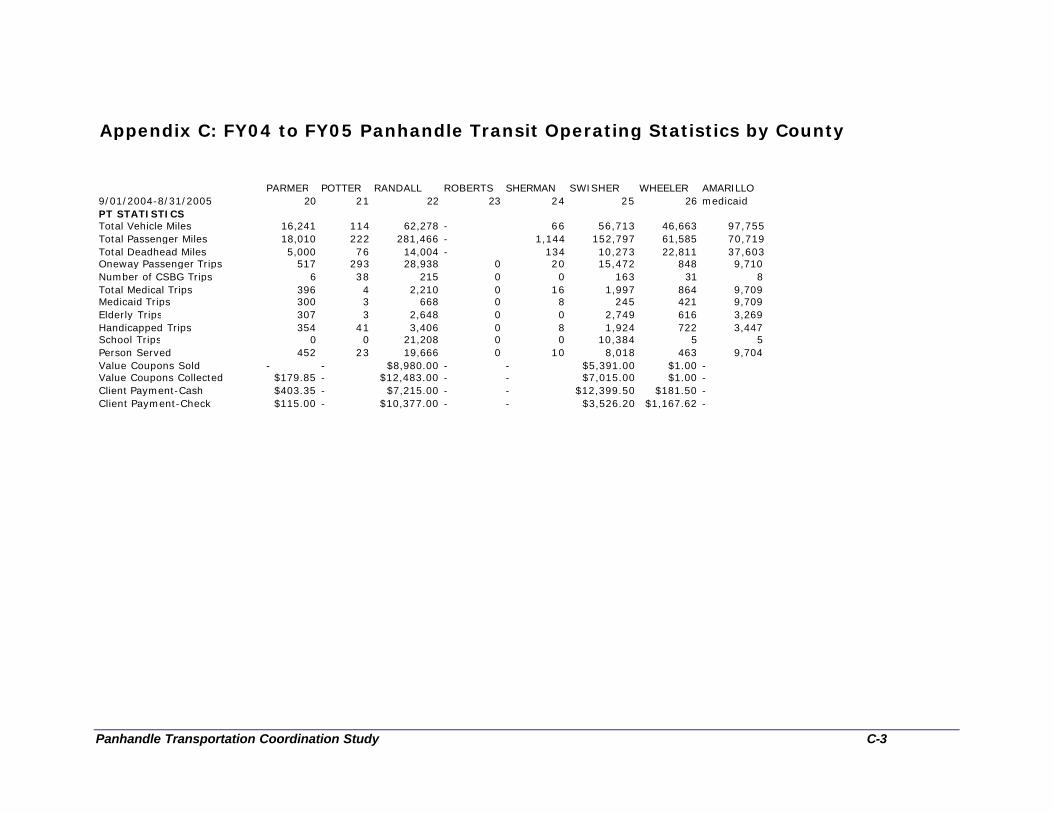
Panhandle Transportation Coordination Study C-3
Appendix C: FY04 to FY05 Panhandle Transit Operating Statistics by County
PARMER POTTER RANDALL ROBERTS SHERMAN SWISHER WHEELER AMARILLO9/01/2004-8/31/2005 20 21 22 23 24 25 26 medicaidPT STATISTICSTotal Vehicle Miles 16,241 114 62,278 - 66 56,713 46,663 97,755Total Passenger Miles 18,010 222 281,466 - 1,144 152,797 61,585 70,719Total Deadhead Miles 5,000 76 14,004 - 134 10,273 22,811 37,603Oneway Passenger Trips 517 293 28,938 0 20 15,472 848 9,710Number of CSBG Trips 6 38 215 0 0 163 31 8Total Medical Trips 396 4 2,210 0 16 1,997 864 9,709Medicaid Trips 300 3 668 0 8 245 421 9,709Elderly Trips 307 3 2,648 0 0 2,749 616 3,269Handicapped Trips 354 41 3,406 0 8 1,924 722 3,447School Trips 0 0 21,208 0 0 10,384 5 5Person Served 452 23 19,666 0 10 8,018 463 9,704Value Coupons Sold - - $8,980.00 - - $5,391.00 $1.00 -Value Coupons Collected $179.85 - $12,483.00 - - $7,015.00 $1.00 -Client Payment-Cash $403.35 - $7,215.00 - - $12,399.50 $181.50 -Client Payment-Check $115.00 - $10,377.00 - - $3,526.20 $1,167.62 -

Appendix D: Panhandle Region Agency Contacts
Panhandle Transportation Coordination Study D-1
Agency Contact Position Email Phone Address CityAmerican Legion Auxiliary Hanson Post #54 Rosevelt Sullivan Commander [email protected] (806) 373-4907 617 West 7th Amarillo
ARC of Potter and Randall Counties Susan Stokes Volunteer (806) 372-5699 202 South Louisiana AmarilloCamp Admire (806) 358-5847 5111 Canyon Drive Amarillo
Department of Assistive & Rehabilitative Services Jim Haile Area Manager [email protected] (806) 353-7491 5809 South Western AmarilloPanhandle Independent Living Center Carl McMillan [email protected] 806-374-1400 1118 S. Taylor Amarillo
Community Options Eleanor Brown Residential Coordinator (806) 358-3337 801 South Fillmore AmarilloAmerican Red Cross - Texas Panhandle Chapter [email protected] (806) 376-6309 1800 Harrison AmarilloAmarillo Medical Services (806) 358-7111 4101 Mockingbird Amarillo
Adult and Youth Ministry (Salvation Army) [email protected](806) 373-6631 2101 S Van Buren AmarilloAmarillo Baptist Association (806) 355-9829 1800 South Western Amarillo
Catholic Family Services Lori Williams Communications (806) 376-4571 P.O. Box 15127 AmarilloTrinity Baptist Church Jenny McDaniel Director (806) 372-8364 1608 Wolflin Amarillo
Paramount Baptist Church Darrell Anderson Resource Manager [email protected] (806) 355-3396 3801 S Western AmarilloFirst Baptist Church Bruce Fite Property Manager [email protected] (806) 373-2891 1208 S. Tyler St Amarillo
First Christian Church (806) 355-9976 3001 Wolfin AmarilloAmarillo College - Adult Students Program [email protected] (806) 371-5449 2201 South Washington Amarillo
Goodwill Industries Rory Bowen Executive Director [email protected] (806) 372-4352 P.O. Box 2926 AmarilloHHSC - Texas Works [email protected]; [email protected](806) 376-7214 2406 W 6th Amarillo
Another Chance House Sandy (806) 372-3344 209 South Jackson AmarilloCornerstone Outreach Center of Amarillo, Inc La Fonda King [email protected] (806) 381-2131 1111 North Buchanan St AmarilloTexas Workforce Centers - Amarillo Maren Rivas Office Manager [email protected] (806) 372-5521 1206 W 7th Amarillo
Texas Workforce Centers P.O. Box 1682 AmarilloAmarillo Nursing Center Amanda Stewart Administrator (806) 355-4488 4033 West 51st Ave Amarillo
Beehive Countryside Cottages Jere Pillsbury Caregiver (806) 352-8586 11315 Collin Wade Rd AmarilloBrookhaven Care Homes Jodie Waters Owner (806) 622-3768 14314 Burrell St Amarillo
Coalition of Health Services/2CAare for Kids Dorinda Bates [email protected] (806) 337-1700 301 S. Polk AmarilloCottages at Quail Creek Director (806) 351-2271 6811 Plum Creek Dr. Amarillo
Country Club Nursing and Rehabilitation Deb Bunten Administrator (806) 352-2731 9 Medical Dr AmarilloCrestview Assisted Living Collette Williams Manager [email protected] (806) 352-0093 6680 Woodward St Amarillo
Don & Sybil Harrington Center Jim Wade Director (806) 359-4673 1500 Wallace Blvd. AmarilloDowntown Women's Center Ask for Donna or Diane [email protected] (806) 372-3625 409 S Monroe St Amarillo
Heavenly Angels Private Home Health Care Betty Barreras Owner (806) 383-1594 1908 Rogers St AmarilloHeritage Nursing Home (806) 242-0281 1009 Clyde AmarilloHigh Plains Epilepsy Association [email protected] (806) 352-5426 3505 Olsen Amarillo
Mom-Mobile (NWTHS) Mark Miracle Director Women's Health (806) 351-7259 1501 Coulter Dr AmarilloNational Kidney Foundation of West Texas [email protected] (806) 358-9775 6141 Amarillo Boulevard West Amarillo
Palo Duro Nursing & Rehabilitation Ronny Rogers ADOM (806) 352-5600 1931 Medi-Park Dr AmarilloPotter House Joy Gilbert Administrator [email protected] (806) 353-5185 6800 Plum Creek Dr. Amarillo
Riverstone Assisted Living David Hairston Administrator [email protected] (806) 351-0686 6301 Blake Avenue AmarilloSeville Estates Opal Laurel Executive Director [email protected] (806) 351-2105 7401 Seville Dr. Amarillo
Unlimited Care James Walton President (806) 358-1767 PO Box 7823 AmarilloAbundant Life Home Care Bill Archinal President [email protected] (806) 373-8940 720 S Tyler, Ste 222 Amarillo
Accolade Home Care Ronna Wells Office manager [email protected] (806) 352-3900 6300 I-40 West, Ste 210 AmarilloAmarillo Area Breast Health Coalition Leticia Goodrich Executive Director (806) 358-0866 PO Box 1400 Amarillo
AWARE (associate of ACADA) Alan Graves Program Director (806) 376-4071 202 S Louisiana AmarilloAmarillo High Plains Dialysis Center Rebecca Carr Social Worker (806) 353-9182 5920 Amarillo Blvd West AmarilloAmarillo Panhandle Humane Society - Pet Therapy Jan Fielding Supervisor [email protected] (806) 373-1716 3501 S. Osage Amarillo
Plum Creek Health Care Center 5601 Plum Creek Dr. AmarilloThe Cottages at Quail Creek 6811 Plum Creek Dr. Amarillo

Appendix D: Panhandle Region Agency Contacts
Panhandle Transportation Coordination Study D-2
Agency Contact Position Email Phone Address CityASC Industries Amarillo (TPMHMR) Eloise Hanes Director of ASC Indutries [email protected] (806) 383-1253 2004 Hardy Amarillo
Texas Panhandle Mental Health Mental Retardation (806) 337-1000 1501 South Polk AmarilloAmarillo Mental Health (806) 374-3487 1217 West 10th Amarillo
AWARE Program Allen Graves Program Director n/a n/a 202 S. Louisiana AmarilloSalvation Army P.O. Box 2490 Amarillo
AGAPE Center [email protected] (806) 373-7030 1515 S Buchanan AmarilloAmarillo Agency on Aging of the Panhandle Melissa Carter Director AAA [email protected] (806) 331-2227 P.O. Box 9257 AmarilloAmarillo Garden Apartments Laurie Baker Executive Director [email protected](806) 373-1074 1223 S. Roberts Amarillo
Amarillo Senior Citizens Association, Inc. Judi Solley Executive Director [email protected] (806) 374-5500 P.O. Box 31180 AmarilloBivins Memorial 1001 Wallace Blvd. Amarillo
Bivins Memorial Kim Johnson [email protected] (806) 355-7453 3115 Tee Anchor Boulevard AmarilloCanyon View Estates Retirement Assisted Living CommunityDon Howington Administrator [email protected] (806) 356-8346 7404 Wallace Blvd. Amarillo
Canyon's Methodist Retirement Community [email protected] (806) 373-6896 2200 West 7th AmarilloCaprock Home Health Care Carrie Rocha Office Manager (806) 372-8480 P.O. Box 2450 Amarillo
Jan Werner Adult Day Care Center Jim Chilcote General Manager [email protected] (806) 374-5516 3108 South Fillmore AmarilloNorthwest Village LTD Shirley Keller Manager (806) 355-0481 6101 I-40 West Amarillo
Preston Senior Living LLC Sharla Richardson Executive Director [email protected](806) 351-2271 6811 Plum Creek Dr. AmarilloTexas Veterans Commission [email protected] (806) 468-1883 6010 Amarillo Blvd W Amarillo
Texas Works - Adult Foster Care Francis Pena Supervisor (806) 376-7214 2406 W 6th AmarilloThe Craig Methodist Retirement Community Cindy Long Coordinator (806) 352-7244 5500 W. 9th Ave AmarilloWesley Senior Citizen Program Robert Ruiz Administrator [email protected] (806) 372-7960 1615 S Roberts Amarillo
Home Instead Senior Care [email protected](806) 353-6115 4148 Business Park Dr AmarilloMadison Street Retirement Apartments [email protected] (806) 371-7665 1506 Madison Amarillo
Amarillo Multiservice Center Jan Werner [email protected] (806) 374-5516 3108 S Fillmore AmarilloArbors (806) 355-1117 Medi Park Dr Amarillo
Browning Manor (806) 379-6115 2806 Browning Street AmarilloGeorgia Manor Nursing Home Administrator [email protected](806) 355-6517 2611 SW. 46th Amarillo
Harrington Assisted Living: Arbors Robert Smith (806) 355-1117 1300 S. Harrison St AmarilloKirkland Court Health & Rehabilitation Barbara Administrator (806) 355-8281 1601 Kirkland Amarillo
Vivian's Nursing Home 508 N. Taylor AmarilloWare Memorial Care Center Tom Ewing Transportation Director (806) 337-4191 400 West 14th St. Amarillo
DADS: Community Care for the Aged and Disabled Desha Henderson Supervisor [email protected](806) 356-3174 2406 West 6th AmarilloAmarillo City Transit Judy Phelps Director COA Transit [email protected] 806-378-6842 800 SE 23rd AmarilloPanhandle Community Services - Amarillo Johnny Raymond or Gerald PaytonExecutive Director [email protected] or [email protected](806) 372-2531 or (806) 372-2531 (ext 256)1309 W 8th Amarillo
Panhandle Transit Gerald Payton Transportation Director [email protected] (806) 372-2531 1309 West 8th AmarilloAmerican Cancer Society/Road to Recovery Angela Taylor Executive Director Amarillo Canyon (806) 353-4306 3915 Bell Amarillo
Amarillo Agency for Women 353-0900 PO Box 31012 AmarilloMartha's Home Melissa Chatman [email protected] (806) 372-4035 1204 West 18th Amarillo
Amarillo Community Center-Child Care Program: Mid-town YMCA [email protected] (806) 376-7021 609 S. Carolina AmarilloBig Brother Big Sister of the Texas Panhandle Darcie [email protected] (806) 351-2210 720 South Tyler Street, B-130 Amarillo
Cal Farley's Boy's Ranch Tom Novak [email protected] (806) 373-6600 P.O. Box 1890 AmarilloCampfire USA Panhandle Plains Council [email protected] (806) 373-7922 2808 Canyon Drive Amarillo
Girl Scouts - Five Star Council [email protected] (806) 356-0096 6011 West 45th AmarilloHead Start/Early Head Start Program (Region 16) Carroll Thomason Center Manager [email protected] (806) 677-5350 5800 Bell St Amarillo
Kiwanis Club (806) 376-7361 902 S. Monroe AmarilloMaverick Boys and Girls Clubs of Amarillo David Rodriguez Director [email protected] (806) 372-8393 1923 S. Lincoln AmarilloOpportunity School, Inc (Central Campus) Patt Mathis Director [email protected] (806) 373-4245 1103 S Van Buren Amarillo
YMCA Debbie Wright CEO (806) 374-4651 816 Van Buren AmarilloAmarillo ISD Judy Brewster [email protected] (806) 354-4200 7200 I-40 West Amarillo
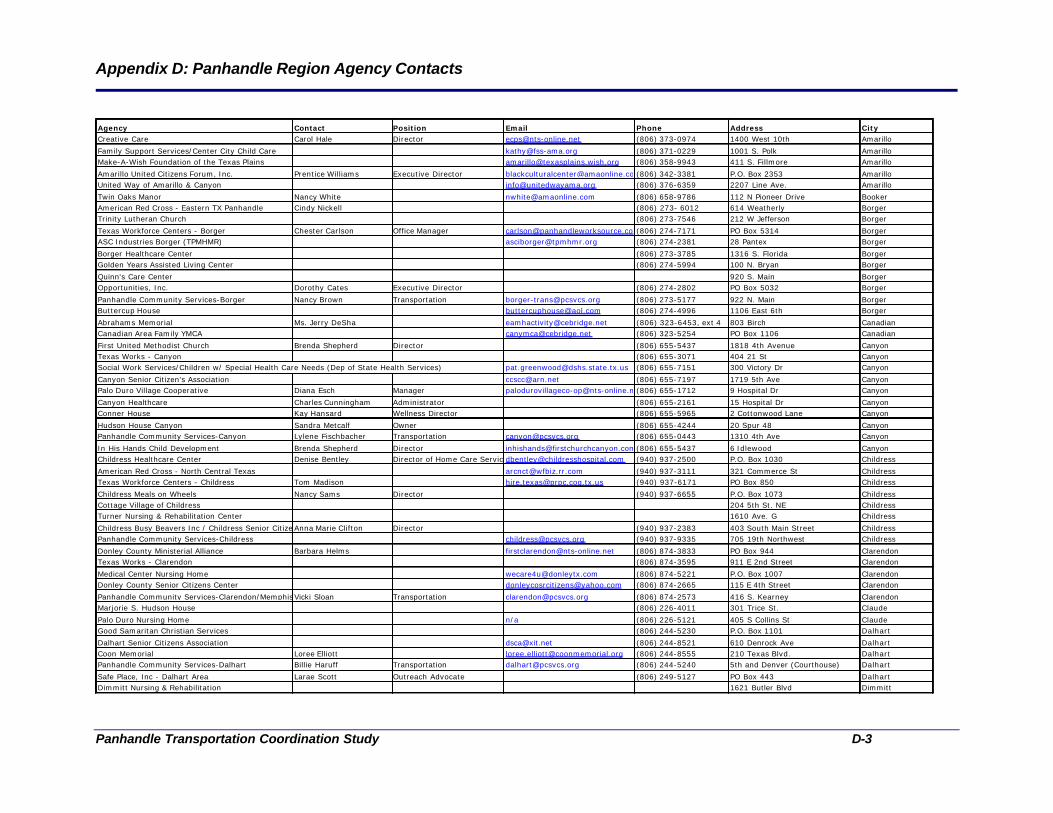
Appendix D: Panhandle Region Agency Contacts
Panhandle Transportation Coordination Study D-3
Agency Contact Position Email Phone Address CityCreative Care Carol Hale Director [email protected] (806) 373-0974 1400 West 10th Amarillo
Family Support Services/Center City Child Care [email protected] (806) 371-0229 1001 S. Polk AmarilloMake-A-Wish Foundation of the Texas Plains [email protected] (806) 358-9943 411 S. Fillmore Amarillo
Amarillo United Citizens Forum, Inc. Prentice Williams Executive Director [email protected](806) 342-3381 P.O. Box 2353 AmarilloUnited Way of Amarillo & Canyon [email protected] (806) 376-6359 2207 Line Ave. Amarillo
Twin Oaks Manor Nancy White [email protected] (806) 658-9786 112 N Pioneer Drive BookerAmerican Red Cross - Eastern TX Panhandle Cindy Nickell (806) 273- 6012 614 Weatherly BorgerTrinity Lutheran Church (806) 273-7546 212 W Jefferson Borger
Texas Workforce Centers - Borger Chester Carlson Office Manager [email protected](806) 274-7171 PO Box 5314 BorgerASC Industries Borger (TPMHMR) [email protected] (806) 274-2381 28 Pantex Borger
Borger Healthcare Center (806) 273-3785 1316 S. Florida BorgerGolden Years Assisted Living Center (806) 274-5994 100 N. Bryan Borger
Quinn's Care Center 920 S. Main BorgerOpportunities, Inc. Dorothy Cates Executive Director (806) 274-2802 PO Box 5032 Borger
Panhandle Community Services-Borger Nancy Brown Transportation [email protected] (806) 273-5177 922 N. Main BorgerButtercup House [email protected] (806) 274-4996 1106 East 6th Borger
Abrahams Memorial Ms. Jerry DeSha [email protected] (806) 323-6453, ext 4 803 Birch CanadianCanadian Area Family YMCA [email protected] (806) 323-5254 PO Box 1106 Canadian
First United Methodist Church Brenda Shepherd Director (806) 655-5437 1818 4th Avenue CanyonTexas Works - Canyon (806) 655-3071 404 21 St CanyonSocial Work Services/Children w/ Special Health Care Needs (Dep of State Health Services) [email protected] (806) 655-7151 300 Victory Dr Canyon
Canyon Senior Citizen's Association [email protected] (806) 655-7197 1719 5th Ave CanyonPalo Duro Village Cooperative Diana Esch Manager [email protected](806) 655-1712 9 Hospital Dr Canyon
Canyon Healthcare Charles Cunningham Administrator (806) 655-2161 15 Hospital Dr CanyonConner House Kay Hansard Wellness Director (806) 655-5965 2 Cottonwood Lane Canyon
Hudson House Canyon Sandra Metcalf Owner (806) 655-4244 20 Spur 48 CanyonPanhandle Community Services-Canyon Lylene Fischbacher Transportation [email protected] (806) 655-0443 1310 4th Ave Canyon
In His Hands Child Development Brenda Shepherd Director [email protected](806) 655-5437 6 Idlewood CanyonChildress Healthcare Center Denise Bentley Director of Home Care [email protected] (940) 937-2500 P.O. Box 1030 Childress
American Red Cross - North Central Texas [email protected] (940) 937-3111 321 Commerce St ChildressTexas Workforce Centers - Childress Tom Madison [email protected] (940) 937-6171 PO Box 850 Childress
Childress Meals on Wheels Nancy Sams Director (940) 937-6655 P.O. Box 1073 ChildressCottage Village of Childress 204 5th St. NE ChildressTurner Nursing & Rehabilitation Center 1610 Ave. G Childress
Childress Busy Beavers Inc / Childress Senior Citizens CenterAnna Marie Clifton Director (940) 937-2383 403 South Main Street ChildressPanhandle Community Services-Childress [email protected] (940) 937-9335 705 19th Northwest Childress
Donley County Ministerial Alliance Barbara Helms [email protected] (806) 874-3833 PO Box 944 ClarendonTexas Works - Clarendon (806) 874-3595 911 E 2nd Street Clarendon
Medical Center Nursing Home [email protected] (806) 874-5221 P.O. Box 1007 ClarendonDonley County Senior Citizens Center [email protected] (806) 874-2665 115 E 4th Street Clarendon
Panhandle Community Services-Clarendon/MemphisVicki Sloan Transportation [email protected] (806) 874-2573 416 S. Kearney ClarendonMarjorie S. Hudson House (806) 226-4011 301 Trice St. Claude
Palo Duro Nursing Home n/a (806) 226-5121 405 S Collins St ClaudeGood Samaritan Christian Services (806) 244-5230 P.O. Box 1101 Dalhart
Dalhart Senior Citizens Association [email protected] (806) 244-8521 610 Denrock Ave DalhartCoon Memorial Loree Elliott [email protected] (806) 244-8555 210 Texas Blvd. DalhartPanhandle Community Services-Dalhart Billie Haruff Transportation [email protected] (806) 244-5240 5th and Denver (Courthouse) Dalhart
Safe Place, Inc - Dalhart Area Larae Scott Outreach Advocate (806) 249-5127 PO Box 443 DalhartDimmitt Nursing & Rehabilitation 1621 Butler Blvd Dimmitt
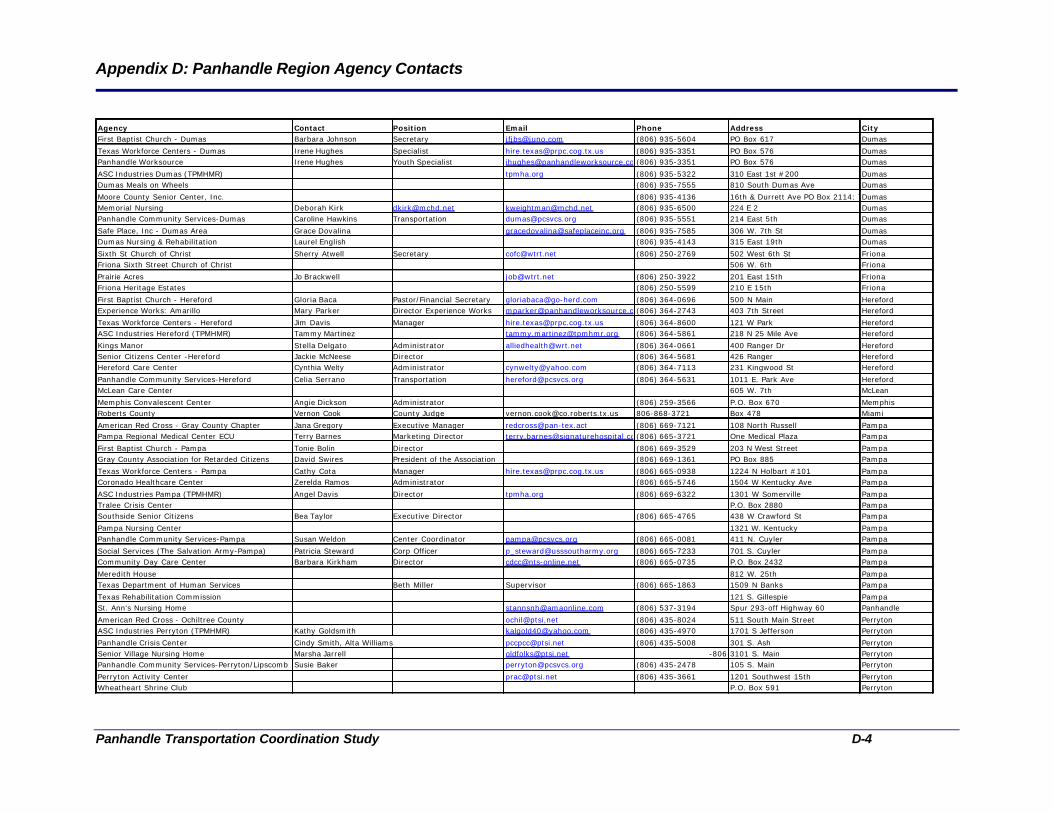
Appendix D: Panhandle Region Agency Contacts
Panhandle Transportation Coordination Study D-4
Agency Contact Position Email Phone Address CityFirst Baptist Church - Dumas Barbara Johnson Secretary [email protected] (806) 935-5604 PO Box 617 Dumas
Texas Workforce Centers - Dumas Irene Hughes Specialist [email protected] (806) 935-3351 PO Box 576 DumasPanhandle Worksource Irene Hughes Youth Specialist [email protected](806) 935-3351 PO Box 576 Dumas
ASC Industries Dumas (TPMHMR) tpmha.org (806) 935-5322 310 East 1st #200 DumasDumas Meals on Wheels (806) 935-7555 810 South Dumas Ave Dumas
Moore County Senior Center, Inc. (806) 935-4136 16th & Durrett Ave PO Box 2114; 79029DumasMemorial Nursing Deborah Kirk [email protected] [email protected] (806) 935-6500 224 E 2 DumasPanhandle Community Services-Dumas Caroline Hawkins Transportation [email protected] (806) 935-5551 214 East 5th Dumas
Safe Place, Inc - Dumas Area Grace Dovalina [email protected] (806) 935-7585 306 W. 7th St DumasDumas Nursing & Rehabilitation Laurel English (806) 935-4143 315 East 19th Dumas
Sixth St Church of Christ Sherry Atwell Secretary [email protected] (806) 250-2769 502 West 6th St FrionaFriona Sixth Street Church of Christ 506 W. 6th Friona
Prairie Acres Jo Brackwell [email protected] (806) 250-3922 201 East 15th FrionaFriona Heritage Estates (806) 250-5599 210 E 15th Friona
First Baptist Church - Hereford Gloria Baca Pastor/Financial Secretary [email protected] (806) 364-0696 500 N Main HerefordExperience Works: Amarillo Mary Parker Director Experience Works [email protected](806) 364-2743 403 7th Street Hereford
Texas Workforce Centers - Hereford Jim Davis Manager [email protected] (806) 364-8600 121 W Park HerefordASC Industries Hereford (TPMHMR) Tammy Martinez [email protected] (806) 364-5861 218 N 25 Mile Ave Hereford
Kings Manor Stella Delgato Administrator [email protected] (806) 364-0661 400 Ranger Dr HerefordSenior Citizens Center -Hereford Jackie McNeese Director (806) 364-5681 426 Ranger HerefordHereford Care Center Cynthia Welty Administrator [email protected] (806) 364-7113 231 Kingwood St Hereford
Panhandle Community Services-Hereford Celia Serrano Transportation [email protected] (806) 364-5631 1011 E. Park Ave HerefordMcLean Care Center 605 W. 7th McLean
Memphis Convalescent Center Angie Dickson Administrator (806) 259-3566 P.O. Box 670 MemphisRoberts County Vernon Cook County Judge [email protected] 806-868-3721 Box 478 Miami
American Red Cross - Gray County Chapter Jana Gregory Executive Manager [email protected] (806) 669-7121 108 North Russell PampaPampa Regional Medical Center ECU Terry Barnes Marketing Director [email protected](806) 665-3721 One Medical Plaza Pampa
First Baptist Church - Pampa Tonie Bolin Director (806) 669-3529 203 N West Street PampaGray County Association for Retarded Citizens David Swires President of the Association (806) 669-1361 PO Box 885 Pampa
Texas Workforce Centers - Pampa Cathy Cota Manager [email protected] (806) 665-0938 1224 N Holbart #101 PampaCoronado Healthcare Center Zerelda Ramos Administrator (806) 665-5746 1504 W Kentucky Ave Pampa
ASC Industries Pampa (TPMHMR) Angel Davis Director tpmha.org (806) 669-6322 1301 W Somerville PampaTralee Crisis Center P.O. Box 2880 PampaSouthside Senior Citizens Bea Taylor Executive Director (806) 665-4765 438 W Crawford St Pampa
Pampa Nursing Center 1321 W. Kentucky PampaPanhandle Community Services-Pampa Susan Weldon Center Coordinator [email protected] (806) 665-0081 411 N. Cuyler Pampa
Social Services (The Salvation Army-Pampa) Patricia Steward Corp Officer [email protected] (806) 665-7233 701 S. Cuyler PampaCommunity Day Care Center Barbara Kirkham Director [email protected] (806) 665-0735 P.O. Box 2432 Pampa
Meredith House 812 W. 25th PampaTexas Department of Human Services Beth Miller Supervisor (806) 665-1863 1509 N Banks Pampa
Texas Rehabilitation Commission 121 S. Gillespie PampaSt. Ann's Nursing Home [email protected] (806) 537-3194 Spur 293-off Highway 60 Panhandle
American Red Cross - Ochiltree County ochil@ptsi,net (806) 435-8024 511 South Main Street PerrytonASC Industries Perryton (TPMHMR) Kathy Goldsmith [email protected] (806) 435-4970 1701 S Jefferson Perryton
Panhandle Crisis Center Cindy Smith, Alta Williams [email protected] (806) 435-5008 301 S. Ash PerrytonSenior Village Nursing Home Marsha Jarrell [email protected] -806 3101 S. Main PerrytonPanhandle Community Services-Perryton/Lipscomb Susie Baker [email protected] (806) 435-2478 105 S. Main Perryton
Perryton Activity Center [email protected] (806) 435-3661 1201 Southwest 15th PerrytonWheatheart Shrine Club P.O. Box 591 Perryton
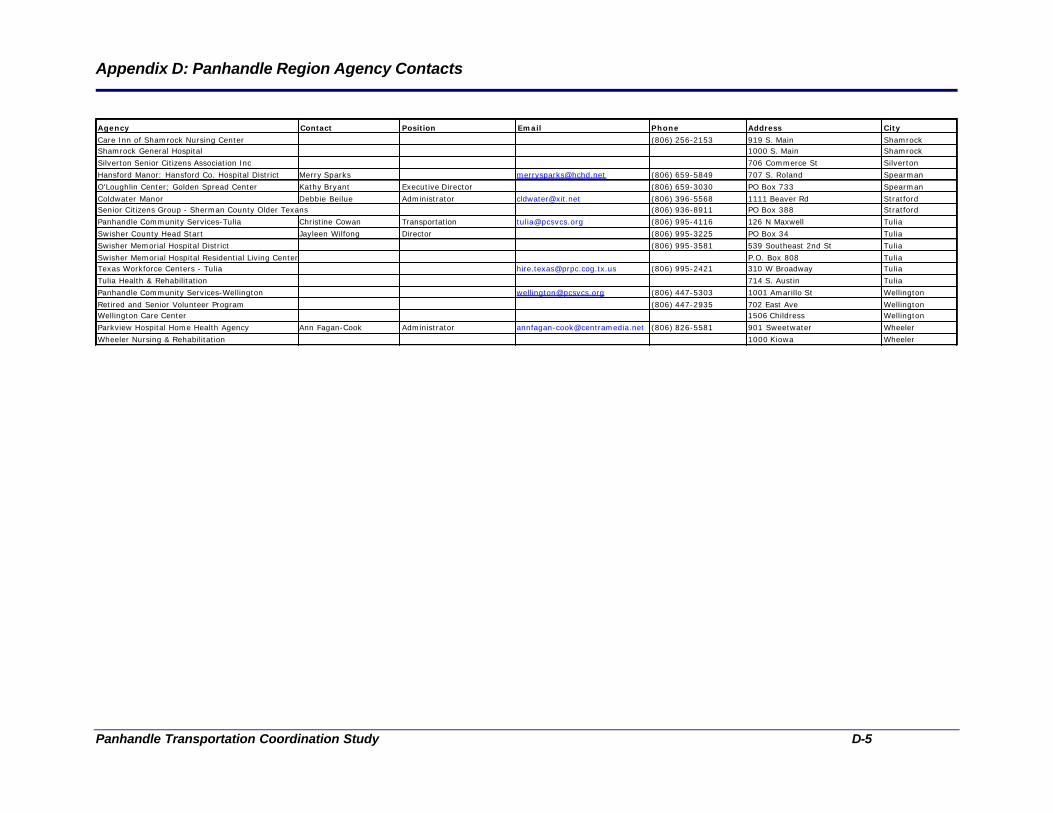
Appendix D: Panhandle Region Agency Contacts
Panhandle Transportation Coordination Study D-5
Agency Contact Position Email Phone Address City
Care Inn of Shamrock Nursing Center (806) 256-2153 919 S. Main ShamrockShamrock General Hospital 1000 S. Main Shamrock
Silverton Senior Citizens Association Inc 706 Commerce St Silverton
Hansford Manor: Hansford Co. Hospital District Merry Sparks [email protected] (806) 659-5849 707 S. Roland Spearman
O'Loughlin Center; Golden Spread Center Kathy Bryant Executive Director (806) 659-3030 PO Box 733 Spearman
Coldwater Manor Debbie Beilue Administrator [email protected] (806) 396-5568 1111 Beaver Rd StratfordSenior Citizens Group - Sherman County Older Texans (806) 936-8911 PO Box 388 Stratford
Panhandle Community Services-Tulia Christine Cowan Transportation [email protected] (806) 995-4116 126 N Maxwell Tulia
Swisher County Head Start Jayleen Wilfong Director (806) 995-3225 PO Box 34 Tulia
Swisher Memorial Hospital District (806) 995-3581 539 Southeast 2nd St Tulia
Swisher Memorial Hospital Residential Living Center P.O. Box 808 TuliaTexas Workforce Centers - Tulia [email protected] (806) 995-2421 310 W Broadway Tulia
Tulia Health & Rehabilitation 714 S. Austin Tulia
Panhandle Community Services-Wellington [email protected] (806) 447-5303 1001 Amarillo St Wellington
Retired and Senior Volunteer Program (806) 447-2935 702 East Ave WellingtonWellington Care Center 1506 Childress Wellington
Parkview Hospital Home Health Agency Ann Fagan-Cook Administrator [email protected] (806) 826-5581 901 Sweetwater Wheeler
Wheeler Nursing & Rehabilitation 1000 Kiowa Wheeler
Appendix E: Panhandle Transportation Coordination Survey
Panhandle Transportation Coordination Study E- 1
Panhandle Transportation Coordination Survey
The Panhandle Transportation Coordination Survey consisted of 42 questions divided into four
parts. Part I provides contact information. Part II defines service characteristics. Part III details
transportation issues. Part IV explores receptivity to coordination strategies. The survey was
sent to 221 agencies and 52 agencies responded, yielding a 25 percent response rate. Given that,
the results are statistically significant; however, it is cautioned that the results be conservatively
extrapolated.
Part I consisted of Questions 1 through 11 and provided respondent contact information. For
Panhandle Transit and Texas Workforce Commission, survey invitations were sent to and replies
were received from multiple offices of these agencies in order to gain an understanding of
local/county level concerns and perspectives. The results from these questions are not presented.
Part II consisted of Questions 12 through 17 and provided information about the responding
organization - specifically type of organization, service area, type of client served and other
agencies served.
• Most of the respondents identified themselves as representing agencies that are private,
nonprofit transportation (15 percent) or federal or state human service agencies (21
percent). Organization types that had very low representation include for-profit
transportation company (0 responses) and municipal and county governments (2
responses). Consequently, the survey will be highly reflective of only a segment of the
target market. (Note: The lack of survey response by some groups led the consultant
team to follow-up with phone calls to county judge and city manager offices. The result
of this follow-up work is summarized in Appendix F: Elected Official Survey.)
• The survey reflects service areas that touch each of the Panhandle’s 26 counties. This is
due, in part, to response from Panhandle Transit, which serves the entire region and
federal and state agencies which also have regional responsibilities. Counties that have
minimal representation other than that provided by regional service providers (0 or 1
agency responding) include Armstrong, Brisco, Castro, Hemphill and Parmer counties.

Appendix E: Panhandle Transportation Coordination Survey
Panhandle Transportation Coordination Study E- 2
Of these, Brisco, Castro, and Parmer counties may have a higher potential transit needs as
measured by the Transit Needs Index. (See Chapter 1: Background.) Future iterations of
coordination planning may concentrate more on learning about transit needs in this region
through more intensive outreach to these areas.
• Type of client that was most frequently served was elderly and/or disabled (40 percent).
Fourteen respondents indicated that they serve other agencies and the one most frequently
cited was the Health and Human Services Commission. Other agencies mentioned
included Child Protective Services and law enforcement agencies.
Part III: Questions 18 through 34 provide transportation-related information: travel patterns,
access to transportation services, trip needs, type of service provided. (Note: In the following
detailed results, Questions 23: What Days is Service Impossible to Obtain and Question 24:
What Days is Service Difficult to Obtain has been combined since the responses were virtually
identical. Likewise, Question 25: What Time is Service Impossible to Obtain and Question 26:
What Time is Service Difficult to Obtain have been combined. Lastly Question 30: In the next 1-
5 years, is your agency planning a significant expansion of services and Question 31: In the next
1-5 years, is your agency planning to construct a new facility were eliminated as there were no
significant responses to these questions.)
• Access to Transportation Services: Access to transportation is most difficult on
weekends and between the hours of 5:00 pm and 12:00 midnight. Forty-one percent of
respondents indicated that they could access transportation services seven days a week
and a number indicated that they had no difficulty delivering trips, no matter what the
time. These respondents were most frequently assisted living or nursing homes with
access to their own transportation resources.
• Trip Needs: Sixty percent of respondents indicated transportation prevented their clients
from receiving services, at least sometimes. Sources of the difficulty most commonly
cited included the need for trips with less than 24-hours notification and for work trips
located outside service areas. Of those agencies that responded to this question, most
reported ten or fewer trips unmet. The agency reporting the highest level of unmet trips is
Appendix E: Panhandle Transportation Coordination Survey
Panhandle Transportation Coordination Study E- 3
the Panhandle Health and Human Services Commission (400 trips/month). Large transit
providers indicated very few missed trips. The discrepancy between these two responses
may reflect that missed trips are occurring outside of current operating hours. Conversely,
they may also represent riders choosing to forego trips because they are unable to meet
the 24-hour notification requirement.
• Type of Transit Service Needed: Most respondents indicated that they concentrate on
serving the elderly and disabled population. Consequently, medical and
shopping/personal trips rank high the types of trips needed. Work and education related
trips were also frequently cited.
• Type of Transit Service Provided: Thirty-one percent of the respondents indicated that
they do not provide transportation; many of these were small assisted living or nursing
centers or social service agencies that serve the very-low income and homeless
populations. However, the Department of State Health Services also responded that they
do not provide or arrange for transportation. Many agencies indicated that they arrange
for transportation. The largest of these were state agencies: the Health and Human
Services Commission and the Department of Rehabilitative Services. Direct providers
include Amarillo City Transit, Panhandle Community Service, Amarillo YMCA, and a
number of assisted living and nursing center. Other providers noted include Greyhound,
Volunteers (Moore County Senior Center and Harrington Cancer Center), and Medicaid.
• Number of Trips Provided: Almost 40 percent of the organizations provided less than 10
trips per month. These included the smaller social service agencies and some assisted
living and nursing centers. Large transit-focused organizations deliver over 10,000 trips
per month.
Part IV: Questions 35 through 42 were directed to organizations that directly provide or arrange
for transit services and were focused on issues of transit coordination.
Appendix E: Panhandle Transportation Coordination Survey
Panhandle Transportation Coordination Study E- 4
Greatest Challenges to Providing Transportation: Lack of funding, rural service delivery area
and a lack of awareness of transportation options were listed as the most significant challenges
faced in providing service.
Interest in Coordination: Out of those organizations that do provide service, more organizations
indicated that they were “Not Interested” in pursuing any coordination strategy. The strategy
that solicited the most interest was “Modifying Fixed Routes” followed by “Working Together to
Purchase Service.” Future coordination workshops may choose to address these issues with
these organizations. Moreover, future coordination planning efforts may need to more fully
explore the source of resistance to coordinating resources and to inform agencies about transit
coordination.

Appendix E: Panhandle Transportation Coordination Survey
Panhandle Transportation Coordination Study E- 5
Q13: What types of clients do you serve? A13: General Public, Elderly, Persons with Disabilities, Welfare-to-Work, Clients of My Agency, Clients of another Agency, Other (Please specify.) There were 54 respondents to this question. Nineteen organizations (or 35 percent) served a single client base. These organizations usually indicated service restriction to “Elderly” or “Clients of my Agency” and are predominantly nursing homes and assisted living centers. Nearly 50 percent (26 respondents) indicated both “Elderly” and “Persons with Disabilities” as the client based served. In total, organizations that serve the elderly or people with disabilities constituted nearly 70 percent of the respondents. On average, organizations usually served more than one type of client, averaging three types of client bases served. The most common type of client reported under the “Other” category is “children” and had five respondents. Transit coordination in the Panhandle region is facilitated by the large number of organizations that serve multiple client bases. Since populations that are typically heavy transit users are receiving service from similar agencies, the potential to deliver coordinated service is enhanced. In fact, that is the experience currently in the Panhandle as transit agencies are already delivering trips to a large number of health and social service agencies that serve these populations.
Q13: What Type of Clients Do You Serve?
33, 21%
34, 22%
29, 18%
8, 5%
25, 16%
13, 8%
15, 10%
General Public Elderly Persons with DisabilitiesWelfare-to-Work Clients of my Agency Clients of another AgencyOther (please specify)
Results of Organzations that Do Not Provide Transit Services
25, 22%
22, 20%
19, 17%
7, 6%
18, 16%
10, 9%
11, 10%
All Respondents

Appendix E: Panhandle Transportation Coordination Survey
Panhandle Transportation Coordination Study E- 6
Q15: What Counties Do You Regularly Serve?
14
1419
13
1617
19
1615
1816
19
2017
2219
20
1916
1331
20
1918
13
18
0 5 10 15 20 25 30 35
Armstrong
Briscoe
Carson
Castro
Childress
Collingsworth
Dallam
Deaf Smith
Donley
Gray
Hall
Hansford
Hartley
Hemphill
Hutchinson
Lipscomb
Moore
Ochiltree
Oldham
Parmer
Potter
Randall
Roberts
Sherman
Swisher
Wheeler
County totals nclude agencies that serve Top 26 and Top 15 counties
Q15: Which counties does your agency regularly serve? (Check all that apply.) A15: Top 26 counties, Top 15 counties, Armstrong, Briscoe, Carson, Castro, Childress, Collingsworth, Dallam, Deaf Smith, Donley, Gray, Hall, Hansford, Hartley, Hemphill, Hutchinson, Lipscomb, Moore, Ochiltree, Oldham, Parmer, Potter, Randall, Roberts, Sherman, Swisher, and Wheeler
1
There were 50 respondents to this question. The survey was sent to agencies and organizations that are active throughout the region in order to try to obtain insights that would be representative of the entire region. Thirteen respondents served the top 26 counties and 3 respondents served the top 15 counties. Nine agencies serve only Potter and Randall counties. Counties with no respondents other than that given by agencies with a region wide service area include Castro and Parmer counties; Hemphill County had one respondent. The high response rate from region-wide agencies and/ Potter and Randall county agencies may skew the results to reflect more small-urban and region-wide issues rather than issues relative to the more rural counties. However, Panhandle Transit has been deeply involved in the study and has a strong presence throughout all the counties and its involvement will circumvent any inappropriate emphasis on one region or area.
1 Top 26 counties include all the counties listed. Top 15 counties include all listed counties except for Deaf Smith, Randall, Armstrong, Donley, Collingsworth, Parmer, Castro, Swisher, Briscoe, Hall, and Childress.
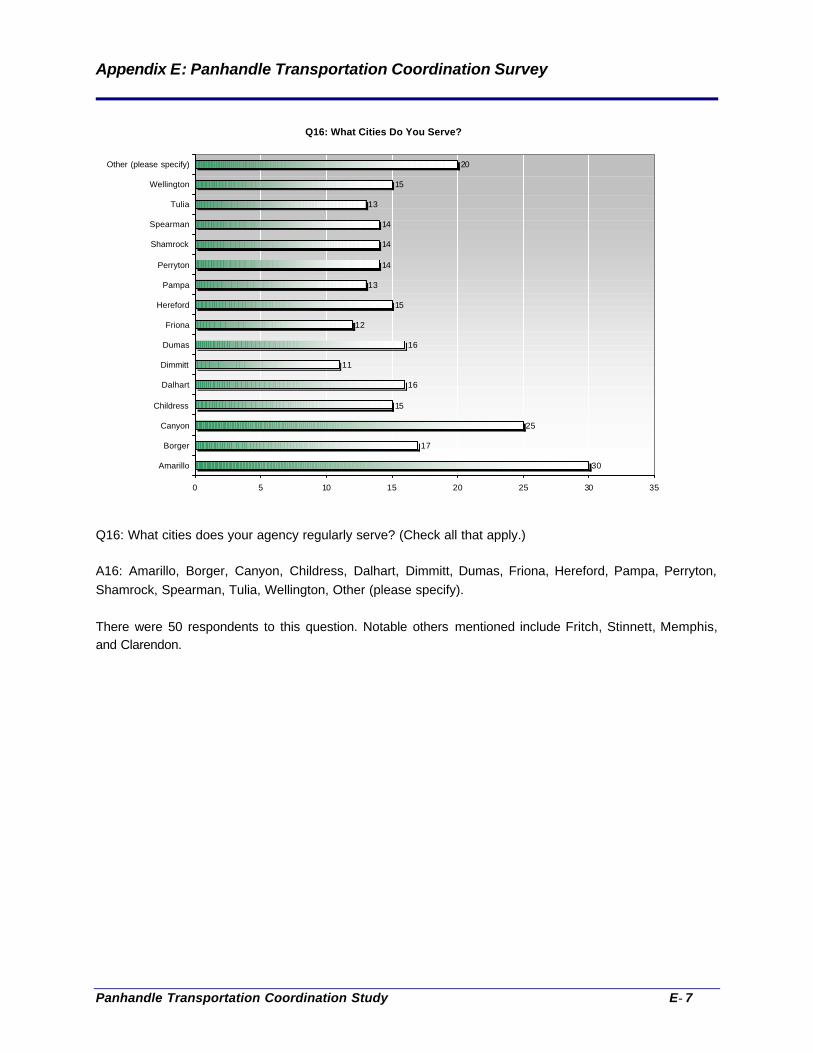
Appendix E: Panhandle Transportation Coordination Survey
Panhandle Transportation Coordination Study E- 7
Q16: What Cities Do You Serve?
30
17
25
15
16
11
16
12
15
13
14
14
14
13
15
20
0 5 10 15 20 25 30 35
Amarillo
Borger
Canyon
Childress
Dalhart
Dimmitt
Dumas
Friona
Hereford
Pampa
Perryton
Shamrock
Spearman
Tulia
Wellington
Other (please specify)
Q16: What cities does your agency regularly serve? (Check all that apply.) A16: Amarillo, Borger, Canyon, Childress, Dalhart, Dimmitt, Dumas, Friona, Hereford, Pampa, Perryton, Shamrock, Spearman, Tulia, Wellington, Other (please specify). There were 50 respondents to this question. Notable others mentioned include Fritch, Stinnett, Memphis, and Clarendon.
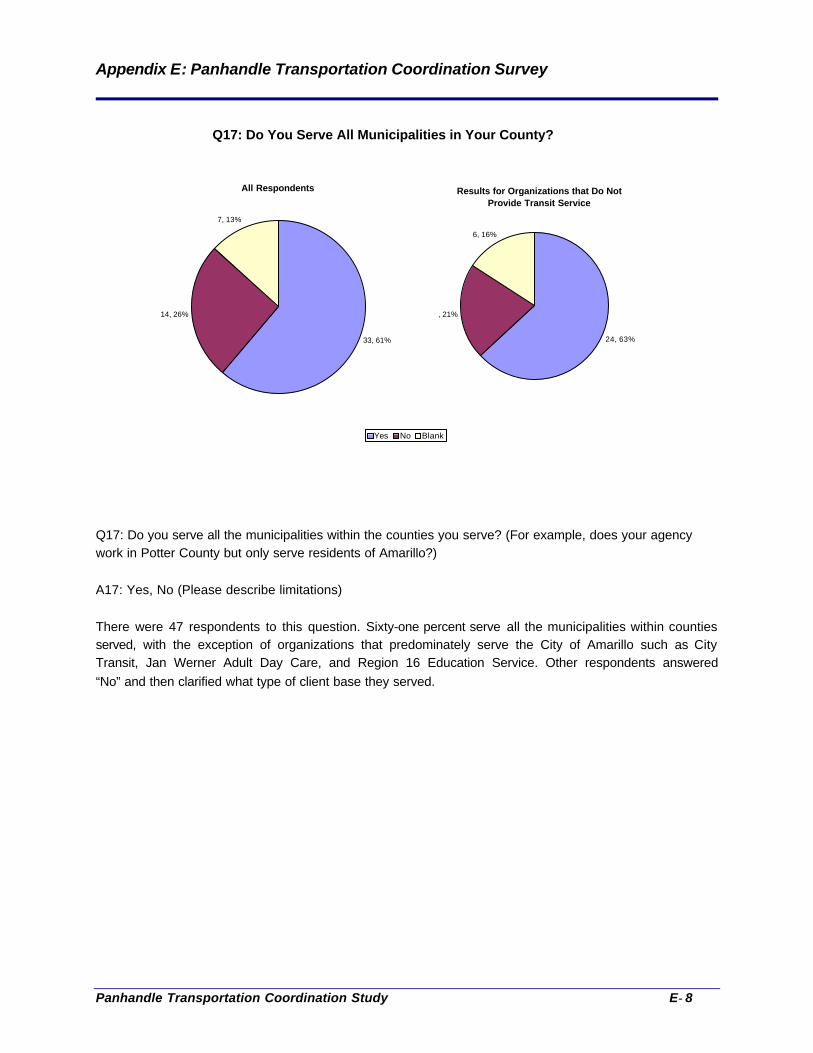
Appendix E: Panhandle Transportation Coordination Survey
Panhandle Transportation Coordination Study E- 8
Q17: Do You Serve All Municipalities in Your County?
33, 61%
14, 26%
7, 13%
Yes No Blank
Results for Organizations that Do Not Provide Transit Service
24, 63%
8, 21%
6, 16%
All Respondents
Q17: Do you serve all the municipalities within the counties you serve? (For example, does your agency work in Potter County but only serve residents of Amarillo?) A17: Yes, No (Please describe limitations) There were 47 respondents to this question. Sixty-one percent serve all the municipalities within counties served, with the exception of organizations that predominately serve the City of Amarillo such as City Transit, Jan Werner Adult Day Care, and Region 16 Education Service. Other respondents answered “No” and then clarified what type of client base they served.
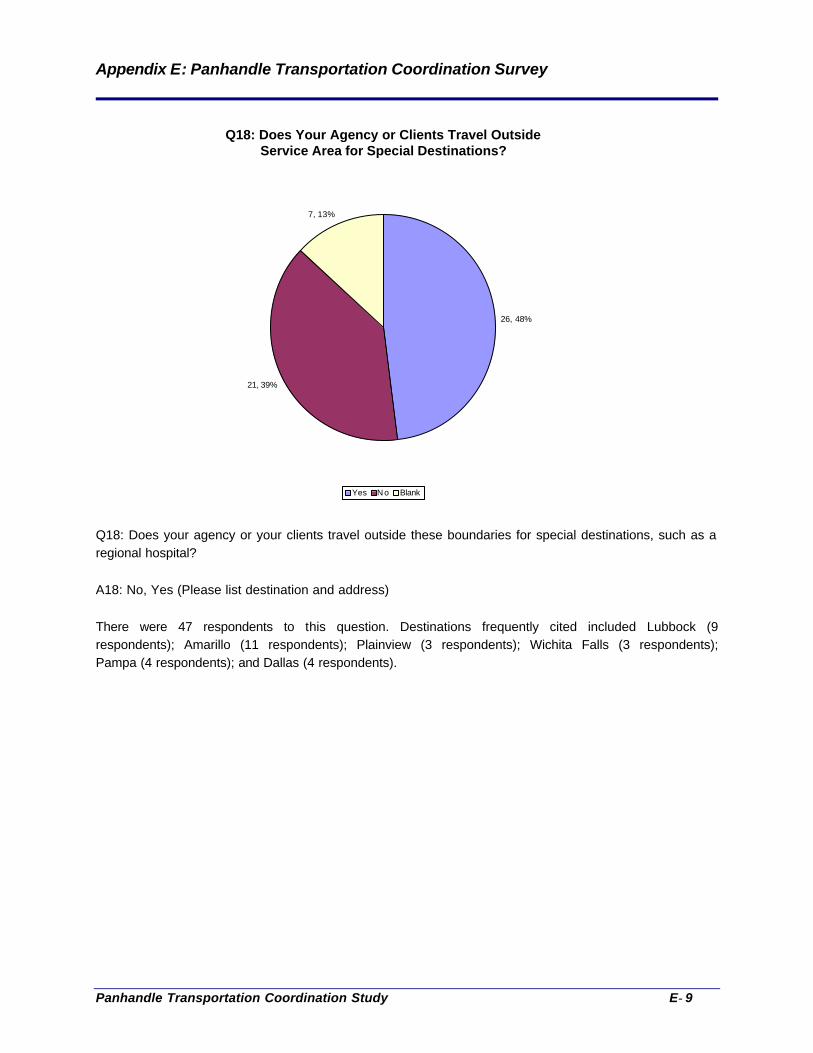
Appendix E: Panhandle Transportation Coordination Survey
Panhandle Transportation Coordination Study E- 9
Q18: Does Your Agency or Clients Travel Outside Service Area for Special Destinations?
26, 48%
21, 39%
7, 13%
Yes No Blank
Q18: Does your agency or your clients travel outside these boundaries for special destinations, such as a regional hospital? A18: No, Yes (Please list destination and address) There were 47 respondents to this question. Destinations frequently cited included Lubbock (9 respondents); Amarillo (11 respondents); Plainview (3 respondents); Wichita Falls (3 respondents); Pampa (4 respondents); and Dallas (4 respondents).
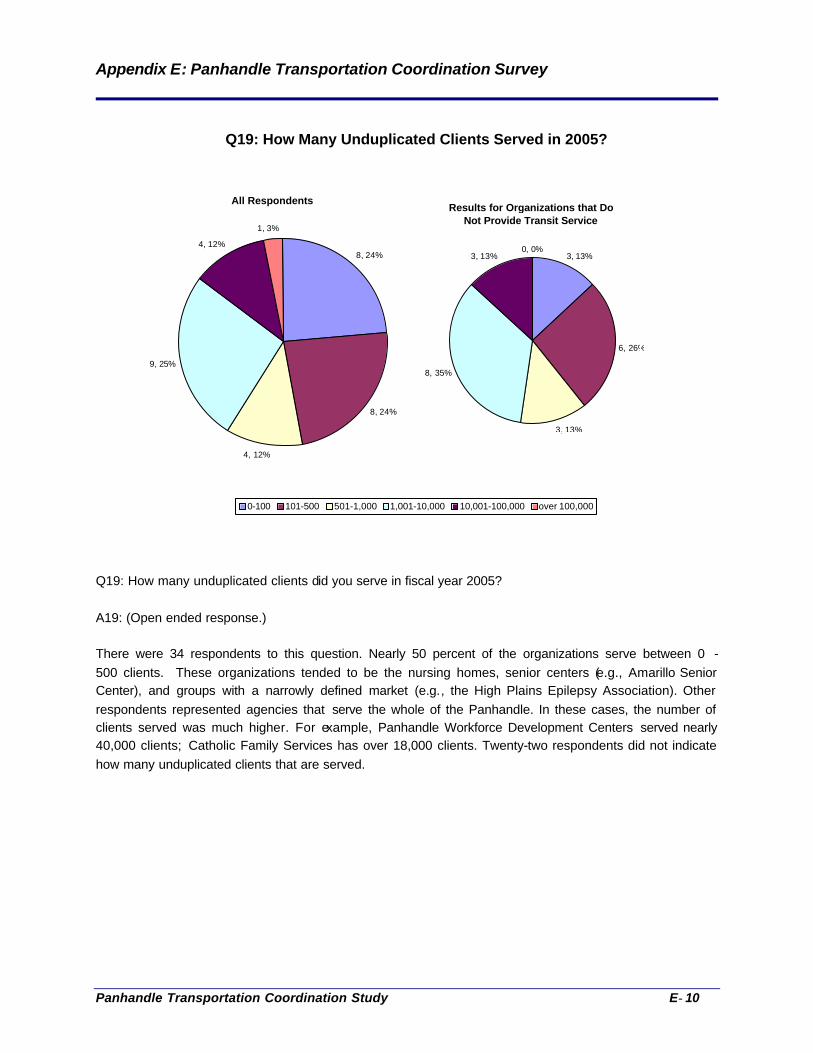
Appendix E: Panhandle Transportation Coordination Survey
Panhandle Transportation Coordination Study E- 10
Q19: How Many Unduplicated Clients Served in 2005?
8, 24%
8, 24%
4, 12%
9, 25%
4, 12%
1, 3%
0-100 101-500 501-1,000 1,001-10,000 10,001-100,000 over 100,000
Results for Organizations that Do Not Provide Transit Service
3, 13%
6, 26%
3, 13%
8, 35%
3, 13%0, 0%
All Respondents
Q19: How many unduplicated clients did you serve in fiscal year 2005? A19: (Open ended response.) There were 34 respondents to this question. Nearly 50 percent of the organizations serve between 0 - 500 clients. These organizations tended to be the nursing homes, senior centers (e.g., Amarillo Senior Center), and groups with a narrowly defined market (e.g., the High Plains Epilepsy Association). Other respondents represented agencies that serve the whole of the Panhandle. In these cases, the number of clients served was much higher. For example, Panhandle Workforce Development Centers served nearly 40,000 clients; Catholic Family Services has over 18,000 clients. Twenty-two respondents did not indicate how many unduplicated clients that are served.

Appendix E: Panhandle Transportation Coordination Survey
Panhandle Transportation Coordination Study E- 11
Q20: Does the Lack of Transportation Keep Peoplefrom Participating in Your Services?
8, 15%
24, 45%
12, 22%
4, 7%
2, 4%
4, 7%
Yes Sometimes No Don't Know Not Applicable Blank
Results for Organizations that Do Not Provide Transit Service
7, 18%
18, 47%
6, 16%
2, 5%
1, 3%
4, 11%
All Respondents
Q20: Does the lack of transportation keep people from participating in your agency’s services? A20: Yes, Sometimes, No, Don’t Know, Not Applicable There were 49 respondents to this question. Most people responded that they sometimes had trouble accessing transit services (24 out of 55 respondents or 44%). Comments included difficulty in accessing the International Airport, emergency transportation (transportation scheduled with less than 24 hours notice), and transportation to work-sites that are not located within Amarillo city limits. Agencies that did not directly provide transit services were 50 percent less likely to respond “No.” This may indicate that those agencies are satisfied with the level of transit service they are receiving from other agencies.

Appendix E: Panhandle Transportation Coordination Survey
Panhandle Transportation Coordination Study E- 12
Q21: Why is Transportation a Problem for Your Clients?
4, 8%
17, 32%
2, 4%
15, 29%
10, 19%
4, 8%
Don't know choices Not available Not available when I needDoes not go to my places Not suitable for clients Not enough funds
Results for Organizations that Do Not Provide Transit Service
3, 7%
3, 7%
9, 20%
14, 30%
2, 4%
15, 32%
All Respondents
Q21: If yes or sometimes, why is transportation a problem? (Check all that apply.) A21: I don’t know what my transportation choices are available in my area; Transportation is not available to my area; Transportation is not available to my area during the times I need; Transportation does not take my clients where they need to go; Transportation vehicles are not suitable to serve my clients; There are not enough funds to provide transportation to our client. There were 29 respondents to this question: 13 organizations named 1 problem, 7 organizations named 2 problems and 6 organizations named 3 problems. Taken together, “Not available when I need” or “Does not take my clients where they need to go” were 50 percent of the problems cited. The largest issue cited was “Transportation does not take my clients where they need to go” (17 out of 29 or 59% of respondents). Mentioned frequently was difficulty in accessing transportation to worksites located off the regular fixed bus route and to medical appointments. Rural area respondents also cited that they needed service after regular business hours (when Panhandle Transit stops providing service). Urban respondents cited the need for service after 7:00 (when Amarillo City Transit stops providing service). These results indicate the potential need for future coordination efforts to focus on filling after-hours service gap and distant worksite trip gap.

Appendix E: Panhandle Transportation Coordination Survey
Panhandle Transportation Coordination Study E- 13
Q22: How Many Trips per Month are Unmet?
4, 21%
1, 5%
4, 21%
10, 53%
0-10 11-50 51-100 over 100
Results from Organizations that Do Not Provide Transit Service
16, 64%
6, 24%
3, 12%
0, 0%
0, 0%
All Respondents
Q22: In your best opinion, approximately how many trips per month are unmet? A22: (Open-ended response.) There were 25 respondents to this question. Of those responding, over half miss less than 10 trips per month. The largest provider of trips, Panhandle Transit, indicates between 0 missed trips (as reported from the headquarters) to a number of missed trips (as reported by a local office). The difference in responses would indicate that, on a local level, schedulers may be aware of missed trips that are not reported to the headquarters or, simply, a discrepancy in reporting. Respondents that indicated a high number of unmet agency-related trips include the Health and Human Services Commission (estimate of 300 missed trips); Amarillo Area YMCA (estimate of 150 missed trips); Amarillo Senior Citizen Association (estimate of 75 missed trips); and Panhandle Workforce Development Centers (estimate of 30 missed trips). Respondents that do not directly provide transit or health and human services included a local citizen representing the public transportation community in Amarillo (estimate of 200 missed trips); the Panhandle Regional Planning Commission (estimate of 300 missed trips). Over half of the respondents left this question blank or responded “unsure.” This result would support the finding that many health and social service providers do not track their transportation services and needs like transit-focused agencies. One of the barriers that may be encountered in developing a coordinated system will the difficulty in moving toward a more standardized approach to reporting transit service deliver. Future coordination efforts may focus agencies with high unmet trip needs (HHSC, Panhandle Workforce Development Centers, Amarillo Senior Citizen Center, and Amarillo Area YMCA).

Appendix E: Panhandle Transportation Coordination Survey
Panhandle Transportation Coordination Study E- 14
Q23: Days on Which Service is Impossible to Obtain
8, 11%
9, 12%
6, 8%
8, 11%
7, 9%
18, 25%
18, 24%
Monday Tuesday Wednesday Thursday Friday Saturday Sunday
Results for Organizations that Do Not Provide Transit Service
6, 11%
7, 13%
4, 7%
6, 11%
5, 9%
14, 25%
13, 24%
All Respondents
Q23: Days on which service is needed but difficult or impossible to obtain A23: Monday, Tuesday, Wednesday, Thursday, Friday, Saturday, Sunday There were 52 respondents to this question. Out of 52 responses, 31 respondents (or 41%) said that they could access transportation services every day of the week. For those that indicated that transit was difficult or impossible to access at least some of the time, Saturdays and Sundays were the most frequently mentioned (36 out of 74 or 49%). The responses of all the agencies and only those agencies that do not provide transit are nearly identical. This may indicate that there is no discrepancy of information regarding days of services between providers and consumers of transit. Respondents indicated equal difficulty in obtaining service Monday through Friday. Four organizations responded that service was impossible to obtain every day; these included Salvation Army, Amarillo Senior Citizen Center, Amarillo YMCA, and one office of the Panhandle Workforce Development Centers. Five organizations responded that service was difficult to obtain every week day; these included Donley County Ministerial Alliance, Canyons Retirement Community, Health and Human Service Commission, Department of State Health Services, and one Panhandle Workforce Development Center. Because Panhandle Transit does not provide service on weekends and Amarillo City Transit does not provide service on Sundays, a transit gap is created that the RTAG may choose to focus on as a coordination priority.
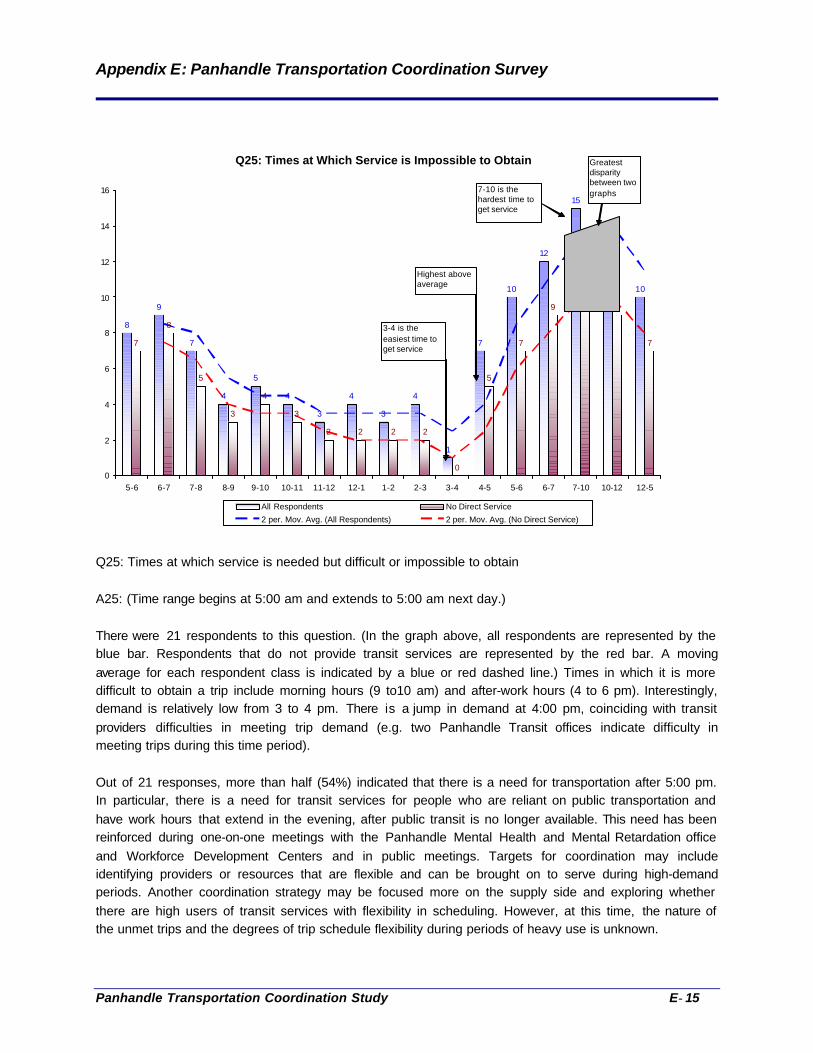
Appendix E: Panhandle Transportation Coordination Survey
Panhandle Transportation Coordination Study E- 15
Q25: Times at Which Service is Impossible to Obtain
8
9
7
4
5
4
3
4
3
4
1
7
10
12
15
13
10
7
8
5
3
4
3
2 2 2 2
0
5
7
9
11
9
7
0
2
4
6
8
10
12
14
16
5-6 6-7 7-8 8-9 9-10 10-11 11-12 12-1 1-2 2-3 3-4 4-5 5-6 6-7 7-10 10-12 12-5
All Respondents No Direct Service
2 per. Mov. Avg. (All Respondents) 2 per. Mov. Avg. (No Direct Service)
3-4 is the easiest time to get service
7-10 is the hardest time to get service
Highest above average
Greatest disparity between two graphs
Q25: Times at which service is needed but difficult or impossible to obtain A25: (Time range begins at 5:00 am and extends to 5:00 am next day.) There were 21 respondents to this question. (In the graph above, all respondents are represented by the blue bar. Respondents that do not provide transit services are represented by the red bar. A moving average for each respondent class is indicated by a blue or red dashed line.) Times in which it is more difficult to obtain a trip include morning hours (9 to10 am) and after-work hours (4 to 6 pm). Interestingly, demand is relatively low from 3 to 4 pm. There is a jump in demand at 4:00 pm, coinciding with transit providers difficulties in meeting trip demand (e.g. two Panhandle Transit offices indicate difficulty in meeting trips during this time period). Out of 21 responses, more than half (54%) indicated that there is a need for transportation after 5:00 pm. In particular, there is a need for transit services for people who are reliant on public transportation and have work hours that extend in the evening, after public transit is no longer available. This need has been reinforced during one-on-one meetings with the Panhandle Mental Health and Mental Retardation office and Workforce Development Centers and in public meetings. Targets for coordination may include identifying providers or resources that are flexible and can be brought on to serve during high-demand periods. Another coordination strategy may be focused more on the supply side and exploring whether there are high users of transit services with flexibility in scheduling. However, at this time, the nature of the unmet trips and the degrees of trip schedule flexibility during periods of heavy use is unknown.

Appendix E: Panhandle Transportation Coordination Survey
Panhandle Transportation Coordination Study E- 16
Q27: Does Transportation Take Your Clients Where They Need to Go?
18, 33%
15, 28%
21, 39%
Yes No Blank
Results for Organizations that Do Not Provide Transit Service
13, 34%
11, 29%
14, 37%
All Respondents
Q27: Does transportation take your clients where they need to go? A27: Yes, No (Where do you need to go?) There were 33 respondents to this question. For those that responded “No,” destinations where transportation was lacking includes: food/grocery (3); daycare (2); job or job-training (5); medical appointments/pharmacy (8); Lubbock (3); airport (1); and emergency (1). Difficulty in filling all medical-trip and job-related trip needs were reinforced during public meetings and again in one-on-one meetings with providers. Additionally, the finding that the capacity to provide more long-distant trips is needed is reinforced by the responses cited to Survey Question 21: Why is Transportation a Problem?
Appendix E: Panhandle Transportation Coordination Survey
Panhandle Transportation Coordination Study E- 17
Q28: Are there other transportation issues that have not been covered? A28: (Open-ended response.) There were 12 respondents to this question. The comments are noted below: “For some reason the topic of transportation in the Panhandle is always limited to medical/welfare needs. People who have disabilities, those without the financial resources etc must have transit or a means of getting to the nearest Amtrac station to Amarillo, to the airport, to and from Canyon, Texas, Plainview and other locations. Perhaps it is because most of the persons working on the transit issue are not limited by lack of a car or several cars, lack of ability to drive, or who are left with only the Greyhound or TMN bus system in the area. The bus depot downtown is a ghetto and no one will address the issue because allegedly it is a private business. But it affects our whole city. People from other states and towns come here and are appalled at the horrid, slum like conditions of this bus depot on Tyler, the smell, the lack of cleanliness, the lack of ventilation, the lack of food or water and the people who staff it. The toxic fumes are so bad under the staging port where you board the bus in early A.M. that people using inhalers are often at risk. It is a horrid situation and it leaves people here without any alternative. This aspect of transit in Amarillo has simply got to be addressed and integrated into the agency related medical travel issues. Our population is aging and many of the people driving in Amarillo right now should not be doing so. They put us all at risk because they are far too old. Yet because there is NO alternative to get out of Amarillo either by decent bus terminal, getting to airport, to grocery stores in a timely manner, it forces people who should not be on the road to be there. In the coming years more people will age. We must do something about the lack of an integrated transit solution which is not just focused on medical needs or welfare related needs. We all have to live and without transit solutions we cannot. The net result is that our city is going to feel the economic impact as many of the people who have money to spend simply cannot get places to spend it.” “Retail stores” “We need assistance during the summer months for our temporary clients that we service only during these months in the out lying towns, such as Fritch, Stinnett, and Panhandle.” “People that are not Medicaid eligible but are still low income are very reluctant to go to appts because they cannot pay the fee ($30) to be taken out of town to appts. There needs to be some type of income sensitive program for non-Medicaid clients.” “Those from out of town are sometimes just walking or hitch hiking through and need a ride to the next town.” “Transients needing gas money to leave town- when not broken down/ or robbed; Transportation options for those afraid/ unhappy with the bus system” “I feel like we are a burden when we call to schedule transportation for our childcare” “We have those who say they can't attend classes unless they have transportation” “People need daily transportation to work.”
Appendix E: Panhandle Transportation Coordination Survey
Panhandle Transportation Coordination Study E- 18
“At times, appointments have to be changed due to other conflicting appointments” “What about the needs of homeless to look for employment w/o any source of income to pay for city transit?”
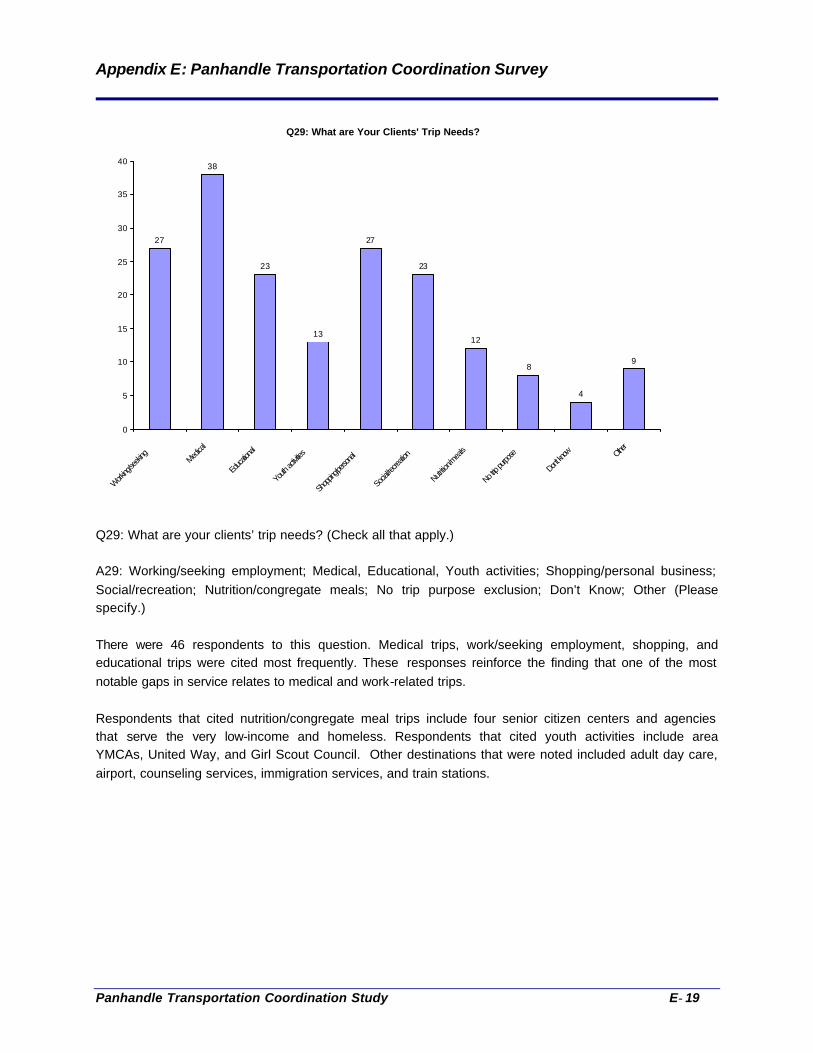
Appendix E: Panhandle Transportation Coordination Survey
Panhandle Transportation Coordination Study E- 19
Q29: What are Your Clients' Trip Needs?
38
23
13
27
23
12
8
4
9
27
0
5
10
15
20
25
30
35
40
Working
/seeki
ng Medica
l
Educa
tional
Youth
activit
ies
Shopp
ing/pe
rsonal
Socia
l/recre
ation
Nutritio
n/mea
ls
No trip p
urpose
Don't k
now Other
Q29: What are your clients’ trip needs? (Check all that apply.) A29: Working/seeking employment; Medical, Educational, Youth activities; Shopping/personal business; Social/recreation; Nutrition/congregate meals; No trip purpose exclusion; Don’t Know; Other (Please specify.) There were 46 respondents to this question. Medical trips, work/seeking employment, shopping, and educational trips were cited most frequently. These responses reinforce the finding that one of the most notable gaps in service relates to medical and work-related trips. Respondents that cited nutrition/congregate meal trips include four senior citizen centers and agencies that serve the very low-income and homeless. Respondents that cited youth activities include area YMCAs, United Way, and Girl Scout Council. Other destinations that were noted included adult day care, airport, counseling services, immigration services, and train stations.

Appendix E: Panhandle Transportation Coordination Survey
Panhandle Transportation Coordination Study E- 20
Q32: Organization Provides Transportation in Following Manner
6, 13%
10, 22%
15, 34%
14, 31%
Directly operates as focus Directly provides as supportArranges as support Do not provide
Q32: Your organization provides transportation to your clients in which of the following manner (Check one.) A32: Directly operates transportation services as your primary focus; Directly provides transportation services as part of your support provided to clients; Arranges for passenger transportation services as part of your support provided to clients; We do not provide or use transportation in our delivery of services to clients There were 45 respondents to this question. Respondents that indicated that they directly operate transit served between 10 and 210,000 unduplicated clients. Of the 10 organizations that directly provide transit service as part of the agency’s support, 1 agency was interested in providing services for other agencies, 4 agencies were possibly interested, and 5 agencies were not interested. Fourteen organizations indicated that they that do not provide transit services.

Appendix E: Panhandle Transportation Coordination Survey
Panhandle Transportation Coordination Study E- 21
Q33: Who Provides Transportation Services?
10, 18%
8, 14%
15, 27%
4, 7%
4, 7%
15, 27%
Amarillo Bus Amarillo Spec-Trans Panhandle Community Jan Werner Taxi Other
Q33: Who provides your passenger transportation services? (Check all that apply.) A33: Amarillo City Fixed Route Bus; Amarillo Spec-Trans; Panhandle Transit; Jan Werner Transportation; Taxi; Other (Please specify) There were 25 respondents to this question. Panhandle Transit provides transportation to all of the counties in the Panhandle and is the primary source of transportation for areas outside of the City of Amarillo. In Amarillo, there is a wider range of transportation options including Amarillo City Transit fixed route service, Amarillo City Transit Spec-Trans, Jan Werner Transportation, and private taxis. Users of private taxi included High Plains Epilepsy Center, United Way, and Harrington Cancer Center. Notable others that were mentioned include: Medicaid transportation, volunteers, Childress Ambulance Service, Panhandle Crisis Center, and Greyhound. Greater participation in service coordination by private taxi service and Greyhound (and other over-the-road coaches) may prove to be one resource to overcome some of the service gaps for after-hours service and long-distance service.
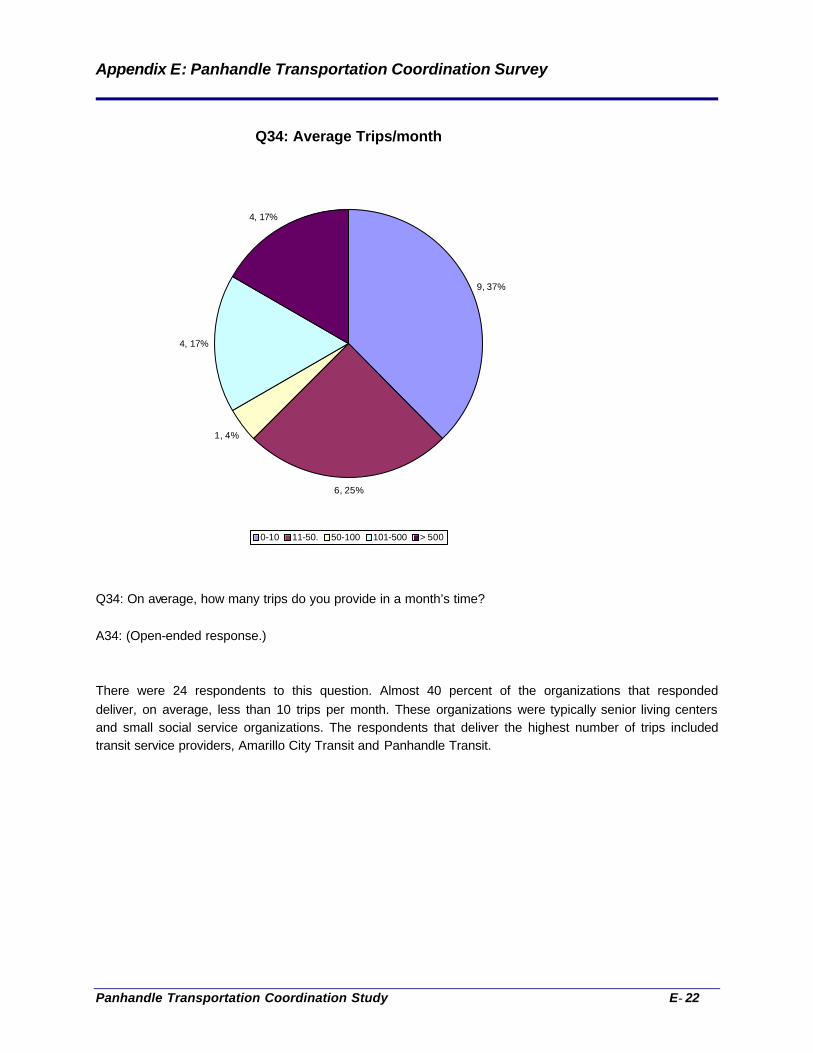
Appendix E: Panhandle Transportation Coordination Survey
Panhandle Transportation Coordination Study E- 22
Q34: Average Trips/month
9, 37%
6, 25%
1, 4%
4, 17%
4, 17%
0-10 11-50. 50-100 101-500 > 500
Q34: On average, how many trips do you provide in a month’s time? A34: (Open-ended response.) There were 24 respondents to this question. Almost 40 percent of the organizations that responded deliver, on average, less than 10 trips per month. These organizations were typically senior living centers and small social service organizations. The respondents that deliver the highest number of trips included transit service providers, Amarillo City Transit and Panhandle Transit.
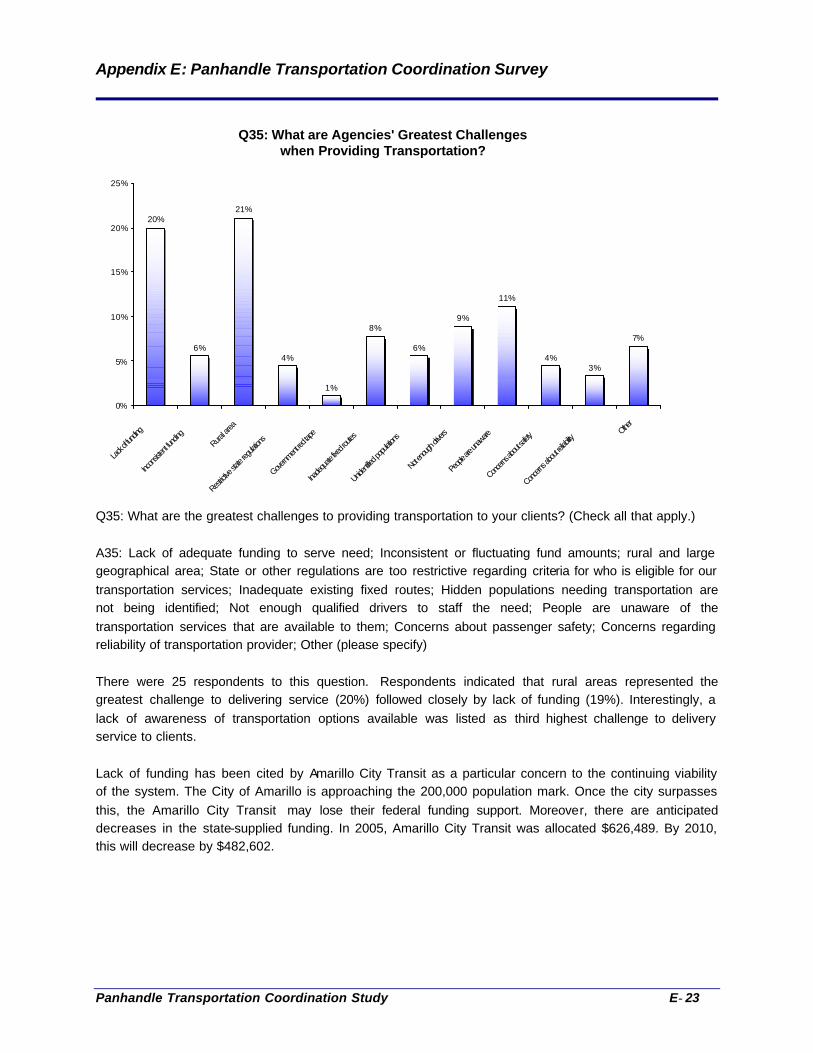
Appendix E: Panhandle Transportation Coordination Survey
Panhandle Transportation Coordination Study E- 23
Q35: What are Agencies' Greatest Challenges when Providing Transportation?
20%
6%
21%
4%
1%
8%
6%
9%
11%
4%3%
7%
0%
5%
10%
15%
20%
25%
Lack o
f fundi
ng
Incon
sisten
t fund
ingRura
l area
Restricti
ve sta
te reg
ulation
s
Governm
ent re
d tape
Inade
quate
fixed ro
utes
Unident
ified po
pulatio
ns
Not en
ough d
rivers
Peopl
e are u
naware
Conce
rns ab
out sa
fety
Concern
s abou
t reliab
ilityOthe
r
Q35: What are the greatest challenges to providing transportation to your clients? (Check all that apply.) A35: Lack of adequate funding to serve need; Inconsistent or fluctuating fund amounts; rural and large geographical area; State or other regulations are too restrictive regarding criteria for who is eligible for our transportation services; Inadequate existing fixed routes; Hidden populations needing transportation are not being identified; Not enough qualified drivers to staff the need; People are unaware of the transportation services that are available to them; Concerns about passenger safety; Concerns regarding reliability of transportation provider; Other (please specify) There were 25 respondents to this question. Respondents indicated that rural areas represented the greatest challenge to delivering service (20%) followed closely by lack of funding (19%). Interestingly, a lack of awareness of transportation options available was listed as third highest challenge to delivery service to clients. Lack of funding has been cited by Amarillo City Transit as a particular concern to the continuing viability of the system. The City of Amarillo is approaching the 200,000 population mark. Once the city surpasses this, the Amarillo City Transit may lose their federal funding support. Moreover, there are anticipated decreases in the state-supplied funding. In 2005, Amarillo City Transit was allocated $626,489. By 2010, this will decrease by $482,602.

Appendix E: Panhandle Transportation Coordination Survey
Panhandle Transportation Coordination Study E- 24
Q36-41: Interest for Coordination/Collaboration Strategies
8 8 4
-7
3 2
5 5
8
16
87
910 10
5
14
1213 13
12
9
11
98
65
2
0
5
9
2019
2221 21
-10
-5
0
5
10
15
20
25
30
35
Providing Service toAnother Agency
Purchasing Services fromAnother Agency
CoordinatingSchedules/Operations
Modifying Fixed Routesto Better Serve Clients
Working Together toConsolidate Purchasing
of Services
Working Together toProcure, Train, Maintain,
or Market Services
Not interested minus Interested Interested Possibly interested Not interested Not applicable Blank
Q36-41: What is your interest in the following coordination strategies: Providing transportation services or more transportation services under contract to another agency; Purchasing transportation services from another organization assuming price and quality meets your needs; Coordinating schedules and vehicle operations so riders can transfer from one service to another; Modifying fixed routes to better serve your clients; Working together to consolidate the purchase (or contracting) of transportation services; Working together to coordinate procurement, training, maintenance, or marketing activities. A36-41: Interested; Possibly interested; Not interested; Not applicable Twelve out of 20 organizations left this question blank because they do not use transportation services for their clients. Out of those that do provide service, most organizations indicated that they were “Not interested” in pursuing any coordination strategy. The strategy that solicited the most interest was “Modifying fixed routes.” Some of the organizations that indicated this as an interest include: Amarillo YMCA, Texas Panhandle MHMR Early Childhood Intervention, High Plains Epilepsy Association, Panhandle Worksource, Panhandle Crisis Center, and United Way of Amarillo. Another strategy that had higher interest was “Working Together to Purchase Service.” Some of the organizations that indicated this as an interest include: Health and Human Services Commission, Panhandle Independent Living Center, Amarillo YMCA and a number senior citizen centers and senior living centers.
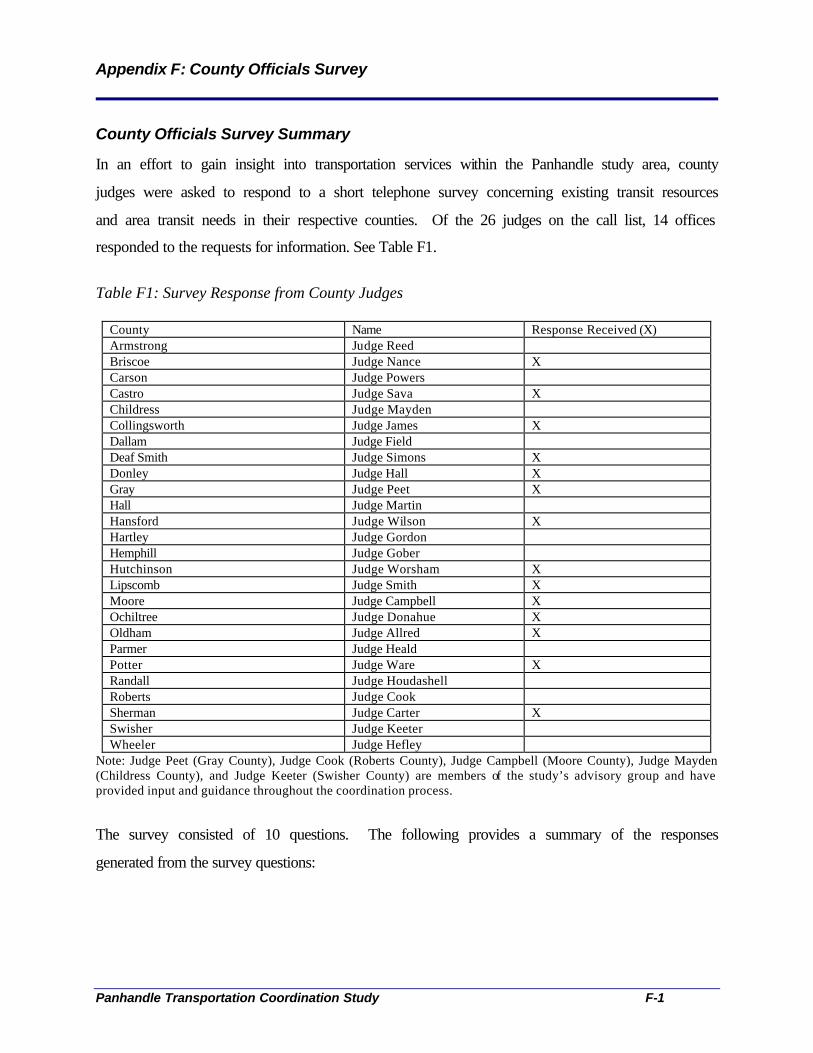
Appendix F: County Officials Survey
Panhandle Transportation Coordination Study F-1
County Officials Survey Summary
In an effort to gain insight into transportation services within the Panhandle study area, county
judges were asked to respond to a short telephone survey concerning existing transit resources
and area transit needs in their respective counties. Of the 26 judges on the call list, 14 offices
responded to the requests for information. See Table F1.
Table F1: Survey Response from County Judges
County Name Response Received (X) Armstrong Judge Reed Briscoe Judge Nance X Carson Judge Powers Castro Judge Sava X Childress Judge Mayden Collingsworth Judge James X Dallam Judge Field Deaf Smith Judge Simons X Donley Judge Hall X Gray Judge Peet X Hall Judge Martin Hansford Judge Wilson X Hartley Judge Gordon Hemphill Judge Gober Hutchinson Judge Worsham X Lipscomb Judge Smith X Moore Judge Campbell X Ochiltree Judge Donahue X Oldham Judge Allred X Parmer Judge Heald Potter Judge Ware X Randall Judge Houdashell Roberts Judge Cook Sherman Judge Carter X Swisher Judge Keeter Wheeler Judge Hefley
Note: Judge Peet (Gray County), Judge Cook (Roberts County), Judge Campbell (Moore County), Judge Mayden (Childress County), and Judge Keeter (Swisher County) are members of the study’s advisory group and have provided input and guidance throughout the coordination process.
The survey consisted of 10 questions. The following provides a summary of the responses
generated from the survey questions:
Appendix F: County Officials Survey
Panhandle Transportation Coordination Study F-2
What transportation services are currently available?
With exception to one survey, each county judge named Panhandle Transit as their area
transportation service provider.
What is the opinion of this level of service?
The majority of respondents viewed Panhandle Transit’s service as adequate and are unaware of
any complaints about the service from area residents. However, several surveys suggest that
more marketing may create greater interest in Panhandle Transit or at a minimum provide some
knowledge of the services offered by the agency.
Does your office support or fund transportation services for any programs in your county?
Four of the 14 respondents do not support or fund transportation services, while the remaining
respondents typically provide monetary donations of $1,000 to $5,000 to Panhandle Transit
annually. In one example, a county provides in-kind services through the donation of office
space and personnel in exchange for support transportation services.
What are the biggest transportation issues residents in your county face? What are the largest
transportation needs for your county?
The need for affordable transportation to medical facilities for area seniors and low-income
households is a common concern shared by all counties. Currently, medical trips are the leading
trip purpose for those utilizing existing transportation services. According to one survey, seniors
rely on church volunteers or family members for transportation to medical appointments. In
another county the need for transportation to medical facilities is extremely critical given there
are no medical facilities within that county. As a result, residents are subject to lengthy
commutes for medical treatment.
Are you aware of any current efforts to coordinate transit among health and human services
providers and/or transportation providers in your county?
Only one respondent was aware of transportation coordination efforts between a local nursing
home and hospital. All other respondents were not aware of any transit coordination efforts
within their county.

Appendix F: County Officials Survey
Panhandle Transportation Coordination Study F-3
Are you aware of any past efforts to coordinate transit among health and human services
providers and/or transportation providers in your county?
No respondents were aware of past transit coordination efforts within their county.
What do you think are the biggest barriers to coordination?
No responses or opinions were provided due to the lack of knowledge regarding current or past
transit coordination efforts.
How do you think these barriers can be overcome?
No responses or opinions were provided due to the lack of knowledge regarding current or past
transit coordination efforts.
Who are key stakeholders in your county that we should contact?
Recommendations from respondents varied from contacting local commissioners, hospitals,
senior citizen groups, Panhandle Transit, and City Council members for additional information
regarding transportation issues.
What would you like to see come out of this regional planning effort? In other words, what
would your goal for the study be?
More marketing of existing transportation services and affordable transportation were repeated
as goals for this regional planning effort. Some respondents also suggested an increase in
services to meet demand. In addition, centrally located transportation centers throughout the
region were also recommended by a respondent.
Survey Summary
Based on survey results, each of the County judges interviewed believe there is a strong need for
affordable transportation, with an emphasis on providing access to medical facilities for their
senior citizen population. The majority also was unfamiliar with any current or past transit
coordination efforts. Additionally, many would like to see more marketing of all existing
transportation resources as a result of this study.

Appendix G: Public Meeting Report
Panhandle Transportation Coordination Study G- 1
Public Meeting Summary
Ten public meetings were held in the Panhandle region from June 1 to June 27 to solicit input
regarding transit needs and barriers to coordination. Meeting locations were chosen based on
population and geographical diversity. To encourage attendance, meeting announcements were
sent to the Panhandle agency contacts and a notice of a public hearing was sent to regional
newspapers. Attendance at meetings ranged from one attendant (Perryton) to 22 attendants
(Childress). See Table G1.
Table G1: Panhandle Public Meeting Schedule
Date City Name of Meeting Facility Address of Facility Thursday, June 1
12:00 noon Amarillo Room 306, City Hall 509 SE Seventh St
Tuesday, June 20
5:00 PM Dalhart Dalhart Senior Citizens Building 610 Denrock
7:30 PM Dumas Moore County Community Building 16th and Maddox
Wednesday, June 21
5:00 PM Hereford Hereford Community Center 100 Avenue C
7:30 PM Tulia Swisher County Memorial Building 126 S.W. Second St.
Thursday, June 22
7:00 PM Childress Childress Auditorium - Reunion Rm 1000 N. Commerce
Monday, June 26
12:00 PM Pampa Chamber of Commerce 200 N. Ballard
5:00 PM Miami Roberts County Community Center 103 Main St.
7:30 PM Perryton Frank Phillips College, Allen Campus Conference Center
2314 S. Jefferson
Tuesday, June 27
7:00 PM Amarillo Panhandle Regional Planning Commission - Board Room
415 W. 8th Avenue
The format of the meeting included a short presentation explaining transit coordination followed
by a facilitated discussion regarding transit needs and barriers. Materials accompanying the
meeting included handouts of the presentation and three posters providing study information to
date, a county-by-county assessment of transit-related demographic information, a general
overview of the levels of transit coordination, and initial findings from the Panhandle Transit
Survey.

Appendix G: Public Meeting Report
Panhandle Transportation Coordination Study G- 2
This section includes a summary of the public meeting comments followed by meeting
comments and notes.
A facilitated discussion was held to solicit comments concerning two broad topics: 1) what are
the concerns of community members regarding transit service in their area (that is, what are the
gaps in service); and 2) what are the barriers and constraints that they have to accessing or
delivering better transit service. The number of comments by topic is tabulated in Figure G1.
Panhandle Public Meeting Comment Scores
6
3
6
1
3
7
5
1
2
3
5
1
0
1
2
3
4
5
6
7
8
Fundi
ng
Vehic
les
Medica
id/Med
ical Tr
ips
Econ
Dev (L
CI)
Inter-re
giona
l
Job Ac
cess
Sche
duling
Issue
s
Lack
of Tra
nspo
rtation
Optio
ns
Emerg
ency
Transp
ortation
Contra
dictory
Rules
Imag
e/Aware
ness
of Tran
sit
Relucta
nce to
Chang
e (Ride
r)
Most public comments revolved around four issues:
• Job Access: Transportation to jobs was a critical issue voiced in all the public meetings,
but particularly so for the cities of Hereford, Childress and Perryton. The city managers,
county judges, and Texas Workforce Development Center staff of these cities were
concerned that their communities meet the challenge of attracting industries to their
areas by supplying an available labor pool. Industries that were cited as potentially
Figure G1: Panhandle Public Meeting Comment Scores
Appendix G: Public Meeting Report
Panhandle Transportation Coordination Study G- 3
needing a more readily available pool of workers included meat and pork packing plants,
new electric generating plants, dairies and a new Wal-Mart. As one attendant put it:
“There are a lot of economic opportunities going on but there is a river between industry
and the workers.” Typical comments included interest in establishing a van pool service;
the difficulty in ensuring Texas Workforce Commission gas vouchers are not abused and
used only for employment purposes; and concern that the job access difficulties will
continue to grow if gas prices continue to rise.
• Funding: Attendance from staff of the local Panhandle Transit offices was strong at
many of the public meetings and Amarillo City Transit staff attended the public meetings
within that city. Most of the comments regarding funding came from transit staff and
included: more funding for vehicle replacement and operations; high driver turnover
rates due to low wages that are the result of low state and federal operating funds;
concerns over decreases to state funding; a concern about the City of Amarillo losing
federal funding support for transit operations once the population exceeds 200,000.
• Medicaid/medical trips: The change of Medicaid contractors from Panhandle Transit to
AMR occurred in June 2006. This change in service delivery was the focus of many
comments from transit agencies and health and human service agencies.
• Scheduling: Overall, transit services received very positive support at the public
meetings from members of the general public and social service agency staff. However,
one area that was frequently mentioned as a barrier to good service was scheduling.
Specifically, the Panhandle Transit’s and ACT’s 24-hour reservation notification was
perceived as difficult for certain members of the community to adhere to and,
consequently, those members may be turning to other, more costly, solutions. Example
comments include:
o There is no way to handle emergency trips. Something may come up with less
than a 24-hour notice that needs timely attention but does not require an
ambulance. However, because people feel there are no other alternatives, they
are calling 9-1-1, which is an expensive alternative.
Appendix G: Public Meeting Report
Panhandle Transportation Coordination Study G- 4
o Older riders may have less ability to honor their reservations because they are
more susceptible to quick changes in health and energy levels. Consequently,
some of these riders are taking trips when they would prefer not to do so.
Hours of operation are another scheduling issue that was frequently mentioned.
Panhandle Transit ceases service at 5:00 p.m., Monday through Friday. ACT ceases
service at 7:00 p.m., Monday through Saturday. No city within the Panhandle region has
a taxi service with the exception of Amarillo. Consequently, transportation options are
limited in the evening hours for the majority of the region. This lack of service was seen
as particularly hard on minimum wage workers who frequently work evening and
weekend shifts.
• Perception of transit services: Despite strong public support for transit agencies, there
was an overall perception that transit was not a service that most people wanted to
access, but rather accessed strictly out of need. In other words, it was a service that was
needed only if one did not have the money, family, and/or friends to ensure a ride.
Particularly for long-distant medical trips, transit was perceived as poor transportation
option because of the duration of the trip (frequently all day) and it was implied that
those who relied on transit for these trips had no other choice. When asked why transit
was not the preferred choice for a trip, typical comments include:
o We take care of our own;
o We rely on our friends and family to take us; and
o It’s a service only for the disabled and elderly.
Other comments included how some communities knew little about the transit services
available to them or how to schedule a ride (e.g., cities of Miami and Tulia).
In addition to the above four issues, other topics included:
Appendix G: Public Meeting Report
Panhandle Transportation Coordination Study G- 5
• Inter-regional coordination: Coordinating at the regional level to maximize use of
resources is a de-facto practice within the Panhandle. Issues of inter-regional and inter-
state coordination were also of interest.
• A concern that coordination would mean passengers would experience an unwanted
change in service. A concern voiced over the sharing of transportation resources
solicited this response: Particularly for older riders, a trip on the Panhandle Transit can
be as much a social event as a transportation need. Passengers become accustomed to
one driver and a group of familiar riders and they are reluctant to see that changed.
• Dialysis trips consume vast amounts of transit resources. This situation is exacerbated
when trips are scheduled for dialysis centers that are not close to the patient’s home base.
Patients need to know what their treatment and travel options are and communities with
regional medical services are interested in serving those members that live within their
market area.
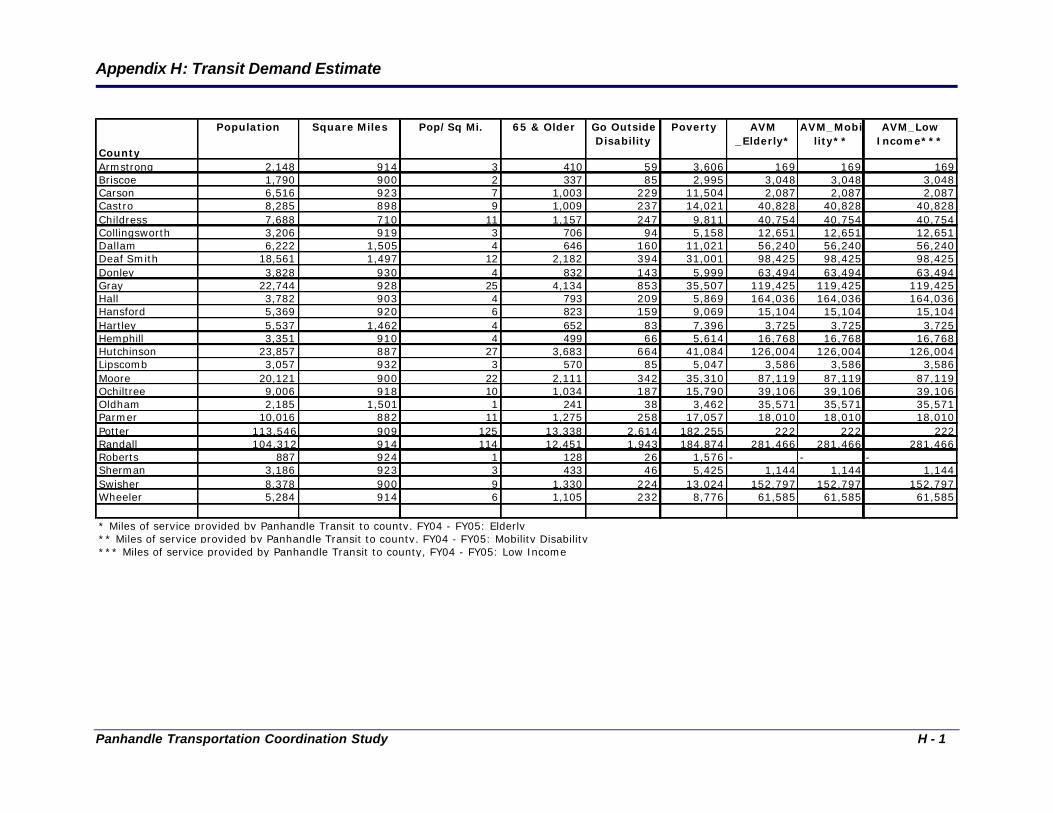
Appendix H: Transit Demand Estimate
Panhandle Transportation Coordination Study H - 1
County
Population Square Miles Pop/Sq Mi. 65 & Older Go Outside Disability
Poverty AVM _Elderly*
AVM_Mobility**
AVM_Low Income***
Armstrong 2,148 914 3 410 59 3,606 169 169 169Briscoe 1,790 900 2 337 85 2,995 3,048 3,048 3,048Carson 6,516 923 7 1,003 229 11,504 2,087 2,087 2,087Castro 8,285 898 9 1,009 237 14,021 40,828 40,828 40,828Childress 7,688 710 11 1,157 247 9,811 40,754 40,754 40,754Collingsworth 3,206 919 3 706 94 5,158 12,651 12,651 12,651Dallam 6,222 1,505 4 646 160 11,021 56,240 56,240 56,240Deaf Smith 18,561 1,497 12 2,182 394 31,001 98,425 98,425 98,425Donley 3,828 930 4 832 143 5,999 63,494 63,494 63,494Gray 22,744 928 25 4,134 853 35,507 119,425 119,425 119,425Hall 3,782 903 4 793 209 5,869 164,036 164,036 164,036Hansford 5,369 920 6 823 159 9,069 15,104 15,104 15,104Hartley 5,537 1,462 4 652 83 7,396 3,725 3,725 3,725Hemphill 3,351 910 4 499 66 5,614 16,768 16,768 16,768Hutchinson 23,857 887 27 3,683 664 41,084 126,004 126,004 126,004Lipscomb 3,057 932 3 570 85 5,047 3,586 3,586 3,586Moore 20,121 900 22 2,111 342 35,310 87,119 87,119 87,119Ochiltree 9,006 918 10 1,034 187 15,790 39,106 39,106 39,106Oldham 2,185 1,501 1 241 38 3,462 35,571 35,571 35,571Parmer 10,016 882 11 1,275 258 17,057 18,010 18,010 18,010Potter 113,546 909 125 13,338 2,614 182,255 222 222 222Randall 104,312 914 114 12,451 1,943 184,874 281,466 281,466 281,466Roberts 887 924 1 128 26 1,576 - - -Sherman 3,186 923 3 433 46 5,425 1,144 1,144 1,144Swisher 8,378 900 9 1,330 224 13,024 152,797 152,797 152,797Wheeler 5,284 914 6 1,105 232 8,776 61,585 61,585 61,585
* Miles of service provided by Panhandle Transit to county, FY04 - FY05: Elderly** Miles of service provided by Panhandle Transit to county, FY04 - FY05: Mobility Disability*** Miles of service provided by Panhandle Transit to county, FY04 - FY05: Low Income
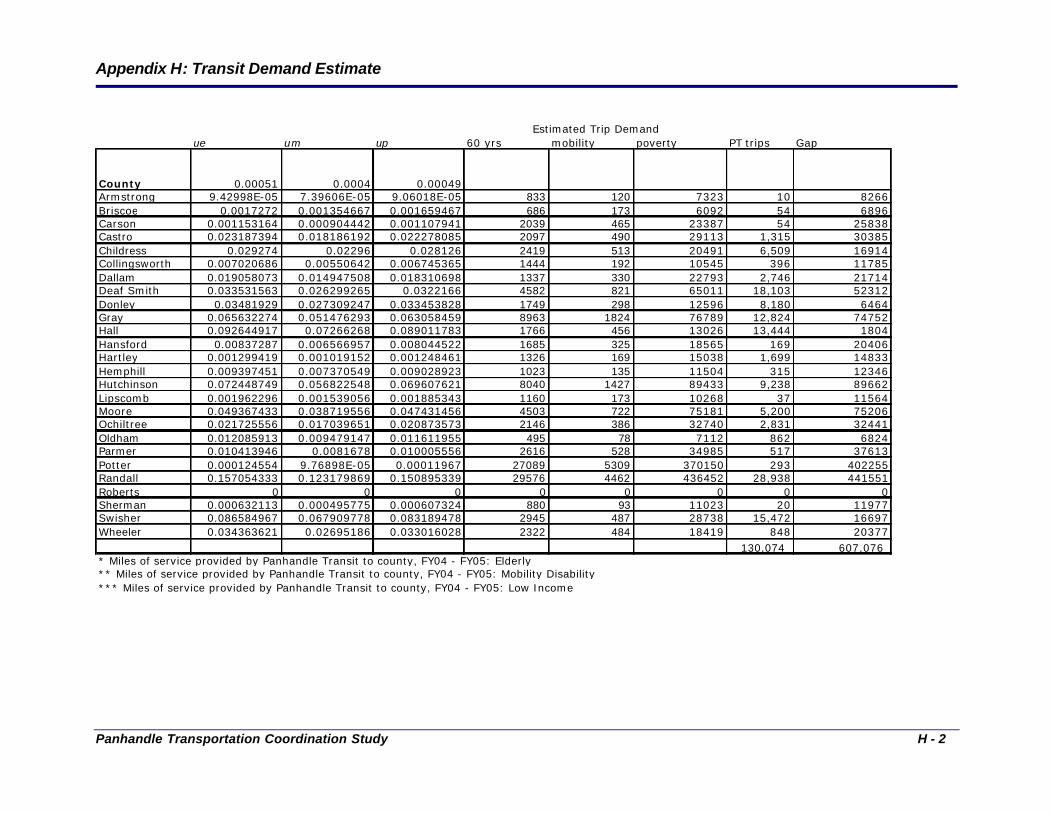
Appendix H: Transit Demand Estimate
Panhandle Transportation Coordination Study H - 2
ue um up 60 yrs mobility poverty PT trips Gap
County 0.00051 0.0004 0.00049Armstrong 9.42998E-05 7.39606E-05 9.06018E-05 833 120 7323 10 8266Briscoe 0.0017272 0.001354667 0.001659467 686 173 6092 54 6896Carson 0.001153164 0.000904442 0.001107941 2039 465 23387 54 25838Castro 0.023187394 0.018186192 0.022278085 2097 490 29113 1,315 30385Childress 0.029274 0.02296 0.028126 2419 513 20491 6,509 16914Collingsworth 0.007020686 0.00550642 0.006745365 1444 192 10545 396 11785Dallam 0.019058073 0.014947508 0.018310698 1337 330 22793 2,746 21714Deaf Smith 0.033531563 0.026299265 0.0322166 4582 821 65011 18,103 52312Donley 0.03481929 0.027309247 0.033453828 1749 298 12596 8,180 6464Gray 0.065632274 0.051476293 0.063058459 8963 1824 76789 12,824 74752Hall 0.092644917 0.07266268 0.089011783 1766 456 13026 13,444 1804Hansford 0.00837287 0.006566957 0.008044522 1685 325 18565 169 20406Hartley 0.001299419 0.001019152 0.001248461 1326 169 15038 1,699 14833Hemphill 0.009397451 0.007370549 0.009028923 1023 135 11504 315 12346Hutchinson 0.072448749 0.056822548 0.069607621 8040 1427 89433 9,238 89662Lipscomb 0.001962296 0.001539056 0.001885343 1160 173 10268 37 11564Moore 0.049367433 0.038719556 0.047431456 4503 722 75181 5,200 75206Ochiltree 0.021725556 0.017039651 0.020873573 2146 386 32740 2,831 32441Oldham 0.012085913 0.009479147 0.011611955 495 78 7112 862 6824Parmer 0.010413946 0.0081678 0.010005556 2616 528 34985 517 37613Potter 0.000124554 9.76898E-05 0.00011967 27089 5309 370150 293 402255Randall 0.157054333 0.123179869 0.150895339 29576 4462 436452 28,938 441551Roberts 0 0 0 0 0 0 0 0Sherman 0.000632113 0.000495775 0.000607324 880 93 11023 20 11977Swisher 0.086584967 0.067909778 0.083189478 2945 487 28738 15,472 16697Wheeler 0.034363621 0.02695186 0.033016028 2322 484 18419 848 20377
130,074 607,076 * Miles of service provided by Panhandle Transit to county, FY04 - FY05: Elderly** Miles of service provided by Panhandle Transit to county, FY04 - FY05: Mobility Disability*** Miles of service provided by Panhandle Transit to county, FY04 - FY05: Low Income
Estimated Trip Demand

Appendix I: Vanpool and Buspool Workshop Material
Panhandle Transportation Coordination Study I-1
Vanpool and Buspool Workshop Material
Definitions
Carpools generally consist of two to four people who commute together and rely on a volunteer
driver. They tend to be informal arrangements with little to no management or institutional
support. Where there is organization or institution support, it is frequently limited to ride-
matching and some program promotion.
Vanpools generally consist of 5 to 15 people who commute together and rely on a volunteer
driver. They are different from carpools in that they tend to serve more people and require a
higher degree of management and involvement from partnering institutions. Successful
programs generally serve commuters who do not require their cars during the day, rarely work
overtime, and travel relatively long distances.
Buspools are similar to vanpools except that they rely on professional drivers or volunteer drivers
with a commercial license.
Attributes of Successful Programs
Most vanpool programs do best where:
• One-way trip lengths exceed 20 miles;
• Work schedules are fixed and regular;
• Employer size is sufficient to allow matching of 5 to 15 people from the same area.
• Additional time to use the vanpool does not outweigh its benefits. A vanpool or buspool
typically can add 10 to 12 minutes additional commuting time (picking up or waiting for
other riders). If additional time is too long, the program loses its attractiveness
considerably and will struggle to survive.
• Public transit is inadequate.
Appendix I: Vanpool and Buspool Workshop Material
Panhandle Transportation Coordination Study I-2
Organizational Strategies Vanpool
Employer Sponsored Vanpool: The employer purchases or leases the vehicle. Volunteer driver
rides for free. Other riders pay a monthly fee (usually). Volunteer driver may be allowed to use
the vehicle for personal reasons for a specified amount and usually on a mileage reimbursement
basis. Fees are based on operating costs (if leased) and capital depreciation (if vehicle is
purchased).
Public Transit or Other Non-profit Sponsored Vanpool: A third-party such as a transit agency or
non-profit also enters into an agreement with a driver. Riders are charged a fee to recover
vehicle cost, maintenance, fuel, and insurance and program administration costs. Employers
may help employees pay for part of the cost of their fares. Public transit agencies may subsidize
part of the program with its funding stream. Public transit sponsored programs can recover all
operating costs and, in some cases, generate positive cash-flow. Agency leases the vehicle and
markets the service.
Third Party (For Profit) Vanpool: Similar to public transit or other non-profit sponsored
provider the transit agency contracts with a private van provider to administer the program.
Organizational Strategies Buspool
Conditions for success are similar to a vanpool except that it typically requires about three times
a vanpool’s travel demand because of higher administration costs. Consequently, the popularity
of vanpools exceeds buspools and there are approximately 10 more vanpools riders over buspool
riders nationwide. However, if establishing a buspool, the vehicle could be used to provide other
trips during the day.
Employer or Employee Sponsored Buspool: Is similar to vanpool except a professional driver is
employed. The program may be organized by employer or employees who contract for service.
Appendix I: Vanpool and Buspool Workshop Material
Panhandle Transportation Coordination Study I-3
Public Transit Sponsored Buspool: Is similar to vanpool except a professional driver is
employed and the program is managed by a public transit entity. Buspool vehicles and/or
operation, including drivers, are often contracted for or chartered from private bus companies,
even when managed by the local transit provider. Where buspooling is feasible, these services
frequently change into express routes that are open to any rider.
Organizational Strategies Vanpool
The following discussion expands on issues relating to organizing vanpools. Table I.1 lists 17
components that must be addressed in developing and operating a vanpool program.
Responsibilities for these items vary with the five different optional frameworks. For example,
the owner of the van could be the transit agency, a third party, an employer, or a driver
depending upon which framework is considered.
Table I.1: Vanpool Components
Administration Fare Structure Ride Matching Employee Access Vehicle Purchase or Lease Employee Promotion Insurance Employer Subsidies Maintenance Timeliness Collect Money Log Book and Recordkeeping Driver Training (& Certification) Reports Driver Incentives Contract Emergency Ride Home Policy Rider Rules of the Road
Five Frameworks
Vanpools can be organized using five basic frameworks that differ by the number of parties
involved, the risk to each party, areas of assigned responsibility, and benefits/drawbacks. No
matter who operates the vanpool or buspool program, employers are key to the program’s
implementation and success. Should RTAG wish to pursue a vanpool program, a list of targeted
employers or groups of employers to be the initial focus of a vanpool program will need to be

Appendix I: Vanpool and Buspool Workshop Material
Panhandle Transportation Coordination Study I-4
developed. Employers may be selected because of size or circumstances (some have evening
shifts that operate when transit service is unavailable), are located in areas that have no regular
transit service or have expressed an interest in vanpooling. The following is a list of the
frameworks and a discussion of the advantages and disadvantages of each approach.
• Transit Agency, Third Party, Employer, Driver, Rider – Transit agency would provide
some administration and marketing; the third-party vanpool operator would be responsible
for all other aspects of operations.
• Transit Agency, Employer, Driver, Rider – Transit agency develops, establishes and
operates its own vanpool program
• Employer, Driver, Rider – Transit agency assists employers in establishing their own
company vanpools and solicits interest and provides matching and administrative services.
• Third Party, Driver, Rider – Transit agency enters into a partnership with others to
establish and operate a vanpool program for a group of employers. This arrangement could
be managed through a Transportation Management Organization (TMO).
• Driver, Rider – Transit agency assists individuals in establishing their own vanpool and
would solicit interest and provide matching and administrative services.
OPTION 1: Transit Agency Contracts with a Vanpool Operator
If a Transit agency opts to contract for service with a vanpool operator, it lessens its
responsibility for the execution of the program. Vanpool operators can either be a private firm,
such as Vanpool Services Incorporated (VPSI) or Enterprise or a public, non-profit TMO,
established under the auspices of the transit agency. The transit agency will initially be
responsible for issuing a Request for Proposals (RFP) from qualified vanpool operators.
The vanpool operator, once selected, generally assumes much of the responsibility for the
implementation and administration of the program. In addition to administration, its duties
usually include matching riders with one another, procuring vehicles and insurance, checking
Appendix I: Vanpool and Buspool Workshop Material
Panhandle Transportation Coordination Study I-5
drivers’ backgrounds, and providing alternative means of transport in the event of an emergency.
The employer shares responsibility for ensuring employee access to the program, promoting its
use, and administering a tax-deductible incentive to employees. (Under federal law, the first
$105 provided to an employee each month for vanpooling is not considered taxable income and
no employer income taxes are paid.)
In some arrangements, a vanpool operator has less of a role than what is commonly practiced and
the employer assumes much more of the responsibility. For example, the employer may be
responsible for providing insurance, vehicle maintenance, and the vehicle itself. The assignment
of responsibilities depends upon the capacity of the vanpool operator and should be clearly
defined in the contract.
Drivers and riders in this scenario have the fewest responsibilities. Commonly, drivers collect
fees from other riders, although the vanpool operator or employer can perform this function.
Drivers are also responsible for cleaning and fueling the van, maintaining the vehicle log,
creating reports, and of course, being punctual. Riders simply must pay their fees and obey the
“rules of the road”.
Advantages/Disadvantages
A key advantage of contracting to a private company is the ability to lower program costs
through Capital Costs of Contracting.
By contracting with a third-party vanpool operator, a transit agency greatly minimizes its risks
associated with the operation of a vanpool. The transit agency will have little to do with the
establishment of vanpool operations and nothing to do with its day-to-day administration.
Moreover, if the vanpool is not successful, the transit agency will not be held directly
responsible. This operational framework is beneficial in smaller markets, such as Amarillo,
where it is difficult to market enough vanpools to take advantage of efficiencies that occur with
larger numbers.
Appendix I: Vanpool and Buspool Workshop Material
Panhandle Transportation Coordination Study I-6
The downside of this approach is the lack of control that the transit agency will be able to
exercise over the program. If the vanpool operator is not capable of performing credibly, the
contracting party may be unable to intervene in its operations unless remedies are specified in the
pre-contract with the operator. Otherwise, the transit agency must wait until the end of the
contract to re-solicit proposals for a new operator.
OPTION 2: Transit Agency Establishes and Operates its Own Vanpool Program
In this scenario, the transit agency assumes most of the responsibility for the vanpool program.
It is charged with administering the program, matching riders with drivers, purchasing vehicles
and insurance, ensuring vehicles are maintained, collecting money, and performing background
checks. Individual employers may perform or assist with some of these major functions,
including providing the standard $100 non-taxable subsidy to employees, and promoting and
facilitating access to the vanpool program. The obligations of drivers and riders would remain
entirely unchanged in this instance.
Advantages/Disadvantages
By developing and operating its own vanpool, the transit agency can control the quality and
consistency of service. If the program is successful, positive public relations would be generated
for the transit agency.
Alternatively, with this option the transit agency places itself in the highest risk situation possible
among all five scenarios. The transit agency would be singularly responsible for all legal,
financial, and political risks involved in such an enterprise. Therefore, any successes and
conversely any failures would be readily attributable to the transit agency. Furthermore, higher
administration costs associated with operating a vanpool program could tax the transit agency’s
ability to perform its primary function, which it to provide basic and demand response/transit
services.
OPTION 3: Transit Agency Assists Employers in Establishing Company Vanpools

Appendix I: Vanpool and Buspool Workshop Material
Panhandle Transportation Coordination Study I-7
With Option 3, the transit agency again possesses a limited role in the development and
implementation of a vanpool program. The transit agency might be involved in the provision of
matching riders with drivers and promotional materials for employers and employees, but neither
is likely. Each employer that chooses to participate in a vanpool program would handle its own
day-to-day administration.
In addition to daily administration, the employer also provides all of the critical functions
previously discussed, e.g. procuring a vehicle and insurance, checking the background of
potential drivers, promoting and providing adequate access to a program, etc. Duties pertaining
to drivers and riders remain unchanged in this case.
Advantages/Disadvantages
The primary advantage for the transit agency in such a relationship is that if the program fails, it
incurs little financial, legal, or political risk. Additionally, because there are fewer stakeholders
involved, coordination and implementation for the transit agency is simpler.
A disadvantage to this approach is the inability of private companies to access federal funding to
support the program (e.g. JARC). Second, because each vanpool program would be
individualized to each employer instead of a group of employers, matching the available pool of
drivers and riders may be hampered. (This is assuming that enough employers a clustered
together and that shift times can be coordinated.) Third, this option might also limit the market
of interested employers, as many will not want to implement a program themselves but would
prefer to participate in a larger program administered by another party.
OPTION 4: Transit Agency Enters into a Partnership to Establish and Operate a Vanpool
Program

Appendix I: Vanpool and Buspool Workshop Material
Panhandle Transportation Coordination Study I-8
Upon entering into a partnership with a third party (a TMO or possibly a private company), the
transit agency’s involvement in a vanpool program will probably be somewhat limited. The
transit agency would solicit RFPs from qualified operators and may provide support for
matching drivers and riders, but otherwise would allow its partner to handle the bulk of daily
operations. However, the transit agency would likely assist in the development of and even
participate in a TMO. The TMO, if selected over a private operator, along with participating
employers are responsible for all of the tasks critical to the successful operation of a vanpool
program. Drivers and riders are responsible for their usual, ascribed tasks.
Advantages/Disadvantages
Forming a partnership with a third party, either a private operator or a TMO, allows the transit
agency to limit its liabilities. In this scenario, the transit agency only provides administrative
support and allows the operating entity to assume most of the financial, legal, and political risk.
Also, if the third party is a private entity, the transit agency may be able to recoup some costs
through Capital Cost of Contracting.
The primary disadvantage of this arrangement is that if a TMO were created with a transit
agency’s involvement, it would be duplicating some of its effort to provide public transportation.
Moreover, even though the transit agency would not be directly responsible for operations, it
would be seen as more closely associated with the program than if it contracted with a third-party
operator to administer a program (Option 1). This could be problematic for the transit agency if
the program does not perform as expected.
OPTION 5: Transit Agency Assists Individuals in Establishing Their Own Vanpool
Option 5 requires the least amount of involvement by a transit agency. The transit agency would
provide individuals interested in vanpooling with lists of other potential drivers and riders,
similar to carpools. The transit agency might also furnish promotional materials, develop a “do
it yourself” kit, and even provide example controls and forms. Drivers on the other hand will be
responsible for nearly every facet of the service. Purchasing or leasing the vehicle, securing
Appendix I: Vanpool and Buspool Workshop Material
Panhandle Transportation Coordination Study I-9
insurance, administration, matching, collecting money, etc. would all be the sole responsibility of
drivers. Riders in this scenario would only be liable for paying fees and adhering to whatever
contract they enter into with the driver.
Advantages/Disadvantages
The risks for a transit agency adopting this approach to the provision of vanpool services are
very low; the success or failure is almost completely dependent upon drivers and riders.
However, this approach has a low probability of success. Furthermore, because no agency is
involved, participants are not eligible for any federal subsidies.
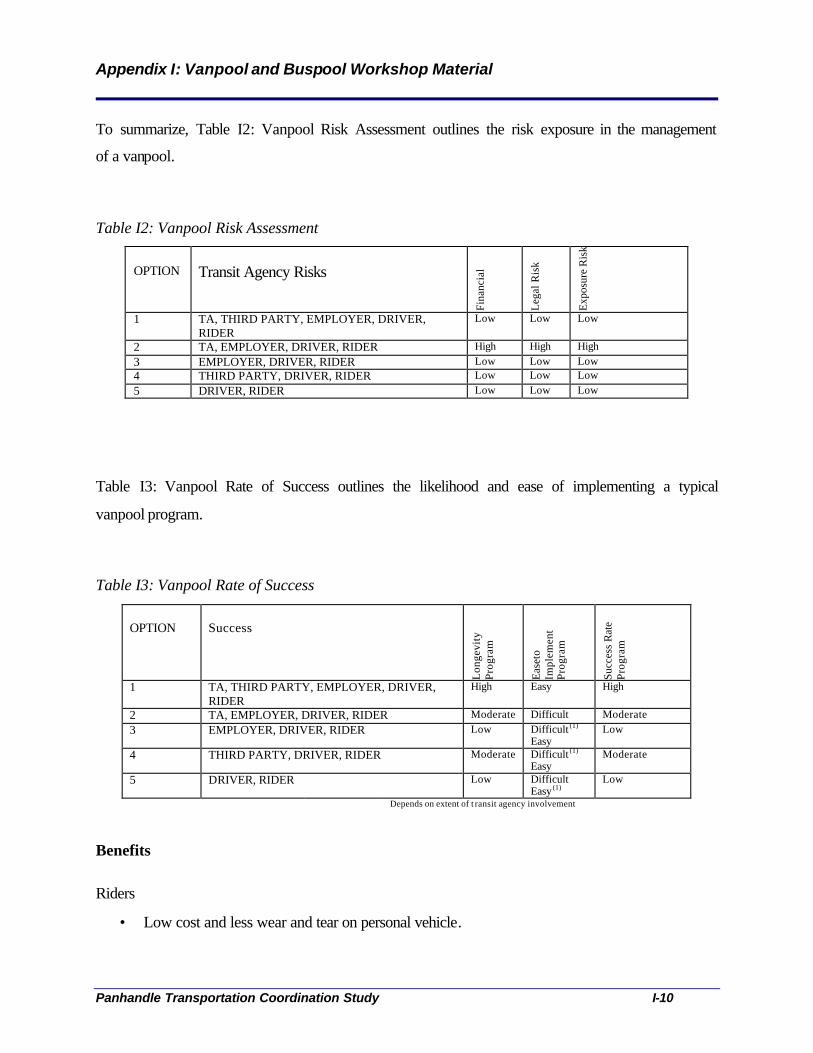
Appendix I: Vanpool and Buspool Workshop Material
Panhandle Transportation Coordination Study I-10
To summarize, Table I2: Vanpool Risk Assessment outlines the risk exposure in the management
of a vanpool.
Table I2: Vanpool Risk Assessment
OPTION
Transit Agency Risks
Fina
ncia
l
Leg
al R
isk
Exp
osur
e R
isk
1 TA, THIRD PARTY, EMPLOYER, DRIVER, RIDER
Low Low Low
2 TA, EMPLOYER, DRIVER, RIDER High High High 3 EMPLOYER, DRIVER, RIDER Low Low Low 4 THIRD PARTY, DRIVER, RIDER Low Low Low 5 DRIVER, RIDER Low Low Low
Table I3: Vanpool Rate of Success outlines the likelihood and ease of implementing a typical
vanpool program.
Table I3: Vanpool Rate of Success
OPTION
Success
Lon
gevi
ty
Prog
ram
Eas
eto
Impl
emen
t Pr
ogra
m
Succ
ess
Rat
e Pr
ogra
m
1 TA, THIRD PARTY, EMPLOYER, DRIVER, RIDER
High Easy High
2 TA, EMPLOYER, DRIVER, RIDER Moderate Difficult Moderate 3 EMPLOYER, DRIVER, RIDER Low Difficult (1)
Easy Low
4 THIRD PARTY, DRIVER, RIDER Moderate Difficult (1)
Easy Moderate
5 DRIVER, RIDER Low Difficult Easy (1)
Low
Depends on extent of t ransit agency involvement
Benefits
Riders
• Low cost and less wear and tear on personal vehicle.
Appendix I: Vanpool and Buspool Workshop Material
Panhandle Transportation Coordination Study I-11
• More time to relax, rest, and socialize with friends.
Employers
• Federal tax code allows tax-free transportation fringe benefits up to $105 per month per
employee to cover transit or vanpool expenses. Providing commuter tax benefits can save
payroll taxes for employer since the value of the benefit is considered a tax-free fringe
benefit and not wage or salary compensation (and therefore payroll taxes do not apply).
In other words, giving an employee $105 in vanpool salary compensation is less
expensive than raising salary by $105.
• Employers are able to recruit from a bigger geographic area since people are willing to
work farther from home if they know they do not have to drive every day.
• Vanpool riders tend to be on-time more than other employees because peer pressure
keeps everyone on schedule.
Community
• The average car makes about a pound of pollution for every 29 miles. That means, for
each 100-mile round-trip commute that is converted into a vanpool trip, about three
pounds of pollution a day or nearly 850 pounds a year is eliminated.
Type of Vehicle
Vehicles used to support vanpool programs should be the right size for the number of riders
estimated to use the service. Many programs rely on 12 passenger vans. However, 12 to 15
passenger vans are at a higher risk of rollover, especially with highway driving, and are more
difficult/costly to insure. Recommended vehicle types may include a 20 passenger mini bus or 8
passenger minivan (depending on the interest of people in the program). The estimated cost of a
12 passenger van suitable for the project is $25,000 to $30,000 (for propane). By contrast, the
estimated monthly cost of a lease for a 12 passenger van is $1,400.
Operating Costs
After purchasing the vehicles, additional costs will include gas, insurance, maintenance, and
administration. Perhaps the most expensive is the insurance. Many organizations are deterred

Appendix I: Vanpool and Buspool Workshop Material
Panhandle Transportation Coordination Study I-12
from providing vanpool services because of the exorbitant costs of insuring vehicles.
Determining factors include mileage, type of vehicle, driver experience, destination type, set
schedule versus dial-a-ride, type of passenger, and radius of the area. Since vanpools in rural
areas drive extensively and carry people, the insurance rate can exceed that of urban programs or
other type of commercial insurance. Below is Table I4: Barebones Estimate of Vanpool
Operations Costs, a working estimate of what it may cost to put a vanpool together in the
Childress area.
Bare-bones Estimate of Van Pool Operations Costs
Capital and Fixed CostsLease Purchase
Vehicle 1,400$ monthly* 637$ monthly ($30,000; 10%, 5 yrs)Insurance** -$ annually 2,000$ annuallyTires/Oil -$ annually 2,400$ annuallyPreventative Maintenance 2,000$ Total Annual 16,800$ 14,044$ *Quote from Enterprise at the non-corporate rate.**Quote made given a number of assumptions about driving distances and conditions
Fuel Distance 40 miles one wayMPG 12Cost/Gallon 2.89$ Fuel per Trip 9.63$ Cost of fuel per dayTrips/Month 42 21 work days; out and in bound trip
404.46$ monthly4,853.52$ annually
AdministrationHours for Admin Monthly 40 hrs (marketing, billing, other)Admin Salary 10$ Benefits, etc. 1.5Annual Admin Cost 7,200$ annually
Materials 300.00$ annually
Lease Purchase SOV CostTotal 21,953.52$ 19,197.52$ Riders 7 7 40 miles one wayCost per Rider 3,136.22$ Annually 2,742.50$ Annually 20 MPG
261.35$ Monthly 228.54$ Monthly12.45$ Daily 10.88$ Daily 11.56$ Daily (fuel only)6.22$ One way 5.44$ One way 5.78$ One way