Regional Transit System -...
24
Regional Transit System: Return on Investment Assessment March 2013
Transcript of Regional Transit System -...

Regional Transit System:Return on Investment Assessment
March 2013

1
Today’s agenda
▪ Itasca Project introduction
▪ Transit ROI objectives
▪ Results of analysis
▪ Comments from business leaders
▪ Conclusion
1

2
Itasca Project introduction
What is Itasca?
An employer-led civic alliance focused on:
▪ Building a thriving economy and quality of life in the Minneapolis-Saint Paul Metropolitan region
▪ Reducing and eliminating socioeconomic disparities
Who is Itasca?
50-plus cross-sector community leaders from Minneapolis-Saint Paul:
▪ Private sector CEOs
▪ Public sector leaders: the Governor, the Mayors of Minneapolis and St. Paul,
Chair of the Metropolitan Council, the leaders of the University of Minnesota
and MnSCU
▪ Leaders of major foundations and United Way

3
Itasca Project priorities
▪ Raise economic competitiveness and quality of life
▪ Reduce and eliminate disparities
Generating high-quality job growth
Advancing a comprehensive and
aligned transportation system
Improving our region’s
education system
Itasca project goals
2
1
3

The transportation system impacts the economic health and vitality of a region…
A comprehensive, integrated, and efficient transportation system is an important driver of economic development and, therefore, job growth because it…
▪ Connects employers to their workforce and enables employees to access employment; connects businesses to customers; maintains timely movement of goods
▪ Attracts and retains residents by providing greater diversity of travel options, including more free-flowing roads and affordable transit options
▪ Enables strategic, efficient investment in long-term infrastructure, e.g., energy grid, water system, housing, commercial and industrial buildings
When employers examine where to locate, strong transportation infrastructure is one of the top 3 considerations, along with workforce quality
4

…Transit is increasingly critical to sustaining the economic vitality of our region
� In Minnesota, transit plays a vital role in connecting jobs and employees today...
− 40% of downtown Minneapolis and St. Paul commuters use transit− According to MetCouncil, transit riders are more than 1/3 of peak hour
users of major freeways� ...and will become more important in the future
− Building out full transit system would give regional employers access to an additional half a million people within half an hour commute
− Increasingly, talented millennial generation employees are seeking cities with good transit
� Transit can be a cost-efficient way to add capacity in corridors, improving travel times across the system especially during peak congestion periods
� Competitor regions are investing heavily in transit; these regions include Denver, Salt Lake City and Dallas, all rapidly growing, dynamic regions
5

6
▪ Commissioned by Itasca
▪ Conducted by Cambridge Systematics, experts in transportation and economic analysis
▪ Guided by local Technical Advisory Committee
Objective: Evaluate potential transit impacts to the region using data-driven and transparent approach
Transit ROI study
6

7
Itasca asked 3 questions about regional transit investments
A built-out regional transit system would require substantial investment. What would be the return on that investment?
Investments can be made more or less quickly. Would
accelerating build out change the return on investment?
Many communities with developing transit systems experience more growth near transit stations. Would such expectations for
growth change the return on investment?
1
2
3
7

8
We compared four scenarios
Base case
2030 regional plan
Accelerated regional plan
▪ Includes current transit options and assumes outstanding commitments are built out (including Central Corridor)
▪ Assumes Metropolitan Council 2030 plan is executed, including expansion of bus service at 1% annually, nine arterial BRTs, four completed BRT corridors, and three new LRT lines
▪ Accelerates the regional plan from scenario one to a 2023 completion
2030 plan with growth near stations
▪ Proposes 2030 plan is built as in scenario one, but reallocates 25% of expected community growth to station areas (i.e., assumes station areas absorb more of future growth though does not presume new growth)
8

9
Current Regional Transit System Commitments
9

Proposed Regional Transit System – 2030
A regional transit system in the Minneapolis – St. Paul Metro area includes:
▪ 1% per year bus service expansion
▪ Addition of nine arterial BRTs
▪ Four BRT lines
▪ Total of five LRT lines
Mode and alignment for each corridor are still being determined
Source: The Twin Cities Metropolitan Council's 2030 Transitway Plan featuring commuter rail, light rail, bus rapid transit and improved bus corridors. 10

11
A few well-established metrics focused on transportation, safety, and health were incorporated as direct impacts:
1.Vehicle operating costs
2.Travel times and travel reliability
3.Shippers and logistics costs
4.Emissions
5.Safety costs
6.Road pavement conditions
We worked with the Metropolitan Council to develop costs for each
scenario: capital + operations & maintenance
We calculated six kinds of direct impacts
11

12
Direct Impacts – Results
Note: Benefits and operating and maintenance costs are calculated for 15-year period 2030-2045 for regional system, 2023-2045 for accelerated system. All are reported in 2010 dollar
*IRR = Internal Rate of Return, the discount rate often used in capital budgeting that makes the net present value of all cash flows from a particular project equal to zero
Scenario
Total direct impacts
2030 Plan with growth near stations
3
Accelerated Regional Plan
2
2030 Regional Plan1
Investment
$4,361
$5,289
$4,361
Low
$6,571
$10,762
$9,082
High
$10,083
$16,516
$13,927
IRR*
7.8 – 14.8%
11.2 – 18.0%
13.0 – 20.9%
Compared to base case scenario2010 $ Millions
12

13
Direct impacts by category
1. Travel time savings and reliability
2. Vehicle operating cost savings
3. Shipper and logistics cost savings
4. Reduction in emissions
5. Safety benefits
6. Pavement maintenance savings
• TOTAL
Note: Benefits and operating and maintenance costs are calculated for 15-year period 2030-2045 for regional system or 2023-2045 for accelerated scenario. All are reported in 2010 dollars
$4,643 - $11,429
$1,479 - $4,717
$185 - $271
$185 - $395
$53 - $88
$26 - $54
$6,571 - $16,516
Compared to base case 2010 $ Millions
13

14
A regional transit system enables employers to access more potential employees
2.2
1.7
With transit build-out*
Base Case
+25%2.8
2.3
+22%
With transit build-out*
Base Case
Working-age population accessible to employers within 30 minute commute (Millions)
In year 2030 In year 2045
Building the regional transit system would enable employers in the region to access 500,000 more employees within a 30 minute commute, a 22 – 25% increase
* With build-out of the 2030 regional plan 14

15
Additional impact not considered in the ROI study results:
Short-term economic impacts:
▪ $4.3 billion in construction impacts – Economic activity created over the construction period
▪ 30,000 construction jobs – FTE job-years tied to build-out of the transit system
If Federal dollars are leveraged for investments, then the ROI of state/local dollars would be even higher
Experience with Hiawatha and Central Corridor suggest Scenario 3, with the highest benefits, is a likely scenario▪ 2 million square feet of office space was constructed
within half a mile of Hiawatha from 2004-2010▪ Development of new housing exceeded 2020 projections
by nearly 50% within first year of operation▪ $1.2B of construction has been approved along Central
Corridor, set to open in 2014
15SOURCE: MetCouncil, U of MN Transitways Impact Research Program
16
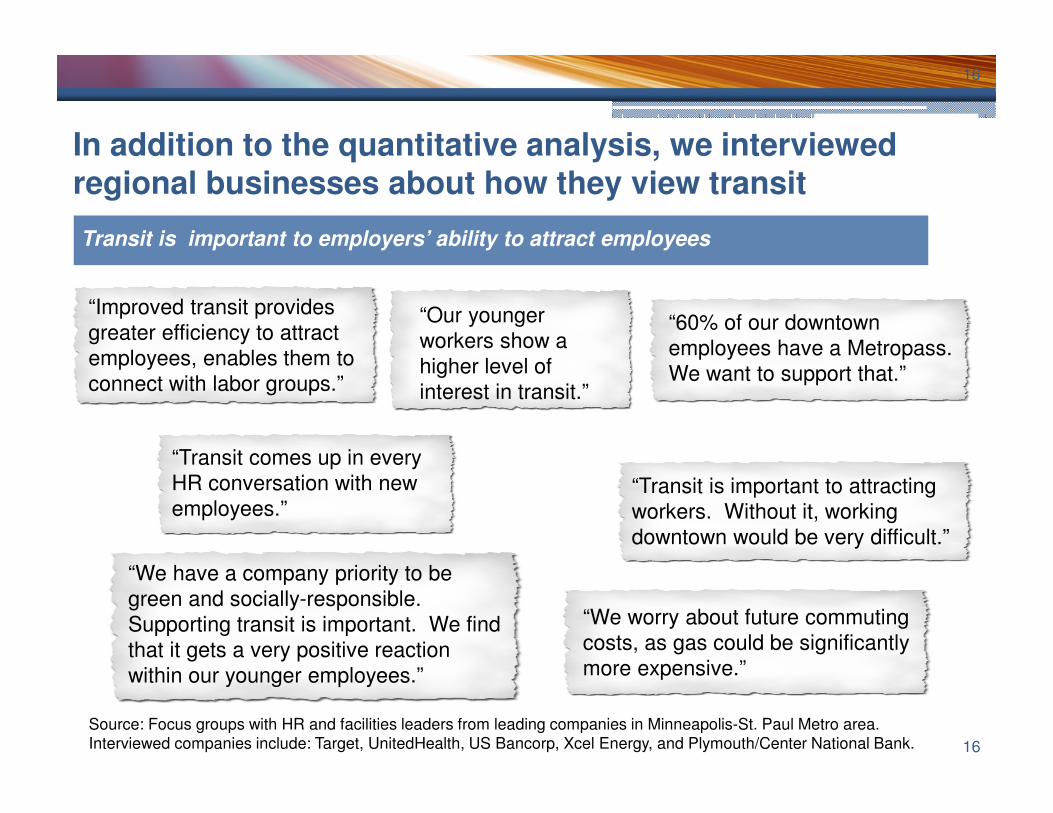
In addition to the quantitative analysis, we interviewed regional businesses about how they view transit
Source: Focus groups with HR and facilities leaders from leading companies in Minneapolis-St. Paul Metro area. Interviewed companies include: Target, UnitedHealth, US Bancorp, Xcel Energy, and Plymouth/Center National Bank.
“Improved transit provides greater efficiency to attract employees, enables them to connect with labor groups.”
“Transit comes up in every HR conversation with new employees.”
“60% of our downtown employees have a Metropass. We want to support that.”
“Our younger workers show a higher level of interest in transit.”
“Transit is important to attracting workers. Without it, working downtown would be very difficult.”
“We have a company priority to be green and socially-responsible. Supporting transit is important. We find that it gets a very positive reaction within our younger employees.”
“We worry about future commuting costs, as gas could be significantly more expensive.”
Transit is important to employers’ ability to attract employees
16
17
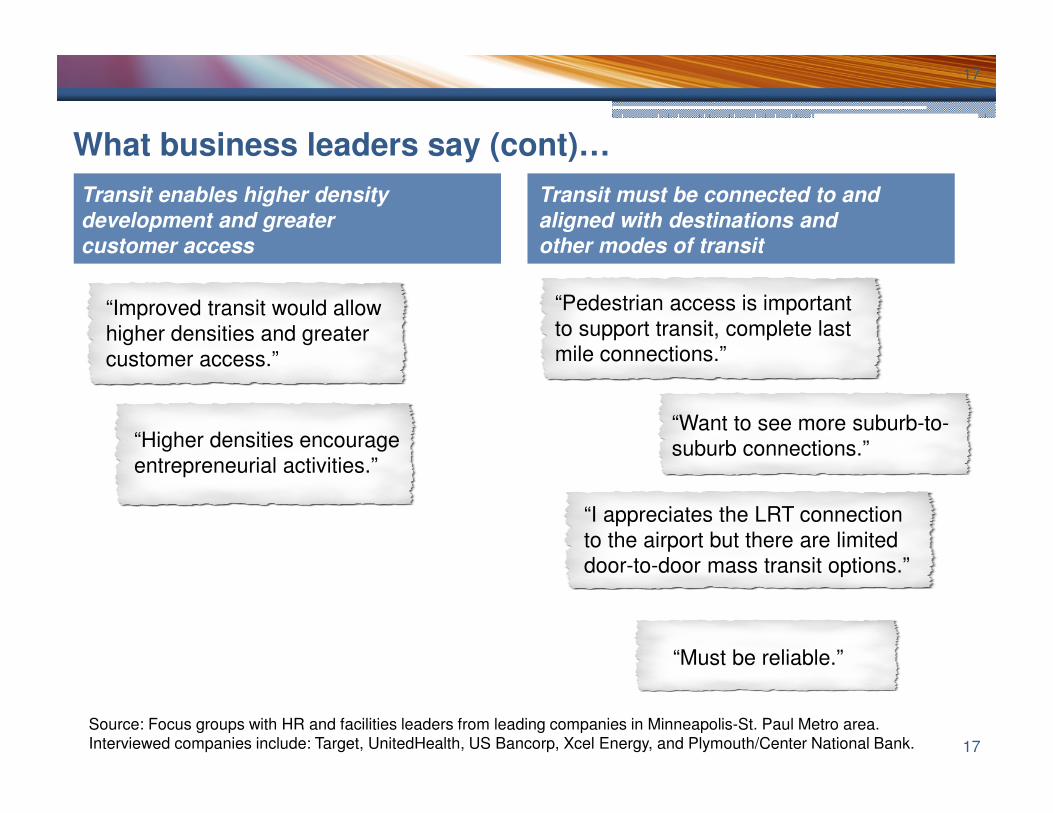
What business leaders say (cont)…
“Improved transit would allow higher densities and greater customer access.”
Transit enables higher density
development and greater
customer access
“Higher densities encourage entrepreneurial activities.”
Transit must be connected to and
aligned with destinations and
other modes of transit
“Pedestrian access is important to support transit, complete last mile connections.”
“Want to see more suburb-to-suburb connections.”
“I appreciates the LRT connection to the airport but there are limited door-to-door mass transit options.”
“Must be reliable.”
Source: Focus groups with HR and facilities leaders from leading companies in Minneapolis-St. Paul Metro area. Interviewed companies include: Target, UnitedHealth, US Bancorp, Xcel Energy, and Plymouth/Center National Bank. 17

18
Summary
▪ Based on direct impacts alone, the benefits of implementing a regional transit system far outweigh the costs– Building the 2030 regional plan would result in $6.6 – 10.1 billion in direct benefits,
on a $4.4 billion investment (between 2030 – 2045)– Accelerating the system buildout to 2023 would result in increased direct benefits:
$10.7 – 16.5 billion on a $5.3 billion investment– More community growth near transit stations would also increase the return on
investment by an additional $2 - $4 billion
▪ In addition to the quantified direct benefits, the region would benefit from many wider economic benefits– Increased access to employers (an additional 500,000 within 30-minute commute)– 30,000 construction jobs and $4.3 billion in economic impacts
▪ Interviewed employers reinforced the benefits of a regional transit system– A comprehensive transit system is critical to attract and retain employees
18

19
Appendix
19

20
Methodology and key assumptions
▪ The analysis estimates future benefits arising from transportation system user benefits, sustainability benefits, state-of-good repair benefits and wider economic development benefits
▪ Utilizes output from Metropolitan Council’s regional travel demand model; population estimates based on Met Council
▪ Discount rate is 2.8 percent, as recommended by MnDOT
▪ The SW Corridor is assumed to commence operation in 2018; for regional assessment, all corridors are assumed to operational in 2030 and impacts from 2030-2045 are estimated and reported
▪ The price of fuel used in the travel demand and mode choice models is $3.41 per gallon ($2.59 in 2000$ based on the CPI) to reflect the average cost of fuel in the region on October 26, 2011
20
21
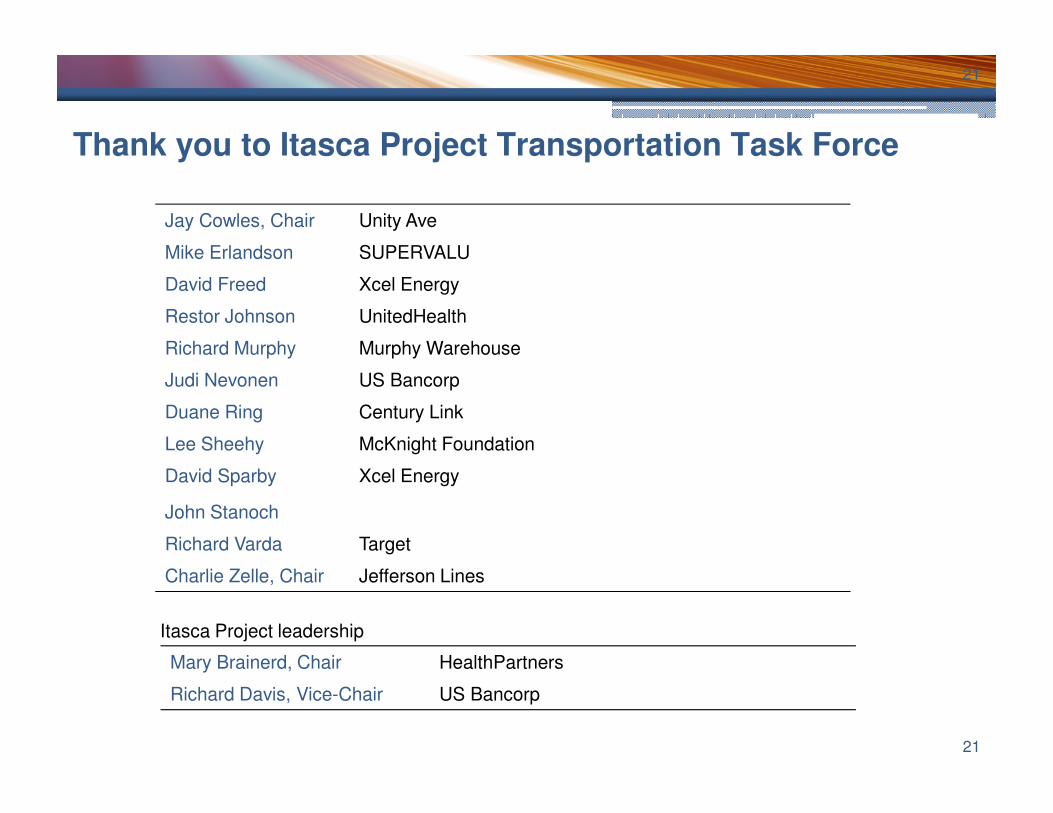
Thank you to Itasca Project Transportation Task Force
Jay Cowles, Chair Unity Ave
Mike Erlandson SUPERVALU
David Freed Xcel Energy
Restor Johnson UnitedHealth
Richard Murphy Murphy Warehouse
Judi Nevonen US Bancorp
Duane Ring Century Link
Lee Sheehy McKnight Foundation
David Sparby Xcel Energy
John Stanoch
Richard Varda Target
Charlie Zelle, Chair Jefferson Lines
Mary Brainerd, Chair HealthPartners
Richard Davis, Vice-Chair US Bancorp
Itasca Project leadership
21

22
Thank you to Technical Advisory Committee
Mary Richardson CTIB
Mary Kay Baily Corridors of Opportunity
Katie Walker Hennepin County
David Lawless Hennepin County
Lee Sheehy McKnight Foundation
Eric Muschler McKnight Foundation
Arlene McCarthy Metropolitan Council
Guy Peterson Metropolitan Council
Mark Filipi Metropolitan Council
John Kari Metropolitan Council
Will Schroeer Minneapolis Regional Chamber of Commerce and Saint Paul Area Chamber of Commerce
Jim Erkel Minnesota Center for Environmental Advocacy
Kate Johansen Minnesota Chamber of Commerce
David Levinson University of Minnesota
Laurie McGinnis University of Minnesota
Caren Dewar ULI MN and Regional Council of Mayors
Ted Schnoenecker Washington County
22

Credentials of Cambridge Systematics
23
The Itasca Project working team, in consultation with its Technical Advisory Committee, selected Cambridge Systematics (CS) via a competitive bidding process. CS was selected based on the breadth and depth of its experience in transit and economic analyses. Details on services provided and relevant experience of CS is available on the CS website: http://www.camsys.com/
Cambridge Systematics has deep experience with Federal, state, and local government▪ Relationships with 9 Federal agencies,
including on-call contracts with FHWAand FTA
▪ Served 44 state governments and over 60 MPOs and other local government bodies
Experience with multiple modes of transit (e.g., LRT, local and intercity bus, alternative transportation services)
TCRP H-9: Economic Impact Analysis of Transit Investments: Evaluation of methods used to conduct economic impact analysis for proposed transit investmentsAPTA Economic Analysis: Economic impacts of national transit investments Envision Utah Economic Impacts of Public Transportation System Expansion: Direct effects of public transit investments on travel efficiency, user benefits, and the regional economy. LAMTA Economic Impact Benefits Study: Long-range economic impacts of alternative transportation development and financing plans NYMTA Benefits: Long-term economic consequences of investments in public transportation facilities and services California High-Speed Rail: Induced Growth Summary and Secondary Impacts Analysis
Key Qualifications Highlighted projects