
REGIONAL DISPARITIES AND DEVELOPMENT ... - GRINCOH - Growth
20
1 REGIONAL DISPARITIES AND DEVELOPMENT DYNAMICS OF CEE REGIONS IN THE PERIOD OF PROSPERITY AND AUSTERITY Maciej Smętkowski Centre for European Regional and Local Studies (EUROREG) University of Warsaw GRINCOH WP 6 Task 2 Subtask 2a The research leading to these results has received funding from the European Union's Seventh Framework Programme (FP7/2007-2013) under grant agreement “Growth-Innovation- Competitiveness: Fostering Cohesion in Central and Eastern Europe” (GRNCOH)
Transcript of REGIONAL DISPARITIES AND DEVELOPMENT ... - GRINCOH - Growth
1
REGIONAL DISPARITIES AND DEVELOPMENT DYNAMICS OF CEE
REGIONS IN THE PERIOD OF PROSPERITY AND AUSTERITY
Maciej Smętkowski
Centre for European Regional and Local Studies (EUROREG)
University of Warsaw
GRINCOH WP 6 Task 2 Subtask 2a
The research leading to these results has received funding from the European Union's Seventh
Framework Programme (FP7/2007-2013) under grant agreement “Growth-Innovation-
Competitiveness: Fostering Cohesion in Central and Eastern Europe” (GRNCOH)

2
Maciej Smętkowski
Regional disparities and development dynamics of CEE regions in the period of prosperity
and austerity
Abstract:
The aim of the paper is to show the scale of the disparities and development dynamics of the Central and
Eastern European (CEE) regions. The paper seeks to find answers to the following research questions: a)
whether the regional development of CEE countries is in line with J. Williamson’s hypothesis related to the
correlation between the level of national income and the scale of regional disparities; b) what are the main
reasons driving the changes in the scale of regional disparities spatially, and c) how the economic crisis has
affected the growth dynamics of these regions. Empirical studies have shown a decrease in the pace of regional
divergence as the level of income increased in individual countries. This process was taking place in the
conditions of a distinct petrification of regional economic structures – visible especially if the capital city
regions were excluded from the analysis, which could indicate that the spread-backwash processes balance out
in the conditions of an economic boom, such as the years 2004-2008. However, the first phase of the economic
crisis was rather ‘patchy’ in spatial terms, but due to its less severe impact in the capital city regions it should
not be expected that it will trigger any distinct changes in the spatial structures formed in long durée processes.
Introduction
Owing to their robust economic development during the last decade, the Central and Eastern
European countries which are members of the European Union (EU10)1 have significantly caught up
in affluence in relation to the ‘old’ Member States (EU15). On the one hand, this was a result of a
good economic climate globally until the financial crisis of 2008, and on the other, a direct and
indirect consequence of their EU accession. This trend was halted as a result of the global economic
crisis of 2008, which invites the questions concerning the reactions of the regional structures of the
analysed countries and the spatial effects of economic growth during the time of economic
prosperity preceding the crisis.
The earlier research studies of regional development in CEE countries clearly showed that the
countries of this macroregion saw a marked increase in the scale of regional disparities, mainly due
to the fast development of their capital city regions (cf. e.g. Gorzelak 1996, Petrakos 2001, Römich
2003, Ezcurra et al. 2007, Smętkowski, Wójcik 2013). This divergence corroborated Williamson’s
(1965) hypothesis stating that the narrow regional disparities typical of countries with a low level of
development tend to increase rapidly in the first stage of their catching up with highly developed
countries. As the next step, however, in line with this theory, the divergence should be halted and, in
the long term, the scale of disparities in the regional incomes should fall to their original level. It
should be noted that some researchers question the last phase of this curve, and point out new
factors arising from the development of contemporary information economy and the role of
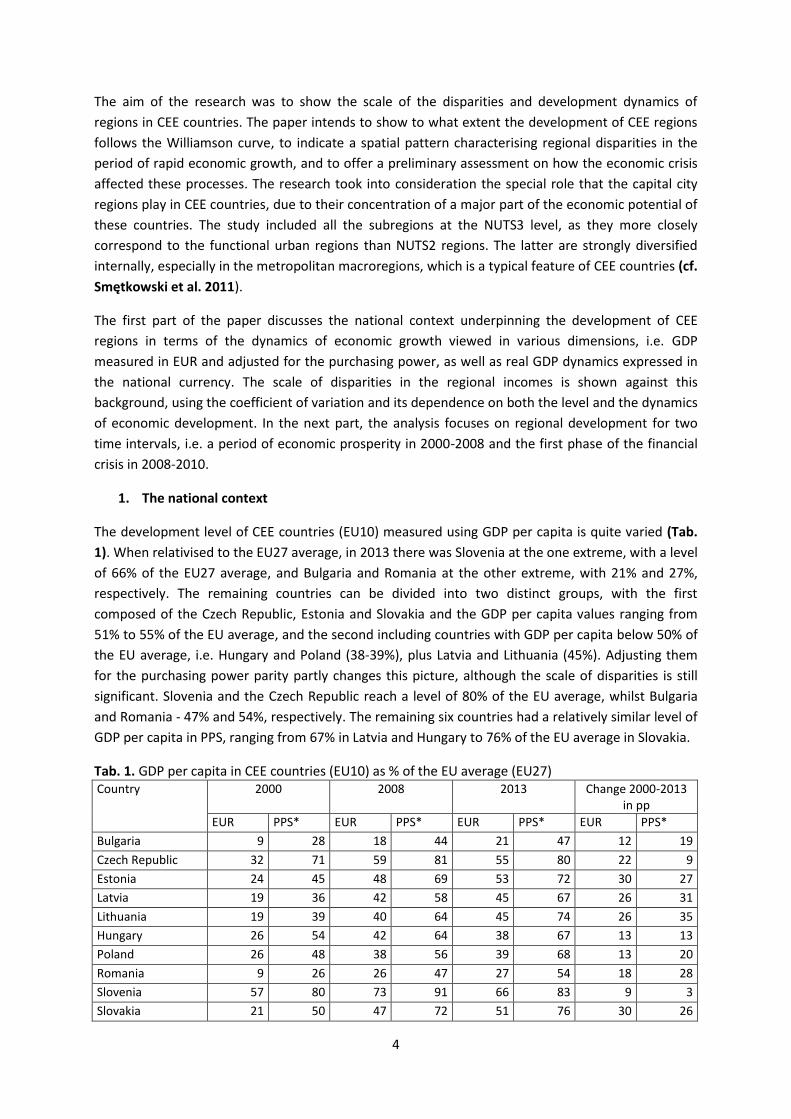
innovation in development processes. R. Capello (2007, p. 94), observed that the verification of
Willamson’s hypothesis may prove difficult regarding the second phase of the process (convergence),
which could be caused by the overlapping of different stages of economic growth associated with
subsequent waves of innovation. In consequence, the disparities generated during the first phase
may be reinforced or even widened (Fig. 1). It seems that such processes could be curbed not when
poorer regions become attractive for products and services typical of mature markets but when they 1 The study does not include Croatia, an EU member since 2014.
3
themselves become places where innovative products in the first phase of their lifecycle are
manufactured or when the innovation potential of the core regions wanes or weakens. On the other
hand, however, some authors (e.g. Szörfi 2007) claim that convergence processes described by the
Williamson curve can be observed in the European Union, although they can be better explained by
other factors such as: systemic transformation in the post-communist countries, monetary union,
access to Structural Funds or institutional capacity, rather than by the mere level of national
development.
Fig. 1. Regional disparities and income levels
Source: Capello 2007.
A topic which is considerably less frequently discussed in the literature of the subject is how regional
disparities affect the effectiveness of economic growth processes. In effect, there is little evidence to
prove that the scale of such disparities significantly affects development processes nationally. At the
same time, it is often prescriptively assumed that strong (and sometimes regarded as excessive)
regional divergence is a negative phenomenon as it precludes a full use of the development potential
(mostly the existing pool of labour) of peripheral regions and can exacerbate social problems in
poorer regions. In consequence, regional policies in many countries aim to reduce regional
disparities, primarily those measured by gross regional product per capita (Boldrin, Canova 2001).
More often than not, such policy fails to achieve the anticipated results, and this is increasingly an
argument in favour of reformulating the traditional model and supporting competitiveness, which is
done inter alia by measures facilitating the unlocking of the indigenous potential in all the regions of
a given country. In parallel, internal disparities are highlighted so as the leading role of urban areas
(OECD 2010). This is even more pertinent in view of the fact that, as indicated amongst others by the
report published by the World Bank (2009), spatial concentration of economic activity produces a
number of benefits, notably increased productivity and innovativeness as well as enhanced
adaptability to the changing development conditions, associated with the diversifying economic
structures and the size of the labour markets of the growth poles, which contemporarily means
metropolitan areas. Moreover, it should be borne in mind that, semantically, ‘cohesion’, a term
which is frequently invoked while formulating and implementing such policy, and ‘convergence’, are
not synonymous and call for different sets of measures (Gorzelak 2009).
4
The aim of the research was to show the scale of the disparities and development dynamics of
regions in CEE countries. The paper intends to show to what extent the development of CEE regions
follows the Williamson curve, to indicate a spatial pattern characterising regional disparities in the
period of rapid economic growth, and to offer a preliminary assessment on how the economic crisis
affected these processes. The research took into consideration the special role that the capital city
regions play in CEE countries, due to their concentration of a major part of the economic potential of
these countries. The study included all the subregions at the NUTS3 level, as they more closely
correspond to the functional urban regions than NUTS2 regions. The latter are strongly diversified
internally, especially in the metropolitan macroregions, which is a typical feature of CEE countries (cf.
Smętkowski et al. 2011).
The first part of the paper discusses the national context underpinning the development of CEE
regions in terms of the dynamics of economic growth viewed in various dimensions, i.e. GDP
measured in EUR and adjusted for the purchasing power, as well as real GDP dynamics expressed in
the national currency. The scale of disparities in the regional incomes is shown against this
background, using the coefficient of variation and its dependence on both the level and the dynamics
of economic development. In the next part, the analysis focuses on regional development for two
time intervals, i.e. a period of economic prosperity in 2000-2008 and the first phase of the financial
crisis in 2008-2010.
1. The national context
The development level of CEE countries (EU10) measured using GDP per capita is quite varied (Tab.
1). When relativised to the EU27 average, in 2013 there was Slovenia at the one extreme, with a level
of 66% of the EU27 average, and Bulgaria and Romania at the other extreme, with 21% and 27%,
respectively. The remaining countries can be divided into two distinct groups, with the first
composed of the Czech Republic, Estonia and Slovakia and the GDP per capita values ranging from
51% to 55% of the EU average, and the second including countries with GDP per capita below 50% of
the EU average, i.e. Hungary and Poland (38-39%), plus Latvia and Lithuania (45%). Adjusting them
for the purchasing power parity partly changes this picture, although the scale of disparities is still
significant. Slovenia and the Czech Republic reach a level of 80% of the EU average, whilst Bulgaria
and Romania - 47% and 54%, respectively. The remaining six countries had a relatively similar level of
GDP per capita in PPS, ranging from 67% in Latvia and Hungary to 76% of the EU average in Slovakia.
Tab. 1. GDP per capita in CEE countries (EU10) as % of the EU average (EU27) Country 2000 2008 2013 Change 2000-2013
in pp
EUR PPS* EUR PPS* EUR PPS* EUR PPS*
Bulgaria 9 28 18 44 21 47 12 19
Czech Republic 32 71 59 81 55 80 22 9
Estonia 24 45 48 69 53 72 30 27
Latvia 19 36 42 58 45 67 26 31
Lithuania 19 39 40 64 45 74 26 35
Hungary 26 54 42 64 38 67 13 13
Poland 26 48 38 56 39 68 13 20
Romania 9 26 26 47 27 54 18 28
Slovenia 57 80 73 91 66 83 9 3
Slovakia 21 50 47 72 51 76 30 26
5
*PPS – purchasing power standard
Source: prepared by the author based on Eurostat data.
Viewed in a dynamic approach in comparison to 2000, the most visible improvement in terms of GDP
per capita in EUR could be observed in the Baltic states and Slovakia (26-30 pp). In the Czech Republic
and Romania, it was a 22pp and 18pp increase, respectively, and about 1 pp per annum in the
remaining countries, with the exception of Slovenia where the situation had improved only by 9pp.
On the other hand, it could be observed that the countries which were the biggest losers in relation
to the EU average as a result of the economic crisis were Slovenia, Hungary and the Czech Republic
(ca. 4-5pp). In terms of purchasing power parity, Romania and Lithuania (9-10pp), in addition to
Bulgaria, Poland, Romania, and Latvia (5-7pp), were the countries which recorded a positive change
in relation to the level of affluence measured in EUR, whereas the Czech Republic (13pp), Slovenia
(6pp), and also, though less so, Estonia (3pp), were the countries whose situation had clearly
deteriorated in this approach. Likewise, in 2013 Slovenia was the only country where GDP per capita
fell below the 2008 level (a 8pp contraction).
Fig. 2. Real GDP dynamics (1989 = 100)
Source: prepared by the author.
An analysis of real growth dynamics expressed in the national currency and in a longer term (from
1989) offers a different picture (Fig. 2). Leaving aside the development trajectories that these
countries had followed prior to the crisis (cf. Gorzelak, Smętkowski 2010), we can see that the
economies of the CEE countries responded to the 2008 economic crisis in a variety of ways. Whilst a
fast development rate characterised all these countries before the crisis, the fastest growth being
6
recorded in the Baltic states and Slovakia, the consequences of the crisis varied from country to
country. No GDP decrease was recorded in the case of Poland, and the crisis in Slovakia lasted for a
very short time. On the other hand, some crisis phenomena are still visible in the economy of
Slovenia, the Czech Republic and Hungary are stagnating, whereas economic growth in Bulgaria and
Romania is very slow. At the same time, the Baltic states quickly rebound from the particularly acute
crisis, especially in Estonia, which reached the level it had had prior to the crisis.
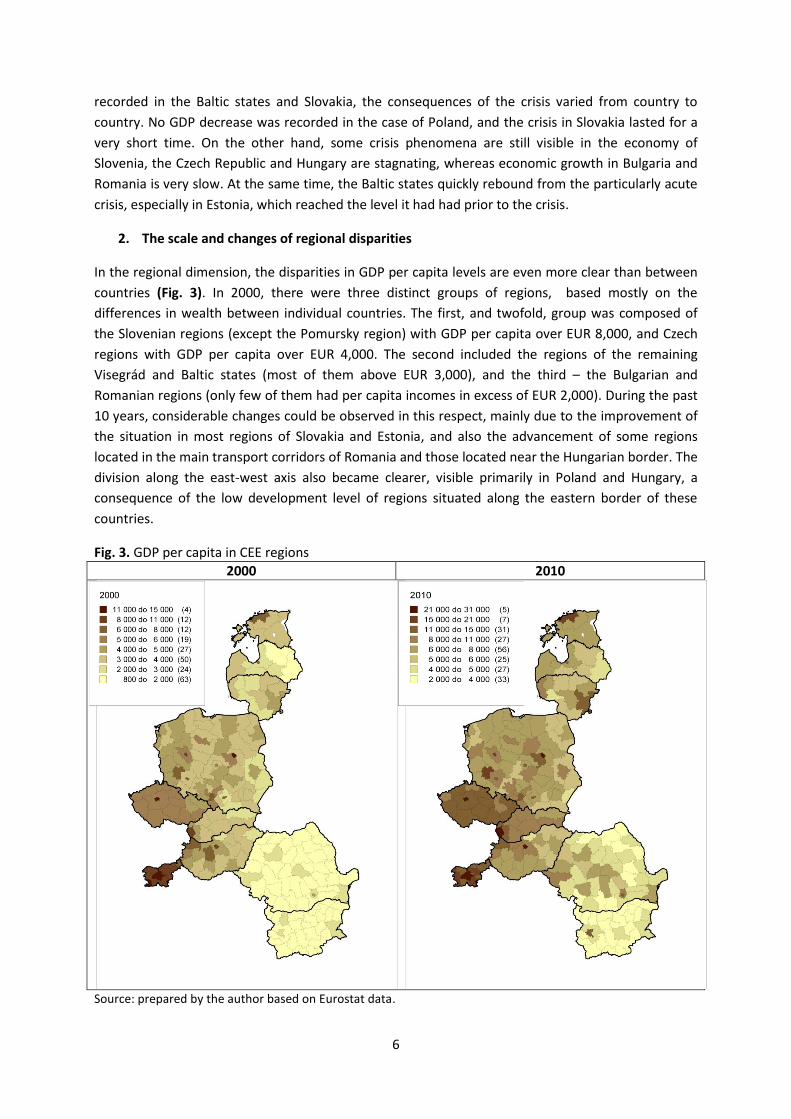
2. The scale and changes of regional disparities
In the regional dimension, the disparities in GDP per capita levels are even more clear than between
countries (Fig. 3). In 2000, there were three distinct groups of regions, based mostly on the
differences in wealth between individual countries. The first, and twofold, group was composed of
the Slovenian regions (except the Pomursky region) with GDP per capita over EUR 8,000, and Czech
regions with GDP per capita over EUR 4,000. The second included the regions of the remaining
Visegrád and Baltic states (most of them above EUR 3,000), and the third – the Bulgarian and
Romanian regions (only few of them had per capita incomes in excess of EUR 2,000). During the past
10 years, considerable changes could be observed in this respect, mainly due to the improvement of
the situation in most regions of Slovakia and Estonia, and also the advancement of some regions
located in the main transport corridors of Romania and those located near the Hungarian border. The
division along the east-west axis also became clearer, visible primarily in Poland and Hungary, a
consequence of the low development level of regions situated along the eastern border of these
countries.
Fig. 3. GDP per capita in CEE regions
2000 2010
Source: prepared by the author based on Eurostat data.
7
The scale of regional disparities can be measured using different indicators such as the weighted or
unweighted coefficient of variation, the Gini coefficient or the Theil index (cf. e.g. Smętkowski,
Wójcik 2012). They are all characterised by varying degrees of susceptibility to the number of units
being measured. Regardless of the above, factors which have a comparable if not stronger bearing
on the results of the exercise include the spatial scale and the administrative divisions in individual
countries. Therefore, the results of comparisons of regional disparities between countries should be
treated with caution. Importantly, however, these reservations do not apply to the dynamics of these
disparities as the observation of regional convergence or divergence processes is much less
dependent on a given administrative division or specific indicator (cf. Smętkowski 2013). For this
reason, in our analysis, we used the coefficient of variation in a dynamic approach, calculated for the
NUTS3 regions with the cities included into the surrounding regions, in order to minimise the impact
of the statistical division in individual countries on the results of the exercise.
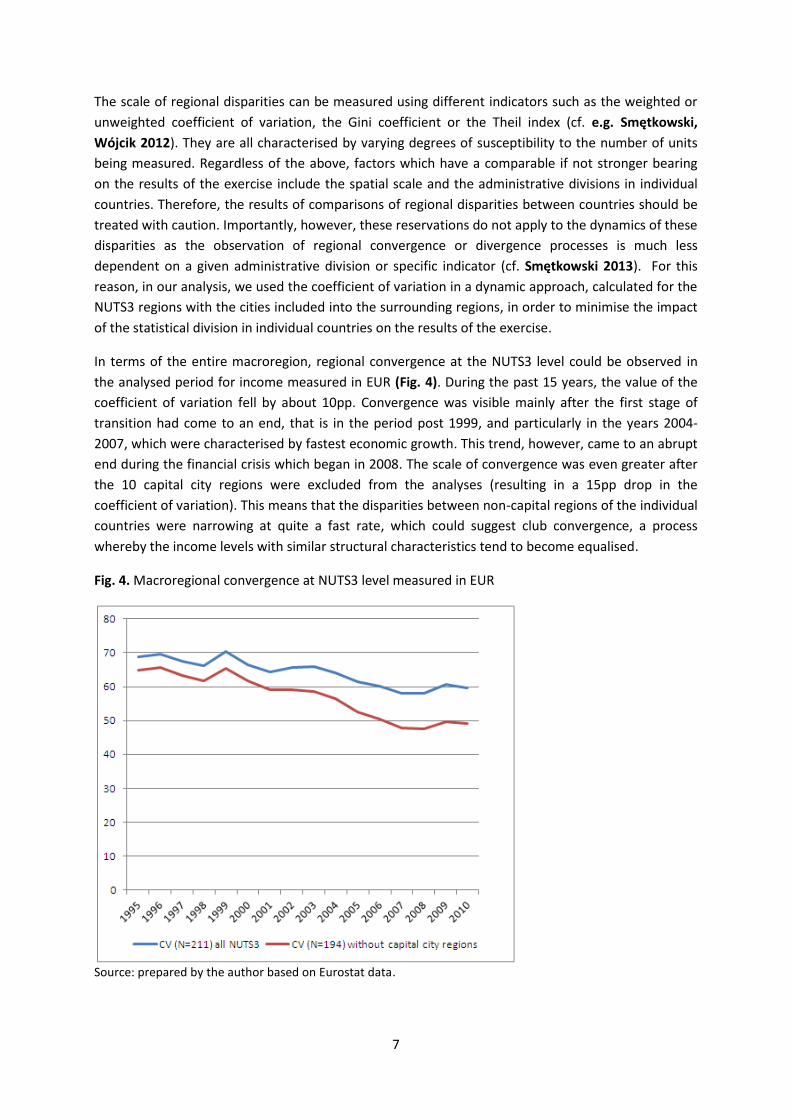
In terms of the entire macroregion, regional convergence at the NUTS3 level could be observed in
the analysed period for income measured in EUR (Fig. 4). During the past 15 years, the value of the
coefficient of variation fell by about 10pp. Convergence was visible mainly after the first stage of
transition had come to an end, that is in the period post 1999, and particularly in the years 2004-
2007, which were characterised by fastest economic growth. This trend, however, came to an abrupt
end during the financial crisis which began in 2008. The scale of convergence was even greater after
the 10 capital city regions were excluded from the analyses (resulting in a 15pp drop in the
coefficient of variation). This means that the disparities between non-capital regions of the individual
countries were narrowing at quite a fast rate, which could suggest club convergence, a process
whereby the income levels with similar structural characteristics tend to become equalised.
Fig. 4. Macroregional convergence at NUTS3 level measured in EUR
Source: prepared by the author based on Eurostat data.

8
In the national dimension, an opposite tendency could be observed, that is a clear divergence of
regional incomes (Fig. 5). An analysis of the status and changes in the variation coefficients of
regional incomes in CEE countries leads to the following conclusions:
The best developed countries, the Czech Republic and Slovenia, were also most cohesive in
terms of the differences in regional affluence, a feature that quite distinctly distinguished
them from the remaining countries;
Poland and Hungary were both countries with an average level of regional disparities, and
relatively stable values of the coefficient of variation in the analysed period;
The Baltic states saw a rapid increase in regional GDP disparities until 2006, a trend which
slowed down considerably in the subsequent years, producing regional convergence in the
case of Latvia;
In Romania and Bulgaria, there was a rapid polarisation of regional incomes; both these
countries are among those with widest disparities in the macroregion;
Slovakia was the country with the widest regional disparities in terms of GDP, and at the
same time a leader in the polarisation rate, which was mainly due to the rapid development
of Bratislava.
Fig. 5. Regional disparities (NUTS3)* in CEE countries in 1995-2010 [coefficient of variation]
* cities combined with surrounding NUTS3 regions
Source: prepared by the author based on Eurostat data.
Excluding the capital city regions from the analysis produces interesting results; in their case, no such
clear tendency for divergence can be observed in terms of regional incomes within individual
countries (Fig. 6). On this basis, the following generalisations can be made:
Poland and Romania, countries with the greatest polycentricity of the settlement network
(cf. ESPON 1.1.1, 2004), were characterised by the largest, and fast-growing, regional

9
polarisation, which could indicate the spread of metropolisation processes to other, non-
capital urban centres.
Polarisation processes (visible on a greater scale post 2000) were also taking place in
Lithuania, Bulgaria and Slovenia, which - especially in the former two countries - could
suggest that diffusion was occurring within a bipolar settlement system.
Starting from 2000 onwards, Latvia and to some extent Hungary were the scenes of distinct
convergence processes relating to the development level of non-capital regions, which could
be viewed as proof of spread processes from the capital city regions, which enjoyed a
relatively strongest position domestically in terms of GDP share of all the CEE countries.
Regional disparities in Slovakia were the most volatile: following a fast polarisation in 2002-
2006, the subsequent years saw considerable convergence, which could prove a low level of
economic diversification of some regions (for instance, the Košický kraj specialises in
metallurgical manufacturing).
In Estonia and the Czech Republic, the income disparities between non-capital regions were
the smallest and quite stable, which means that the examples of problem regions were few
and far between.
Fig. 6. Regional disparities (NUTS3) in CEE countries in 1995-2010 (with the capital city regions
excluded) [coefficient of variation]
Source: prepared by the author based on Eurostat data.
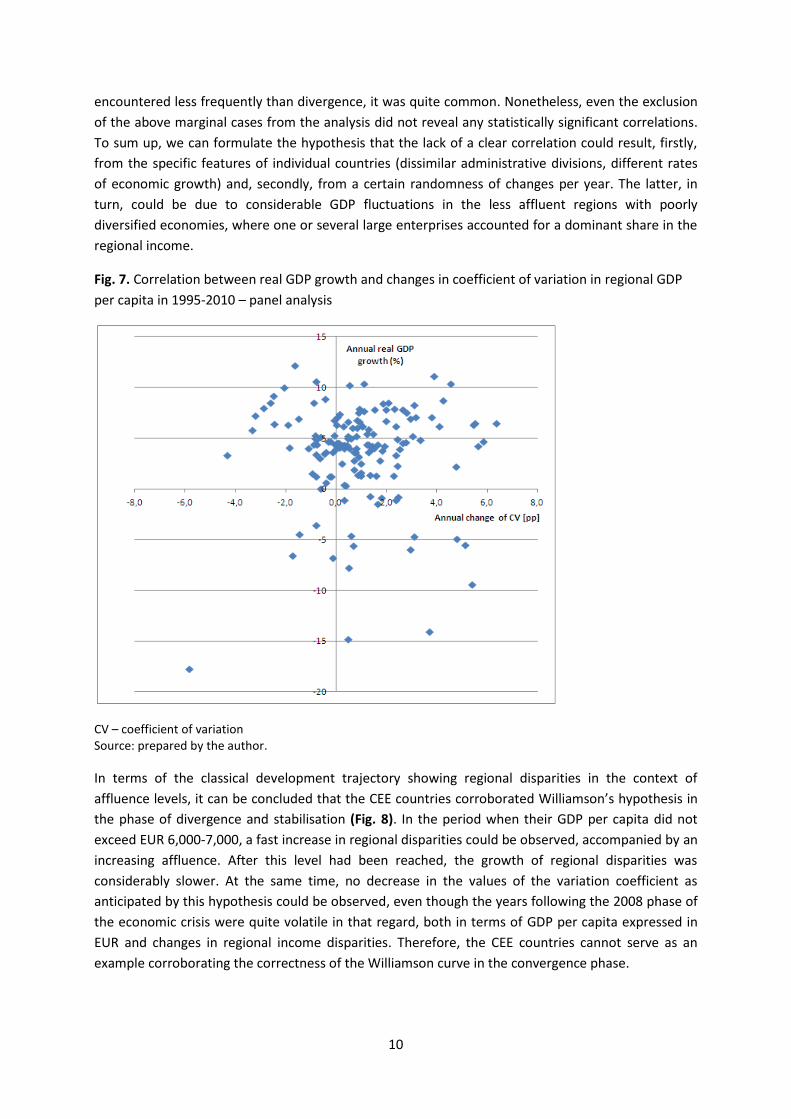
Another interesting question is whether the changes in the variation coefficient of regional GDP per
capita values were correlated with the GDP dynamics for the entire country. The panel data analysis
which was carried out for the years 1995–2010 did not confirm the existence of such a correlation
(Fig. 7). The lack of correlation was partly a result of the existence of two groups of variations. The
first comprised the few instances of real GDP contraction per year, which was usually accompanied
by a marked increase in the regional disparities. The second group includes cases of a high rate of
GDP growth (over 5%), accompanied by regional convergence; although this situation was
0,0
5,0
10,0
15,0
20,0
25,0
30,0
35,0
1995 1996 1997 1998 1999 2000 2001 2002 2003 2004 2005 2006 2007 2008 2009 2010
PL
RO
HU
BG
LT
SK
SI
LV
CZ
EE
10
encountered less frequently than divergence, it was quite common. Nonetheless, even the exclusion
of the above marginal cases from the analysis did not reveal any statistically significant correlations.
To sum up, we can formulate the hypothesis that the lack of a clear correlation could result, firstly,
from the specific features of individual countries (dissimilar administrative divisions, different rates
of economic growth) and, secondly, from a certain randomness of changes per year. The latter, in
turn, could be due to considerable GDP fluctuations in the less affluent regions with poorly
diversified economies, where one or several large enterprises accounted for a dominant share in the
regional income.
Fig. 7. Correlation between real GDP growth and changes in coefficient of variation in regional GDP
per capita in 1995-2010 – panel analysis
CV – coefficient of variation Source: prepared by the author.
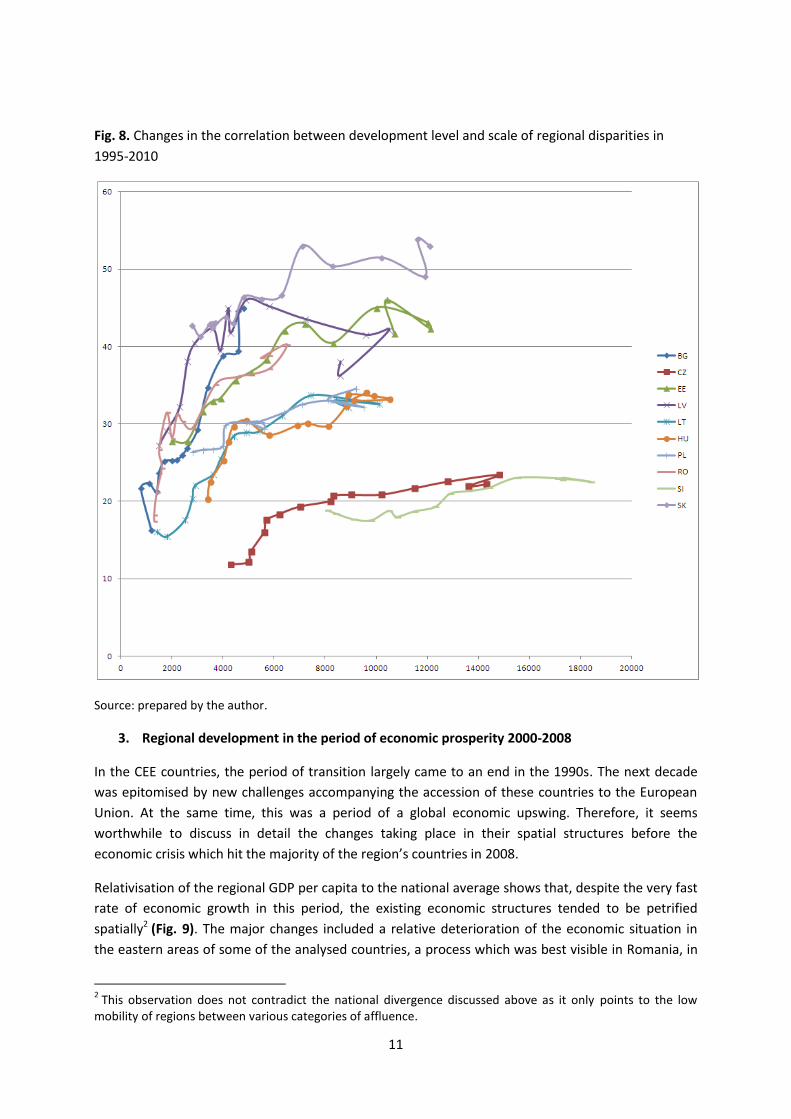
In terms of the classical development trajectory showing regional disparities in the context of
affluence levels, it can be concluded that the CEE countries corroborated Williamson’s hypothesis in
the phase of divergence and stabilisation (Fig. 8). In the period when their GDP per capita did not
exceed EUR 6,000-7,000, a fast increase in regional disparities could be observed, accompanied by an
increasing affluence. After this level had been reached, the growth of regional disparities was
considerably slower. At the same time, no decrease in the values of the variation coefficient as
anticipated by this hypothesis could be observed, even though the years following the 2008 phase of
the economic crisis were quite volatile in that regard, both in terms of GDP per capita expressed in
EUR and changes in regional income disparities. Therefore, the CEE countries cannot serve as an
example corroborating the correctness of the Williamson curve in the convergence phase.
11
Fig. 8. Changes in the correlation between development level and scale of regional disparities in
1995-2010
Source: prepared by the author.
3. Regional development in the period of economic prosperity 2000-2008
In the CEE countries, the period of transition largely came to an end in the 1990s. The next decade
was epitomised by new challenges accompanying the accession of these countries to the European
Union. At the same time, this was a period of a global economic upswing. Therefore, it seems
worthwhile to discuss in detail the changes taking place in their spatial structures before the
economic crisis which hit the majority of the region’s countries in 2008.
Relativisation of the regional GDP per capita to the national average shows that, despite the very fast
rate of economic growth in this period, the existing economic structures tended to be petrified
spatially2 (Fig. 9). The major changes included a relative deterioration of the economic situation in
the eastern areas of some of the analysed countries, a process which was best visible in Romania, in
2 This observation does not contradict the national divergence discussed above as it only points to the low
mobility of regions between various categories of affluence.
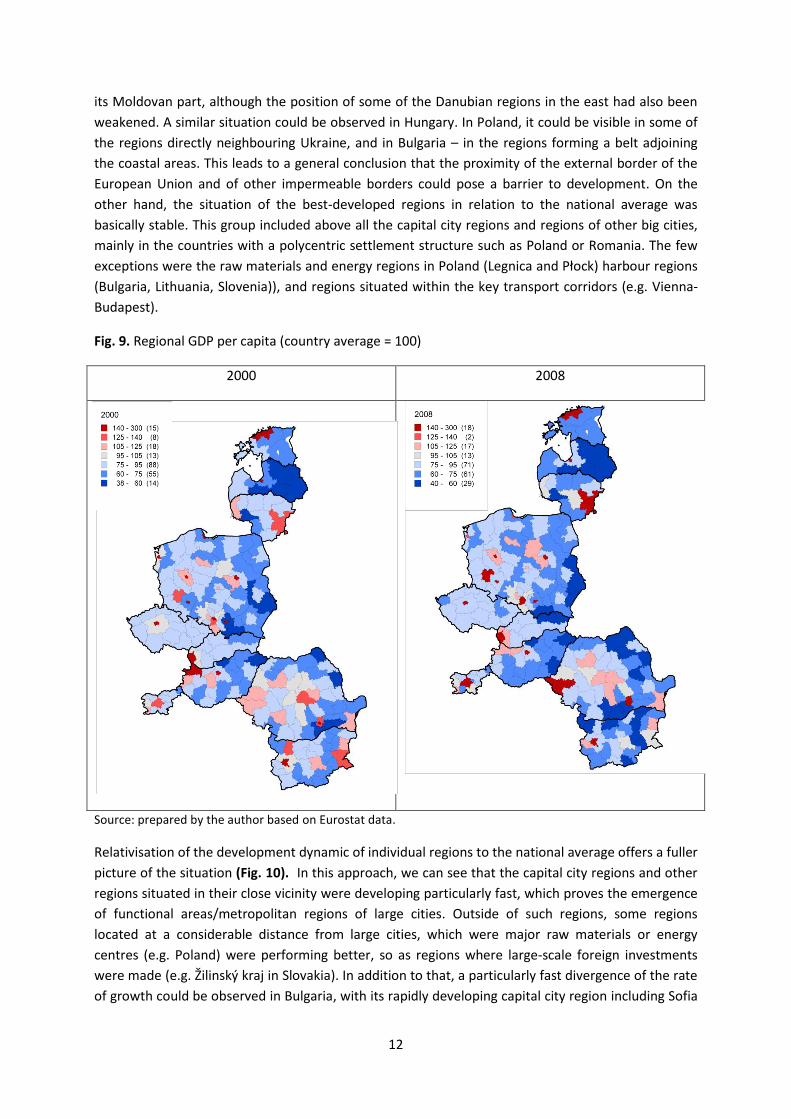
12
its Moldovan part, although the position of some of the Danubian regions in the east had also been
weakened. A similar situation could be observed in Hungary. In Poland, it could be visible in some of
the regions directly neighbouring Ukraine, and in Bulgaria – in the regions forming a belt adjoining
the coastal areas. This leads to a general conclusion that the proximity of the external border of the
European Union and of other impermeable borders could pose a barrier to development. On the
other hand, the situation of the best-developed regions in relation to the national average was
basically stable. This group included above all the capital city regions and regions of other big cities,
mainly in the countries with a polycentric settlement structure such as Poland or Romania. The few
exceptions were the raw materials and energy regions in Poland (Legnica and Płock) harbour regions
(Bulgaria, Lithuania, Slovenia)), and regions situated within the key transport corridors (e.g. Vienna-
Budapest).
Fig. 9. Regional GDP per capita (country average = 100)
2000 2008
Source: prepared by the author based on Eurostat data.
Relativisation of the development dynamic of individual regions to the national average offers a fuller
picture of the situation (Fig. 10). In this approach, we can see that the capital city regions and other
regions situated in their close vicinity were developing particularly fast, which proves the emergence
of functional areas/metropolitan regions of large cities. Outside of such regions, some regions
located at a considerable distance from large cities, which were major raw materials or energy
centres (e.g. Poland) were performing better, so as regions where large-scale foreign investments
were made (e.g. Žilinský kraj in Slovakia). In addition to that, a particularly fast divergence of the rate
of growth could be observed in Bulgaria, with its rapidly developing capital city region including Sofia
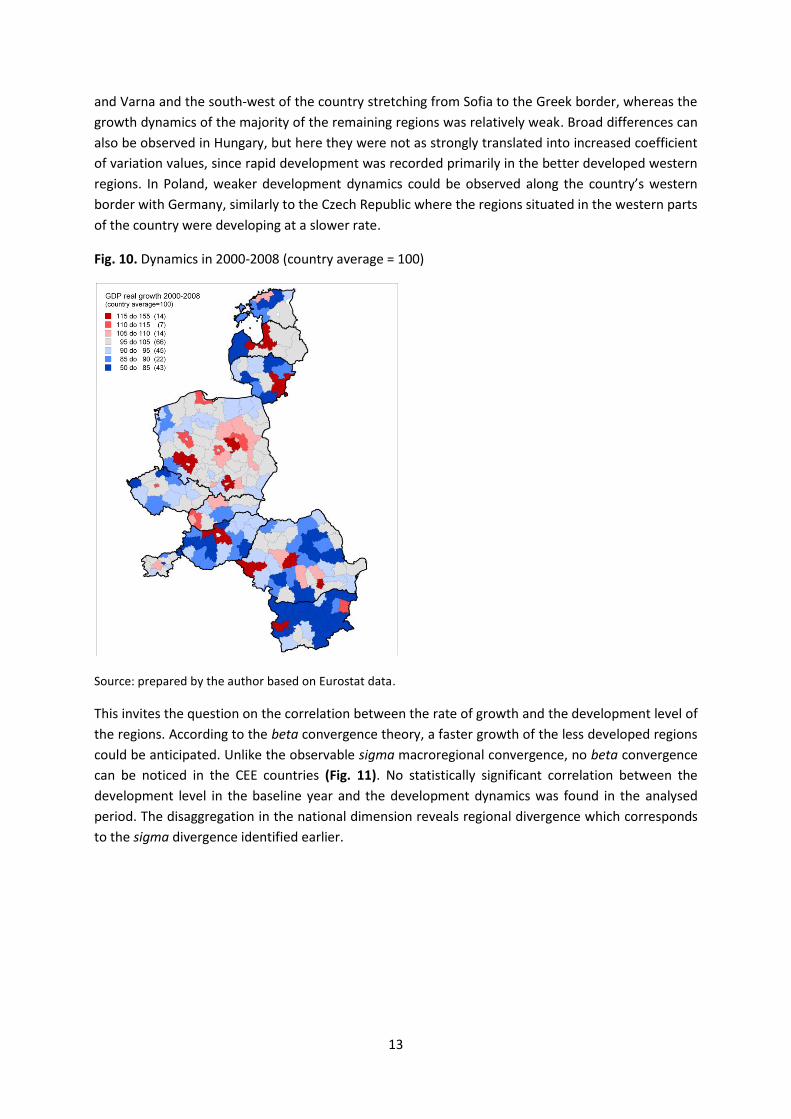
13
and Varna and the south-west of the country stretching from Sofia to the Greek border, whereas the
growth dynamics of the majority of the remaining regions was relatively weak. Broad differences can
also be observed in Hungary, but here they were not as strongly translated into increased coefficient
of variation values, since rapid development was recorded primarily in the better developed western
regions. In Poland, weaker development dynamics could be observed along the country’s western
border with Germany, similarly to the Czech Republic where the regions situated in the western parts
of the country were developing at a slower rate.
Fig. 10. Dynamics in 2000-2008 (country average = 100)
Source: prepared by the author based on Eurostat data.
This invites the question on the correlation between the rate of growth and the development level of
the regions. According to the beta convergence theory, a faster growth of the less developed regions
could be anticipated. Unlike the observable sigma macroregional convergence, no beta convergence
can be noticed in the CEE countries (Fig. 11). No statistically significant correlation between the
development level in the baseline year and the development dynamics was found in the analysed
period. The disaggregation in the national dimension reveals regional divergence which corresponds
to the sigma divergence identified earlier.

14
Fig. 11. GDP per capita and development dynamics in 2000-2008
Source: prepared by the author based on Eurostat data.
The map illustrating this correlation allows some generalisations to be made (Fig.12). Many of the
regions which in 2000 had GDP per capita in excess of 105% of the national average were developing
at a slower than average rate. These were predominantly regions with well-developed industrial
specialisations (e.g. the western regions in Hungary, Bielsko-Biała, Toruń and Bydgoszcz in Poland,
Gorj, Arad, Braşov, Covasna in Romania, and Stara Zagora in Bulgaria), and regions with harbour
functions (Klaipėda – Lithuania, Burgas – Bulgaria, Constanța - Romania). Only the capital city regions
and selected regions of the major cities in individual countries were developing even faster,
alongside Poland’s Legnica and Głogów basin (copper and silver mining). Less-developed regions
were as a rule growing much more slowly than the country average. Only 16 of them recorded a
higher rate of growth, mainly the regions in the vicinity of large cities in Poland, Latvia and Hungary,
and in Romania – those situated in the transport corridor of national road no. 1. This group also
includes two regions with well-developed automobile industry, which attracted considerable
investments from abroad (KIA – Žilinský kraj in Slovakia and Renault – the Argeș region in Romania).
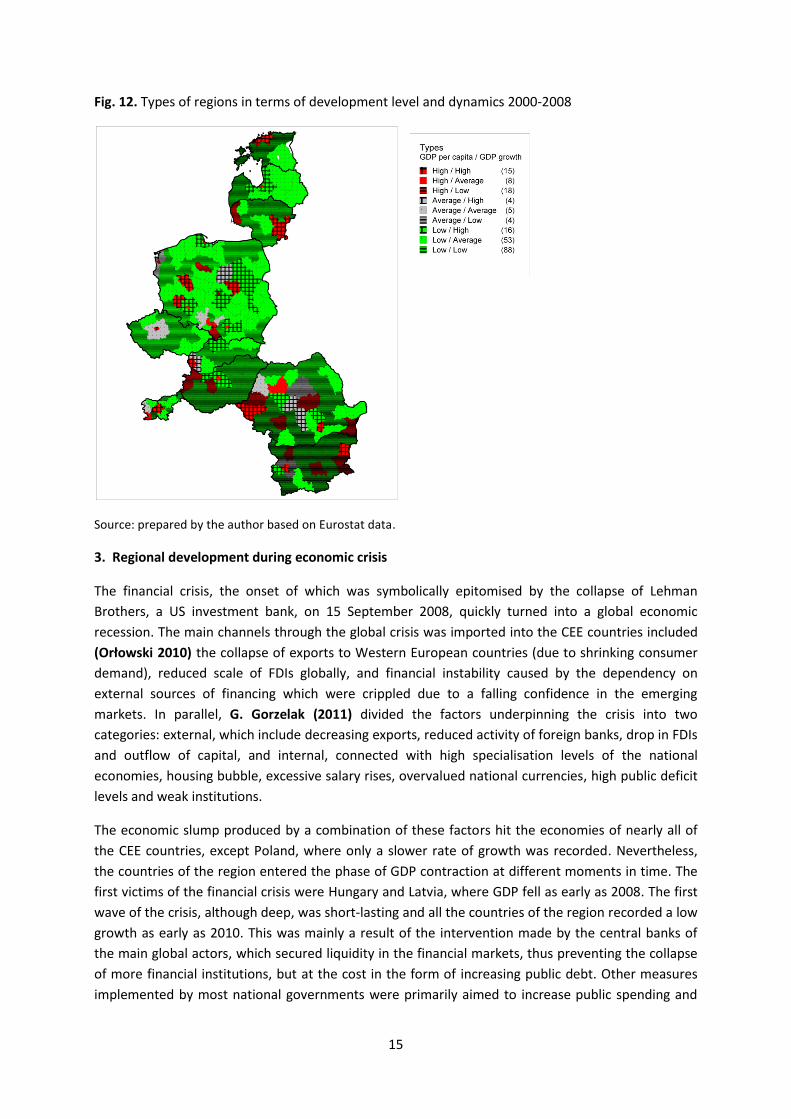
15
Fig. 12. Types of regions in terms of development level and dynamics 2000-2008
Source: prepared by the author based on Eurostat data.
3. Regional development during economic crisis
The financial crisis, the onset of which was symbolically epitomised by the collapse of Lehman
Brothers, a US investment bank, on 15 September 2008, quickly turned into a global economic
recession. The main channels through the global crisis was imported into the CEE countries included
(Orłowski 2010) the collapse of exports to Western European countries (due to shrinking consumer
demand), reduced scale of FDIs globally, and financial instability caused by the dependency on
external sources of financing which were crippled due to a falling confidence in the emerging
markets. In parallel, G. Gorzelak (2011) divided the factors underpinning the crisis into two
categories: external, which include decreasing exports, reduced activity of foreign banks, drop in FDIs
and outflow of capital, and internal, connected with high specialisation levels of the national
economies, housing bubble, excessive salary rises, overvalued national currencies, high public deficit
levels and weak institutions.
The economic slump produced by a combination of these factors hit the economies of nearly all of
the CEE countries, except Poland, where only a slower rate of growth was recorded. Nevertheless,
the countries of the region entered the phase of GDP contraction at different moments in time. The
first victims of the financial crisis were Hungary and Latvia, where GDP fell as early as 2008. The first
wave of the crisis, although deep, was short-lasting and all the countries of the region recorded a low
growth as early as 2010. This was mainly a result of the intervention made by the central banks of
the main global actors, which secured liquidity in the financial markets, thus preventing the collapse
of more financial institutions, but at the cost in the form of increasing public debt. Other measures
implemented by most national governments were primarily aimed to increase public spending and

16
stimulate internal demand, as a result of the diminishing role of private investment and export in
GDP increase.
The regional dimension of the financial crisis has not as yet been explored in depth due to the lack of
statistical data except the labour market statistics. Preliminary analyses (cf. Gorzelak 2011) led to the
hypothesis stating that the least affected regions should be metropolitan regions with the most
diversified economic structures on the one hand, and on the other – agricultural regions with a
minimum share in globalisation processes. In effect, the remaining types of regions should be most
strongly exposed to symptoms of the crisis, especially those where most features of the former,
‘Fordist’ development model could be observed.
It should also be noted that the current understanding of the regional dimension of the financial
crisis is rather limited as the most recent statistics covering regional GDP show the picture for 2010.
On their basis, it can be concluded that the impact of the financial crisis was strongly differentiated
spatially and varied from country to country (Fig. 13).
Fig. 13. Real GDP change in 2008-2010
a) 2008=100 b) country average = 100
Source: prepared by the author based on Eurostat data.
In the first approach, which shows real regional dynamics (Fig. 13a), Poland definitely offers a
different picture compared to the remaining countries as only few of its regions recorded a drop in
their regional incomes. Only some of the regions outside Poland increased their GDP in the period
concerned, including a number of regions in Romania (mostly those located in the Bucharest
metropolitan region) and Bulgaria (in addition to the capital city region, the regions situated within
the transport corridor connecting Bulgaria with Istanbul). In Hungary and the Czech Republic, some
of the western regions, Plzeň and Győr, rebounded quickly from the crisis. In Slovakia, the Bratislava
17
metropolitan area and the Žilina region were developing at the fastest rate. On the other hand,
regions in the Baltic states were among those most severely affected by the financial crisis, recording
an over 10% decrease in real income compared to 2008 in the majority of cases. A similar situation
could also be observed in a number of Bulgarian, Romanian and Hungarian regions, and in one
subregion in Slovenia.
Relativisation of the rate of growth to the national average (Fig. 13b) shows that capital city regions
performed relatively better than others, which was especially well visible in Bulgaria, Poland and
Slovakia, and to a lesser extent in Slovenia, Hungary and the Czech Republic. The situation in Latvia
and Romania was more complex as there the capital cities were quite strongly affected, unlike their
immediate surroundings. In turn, in Estonia and Lithuania, the dynamics of capital city regions was
similar to the national average. Such a situation could also be observed in some of the regions of the
remaining larger cities in such countries as Hungary (Debrecen, Pécs), Slovenia (Koper) or Lithuania
(Klaipėda). The situation in the remaining countries and regions was rather patchy and difficult to
generalise. This means that, in comparison to the respective national averages, regions with modern,
export-oriented branches of industry and some peripheral, agricultural regions, were performing
quite well.
CONCLUSIONS
The scale of regional disparities in GDP per capita differed from country to country. The greatest
cohesiveness of income could be observed in the best-developed Slovenia and the Czech Republic,
and the smallest - in Slovakia (partly as a result of a small number of NUTS3 regions). With the capital
city regions excluded from the analysis, the scale of disparities fell in all the countries (most visibly in
Slovakia and Estonia). In such an approach, this scale was the widest in Poland and Romania, that is
the largest countries, with the highest degree of the polycentricity of their settlement systems. On
the other hand, non-capital regions showed the least disparities in Estonia and the Czech Republic,
which corresponded to relatively small differences in their economic structures.
Across the macroregion, small regional convergence could be observed, a process which started post
2000 and was largely a result of the appreciation of the currencies of less-developed countries
(especially in Bulgaria and Romania), coupled with greater development dynamics in the wake of a
delayed transition (especially in the Baltic states).
In the national dimension, regional polarisation processes were on the increase in all the countries,
with few exceptions (Latvia post 2004). On the other hand, the pace of this process in most countries
either fell or stopped to accelerate post 2004 (and post 2007 in Romania). Bulgaria was the only
exception, with the increasing regional income disparities being the most visible. This could point to
spread processes that have also incorporated non-capital regions. One of the likely explanations for
this phenomenon is the reduced investment risk following EU accession and greater interest of
foreign investors in less-developed regions of individual countries. On the other hand, increased
availability of EU funds under the Cohesion and Common Agricultural policies could also play a role
as such funds were concentrated in less-developed regions in the majority of the analysed countries.
However, the panel analysis did not find any correlations between the rate of economic growth and
changes in the coefficient of variation of the regional incomes. In other words, regional convergence
or divergence processes did not depend on the business outlook nationally.

18
Nevertheless, the significance of metropolisation processes is still clearly visible, and most easily
observable in the capital city regions and regions with other large urban centres (especially in Poland
and Romania), driving their fast development. With such regions excluded from the analysis, we can
observe a strong petrification of the spatial structures, that is a rather uniform development of the
remaining regions. On the other hand, the process of the emergence of poorer macroregions was
visible, especially in Romania (Moldova), Hungary (eastern and southern parts) and Bulgaria (the
regions forming a belt adjacent to the coastal regions).
The impact of the financial crisis on regional development still remains difficult to evaluate owing to
the dynamics of crisis phenomena and short series of statistical data. On the basis of available
statistics, it can be concluded that the capital city regions were the least severely affected, whereas
other types of regions were characterised by a patchy nature of this phenomenon.

19
References:
Boldrin, M., Canova, F. (2001) Inequality and convergence in Europe’s regions: reconsidering
European regional policies, Economic Policy, No 16(32): 205-253.
Capello, R. (2007) Regional economics, Routledge, London and New York.
ESPON Project 1.1.1. (2004) Potentials for polycentric development. Potentials for polycentric
development in Europe, NORDREGIO, Stockholm http://www.espon.eu/
Ezcurra, R., Pascual, P., Rapu M. (2007) The Dynamics of Regional Disparities in Central and Eastern
Europe during Transition, European Planning Studies, Vol. 15(10): 1397-1421.
Gorzelak G. (1996) The regional dimension of transformation in Central and Eastern Europe, Jessica
Kingsley Publishers, London.
Gorzelak G. (2009) Cohesion and convergence: Synonyms or two different notions [in] G.
Kochendörfer-Lucius, B. Pleskovic (eds), Spatial Disparities and Development Policy. Washington DC:
The World Bank.
Gorzelak G. (2011) The financial crisis in Central and Eastern Europe, [in] G. Gorzelak (ed.), Financial
Crisis in Central and Eastern Europe: From Similarity to Diversity. Warszawa: Wydawnictwo Naukowe
Scholar.
Gorzelak G., Smętkowski M. (2010) Regional Development Dynamics in Central and Eastern European
Countries, Regional Development in Central and Eastern Europe Development processes and policy
challenges, Routledge.
OECD (2010) Regional Development Policies in OECD Countries. OECD Publishing, France.
Orłowski W.M. (2010) W pogoni za straconym czasem. Wzrost gospodarczy w Europie Środkowo-
Wschodniej. Warsaw: PWE.
Petrakos, G. (2001) Patterns of regional inequality in transition economies, European Planning
Studies 9: 359-383.
Römich, R. (2003) Regional disparities within accession counties, [in:] Tumpel-Gugerell, G.,
Mooslechner, P., 2003, Economic convergence and divergence in Europe: growth and regional
development in an enlarged European Union, Cheltenham : Edward Elgar.
Smętkowski M., Gorzelak G., Kozak M., Olechnicka A., Płoszaj A., Wojnar K., (2011) European
Metropolises and Their Regions: From Economic Landscape to Metropolitan Networks. Warsaw:
Wydawnictwo Naukowe Scholar.
Smętkowski M., Wójcik P. (2012) Regional Convergence in Central and Eastern European Countries –
a multidimensional approach, European Planning Studies, Vol. 20 (6): 923-939.
Smętkowski M. (2013) Rozwój regionów i polityka regionalne w krajach Europy Środkowo-Wschodniej
w okresie transformacji i globalizacji, Wydawnictwo Naukowe Scholar, Warsaw.

20
Szörfi B. (2007) Development and Regional Disparities – Testing the Williamson Curve Hypothesis in
the European Union, Focus on European Economic Integration, Issue 2: 100-121.
Williamson J.,G. (1965) Regional inequalities and the process of national development, Economic
Development and Cultural Change, No 13.
World Bank, 2009, World Development Report 2009: Reshaping Economic Geography. Washington
DC.