danube connects – the magazine for the danube countries, 1/2014
description
By M. Ould ALY OUMAR
Niger-HYCOS Project Coordonator
Niger Basin Authority, Niamey, NIGER REPUBLIC
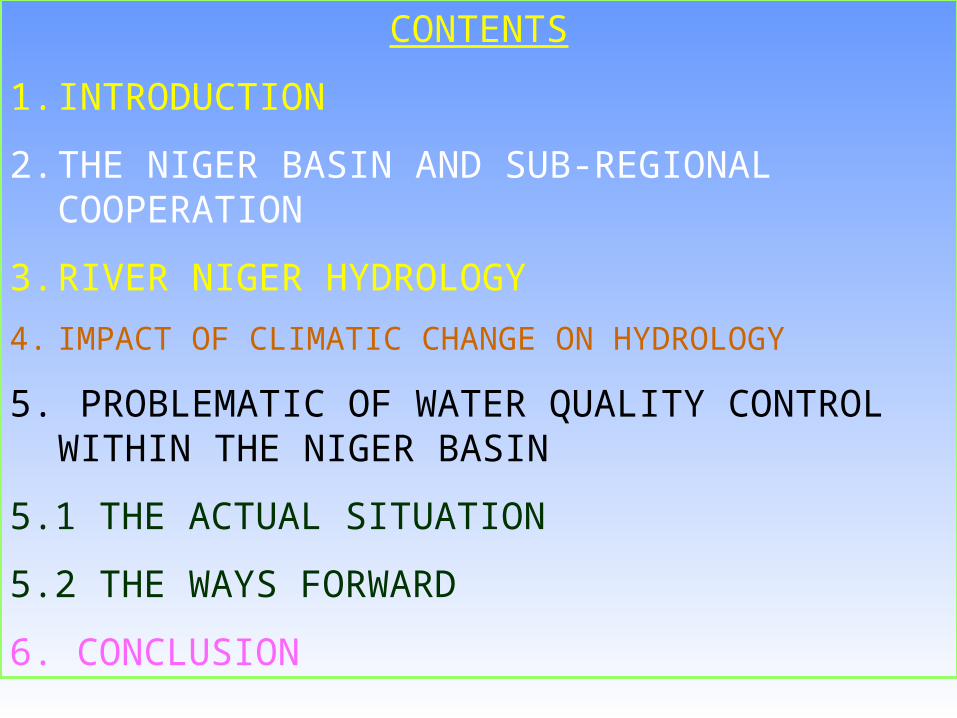
CONTENTS
1. INTRODUCTION
2. THE NIGER BASIN AND SUB-REGIONAL COOPERATION
3. RIVER NIGER HYDROLOGY
4. IMPACT OF CLIMATIC CHANGE ON HYDROLOGY
5. PROBLEMATIC OF WATER QUALITY CONTROL WITHIN THE NIGER BASIN
5.1 THE ACTUAL SITUATION
5.2 THE WAYS FORWARD
6. CONCLUSION
1.0 INTRODUCTION
Since several years the Niger Basin is facing the impacts of the climatic changes and the effect of growing population. This affects the surface and sub-surface waters. The concerned countries have not sufficient means to control the situation except at some urban and rural area.
The Niger Basin Authority in charge of the managment of the water resources is looking forward to solve the problem.
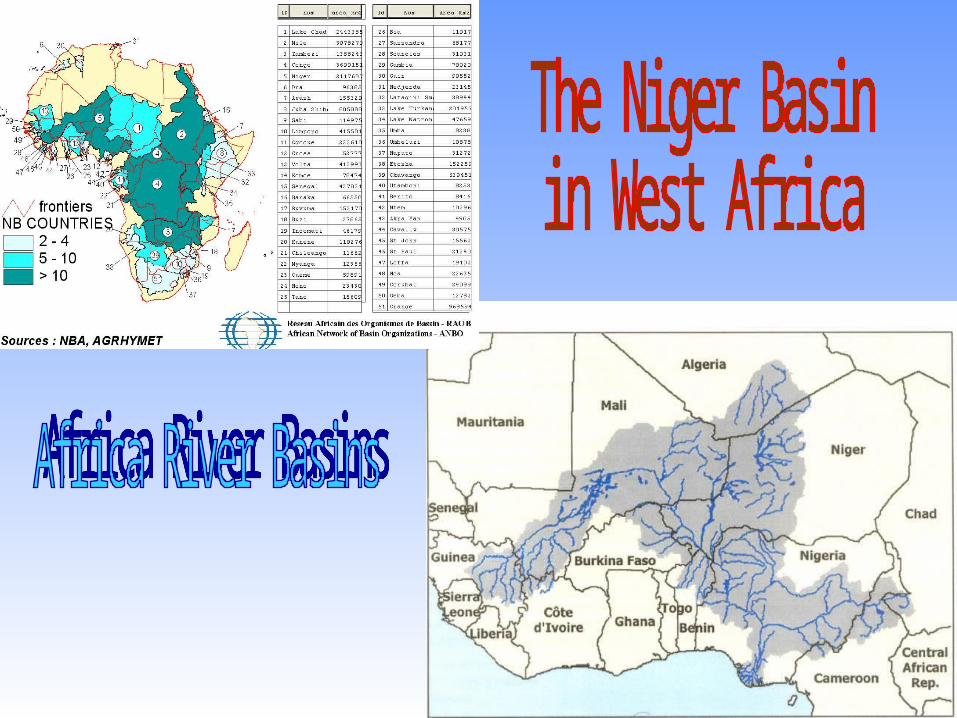
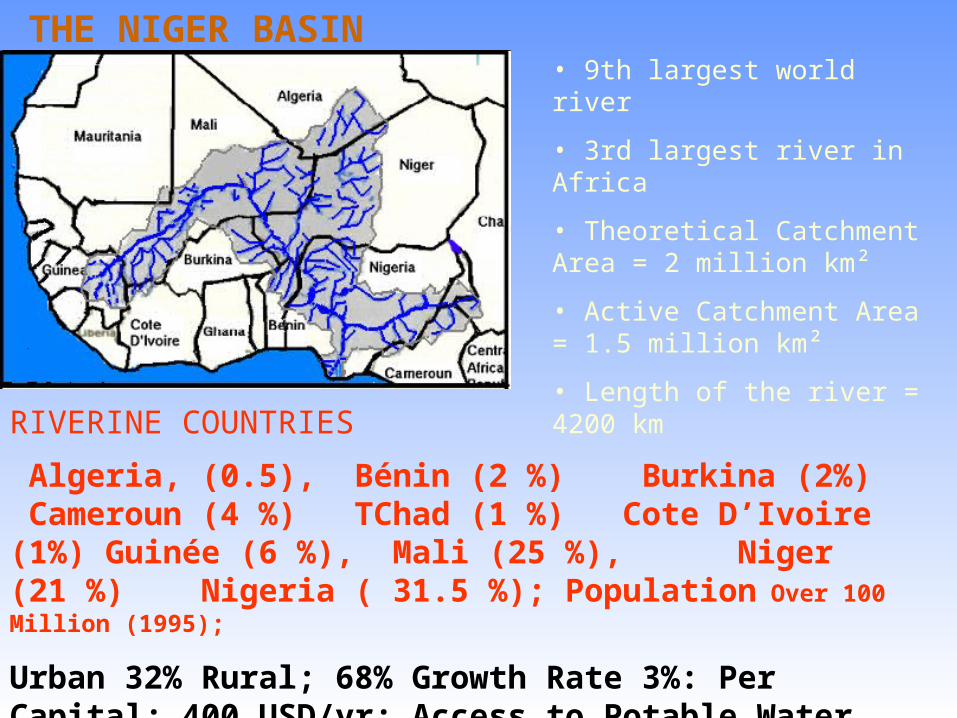
THE NIGER BASIN• 9th largest world river
• 3rd largest river in Africa
• Theoretical Catchment Area = 2 million km²
• Active Catchment Area = 1.5 million km²
• Length of the river = 4200 km
RIVERINE COUNTRIES
Algeria, (0.5), Bénin (2 %) Burkina (2%) Cameroun (4 %) TChad (1 %) Cote D’Ivoire (1%) Guinée (6 %), Mali (25 %), Niger (21 %) Nigeria ( 31.5 %); Population Over 100 Million (1995);
Urban 32% Rural; 68% Growth Rate 3%: Per Capital; 400 USD/yr; Access to Potable Water 52%; Navigation: 3,500 km (Not continuous)

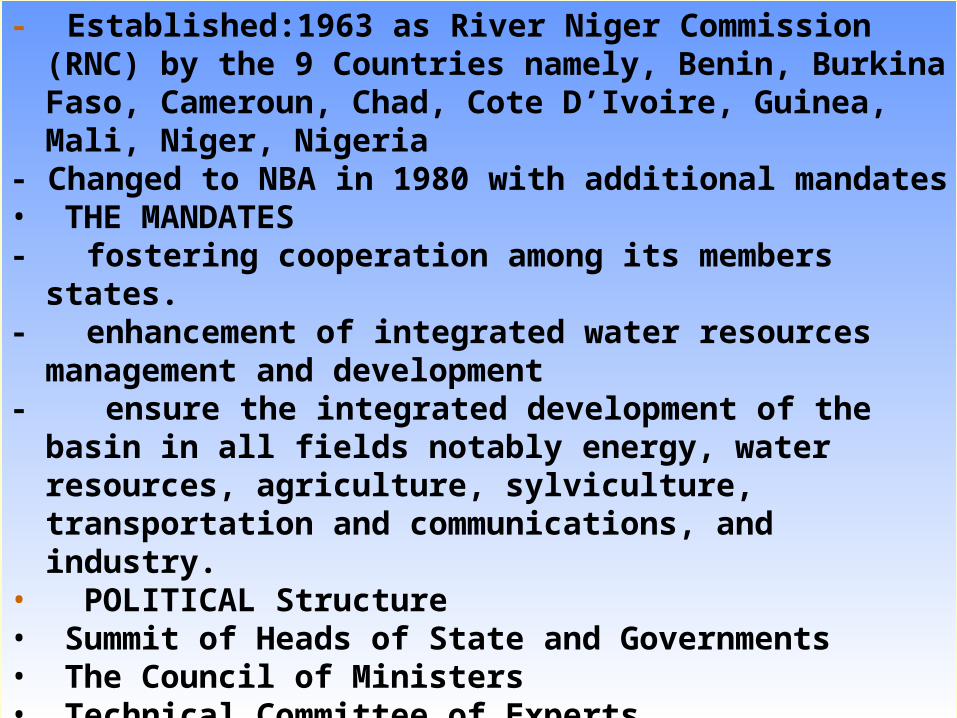
- Established:1963 as River Niger Commission (RNC) by the 9 Countries namely, Benin, Burkina Faso, Cameroun, Chad, Cote D’Ivoire, Guinea, Mali, Niger, Nigeria
- Changed to NBA in 1980 with additional mandates• THE MANDATES- fostering cooperation among its members states.- enhancement of integrated water resources management and
development- ensure the integrated development of the basin in all fields
notably energy, water resources, agriculture, sylviculture, transportation and communications, and industry.
• POLITICAL Structure• Summit of Heads of State and Governments• The Council of Ministers• Technical Committee of Experts • NBA Executive Secretariat


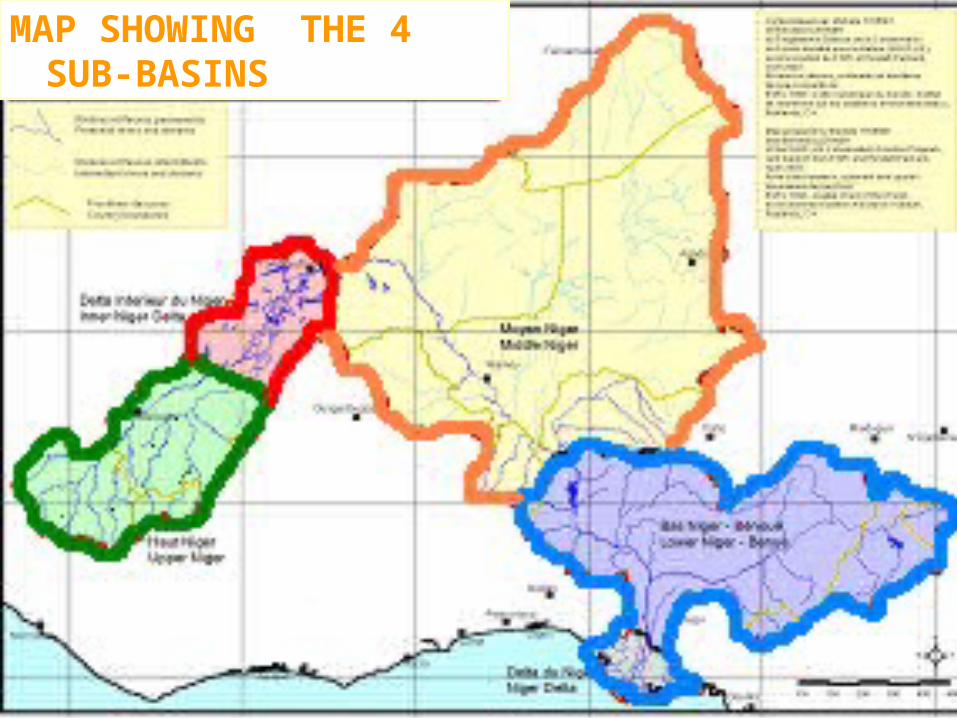
MAP SHOWING THE 4 SUB-BASINS
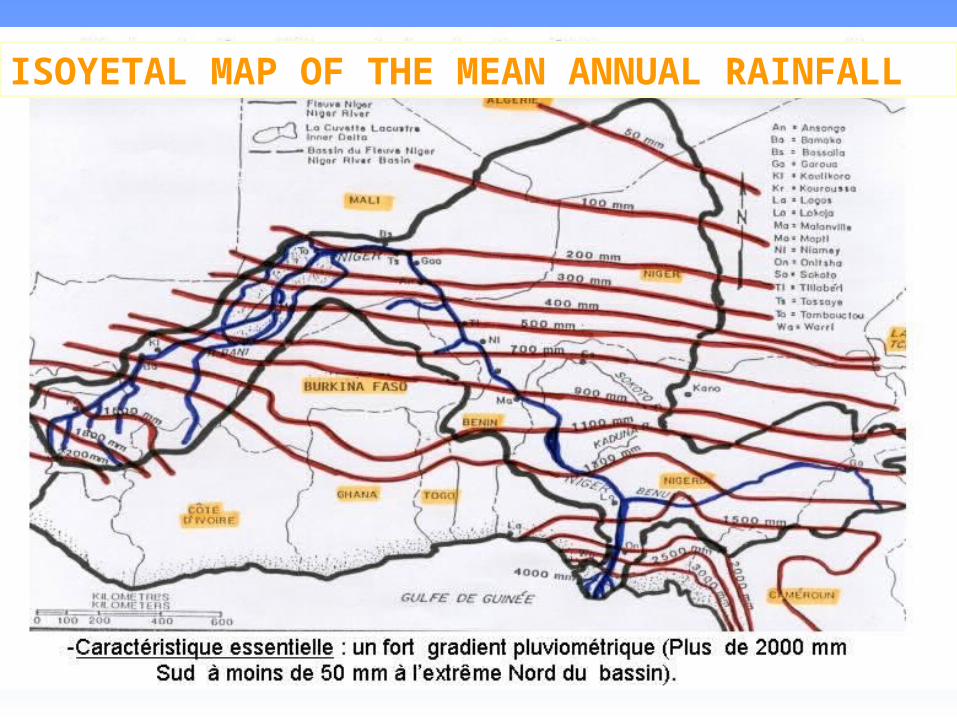
ISOYETAL MAP OF THE MEAN ANNUAL RAINFALL
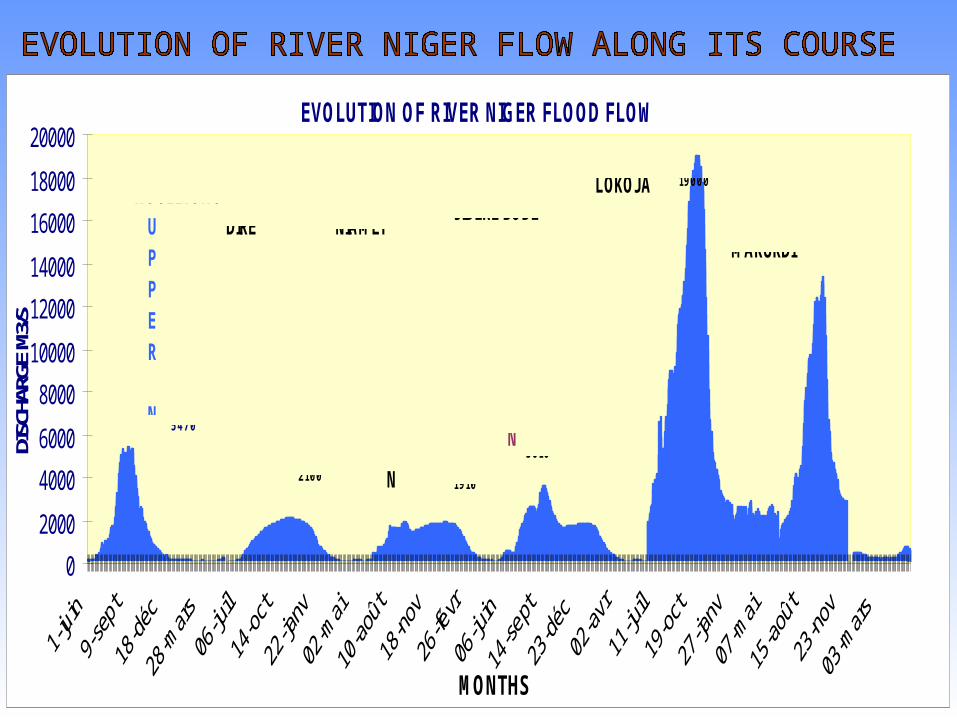
EVOLUTION OF RIVER NIGER FLOOD FLOW
0
2000
4000
6000
8000
10000
12000
14000
16000
18000
20000
MONTHS
DISC
HARG
E M3
/S
UPPER
N
INLAND
MIDDLE
N
LOWER
N
KOULIKORODIRE NIAMEY
JIDERE BODELOKOJA
MAKURDI
5470
2100 19101900
3610
19000
13000
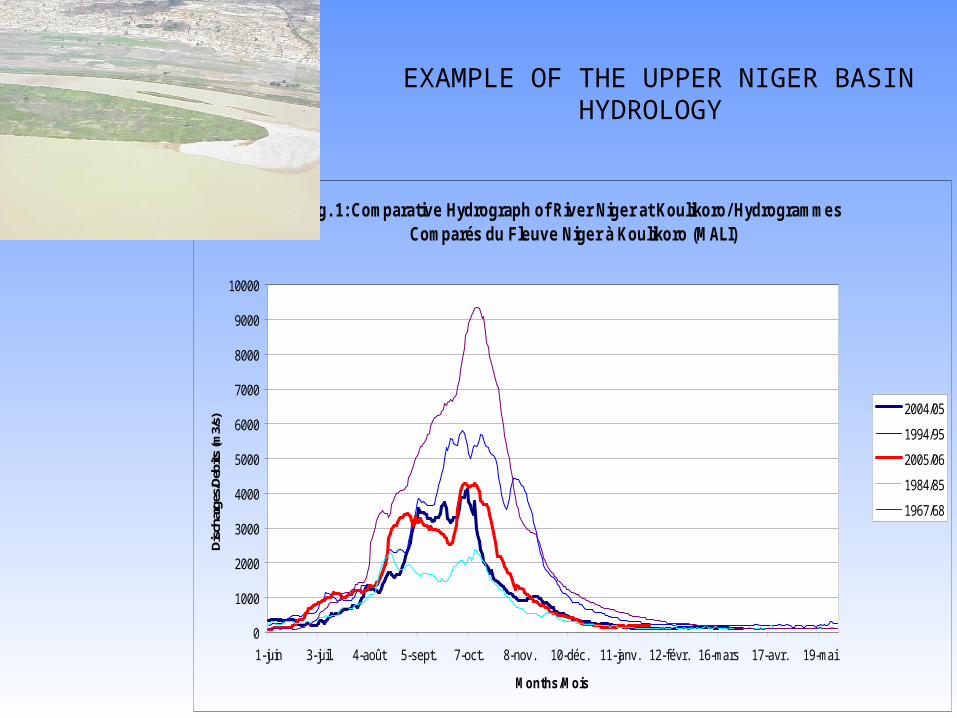
Fig. 1: Comparative Hydrograph of River Niger at Koulikoro/ Hydrogrammes Comparés du Fleuve Niger à Koulikoro (MALI)
0
1000
2000
3000
4000
5000
6000
7000
8000
9000
10000
1-juin 3-juil. 4-août 5-sept. 7-oct. 8-nov. 10-déc. 11-janv. 12-févr. 16-mars 17-avr. 19-mai
Months/Mois
Disc
harg
es/D
ebits
(m3/
s)
2004/05
1994/95
2005/06
1984/85
1967/68
EXAMPLE OF THE UPPER NIGER BASIN HYDROLOGY
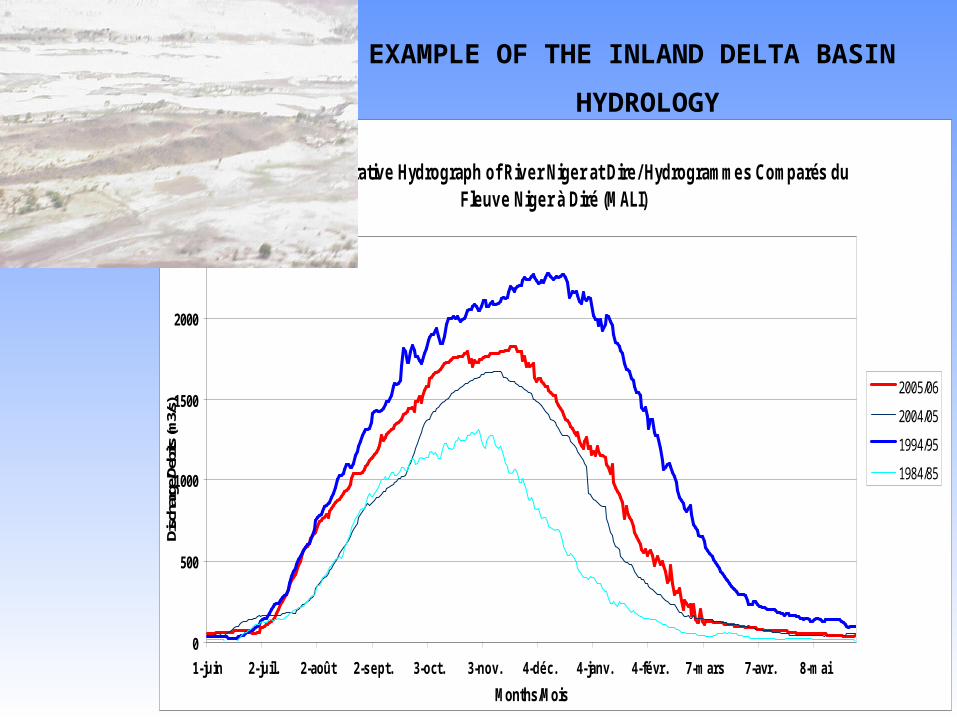
Fig. 2: Comparative Hydrograph of River Niger at Dire/ Hydrogrammes Comparés du Fleuve Niger à Diré (MALI)
0
500
1000
1500
2000
2500
1-juin 2-juil. 2-août 2-sept. 3-oct. 3-nov. 4-déc. 4-janv. 4-févr. 7-mars 7-avr. 8-mai
Months/Mois
Disc
harg
e/De
bits
(m3/
s)
2005/06
2004/05
1994/95
1984/85
EXAMPLE OF THE INLAND DELTA BASIN
HYDROLOGY
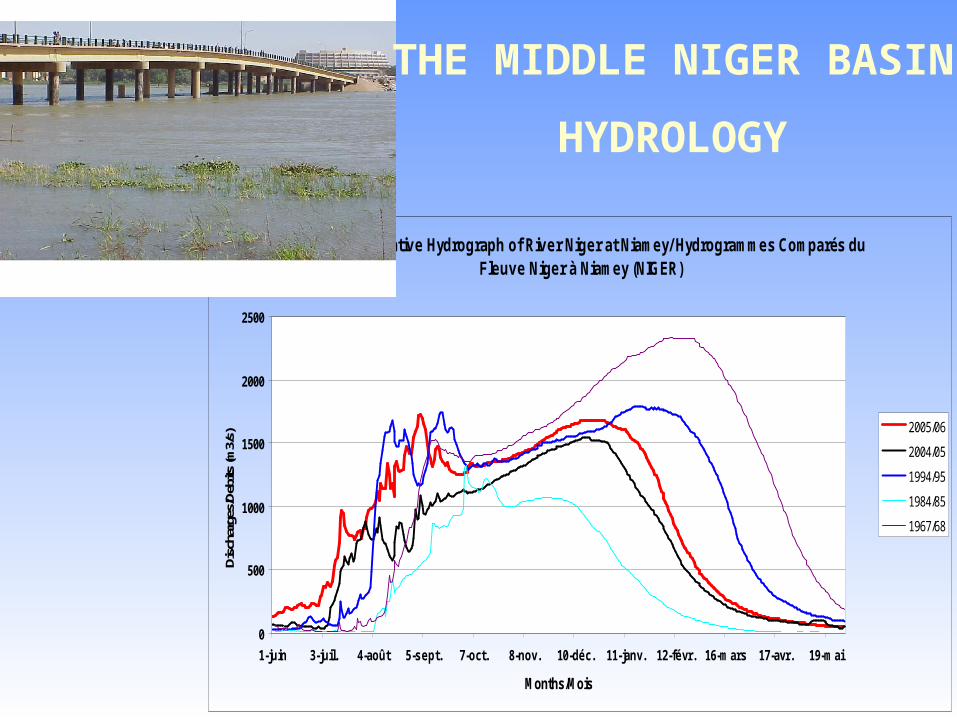
Fig. 3: Comparative Hydrograph of River Niger at Niamey/ Hydrogrammes Comparés du Fleuve Niger à Niamey (NIGER)
0
500
1000
1500
2000
2500
1-juin 3-juil. 4-août 5-sept. 7-oct. 8-nov. 10-déc. 11-janv. 12-févr. 16-mars 17-avr. 19-mai
Months/Mois
Disc
harg
es/D
ebits
(m3/
s)
2005/06
2004/05
1994/95
1984/85
1967/68
THE MIDDLE NIGER BASIN
HYDROLOGY
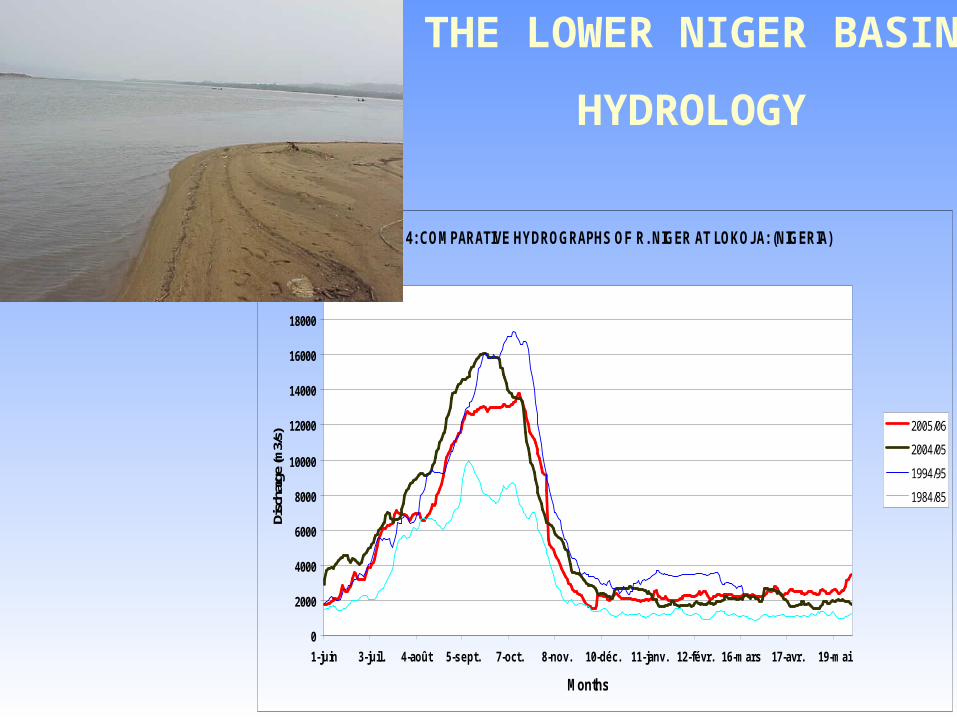
Fig. 4: COMPARATIVE HYDROGRAPHS OF R. NIGER AT LOKOJA: (NIGERIA)
0
2000
4000
6000
8000
10000
12000
14000
16000
18000
20000
1-juin 3-juil. 4-août 5-sept. 7-oct. 8-nov. 10-déc. 11-janv. 12-févr. 16-mars 17-avr. 19-mai
Months
Disc
harg
e (m
3/s)
2005/06
2004/05
1994/95
1984/85
THE LOWER NIGER BASIN
HYDROLOGY

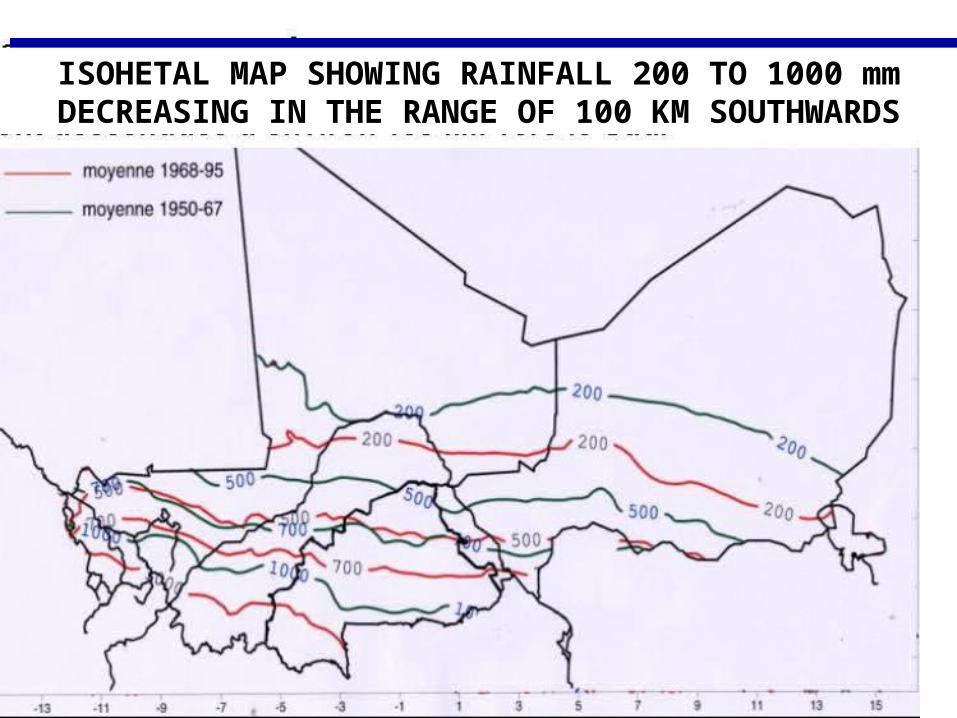
ISOHETAL MAP SHOWING RAINFALL 200 TO 1000 mm DECREASING IN THE RANGE OF 100 KM SOUTHWARDSISOHETAL MAP SHOWING RAINFALL 200 TO 1000 mm
DECREASING IN THE RANGE OF 100 KM SOUTHWARDS
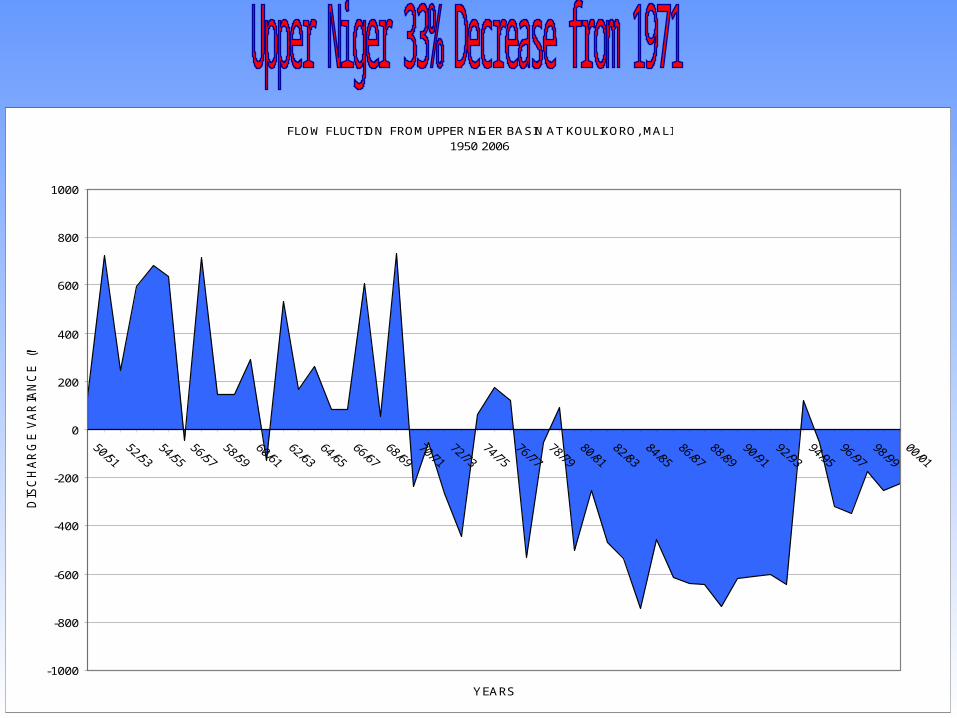
FLOW FLUCTION FROM UPPER NIGER BASIN AT KOULIKORO, MALI 1950 2006
-1000
-800
-600
-400
-200
0
200
400
600
800
1000
YEARS
DIS
CH
AR
GE
VA
RIA
NC
E (M
3/S
)
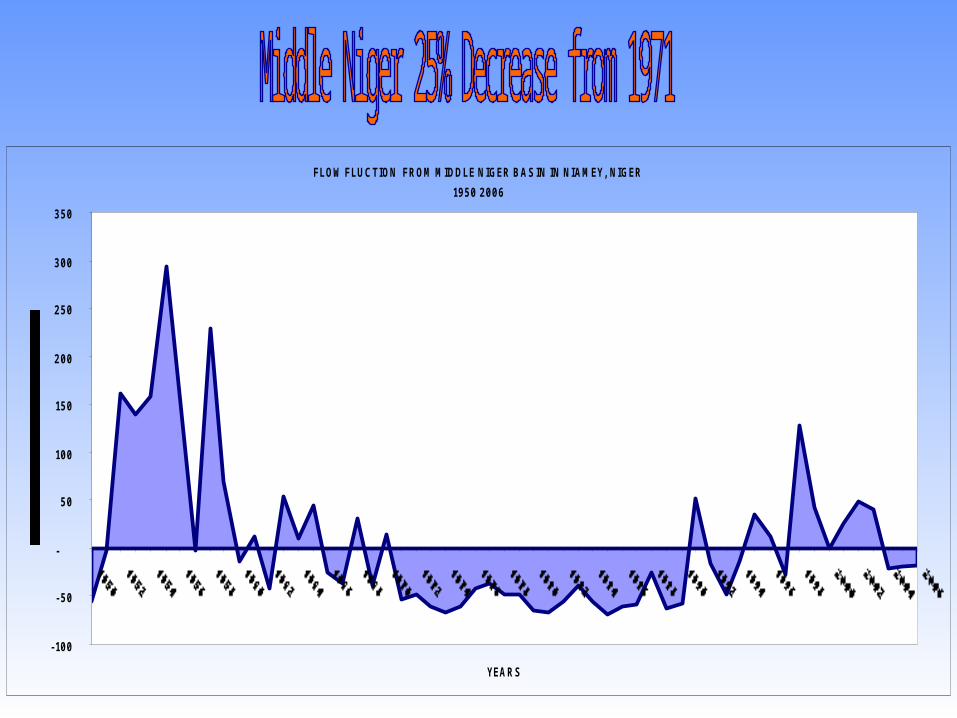
FLOW FLUCTION FROM MIDDLE NIGER BASIN IN NIAMEY, NIGER
1950 2006
-100
-50
-
50
100
150
200
250
300
350
YEARS
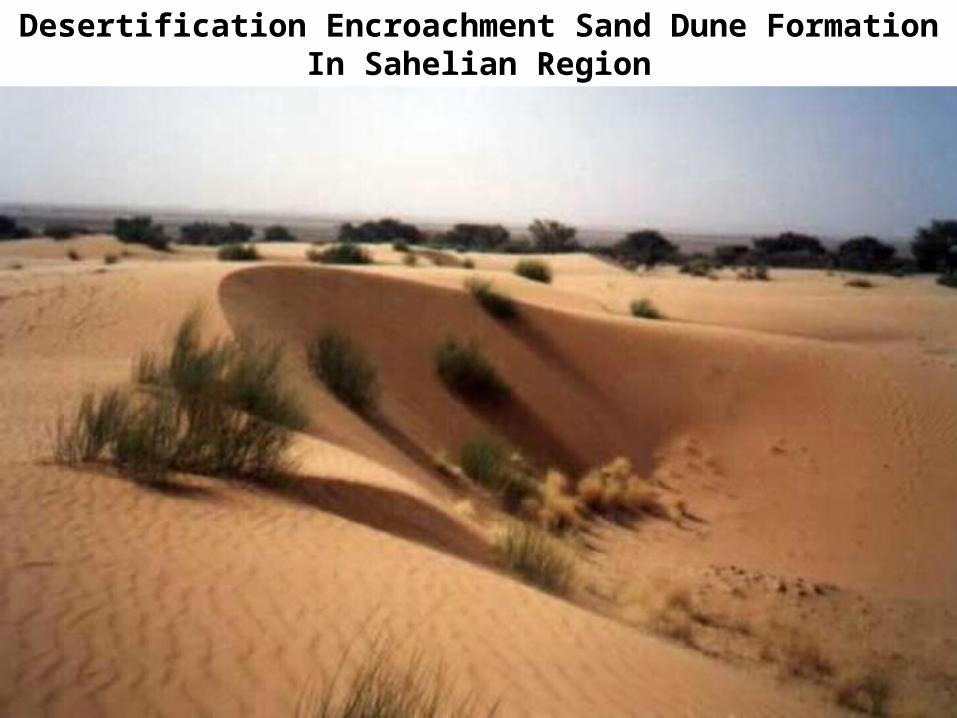
Desertification Encroachment Sand Dune Formation In Sahelian Region
Desertification Encroachment Sand Dune Formation In Sahelian Region
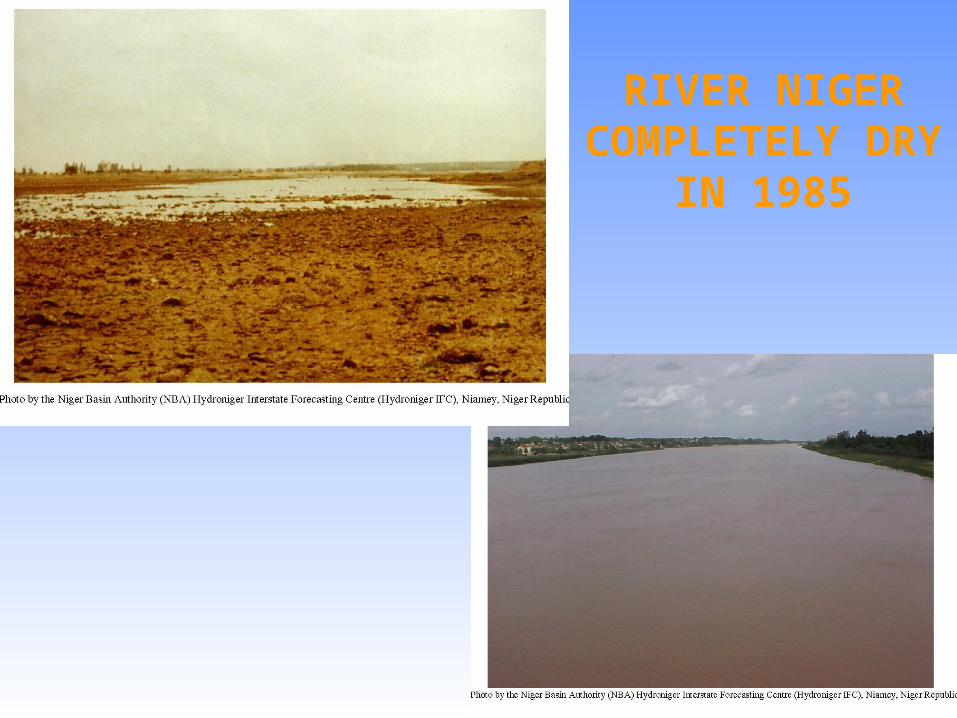
RIVER NIGER COMPLETELY DRY IN 1985
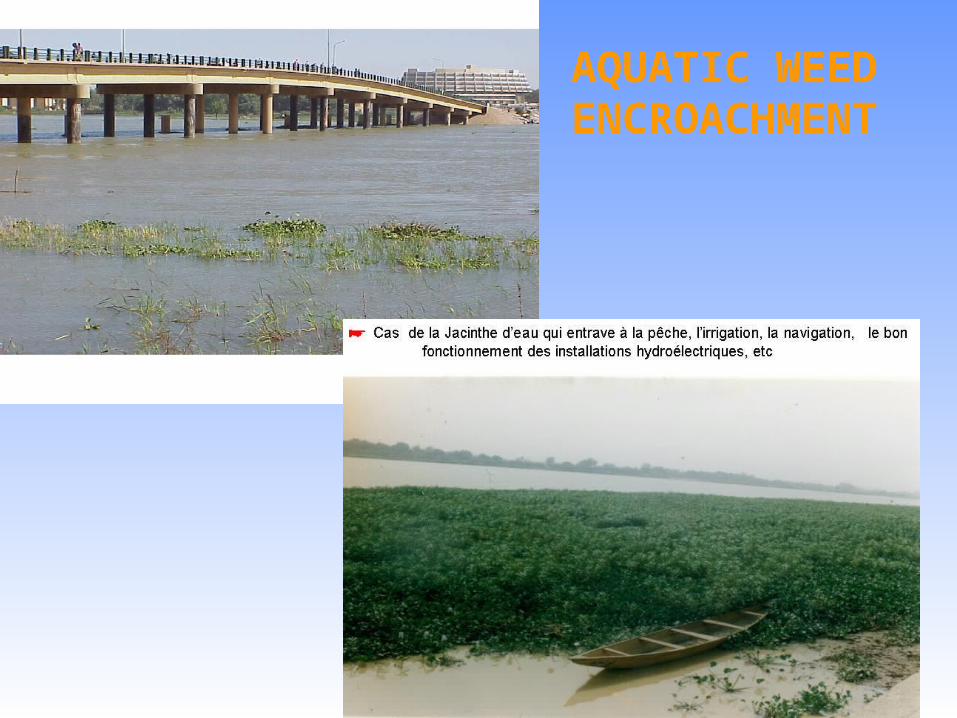
AQUATIC WEED ENCROACHMENT
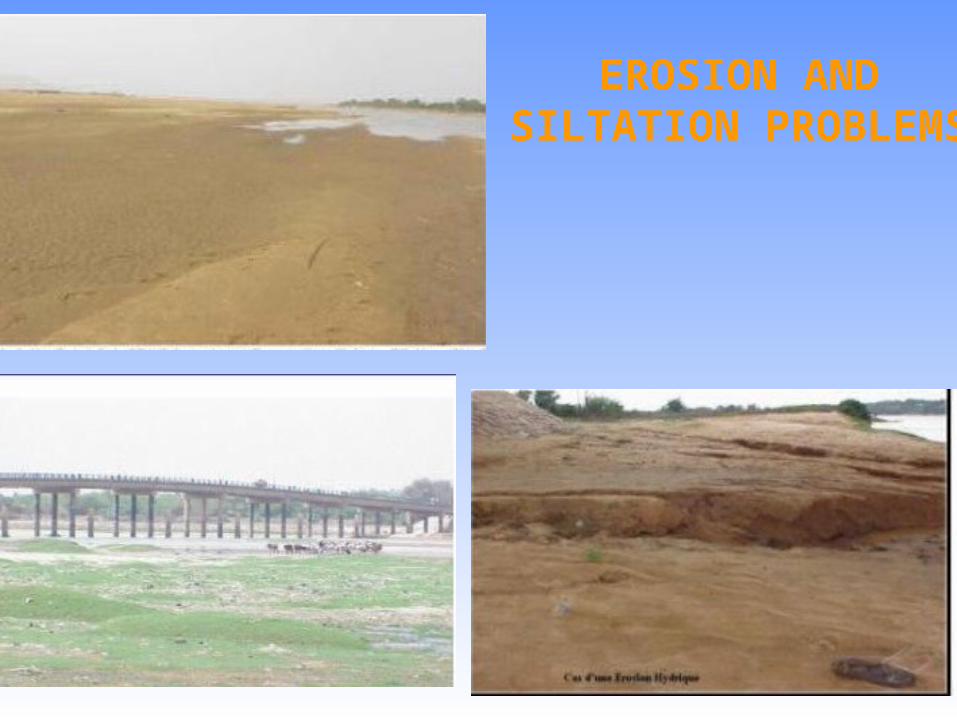
EROSION AND SILTATION
PROBLEMS
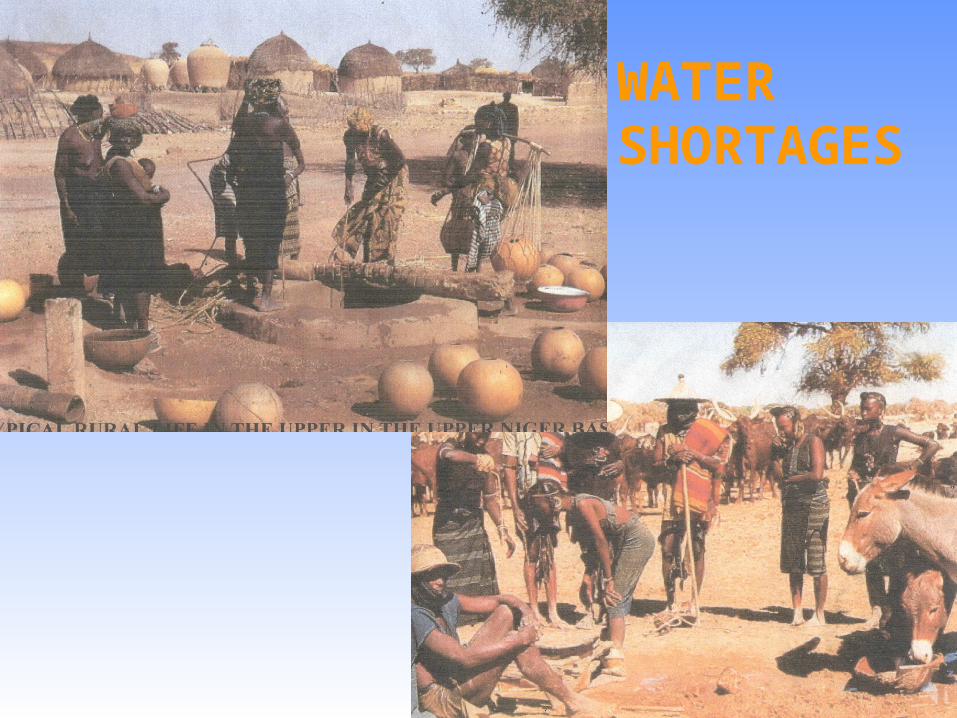
WATER SHORTAGES
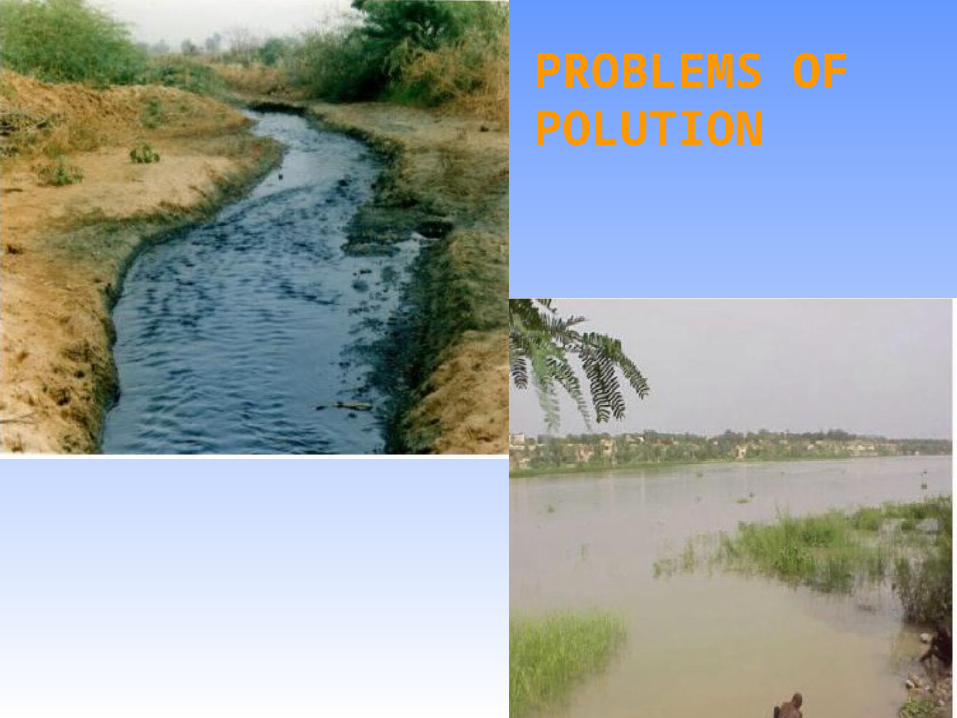
PROBLEMS OF POLUTION
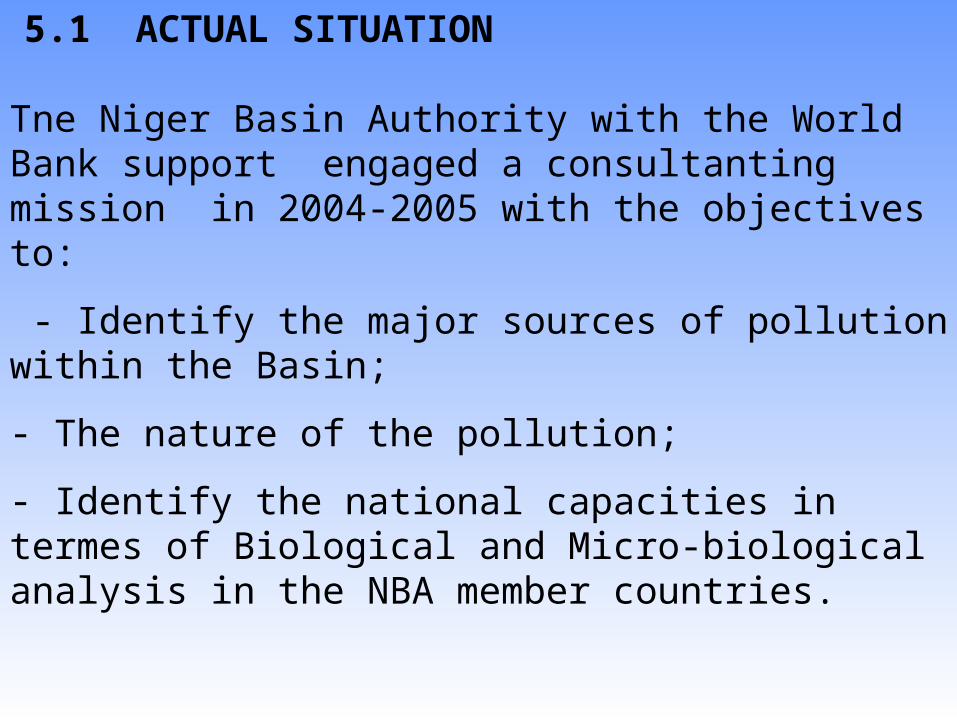
5.1 ACTUAL SITUATION
Tne Niger Basin Authority with the World Bank support engaged a consultanting mission in 2004-2005 with the objectives to:
- Identify the major sources of pollution within the Basin;
- The nature of the pollution;
- Identify the national capacities in termes of Biological and Micro-biological analysis in the NBA member countries.
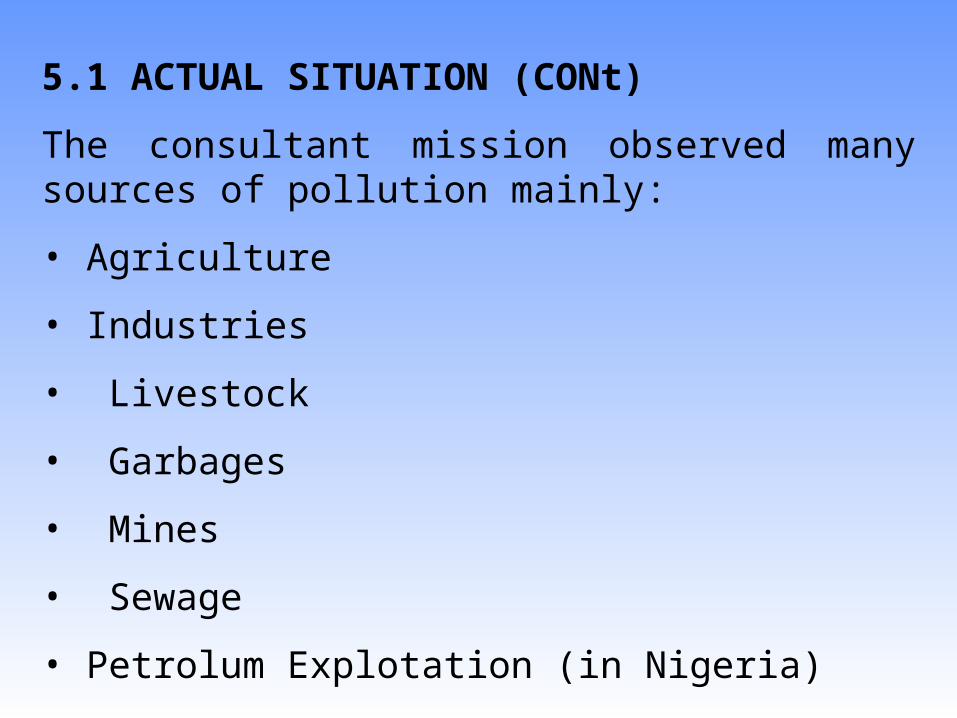
5.1 ACTUAL SITUATION (CONt)
The consultant mission observed many sources of pollution mainly:
• Agriculture
• Industries
• Livestock
• Garbages
• Mines
• Sewage
• Petrolum Explotation (in Nigeria)
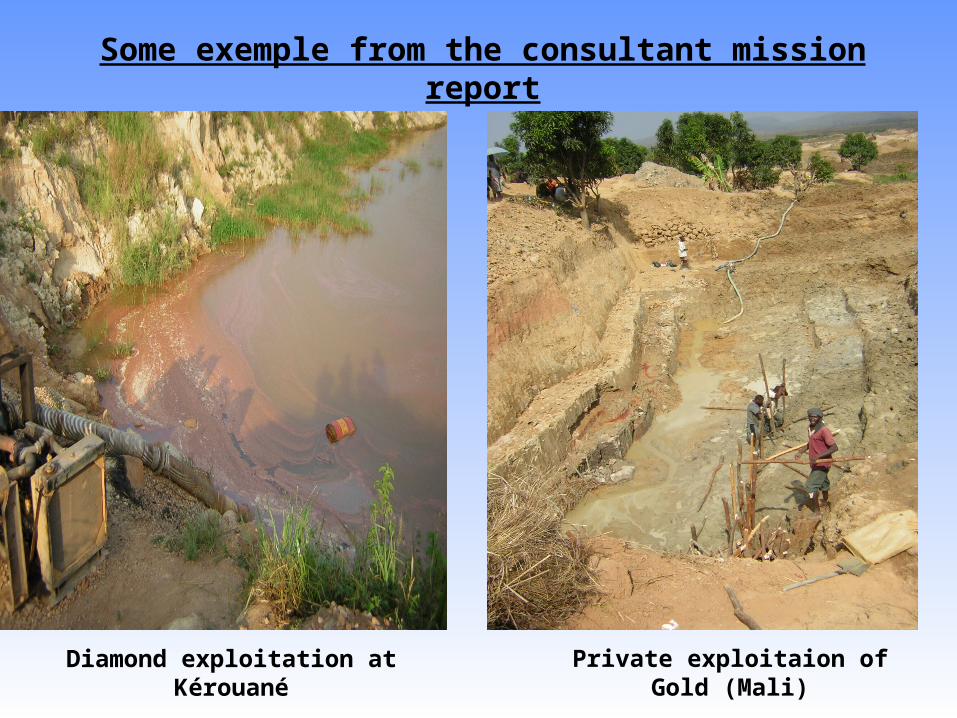
Some exemple from the consultant mission report
Diamond exploitation at Kérouané
( Guinea)
Private exploitaion of Gold (Mali)
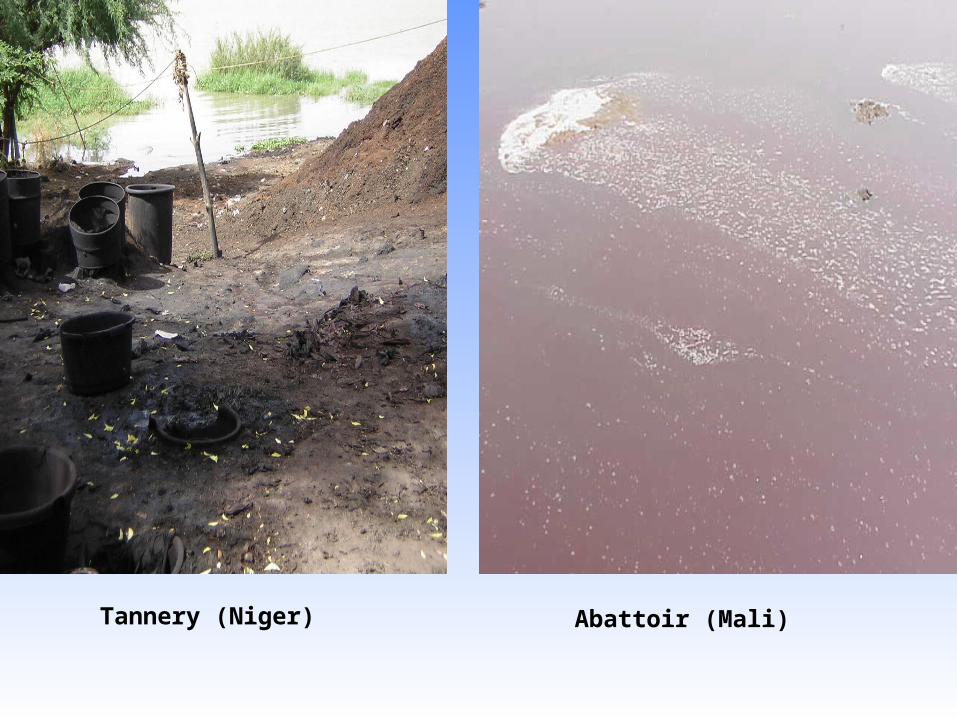
Tannery (Niger) Abattoir (Mali)
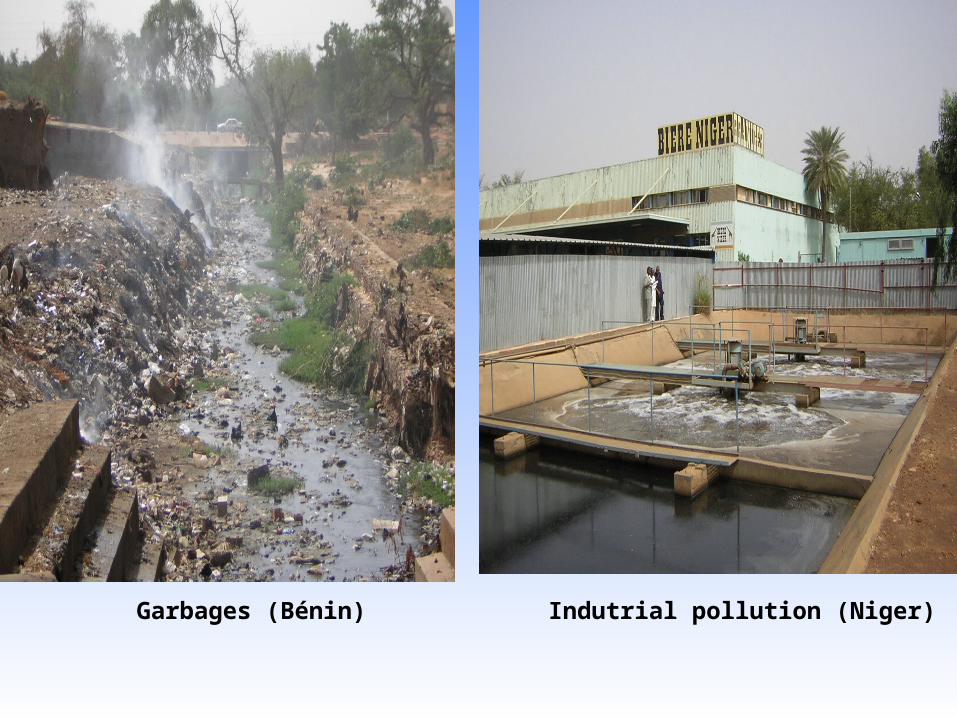
Garbages (Bénin) Indutrial pollution (Niger)

The NBA has engaged since 2002 in a process of Share Vision in view of a Sustainable Development of the basin. One of the major result of this process is the elaboration of a Master plan of the basin. This plan is supported by several partners with the World Bank at the head.
The knowledge on the basin’s water resources in terms of quantity and quality constitute a fundamental element of the Share Vision in the basin development. In this perspectives Canada has already expressed it interest to many of the Share Vision activities and programmes.
The improvement of water quality is a part of its support to the NBA. In a pilot phase it has been considered to:
1) Identify the high pollution risk zone sites of the basin;
2) Evaluate the volume of contamination by toxic substances; (effect on population by consumption of fishes etc..)
This pilot phase will define great actions in pollution control and countries building capacities.

The progressive degradation of the Niger Basin environnement constitutes a real preoccupation for the NBA and its member countries. This is confirmed by a recent consulting mission of evaluation of water quality. In our ongoing process of Share Vision for a sustainable development, the monitoring of waters in termes of quality and quantity constitutes an important component of the NBA Master Plan that which will be finilised in the biginning of the year 2008. Some donors are fully interested by this issue.