Regional - xinhua08.com
23
SEE APPENDIX I FOR IMPORTANT DISCLOSURES AND ANALYST CERTIFICATIONS 4 June 2012 Regional Daily Top Views SG: Sector Update | S-REITs Kian Lin ONG 4 Take our Pristine Picks | BUY (ART SP), BUY (MLT SP), BUY (CMT SP), BUY (FCT SP) - S-REITs currently trade at an average of 0.94x P/BV and 6.8% yield vs their trough valuations of 0.34x P/BV and 17.2% yield during the GFC. - We examined the total rate of return of the 10 largest S-REITs and made our picks based on their track record of DPU accretions and projected performance in FY12F-13F. Rental income resilience, accretive distributions and stable payout track record were also scrutinised. - Our top four S-REITs are CapitaMall Trust, Frasers Centrepoint Trust, Ascendas REIT and Mapletree Logistics Trust. Our top SELLs are K-REIT Asia and CapitaCommercial Trust as we see downside risk in their DPU. TP UPGRADE McapUSD1.2b ADTV USD0.98m PH: First Gen Corp (FGEN) Laura Dy-Liacco 5 Utilities | Completes buy-out of BG’s stake | BUY | Upside 17% - FGEN has bought its partner’s 40% interest in First Gas Holdings Corp, FGP Corp, and First NatGas Power Corp, assuming full ownership of Sta Rita (1,000MW) and San Lorenzo (500MW) natural gas power plants. - The purchase price of USD360m, is equivalent to around 6.8x of First Gas’ combined 2011 earnings and puts the combined value of gas plants at USD900m, 17% lower than our USD1.09b DCF fair value estimate. - With the acquisition, we estimate FGEN’s 2012 PER will improve to 9.9x from 12.6x as we raise our profit forecasts by 27% to USD126m in 2012 and 38% to USD172m in 2013. As a result, we now have a new price target of PHP18.60/sh (11.6x 2012 PE) from PHP18.20/sh. UPGRADE McapUSD3.4b ADTV USD2.6m IJ: Astra Agro Lestari (AALI IJ) Pandu Anugrah 6 Materials | Fully Valued | HOLD | Downside 9.1% - While AALI’s 4M12 CPO sales volume growth remained solid at 10.6% YoY and monthly CPO ASP reached a new record high of IDR8,577/kg, we expect recent CPO price correction to hinder operating performance in 2012, resulting in unchanged negative profit growth of 14.7% YoY. - AALI is poised to benefit from the recent appreciation of USD, partially offsetting the softening CPO prices. This means AALI should register improvement in its 2Q12 revenue, but will remain unexciting. - Having corrected by a significant 8.4% over the past one month, we upgrade our rating to HOLD with unchanged TP of IDR18,000. P K BASU [email protected] (65) 6432 1821 ONG Seng Yeow [email protected] (852) 2268 0644 THAM Mun Hon, CFA [email protected] (852) 2268 0630 Jeremy TAN [email protected] (852) 2268 0635 Today’s Content… Country Singapore S-REITs Philippines First Gen Corp Indonesia Astra Agro Lestari Malaysia Malaysian Banking Statistics Regional Ebbs & Flow Regional US and intra-Asian support for exports in 2H 2012 Thailand Economic Data Indonesia May inflation and April trade accounts Top Buys… Company Ticker Spot Target Upside (%) Thanachart Capital TCAP TB 26.75 40.50 51.4 LICHF LICHF IN 233.90 332.00 41.9 SembMarine SMM SP 4.400 6.200 40.9 China State Construction 3311 HK 6.89 9.45 37.2 Vinamilk VNM VN 87000 118000 35.6 Yes Bank YES IN 323.35 434.00 34.2 AAPICO Hitech AH TB 13.70 18.00 31.4 Charoen Pokphand Indo CPIN.IJ 2550 3300 29.4 Philex Mining Corp PX PM 24.45 30.61 25.2 Asian Property Development AP TB 6.80 8.50 25.0 Petronet LNG Ltd PLNG IN 138.75 170.00 22.5 Chaoren Pokphand Foods CPF TB 36.75 45.00 22.4 CapitaMall Trust CT SP 1.800 2.200 22.2 Top Sells… Company Ticker Spot Target Downside (%) Astra Agro Lestari AALI IJ 20400 6800 -66.7 Jai Prakash Associates JPA IN 61.70 41.00 -33.5 Cosco Corp COS SP 1.005 0.750 -25.4 Ayala Land ALI PM 19.98 15.00 -24.9 Uni-President 220 HK 6.77 5.60 -17.3 Maybank-KE Events…. Date Event Location 1 Jun Sarin Technology NDR SFO 1 Jun Lafarge Malayan Cement PJ 4 Jun Felda IPO – Management Roadshow SG 5 Jun Felda IPO – Management Roadshow KL 7 Jun AB: GW Plastic Holdings KL
Transcript of Regional - xinhua08.com
SEE APPENDIX I FOR IMPORTANT DISCLOSURES AND ANALYST CERTIFICATIONS
4 June 2012
Regional
Daily
Top Views SG: Sector Update | S-REITs Kian Lin ONG 4 Take our Pristine Picks | BUY (ART SP), BUY (MLT SP), BUY (CMT SP), BUY (FCT SP) - S-REITs currently trade at an average of 0.94x P/BV and 6.8% yield vs
their trough valuations of 0.34x P/BV and 17.2% yield during the GFC. - We examined the total rate of return of the 10 largest S-REITs and made
our picks based on their track record of DPU accretions and projected performance in FY12F-13F. Rental income resilience, accretive distributions and stable payout track record were also scrutinised.
- Our top four S-REITs are CapitaMall Trust, Frasers Centrepoint Trust, Ascendas REIT and Mapletree Logistics Trust. Our top SELLs are K-REIT Asia and CapitaCommercial Trust as we see downside risk in their DPU.
TP UPGRADE McapUSD1.2b ADTV USD0.98m PH: First Gen Corp (FGEN) Laura Dy-Liacco 5 Utilities | Completes buy-out of BG’s stake | BUY | Upside 17% - FGEN has bought its partner’s 40% interest in First Gas Holdings Corp,
FGP Corp, and First NatGas Power Corp, assuming full ownership of Sta Rita (1,000MW) and San Lorenzo (500MW) natural gas power plants.
- The purchase price of USD360m, is equivalent to around 6.8x of First Gas’ combined 2011 earnings and puts the combined value of gas plants at USD900m, 17% lower than our USD1.09b DCF fair value estimate.
- With the acquisition, we estimate FGEN’s 2012 PER will improve to 9.9x from 12.6x as we raise our profit forecasts by 27% to USD126m in 2012 and 38% to USD172m in 2013. As a result, we now have a new price target of PHP18.60/sh (11.6x 2012 PE) from PHP18.20/sh.
UPGRADE McapUSD3.4b ADTV USD2.6m IJ: Astra Agro Lestari (AALI IJ) Pandu Anugrah 6 Materials | Fully Valued | HOLD | Downside 9.1% - While AALI’s 4M12 CPO sales volume growth remained solid at 10.6%
YoY and monthly CPO ASP reached a new record high of IDR8,577/kg, we expect recent CPO price correction to hinder operating performance in 2012, resulting in unchanged negative profit growth of 14.7% YoY.
- AALI is poised to benefit from the recent appreciation of USD, partially offsetting the softening CPO prices. This means AALI should register improvement in its 2Q12 revenue, but will remain unexciting.
- Having corrected by a significant 8.4% over the past one month, we upgrade our rating to HOLD with unchanged TP of IDR18,000.
P K BASU [email protected] (65) 6432 1821 ONG Seng Yeow [email protected] (852) 2268 0644 THAM Mun Hon, CFA [email protected] (852) 2268 0630 Jeremy TAN [email protected] (852) 2268 0635 Today’s Content…
Country Singapore S-REITs Philippines First Gen Corp Indonesia Astra Agro Lestari Malaysia Malaysian Banking Statistics Regional Ebbs & Flow Regional US and intra-Asian support for exports in 2H
2012 Thailand Economic Data Indonesia May inflation and April trade accounts
Top Buys… Company Ticker Spot Target Upside (%) Thanachart Capital TCAP TB 26.75 40.50 51.4 LICHF LICHF IN 233.90 332.00 41.9 SembMarine SMM SP 4.400 6.200 40.9 China State Construction 3311 HK 6.89 9.45 37.2 Vinamilk VNM VN 87000 118000 35.6 Yes Bank YES IN 323.35 434.00 34.2 AAPICO Hitech AH TB 13.70 18.00 31.4 Charoen Pokphand Indo CPIN.IJ 2550 3300 29.4 Philex Mining Corp PX PM 24.45 30.61 25.2 Asian Property Development AP TB 6.80 8.50 25.0 Petronet LNG Ltd PLNG IN 138.75 170.00 22.5 Chaoren Pokphand Foods CPF TB 36.75 45.00 22.4 CapitaMall Trust CT SP 1.800 2.200 22.2
Top Sells… Company Ticker Spot Target Downside (%) Astra Agro Lestari AALI IJ 20400 6800 -66.7 Jai Prakash Associates JPA IN 61.70 41.00 -33.5 Cosco Corp COS SP 1.005 0.750 -25.4 Ayala Land ALI PM 19.98 15.00 -24.9 Uni-President 220 HK 6.77 5.60 -17.3
Maybank-KE Events…. Date Event Location 1 Jun Sarin Technology NDR SFO 1 Jun Lafarge Malayan Cement PJ 4 Jun Felda IPO – Management Roadshow SG 5 Jun Felda IPO – Management Roadshow KL 7 Jun AB: GW Plastic Holdings KL

4 June 2012
Regional Daily
Company Notes MK: Malaysian Banking Statistics Desmond Ch’ng 7 Loan growth steady in April | NEUTRAL - Loan growth in April was 12.1% YoY versus 12.2% YoY in Mar and 11.9%
in Feb. - Household (HH) loan growth moderated further for the 4th consecutive
month to its slowest pace since Mar 2010 at 11.7% YoY but the slack was picked up by the non-HH segment (+12.5% YoY).
- Our Neutral call on the banking sector is unchanged, as are our top Buys (Public Bank and BIMB Holdings) and Sells (CIMB and RHB Capital).
RG: Strategy Tham M.H. 8 Ebbs & Flow | Fear factor - Asia ex-Japan saw a net selling of USD643m for the week ending 30
May, the 12th weekly outflow out of the past 13 weeks. - With no clear solution to the Euro debt crisis, investors continued to pull
funds out of emerging markets and risk assets and into the US. The region is now trading at a forward P/BV of 1.36x based on Factset consensus, similar to the lows reached during 2H11.
- However, there are now deeper concerns for the market with investors focusing on the capital adequacy of banks in the PIIGS economies and their implications for the global financial system. What is cheap could get cheaper still.
Economics Regional: Economy P.K. Basu 9 US and intra-Asian support for exports in 2H 2012 - US non-farm payrolls were dismal (at 69,000 for May 2012, less than
half the consensus expectation). But the US has added about 1.78m jobs in the past 12 months, considerably better than 1.04m in the 12 months to May 2011 – so the latest weakness masks underlying trend improvement in the US labour market. More importantly, the US manufacturing sector remained an island of stability in the global sea of trouble, with the ISM manufacturing PMI still healthy at 53.5 in May.
- In particular, the key forward-looking gauge (ISM manufacturing new orders) strengthened further to 60.1 in May 2012. Given that it is an excellent 6-month leading indicator of US imports from Asia, the strong April-May 2012 readings for ISM manufacturing new orders should translate to 16-18% YoY growth in Asian exports to the US in October-November 2012. Although slumping European demand will remain a drag, intra-Asian demand is likely to be aided by the modest fiscal stimulus being rolled out in China –plus the 100bp of RRR cuts and 50bp of policy rate cuts we expect there for the rest of 2012. We continue to expect Asia’s exports to expand 8-10% YoY through the rest of 2012.
- As the Euro weakens sharply further this month, and the lack of political will (amid aggregate fiscal sustainability for the Eurozone) causes Euro-denominated asset values to decline, there will be a huge opportunity for cash-rich Asian corporates (including banks) to acquire cheap European assets (in a reversal of the situation Asia faced in 1997-98).

4 June 2012
Regional Daily
TH: Economic Data, April 2012 Chaiyachoke S. 12 Positive momentum but higher risks - April figures continued to show a recovery after the flood for a 5th
consecutive month, led by manufacturing and investment sectors - The overall Thai economy remained at a satisfactory level and we believe
this growth momentum will continue into the end of 2Q12. - We expect the euro crisis will impact the world economy and major Thai
trading partners, and thus pose significantly higher risks on Thai economic recovery.
IJ: May inflation and April trade accounts Luz Lorenzo 18 Steady inflation, falling exports - There was little change in May headline consumer inflation of 4.45% YoY
and core inflation of 4.14% as slight increases in food-related inflation were more than offset by slowing price increases in the rest of the consumer basket. With international crude oil prices falling sharply and a weak global economy unlikely to push these higher, we believe there will be no subsidy cuts this year and accordingly lower our 2012 headline inflation forecast to 4.5% from 5.5%.
- Subdued inflation is unlikely to allow the central bank to cut the policy rate as it strives to maintain rupiah stability. Given the volatility thus far, the worsening European debt crisis and inward-looking domestic policy changes, we expect the exchange rate to average IDR9,260/USD this year from IDR8,850 previously.
- A rare monthly trade deficit in April narrowed the 4M11 trade surplus to USD2.1b, down 74% YoY as exports slow down faster than imports. However, FDI is acting as a counterweight as flows have increased substantially since 2010. International reserves at USD116b as of April are higher than USD110b at end-2011. We believe a strong domestic economy will remain a magnet for less volatile FDI flows.
SEE APPENDIX I FOR IMPORTANT DISCLOSURES AND ANALYST CERTIFICATIONS
Sector Update 4 June 2012
Singapore
Co. Reg No: 198700034E MICA (P) : 099/03/2012
Singapore REITs Take Our Pristine Picks
Track record matters. The myth that S-REITs are good income-yielding instruments for retail investors has generated much debate. On the one hand, REITs proponents like the recurring distributions paid out from steady streams of rental income. On the other hand, naysayers argue that whatever REITs managers pay out in dividends, they will likely take back in the form of rights issues. We examined the total rate of return of the 10 largest S-REITs since their listing, namely, those with a trading history of at least five years, and put forward our pristine picks to ride through the impending economic down cycle.
Industrial and retail REITs top of the league. REITS in the more resilient subsectors like industrial and retail topped our league table, with CDL Hospitality Trusts, Frasers Centrepoint Trust and Ascendas Real Estate Investment Trust the best performers. K-REIT Asia was the worst performer, given the numerous equity cash calls it made to fund acquisitions. While past performance may not guarantee future returns, we take the view that our league table does provide some insights into the track record of the individual S-REITs.
Good mix of stability and growth potential. Rental income resilience, total rate of return, accretive distributions and stable payout track record are some of the parameters we scrutinised by delving into the operating history of the S-REITs since their initial public offering. Barring a full-blown European debt crisis, we also think that it is unlikely that S-REITs will be de-rated to the levels seen during the global financial crisis (GFC) due to stronger balance sheets and the absence of credit tightening.
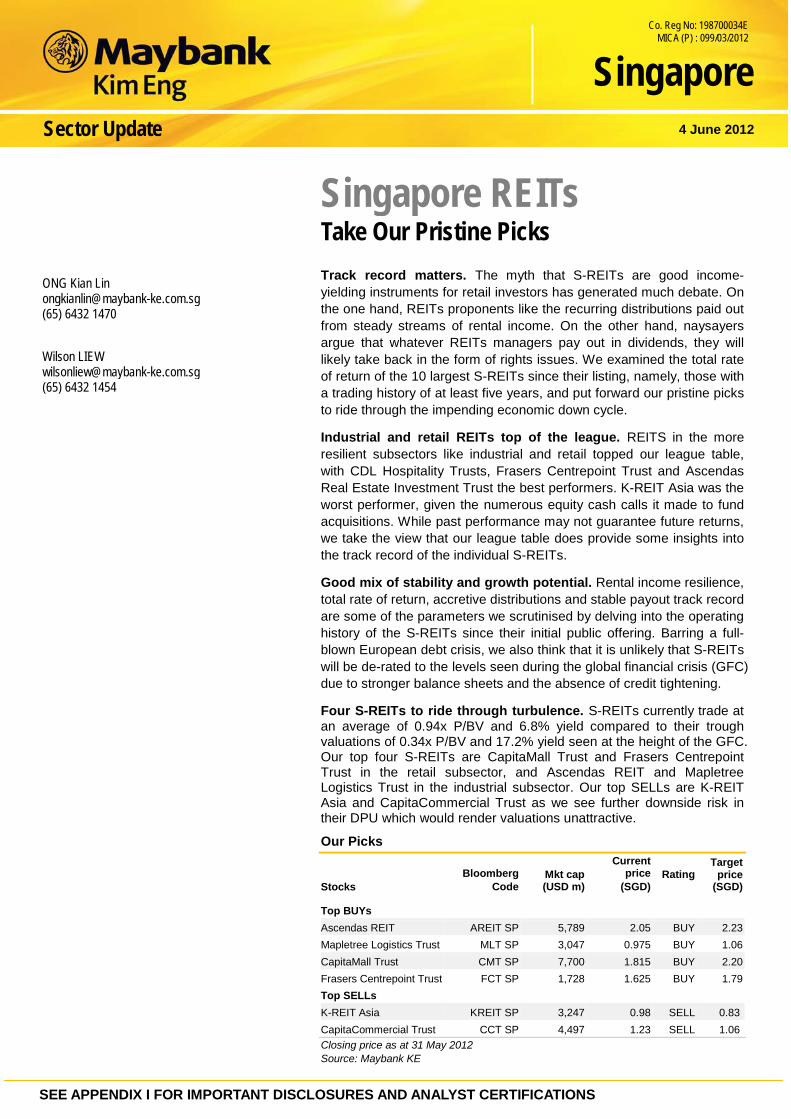
Four S-REITs to ride through turbulence. S-REITs currently trade at an average of 0.94x P/BV and 6.8% yield compared to their trough valuations of 0.34x P/BV and 17.2% yield seen at the height of the GFC. Our top four S-REITs are CapitaMall Trust and Frasers Centrepoint Trust in the retail subsector, and Ascendas REIT and Mapletree Logistics Trust in the industrial subsector. Our top SELLs are K-REIT Asia and CapitaCommercial Trust as we see further downside risk in their DPU which would render valuations unattractive.
Our Picks
Stocks Bloomberg
Code Mkt cap (USD m)
Current price
(SGD) Rating
Target price
(SGD)
Top BUYs Ascendas REIT AREIT SP 5,789 2.05 BUY 2.23 Mapletree Logistics Trust MLT SP 3,047 0.975 BUY 1.06 CapitaMall Trust CMT SP 7,700 1.815 BUY 2.20 Frasers Centrepoint Trust FCT SP 1,728 1.625 BUY 1.79 Top SELLs K-REIT Asia KREIT SP 3,247 0.98 SELL 0.83 CapitaCommercial Trust CCT SP 4,497 1.23 SELL 1.06 Closing price as at 31 May 2012 Source: Maybank KE
ONG Kian Lin [email protected] (65) 6432 1470 Wilson LIEW [email protected] (65) 6432 1454

SEE APPENDIX I FOR IMPORTANT DISCLOSURES AND ANALYST CERTIFICATIONS
Philippines Company Update 4 June 2012
First Gen Corp Completes buy-out of BG’s stake
Acquires BG’s 40% stake in gas plants for USD360m. First Gen Corp (FGEN – BUY) announced it has successfully completed the buy-out of its partner’s 40% interest in First Gas Holdings Corp, FGP Corp, and First NatGas Power Corp, thereby becoming the 100% owner of the 1,000 MW Sta Rita and 500 MW San Lorenzo natural gas power plants (collectively referred to as First Gas). Through wholly-owned subsidiary Blue Vulcan Holdings Corp (BVHC), FGEN acquired BG Group’s 40% stake in First Gas for a net consideration of USD360m. This is 10% lower than the USD400m offer made previously by a third party. The transaction is equivalent to around 6.8x of First Gas’ combined 2011 earnings of USD132m and places the combined value of gas plants at USD900m. The amount is 17% lower than our USD1.09b estimate of the natural gas power plants’ fair value based on discounted cash flow.
Purchase has little impact on leverage. Around USD220m was funded by the PHP12b in Series G perpetual preferred shares (Perps) raised in May. The Perps pay an annual dividend of 7.7808%. Some USD50m was funded by Blue Vulcan’s new short-term loan that carries an annual interest rate of 3.5%. Half of the loan (USD25m) is due in November with the 50% balance due in May 2013. The remaining balance of USD90m was funded by equity, leaving FGEN with still sufficient cash of USD100m to pay off the remaining USD82m in convertible bonds due in June 2013.
Earnings and price target raised. With the acquisition, we estimate FGEN’s 2012 PER will improve to 9.9x from 12.6x as we raised our profit forecasts by 27% to USD126m in 2012 and 38% to USD172m in 2013. The changes reflect the incremental profits from First Gas of USD30m from June to December of this year and around USD52m for the whole of 2013. We also assumed some USD1m in additional interests cost from the USD50m in new debt availed by subsidiary Blue Vulcan and adjusted our preferred dividend payment assumption. As a result of these changes, we now derive a new price target of PHP18.60/sh from PHP18.20/sh. This translates to a 2012 PE of 11.6x.
First Gen Corp– Summary Earnings TableFYE 31 Dec (USDm) 2009A 2010 2011 2012 2013Revenue 1,010 1,169 1,341 1,549 1,664 EBITDA 255 252 266 270 270 Recurring Income to Common (USDm) 34 57 73 126 172 Recurring Income to Common (PHPm) 1,611 2,554 3,173 5,390 7,085 Recurring Basic EPS (PHP) 0.84 0.79 0.94 1.60 2.11 EPS growth (%) 24.4 (6.7) 20.1 69.9 31.4 DPS (PHP) 0.00 0.00 0.00 0.00 0.00 PER 18.9 20.2 16.9 9.9 7.5 EV/EBITDA (x) 7.2 7.7 7.4 6.5 6.2 Div Yield (%) 0.0 0.0 0.0 0.0 0.0 P/BV(x) 1.0 1.2 1.0 0.8 0.7 Net Gearing (%) 124.7 69.8 44.3 29.5 22.0 ROE (%) 6.0 6.9 6.6 8.7 9.6 ROA (%) 1.2 2.5 3.0 4.6 5.9 Consensus Net Profit (USDm) n/a n/a n/a 110 131 Source: FGEN, Maybank ATR Kim Eng Securities, Inc
Buy (unchanged) Share price: PHP15.90 Target price: PHP18.60 (upgraded from P18.20) Laura Dy-Liacco [email protected] (632) 849 8840
Stock Information Description: FGEN is the holding company for the power generation and energy-related businesses of the Lopez group. The company’s focus is on power generation. Ticker: FGEN PM / FGEN.PS Shares Issued (m): 3,362.8 Market Cap (PHPm): 53,468.8 Market Cap (USDm): 1,232.0 3-mth Avg Daily Turnover (USDm): 0.98 PSEi: 5,062.44 Free float (%): 32.0 Major Shareholders: % FIRST PHILIPPINE HOLDINGS CORP 66.2 Key Indicators
ROE – annualised (%) 8.7 Net debt (PHP): 20,684 NTA/shr (PHP): 20.86 Interest cover (x): 2.3
Historical Chart
FGEN PM
9.0
10.0
11.0
12.0
13.0
14.0
15.0
16.0
17.0
Jun-10 Oct-10 Feb-11 Jun-11 Oct-11 Feb-12 Jun-12 Performance: 52-week High/Low PHP16.70/PHP12.50 1-mth 3-mth 6-mth 1-yr YTD Absolute (%) 12.61 17.60 16.40 7.87 8.76 Relative (%) 15.30 15.10 (1.59) (10.23) (6.38)

SEE APPENDIX I FOR IMPORTANT DISCLOSURES AND ANALYST CERTIFICATIONS
Company Update 4 June 2012
Indonesia
Astra Agro Lestari Fully Valued
Solid 4M12 CPO sales volume growth of 10.5% YoY. Astra Agro Lestari (AALI) managed to register April CPO sales volume growth of 7.6% MoM to 105k tonnes, bringing 4M12 sales volumes to 403.8k tonnes (+10.6% YoY), accounting for 30% of our full-year forecast. AALI’s 4M12 sales volume growth mainly stemmed from an 11.5% YoY growth in third-party FFB output, compensating for flat nucleus FFB processed of 1.1m tonnes (+1.6% YoY) owing to AALI’s old age tree profile and limited landbank for new planting.
Monthly ASP reached a YTD high in April. In tandem with the increase in CPO prices in April, AALI recorded an average selling price of IDR8,577/kg, up 14% MoM. This translates to a 4M12 ASP of IDR7,923/kg, 2.3% lower than the IDR8,116/kg ASP in 4M11. We expect AALI’s May ASP to fall, given the 10% correction in CPO spot prices over the past month on continued uncertainties in the Eurozone. This, coupled with seasonally higher production in 2H12 resulting in a lower CPO price outlook, underpin our FY12 ASP estimate of IDR7,531/kg (vs. IDR7,576/kg in FY11) for AALI.
QoQ improvement in 2Q12, continued weak performance in 1H12. We expect the recent softening of CPO prices and depreciation of the IDR against the USD to offset each other, paving the way for a potentially positive QoQ improvement in 2Q12 operating performance. Note that AALI would benefit from the weakening of IDR. Our back of the envelope calculation suggests that on our base case scenario of 2Q12 top line estimate, AALI’s ASP and sales volume growth should both increase by an estimated 5% QoQ. Furthermore, we expect 1H12 revenue growth to improve to a flat rate from -6.6% YoY in 1Q12. On the flip side, a continued increase in production costs will impact 1H12 operating margins; as such, we maintain our FY12 margin forecast of 24.9% vs. 29.7% in FY11.
Fully valued; reiterate IDR18,000 TP, raise to HOLD. Having corrected by a significant 8.4% and reached the lowest one-month historical point of IDR18,300,we believe that AALI’s share price is fully valued. We maintain our TP of IDR18,000 (FY12 implied PER of 14x) but raise our recommendation to HOLD as potential downside is less that 15%.
Astra Agro Lestari – Summary Earnings Table FYE Dec (IDR b) 2010 2011 2012F 2013F 2014FRevenue 8,844 10,773 11,179 11,462 12,062 EBITDA 3,249 3,527 3,246 3,476 3,670 Recurring Net Profit 2,017 2,406 2,052 2,130 2,261 Recurring Basic EPS (IDR) 1,281 1,528 1,303 1,353 1,436 EPS growth (%) 21.4 19.3 (14.7) 3.8 6.2 DPS (IDR) 655 940 993 847 879
PER (x) 15.9 13.4 15.7 15.1 14.2 EV/EBITDA (x) 9.5 8.9 9.8 9.1 8.4 Div Yield (%) 3.2 4.6 4.9 4.2 4.3 P/BV(x) 4.5 3.9 3.7 3.4 3.1
Net Gearing (%) Net Cash Net Cash Net Cash Net Cash Net Cash ROE (%) 28.0 29.6 23.8 22.6 22.0 ROA (%) 22.9 23.6 18.4 17.7 17.2 Consensus Net Profit (IDR b) - - 2,642 2,886 2,977 Source: Company, Kim Eng estimates
HOLD (from SELL) Share price: IDR20,400 Target price: IDR18,000 (Unchanged) Pandu Anugrah [email protected] (62 21) 2557 1137 Stock Information Description: Astra Agro Lestari is the largest listed plantation company in Indonesia. It owns a total planted area of 267,000ha located in Sumatra and Kalimantan. Ticker: AALI IJ Shares Issued (m): 1,575 Market Cap (USD m): 3,421 3-mth Avg Daily Turnover (USD m): 2.6 IDX index: 3799,8 Free float (%): 20.32 Major Shareholders: % Astra International 79.68 Key Indicators
ROE – annualised (%) 22 Net cash (IDR b): 372 NTA/shr (IDR): 5,478 Interest cover (x): 229
Historical Chart
01122334455
0
5,000
10,000
15,000
20,000
25,000
30,000
30-May-11 20-Aug-11 10-Nov-11 31-Jan-12 22-Apr-12
IDR Millionshares
Performance: 52-week High/Low IDR23,950/IDR16,550 1-mth 3-mth 6-mth 1-yr YTD Absolute (%) -3.8 -7.9 -9.7 -13.7 -6.2 Relative (%) 5.7 -3.8 -10.2 -12.8 -6.0

Sector Update 4 June 2012
SEE APPENDIX I FOR IMPORTANT DISCLOSURES AND ANALYST CERTIFICATIONS
Maybank IB Research PP16832/01/2013 (031128)
Loan growth steady in April
Steady momentum. Loan growth in April was 12.1% YoY versus 12.2% YoY in Mar and 11.9% in Feb. Household (HH) loan growth moderated further for the 4th consecutive month to its slowest pace since Mar 2010 at 11.7% YoY but the slack was picked up by the non-HH segment (+12.5% YoY). Our Neutral call on the banking sector is unchanged, as are our top Buys (Public Bank and BIMB Holdings) and Sells (CIMB and RHB Capital).
Still much demand for property. Property loan demand remains resilient with mortgages growing at a pace of more than 13% (+13.7% YoY in April) for the eighth consecutive month and non-residential property loan growth has now topped 23% (+23.4% YoY in April). As one banker highlighted during InvestMalaysia 2012, individual investors are switching from buying residential to commercial properties but still demanding residential rates for their loans, which is one of the reasons why net interest margins (NIMs) have continued to compress.
Household segment moderates again. The moderation in HH loan growth came yet again from hire purchase, personal loans, share financing and credit card segments, which cumulatively account for 26.8% of total loans. Non-household loan momentum picked up and this is reflected in the improvement in business loan growth to 11.7% YoY in April from 10.8% YoY in March.
Segmental loan growth (YoY) Apr 12 Mar 12 Feb 12 Jan 12 Dec 11 Securities 10.8% 12.0% 13.3% 18.4% 18.8% Transport vehicles 6.5% 7.1% 7.4% 7.8% 8.7% Residential property 13.7% 13.9% 13.5% 13.0% 13.1% Non-residential property 23.4% 22.7% 21.8% 21.2% 21.2% Fixed assets -0.7% -2.4% 0.8% -0.8% 2.5% Personal use 15.0% 15.5% 17.3% 18.5% 20.2% Credit card 6.2% 6.6% 6.2% 7.7% 8.4% Consumer durables -9.7% -22.7% -25.4% -14.5% -14.1% Construction 17.3% 19.2% 16.2% 13.3% 15.7% Working capital 10.2% 10.4% 10.0% 9.5% 11.6% Other purposes 8.7% 7.0% 5.4% 9.4% 18.1% Total 12.1% 12.2% 11.9% 12.1% 13.6% Source: BNM
Banking Sector – Peer Valuation Summary Stock Rec Shr px Mkt cap TP PER (x) PER (x) P/B (x) P/B (x) ROAE (%) ROAE (%) Net yield Net yield
(MYR) (MYRm) (MYR) CY12E CY13E CY12E CY13E CY12E CY13E CY12E CY13E Maybank * NR 8.69 64,985 NR 12.6 11.4 1.8 1.7 15.3 15.4 6.0 6.6 CIMB SELL 7.40 55,003 6.80 12.9 11.7 2.0 1.8 15.8 16.1 3.5 3.8 Public Bank BUY 13.70 48,387 15.40 12.2 11.3 2.7 2.4 23.6 22.7 4.2 4.6 AMMB HOLD 6.22 18,748 6.30 11.6 10.7 1.6 1.4 14.1 14.0 3.6 3.9 HL Bank HOLD 12.28 23,085 11.60 12.1 11.3 1.8 1.6 15.5 15.1 1.8 1.9 RHB Cap SELL 7.38 16,272 7.10 9.9 9.0 1.3 1.2 13.9 13.9 3.0 3.3 Simple average 226,480 11.9 10.9 1.9 1.7 16.4 16.2 BIMB BUY 2.55 2,720 3.00 12.0 10.8 1.3 1.2 11.8 11.6 3.0 3.4 NR = Not Rated; * Consensus estimates; Source: Maybank IB
Banking Neutral (unchanged) Desmond Ch’ng, ACA [email protected] (603) 2297 8680

SEE APPENDIX I FOR IMPORTANT DISCLOSURES AND ANALYST CERTIFICATIONS
RegionalMarket Strategy 1 June 2012
Ebbs & Flows Fear Factor Asia ex-Japan saw a net selling of USD643m for the week
ending 30 May, the 12th weekly outflow out of the past 13 weeks. With no clear solution to the Euro debt crisis, investors continued to pull funds out of emerging markets and risk assets and into the US. As a result, the latter saw an inflow of USD7.4b for the latest week, supporting an inflow of USD6.4b for global equities.
Within Asia ex-Japan, we saw outflows from all markets and sectors. The region is now trading at a forward P/BV of 1.36x based on Factset consensus, similar to the lows reached during 2H11 when the market was weighed by fears of a global recession.
However, there are now deeper concerns for the market with investors focusing on the capital adequacy of banks in the PIIGS economies and their implications for the global financial system. Thus, we could be seeing the start of a further round of de-rating, as investors price in much lower expected returns of 10-11% (compared to sell-side consensus of 13.3%), approaching levels recorded during the height of the global financial crisis in 2008/09. If this eventuates, there could be further downside for the stock market – what is cheap could get cheaper still.
Weekly sector flows
% of assets Weekly flow (USD m) Year-to-date flows Country 30-May-12 30-May-12 23-May-12 16-May-12 9-May-12 USD m % YoYConsumer Discretionary (0.39) (80.5) (55.4) (52.3) (6.5) (149) 69.9Consumer Staples (0.32) (33.2) (29.3) (22.6) (3.5) (51) 87.0Energy (0.43) (70.1) (44.7) (38.5) 14.3 196 131.6Financials (0.40) (218.5) (141.3) (76.6) (16.4) 57 102.8Health Care (0.24) (7.2) (5.2) (12.5) (6.3) (9) 94.0Industrials (0.31) (54.9) (44.8) (16.1) (5.3) (284) 50.1Information Technology (0.24) (68.3) (41.6) 16.2 (23.3) (515) (15.2)Materials (0.32) (47.5) (35.7) (8.1) (16.4) (182) 50.5Telecom Services (0.39) (35.8) (18.4) (10.5) 5.7 95 129.8Utilities (0.31) (9.7) (7.1) (7.8) (0.2) 14 110.0Note: AUM of funds tracked under sector flows is smaller than those tracked for country flows. Source: EPFR, Maybank KE
THAM Mun Hon, CFA [email protected] (852) 2268 0630

SEE APPENDIX I FOR IMPORTANT DISCLOSURES AND ANALYST CERTIFICATIONS
Economics 4 June 2012
Regional
Co. Reg No: 198700034E MICA (P) : 099/03/2012
Asia 2H exports supported ISM gauge => strengthening US demand
Non-farm payrolls far below consensus, as US hiring succumbs to contagion from Eurozone turmoil. US non-farm payrolls rose by only a tepid 69,000 in May 2012 – far below the consensus expectation of 150,000. The headline increase for May 2012 is the smallest since May 2011 – and clearly a dismal figure for this stage of the recovery. The US labour market is beginning to succumb to the impact of the uncertainty created by turmoil in the Eurozone. But the US has now added 1.782m employees to its non-farm payrolls in the past 12 months, far better than the 1.039m added in the 12 months to May 2011 – showing a modest trend improvement in the US labour market. Although the unemployment rate rose to 8.2% in May 2012 (from 8.1% the previous month), this is well below the 9% rate of a year ago, and a recent peak of 10% in October 2009. The unemployment rate will be slow to decline, because signs of improvement in the labour market are attracting workers back into the labour-force (as happened in May 2012).
Chart 1: May disappointment, but latest 12 months better than previous 12
-1,000.000
-800.000
-600.000
-400.000
-200.000
0.000
200.000
400.000
600.000Monthly change in US non-farm payrolls (seasonally-adjusted)
Source: Maybank KE, CEIC
Amid gloomy global data (with purchasing managers’ surveys weakening across the world, and actual GDP and industrial data showing sharp slowdowns in the key emerging markets of China, Brazil and India), the US manufacturing sector remains an island of relative solidity. ISM's headline manufacturing PMI weakened slightly to 53.5 (from 54.8 in April), mainly because the production index moderated sharply (55.6 from 61). This was consistent with the jobs report in affirming the current cyclical sluggishness in the economy -- but still clearly indicated continued expansion in the manufacturing sector.
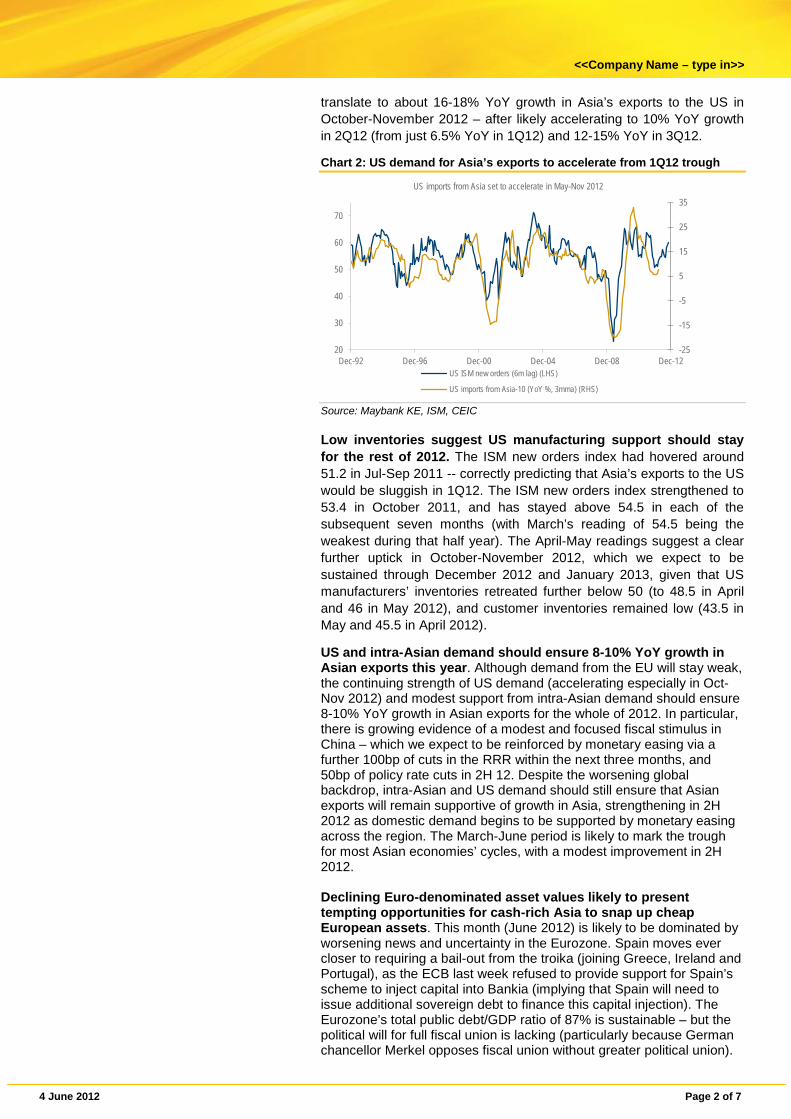
ISM new orders suggest US imports from Asia should accelerate to 16-18%YoY growth in October-November 2012. ISM manufacturing new orders are an excellent 6-month leading indicator of US imports from Asia (see chart 2). That ISM new orders index strengthened to 60.1 in May and 58.2 in April 2012 (substantially above the 50 mark that distinguishes expansion from contraction in each component of the ISM survey). Given its properties as a 6-month leading indicator, this level for ISM manufacturing new orders should
Prasenjit K. Basu [email protected] (65) 6432 1821
4 June 2012 Page 2 of 7
<<Company Name – type in>>
translate to about 16-18% YoY growth in Asia’s exports to the US in October-November 2012 – after likely accelerating to 10% YoY growth in 2Q12 (from just 6.5% YoY in 1Q12) and 12-15% YoY in 3Q12.
Chart 2: US demand for Asia’s exports to accelerate from 1Q12 trough
-25
-15
-5
5
15
25
35
20
30
40
50
60
70
Dec-92 Dec-96 Dec-00 Dec-04 Dec-08 Dec-12
US imports from Asia set to accelerate in May-Nov 2012
US ISM new orders (6m lag) (LHS)
US imports from Asia-10 (YoY %, 3mma) (RHS)
Source: Maybank KE, ISM, CEIC Low inventories suggest US manufacturing support should stay for the rest of 2012. The ISM new orders index had hovered around 51.2 in Jul-Sep 2011 -- correctly predicting that Asia’s exports to the US would be sluggish in 1Q12. The ISM new orders index strengthened to 53.4 in October 2011, and has stayed above 54.5 in each of the subsequent seven months (with March’s reading of 54.5 being the weakest during that half year). The April-May readings suggest a clear further uptick in October-November 2012, which we expect to be sustained through December 2012 and January 2013, given that US manufacturers’ inventories retreated further below 50 (to 48.5 in April and 46 in May 2012), and customer inventories remained low (43.5 in May and 45.5 in April 2012).
US and intra-Asian demand should ensure 8-10% YoY growth in Asian exports this year. Although demand from the EU will stay weak, the continuing strength of US demand (accelerating especially in Oct-Nov 2012) and modest support from intra-Asian demand should ensure 8-10% YoY growth in Asian exports for the whole of 2012. In particular, there is growing evidence of a modest and focused fiscal stimulus in China – which we expect to be reinforced by monetary easing via a further 100bp of cuts in the RRR within the next three months, and 50bp of policy rate cuts in 2H 12. Despite the worsening global backdrop, intra-Asian and US demand should still ensure that Asian exports will remain supportive of growth in Asia, strengthening in 2H 2012 as domestic demand begins to be supported by monetary easing across the region. The March-June period is likely to mark the trough for most Asian economies’ cycles, with a modest improvement in 2H 2012. Declining Euro-denominated asset values likely to present tempting opportunities for cash-rich Asia to snap up cheap European assets. This month (June 2012) is likely to be dominated by worsening news and uncertainty in the Eurozone. Spain moves ever closer to requiring a bail-out from the troika (joining Greece, Ireland and Portugal), as the ECB last week refused to provide support for Spain’s scheme to inject capital into Bankia (implying that Spain will need to issue additional sovereign debt to finance this capital injection). The Eurozone’s total public debt/GDP ratio of 87% is sustainable – but the political will for full fiscal union is lacking (particularly because German chancellor Merkel opposes fiscal union without greater political union).

4 June 2012 Page 3 of 7
<<Company Name – type in>>
Consequently, the Euro is likely to weaken substantially further – and Eurozone asset values are likely to decline sharply. For cash-rich Asian corporates, a Great European Fire-sale will be a feature of 2H 2012 (much as European and US corporates/banks were able to snap up inexpensive assets in Asia in 1998-99).

SEE APPENDIX I FOR IMPORTANT DISCLOSURES AND ANALYS T CERTIFICATIONS
Economics
1 June 2012
Thailand
Thailand Data Flash Positive momentum but higher risks
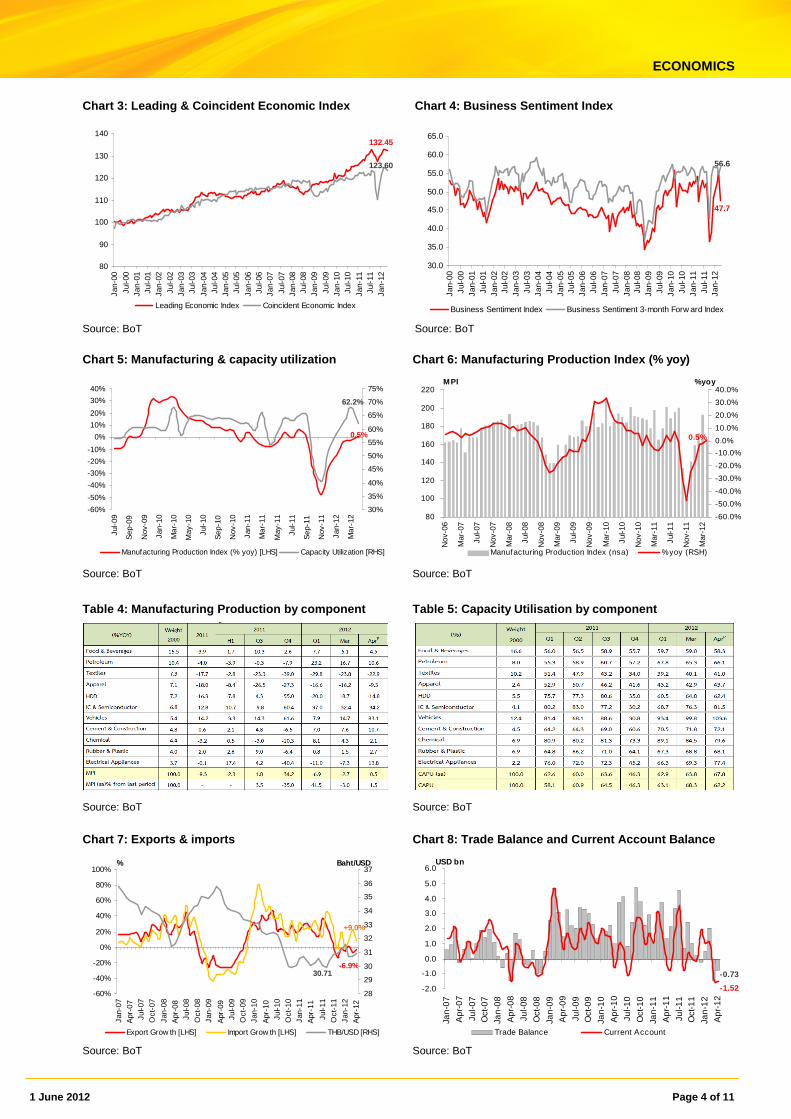
April economic recovery gradual April figures continued to show a recovery after the flood for a 5th month, led by manufacturing and investment sector growth. Manufacturing sector. The MPI expanded for the 1st time in 5 months by 0.5% YoY from -3.2% YoY in March due partially to the Japan tsunami last year and the recovery of the auto, petroleum, beer and electronics sectors to the pre-flood level. Figures were inline with the increasing capacity utilisation rate from 63.8% to 67.8%. Consumption sector. The PCI rose 3.3% YoY and slowed from 3.7% YoY in March (-0.1% MoM) due to the surge in domestic oil prices that dampened demand with the VAT rise delay on some products. Investment sector. The PII expanded 12.5% YoY, up 9.0% YoY from March, led by investment in commercial cars and the import of capital goods for the electronics, electrical appliance, auto, metal and machinery sectors. On a monthly basis, the Index increased by 3.9% MoM from the acceleration of new investment after the flood. Import-export sectors. April exports dropped 3.5% YoY, but improved from -6.8% YoY in March on a low base last year with fuel from the improvement of the manufacturing industry, especially auto and computer exports even with a drop in agricultural exports. April imports expanded 9% YoY from +21.5% YoY in March from a decline in consumption products. Capital goods imports still expanded. Tourism sector: Foreign tourist arrivals rose 8.2% YoY to 1.7mn from +12.2% YoY in March, led by Chinese, Swedish and Russian tourists, despite it being the low business season compounded with a tsunami in southern Thailand.
Private sector demand facing higher risk In Jan-April, the overall Thai economy remained at a satisfactory level and we believe this growth momentum will continue into 2Q12. However, investors must be more careful of the high external and internal risks, especially the EU crisis and the Greek political situation, as a recent poll has shown that the Syriza party; the party disagreeing with the current Greek financial restructuring plan and the maintenance of the euro, will likely win the election. The Spanish financial system is also tighter with people starting to withdraw money from Spanish banks, while the government is facing a problem with the capital increase for BANKIA; the 4th largest bank in Spain. Internally, the disagreement on the Reconciliation Act should be closely watched, and the unclear water management plan will likely lower private sector confidence and impact the export recovery in the next phase.
IMPORTANT NOTICE
Maybank Kim Eng Securities (Thailand) may have a business relationship with or may possibly be an issuer of derivative warrants on the securities /companies mentioned in the research report. Therefore, Investors should exercise their own judgment before making any investment decisions.
Economic Data, April 2012
Chaiyachoke Suwisuttangkul
(662) 658 6300
Nathabol Nandavivadhana
(662) 658 6300

1 June 2012 Page 2 of 11
ECONOMICS
Progress on the EU debt crisis will indicate next p hase KELIVE Research estimates the EU debt crisis impact will widen into a larger area, reflected in the increase in Spanish 10 year bond yields to almost 7% with a record high CDS spread at 586.665 points. The Greek political crisis has also become more severe, especially if Greece is forced to leave the euro. Despite a low possibility of this happening, the euro and EU financial stability cannot avoid the impact. The collapse of the Greek government and business sector with high inflation will occur. The widening euro crisis will impact the world economy, especially for the Thai economy, both exports and imports, which highly relate to the EU (4M12 Thai exports to the EU were 13.5% of total exports, while European tourists accounted for 32.6%). The EU crisis will also impact the main Thai trading countries; China and others in Asia (11.9% and 25.7%) and thus will finally drag Thai export and import growth both directly and indirectly. Recently, the BoT has formed a financial committee to closely focus on the EU situation and this reflects the higher concern on the EU crisis. We thus maintain our policy rate target at the year end of 3.0% after higher world risks arise.

1 June 2012 Page 3 of 11
ECONOMICS
Table 1: Thailand GDP Forecast Full Year Full Year 1Q12 2Q12F 3Q12F 4Q12F 2011 2012F
Private consumption expenditure 2.68% 4.00% 3.80% 6.50% 1.28% 4.87%
General government consumption expenditure -1.58% 6.30% 7.50% 8.50% 1.35% 6.56%
Gross fixed capital formation 5.16% 7.80% 8.70% 15.00% 3.25% 9.47%
Exports of goods and services -3.16% 5.66% 6.83% 10.43% 9.48% 5.15%
Imports of goods and services 4.49% 7.21% 7.15% 9.99% 13.61% 6.84%
Gross Domestic Product 0.26% 4.54% 5.91% 9.40% 0.05% 5.20%
Source: NESDB and KELIVE estimates.
Chart 1: Private Consumption Index Chart 2: Private Investment Index
90
100
110
120
130
140
150
Jan-
06
May
-06
Sep
-06
Jan-
07
May
-07
Sep
-07
Jan-
08
May
-08
Sep
-08
Jan-
09
May
-09
Sep
-09
Jan-
10
May
-10
Sep
-10
Jan-
11
May
-11
Sep
-11
Jan-
12
-8.0%
-6.0%
-4.0%
-2.0%
0.0%
2.0%
4.0%
6.0%
8.0%
10.0%
12.0%
Private Consumption Index %yoy (RHS)
PCI %yoy
+3.3%
120
140
160
180
200
220
240
260
Jan-
06
May
-06
Sep
-06
Jan-
07
May
-07
Sep
-07
Jan-
08
May
-08
Sep
-08
Jan-
09
May
-09
Sep
-09
Jan-
10
May
-10
Sep
-10
Jan-
11
May
-11
Sep
-11
Jan-
12
-20%
-15%
-10%
-5%
0%
5%
10%
15%
20%
25%
30%
Private Investment Index %yoy (RHS)
PII %yoy
+12.5%
Source: BoT Source: BoT
Table 2: Private Consumption Index by component Table 3: Private Investment Index by component
Source: BoT Source: BoT
1 June 2012 Page 4 of 11
ECONOMICS
Chart 3: Leading & Coincident Economic Index Chart 4: Business Sentiment Index
80
90
100
110
120
130
140
Jan-
00
Jul-0
0Ja
n-01
Jul-0
1Ja
n-02
Jul-0
2Ja
n-03
Jul-0
3
Jan-
04Ju
l-04
Jan-
05Ju
l-05
Jan-
06Ju
l-06
Jan-
07
Jul-0
7Ja
n-08
Jul-0
8Ja
n-09
Jul-0
9Ja
n-10
Jul-1
0
Jan-
11Ju
l-11
Jan-
12
Leading Economic Index Coincident Economic Index
132.45
123.60
30.0
35.0
40.0
45.0
50.0
55.0
60.0
65.0
Jan-
00Ju
l-00
Jan-
01Ju
l-01
Jan-
02Ju
l-02
Jan-
03Ju
l-03
Jan-
04Ju
l-04
Jan-
05Ju
l-05
Jan-
06Ju
l-06
Jan-
07Ju
l-07
Jan-
08Ju
l-08
Jan-
09Ju
l-09
Jan-
10Ju
l-10
Jan-
11Ju
l-11
Jan-
12
Business Sentiment Index Business Sentiment 3-month Forw ard Index
47.7
56.6
Source: BoT Source: BoT
Chart 5: Manufacturing & capacity utilization Chart 6: Manufacturing Production Index (% yoy)
-60%
-50%
-40%
-30%
-20%
-10%
0%
10%
20%
30%
40%
Jul-0
9
Sep
-09
Nov
-09
Jan-
10
Mar
-10
May
-10
Jul-1
0
Sep
-10
Nov
-10
Jan-
11
Mar
-11
May
-11
Jul-1
1
Sep
-11
Nov
-11
Jan-
12
Mar
-12
30%
35%
40%
45%
50%
55%
60%
65%
70%
75%
Manufacturing Production Index (% yoy) [LHS] Capacity Utilization [RHS]
62.2%
0.5%
80
100
120
140
160
180
200
220
Nov
-06
Mar
-07
Jul-0
7
Nov
-07
Mar
-08
Jul-0
8
Nov
-08
Mar
-09
Jul-0
9
Nov
-09
Mar
-10
Jul-1
0
Nov
-10
Mar
-11
Jul-1
1
Nov
-11
Mar
-12
-60.0%
-50.0%
-40.0%
-30.0%
-20.0%
-10.0%
0.0%
10.0%
20.0%
30.0%
40.0%
Manufacturing Production Index (nsa) %yoy (RSH)
MPI %yoy
0.5%
Source: BoT Source: BoT
Table 4: Manufacturing Production by component Table 5: Capacity Utilisation by component
Source: BoT Source: BoT
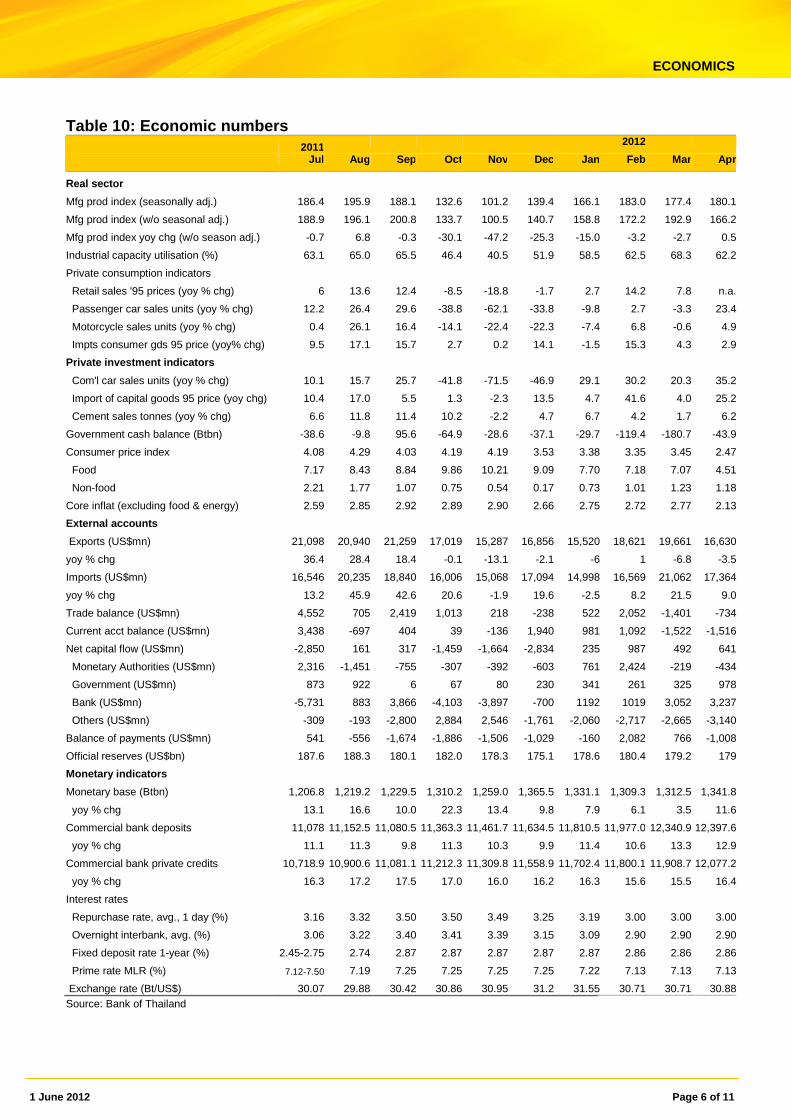
Chart 7: Exports & imports Chart 8: Trade Balance and Current Account Balance
-60%
-40%
-20%
0%
20%
40%
60%
80%
100%
Jan-
07
Apr
-07
Jul-0
7
Oct
-07
Jan-
08
Apr
-08
Jul-0
8
Oct
-08
Jan-
09
Apr
-09
Jul-0
9
Oct
-09
Jan-
10
Apr
-10
Jul-1
0
Oct
-10
Jan-
11
Apr
-11
Jul-1
1
Oct
-11
Jan-
12
Apr
-12
%
28
29
30
31
32
33
34
35
36
37Baht/USD
Export Grow th [LHS] Import Grow th [LHS] THB/USD [RHS]
30.71-6.9%
+9.0%
-2.0
-1.0
0.0
1.0
2.0
3.0
4.0
5.0
6.0
Jan
-07
Ap
r-0
7
Jul-
07
Oct
-07
Jan
-08
Ap
r-0
8
Jul-
08
Oct
-08
Jan
-09
Ap
r-0
9
Jul-
09
Oct
-09
Jan
-10
Ap
r-1
0
Jul-
10
Oct
-10
Jan
-11
Ap
r-1
1
Jul-
11
Oct
-11
Jan
-12
Ap
r-1
2
Trade Balance Current Account
USD bn
-1.52
-0.73
Source: BoT Source: BoT
1 June 2012 Page 5 of 11
ECONOMICS
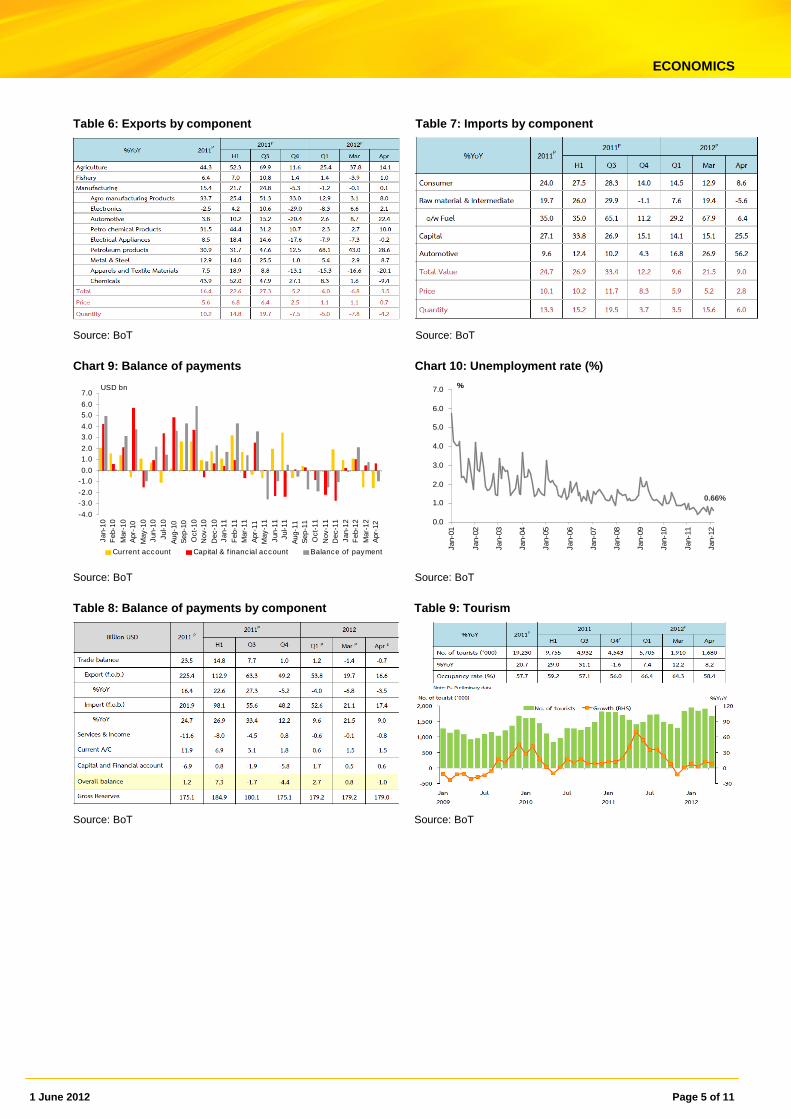
Table 6: Exports by component Table 7: Imports by component
Source: BoT Source: BoT
Chart 9: Balance of payments Chart 10: Unemployment rate (%)
-4.0
-3.0
-2.0
-1.0
0.0
1.0
2.0
3.0
4.0
5.0
6.0
7.0
Jan-
10F
eb-1
0M
ar-1
0A
pr-1
0M
ay-1
0Ju
n-10
Jul-1
0A
ug-1
0S
ep-1
0O
ct-1
0N
ov-1
0D
ec-1
0Ja
n-11
Feb
-11
Mar
-11
Apr
-11
May
-11
Jun-
11Ju
l-11
Aug
-11
Sep
-11
Oct
-11
Nov
-11
Dec
-11
Jan-
12F
eb-1
2M
ar-1
2A
pr-1
2
Current account Capital & f inancial account Balance of payment
USD bn
Source: BoT Source: BoT
Table 8: Balance of payments by component Table 9: Tourism
Source: BoT Source: BoT
0.0
1.0
2.0
3.0
4.0
5.0
6.0
7.0
Jan-
01
Jan-
02
Jan-
03
Jan-
04
Jan-
05
Jan-
06
Jan-
07
Jan-
08
Jan-
09
Jan-
10
Jan-
11
Jan-
12
%
0.66%
1 June 2012 Page 6 of 11
ECONOMICS
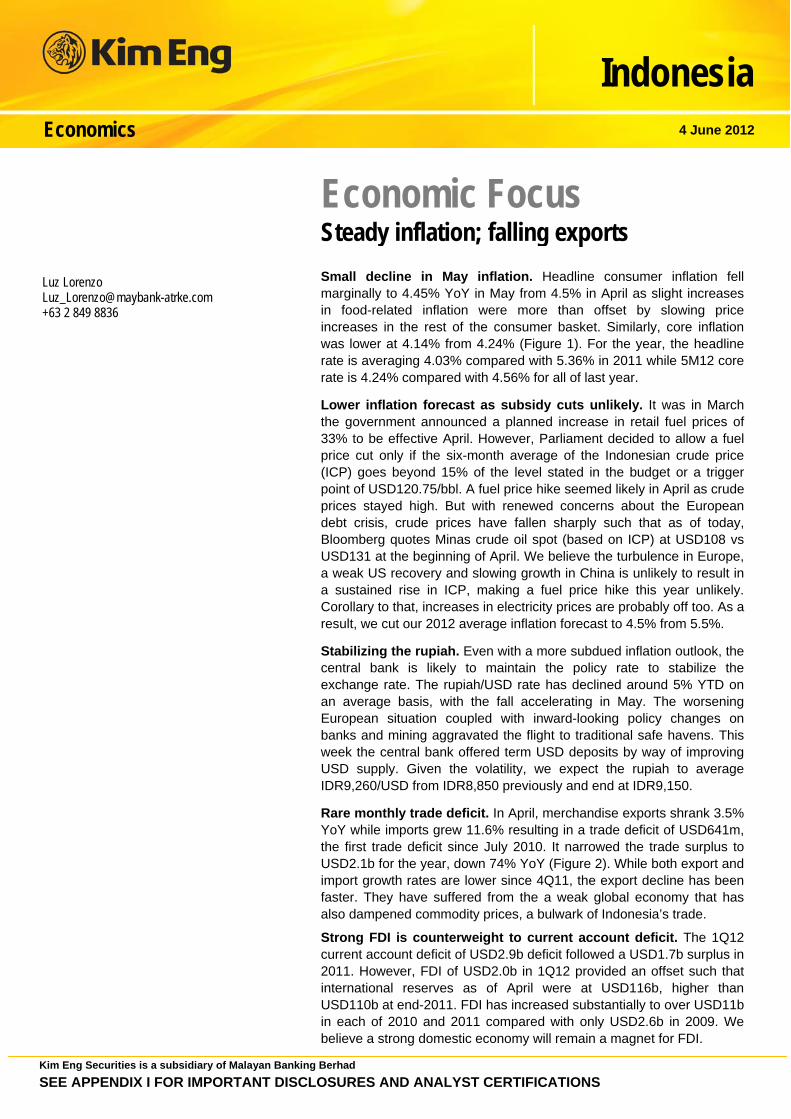
Table 10: Economic numbers 2011 2012
Jul Aug Sep Oct Nov Dec Jan Feb Mar Apr
Real sector
Mfg prod index (seasonally adj.) 186.4 195.9 188.1 132.6 101.2 139.4 166.1 183.0 177.4 180.1
Mfg prod index (w/o seasonal adj.) 188.9 196.1 200.8 133.7 100.5 140.7 158.8 172.2 192.9 166.2
Mfg prod index yoy chg (w/o season adj.) -0.7 6.8 -0.3 -30.1 -47.2 -25.3 -15.0 -3.2 -2.7 0.5
Industrial capacity utilisation (%) 63.1 65.0 65.5 46.4 40.5 51.9 58.5 62.5 68.3 62.2
Private consumption indicators
Retail sales '95 prices (yoy % chg) 6 13.6 12.4 -8.5 -18.8 -1.7 2.7 14.2 7.8 n.a.
Passenger car sales units (yoy % chg) 12.2 26.4 29.6 -38.8 -62.1 -33.8 -9.8 2.7 -3.3 23.4
Motorcycle sales units (yoy % chg) 0.4 26.1 16.4 -14.1 -22.4 -22.3 -7.4 6.8 -0.6 4.9
Impts consumer gds 95 price (yoy% chg) 9.5 17.1 15.7 2.7 0.2 14.1 -1.5 15.3 4.3 2.9
Private investment indicators
Com'l car sales units (yoy % chg) 10.1 15.7 25.7 -41.8 -71.5 -46.9 29.1 30.2 20.3 35.2
Import of capital goods 95 price (yoy chg) 10.4 17.0 5.5 1.3 -2.3 13.5 4.7 41.6 4.0 25.2
Cement sales tonnes (yoy % chg) 6.6 11.8 11.4 10.2 -2.2 4.7 6.7 4.2 1.7 6.2
Government cash balance (Btbn) -38.6 -9.8 95.6 -64.9 -28.6 -37.1 -29.7 -119.4 -180.7 -43.9
Consumer price index 4.08 4.29 4.03 4.19 4.19 3.53 3.38 3.35 3.45 2.47
Food 7.17 8.43 8.84 9.86 10.21 9.09 7.70 7.18 7.07 4.51
Non-food 2.21 1.77 1.07 0.75 0.54 0.17 0.73 1.01 1.23 1.18
Core inflat (excluding food & energy) 2.59 2.85 2.92 2.89 2.90 2.66 2.75 2.72 2.77 2.13
External accounts
Exports (US$mn) 21,098 20,940 21,259 17,019 15,287 16,856 15,520 18,621 19,661 16,630
yoy % chg 36.4 28.4 18.4 -0.1 -13.1 -2.1 -6 1 -6.8 -3.5
Imports (US$mn) 16,546 20,235 18,840 16,006 15,068 17,094 14,998 16,569 21,062 17,364
yoy % chg 13.2 45.9 42.6 20.6 -1.9 19.6 -2.5 8.2 21.5 9.0
Trade balance (US$mn) 4,552 705 2,419 1,013 218 -238 522 2,052 -1,401 -734
Current acct balance (US$mn) 3,438 -697 404 39 -136 1,940 981 1,092 -1,522 -1,516
Net capital flow (US$mn) -2,850 161 317 -1,459 -1,664 -2,834 235 987 492 641
Monetary Authorities (US$mn) 2,316 -1,451 -755 -307 -392 -603 761 2,424 -219 -434
Government (US$mn) 873 922 6 67 80 230 341 261 325 978
Bank (US$mn) -5,731 883 3,866 -4,103 -3,897 -700 1192 1019 3,052 3,237
Others (US$mn) -309 -193 -2,800 2,884 2,546 -1,761 -2,060 -2,717 -2,665 -3,140
Balance of payments (US$mn) 541 -556 -1,674 -1,886 -1,506 -1,029 -160 2,082 766 -1,008
Official reserves (US$bn) 187.6 188.3 180.1 182.0 178.3 175.1 178.6 180.4 179.2 179
Monetary indicators
Monetary base (Btbn) 1,206.8 1,219.2 1,229.5 1,310.2 1,259.0 1,365.5 1,331.1 1,309.3 1,312.5 1,341.8
yoy % chg 13.1 16.6 10.0 22.3 13.4 9.8 7.9 6.1 3.5 11.6
Commercial bank deposits 11,078 11,152.5 11,080.5 11,363.3 11,461.7 11,634.5 11,810.5 11,977.0 12,340.9 12,397.6
yoy % chg 11.1 11.3 9.8 11.3 10.3 9.9 11.4 10.6 13.3 12.9
Commercial bank private credits 10,718.9 10,900.6 11,081.1 11,212.3 11,309.8 11,558.9 11,702.4 11,800.1 11,908.7 12,077.2
yoy % chg 16.3 17.2 17.5 17.0 16.0 16.2 16.3 15.6 15.5 16.4
Interest rates
Repurchase rate, avg., 1 day (%) 3.16 3.32 3.50 3.50 3.49 3.25 3.19 3.00 3.00 3.00
Overnight interbank, avg. (%) 3.06 3.22 3.40 3.41 3.39 3.15 3.09 2.90 2.90 2.90
Fixed deposit rate 1-year (%) 2.45-2.75 2.74 2.87 2.87 2.87 2.87 2.87 2.86 2.86 2.86
Prime rate MLR (%) 7.12-7.50 7.19 7.25 7.25 7.25 7.25 7.22 7.13 7.13 7.13
Exchange rate (Bt/US$) 30.07 29.88 30.42 30.86 30.95 31.2 31.55 30.71 30.71 30.88Source: Bank of Thailand
Kim Eng Securities is a subsidiary of Malayan Banking Berhad SEE APPENDIX I FOR IMPORTANT DISCLOSURES AND ANALYST CERTIFICATIONS
Indonesia Economics 4 June 2012
Economic Focus Steady inflation; falling exports
Small decline in May inflation. Headline consumer inflation fell marginally to 4.45% YoY in May from 4.5% in April as slight increases in food-related inflation were more than offset by slowing price increases in the rest of the consumer basket. Similarly, core inflation was lower at 4.14% from 4.24% (Figure 1). For the year, the headline rate is averaging 4.03% compared with 5.36% in 2011 while 5M12 core rate is 4.24% compared with 4.56% for all of last year.
Lower inflation forecast as subsidy cuts unlikely. It was in March the government announced a planned increase in retail fuel prices of 33% to be effective April. However, Parliament decided to allow a fuel price cut only if the six-month average of the Indonesian crude price (ICP) goes beyond 15% of the level stated in the budget or a trigger point of USD120.75/bbl. A fuel price hike seemed likely in April as crude prices stayed high. But with renewed concerns about the European debt crisis, crude prices have fallen sharply such that as of today, Bloomberg quotes Minas crude oil spot (based on ICP) at USD108 vs USD131 at the beginning of April. We believe the turbulence in Europe, a weak US recovery and slowing growth in China is unlikely to result in a sustained rise in ICP, making a fuel price hike this year unlikely. Corollary to that, increases in electricity prices are probably off too. As a result, we cut our 2012 average inflation forecast to 4.5% from 5.5%.
Stabilizing the rupiah. Even with a more subdued inflation outlook, the central bank is likely to maintain the policy rate to stabilize the exchange rate. The rupiah/USD rate has declined around 5% YTD on an average basis, with the fall accelerating in May. The worsening European situation coupled with inward-looking policy changes on banks and mining aggravated the flight to traditional safe havens. This week the central bank offered term USD deposits by way of improving USD supply. Given the volatility, we expect the rupiah to average IDR9,260/USD from IDR8,850 previously and end at IDR9,150.
Rare monthly trade deficit. In April, merchandise exports shrank 3.5% YoY while imports grew 11.6% resulting in a trade deficit of USD641m, the first trade deficit since July 2010. It narrowed the trade surplus to USD2.1b for the year, down 74% YoY (Figure 2). While both export and import growth rates are lower since 4Q11, the export decline has been faster. They have suffered from the a weak global economy that has also dampened commodity prices, a bulwark of Indonesia’s trade.
Strong FDI is counterweight to current account deficit. The 1Q12 current account deficit of USD2.9b deficit followed a USD1.7b surplus in 2011. However, FDI of USD2.0b in 1Q12 provided an offset such that international reserves as of April were at USD116b, higher than USD110b at end-2011. FDI has increased substantially to over USD11b in each of 2010 and 2011 compared with only USD2.6b in 2009. We believe a strong domestic economy will remain a magnet for FDI.
Luz Lorenzo [email protected] +63 2 849 8836

4 June 2012 Page 2 of 5
Indonesia – Economic Focus
Figure 1. Headline and core inflation marginally lower in May
Weight Change %Y/Y (2007=100) NSA
3Q11 4Q11 2011 1Q12 Mar-12 Apr-12 May-12 5M12 Headline inflation, %Y/Y 100.00 4.67 4.12 5.36 3.72 3.97 4.50 4.45 4.03 Foodstuff 19.57 5.44 4.75 8.55 3.57 4.56 6.72 6.87 4.83
Processed food, beverages, cigarettes & tobacco 16.55 4.98 4.51 5.10 4.64 4.69 5.13 5.32 4.87
Housing, water, electricity, gas & fuel 25.40 4.02 3.43 4.18 3.41 3.31 3.33 3.27 3.37 Clothing 7.09 10.28 8.03 8.37 8.17 8.47 7.17 6.26 7.58 Medical care 4.43 4.15 4.21 3.77 3.84 3.50 3.34 3.02 3.57 Education, recreation & sports 7.81 4.86 5.17 4.43 4.80 4.72 4.71 4.70 4.76 Transport, communication & financial services 19.12 1.85 1.95 2.42 1.79 1.77 1.92 1.85 1.83 Core inflation 4.88 4.40 4.56 4.28 4.25 4.24 4.14 4.24
Source: CEIC and PT Kim Eng Securities estimates
Figure 2. Rare monthly trade deficit in April as exports contract 2Q11 3Q11 4Q11 2011 1Q12 Feb‐12 Mar‐12 Apr‐12 4M12
In US$b
Trade balance 8.4 7.2 3.9 26.1 2.8 0.8 0.9 ‐0.6 2.1
Non‐oil and gas 8.0 6.4 4.2 25.3 3.3 1.0 1.4 0.0 3.3
Oil and gas 0.4 0.7 ‐0.3 0.8 ‐0.5 ‐0.1 ‐0.5 ‐0.6 ‐1.2
Exports 53.2 53.6 51.3 203.5 48.5 15.7 17.3 16.0 64.5
Non‐oil and gas 41.9 41.8 41.2 162.0 38.5 12.3 13.8 12.6 51.2
Oil and gas 11.3 11.8 10.1 41.5 10.0 3.4 3.5 3.4 13.3
Imports 44.8 46.5 47.4 177.4 45.7 14.9 16.3 16.6 62.4
Non‐oil and gas 33.9 35.4 37.0 136.7 35.2 11.4 12.3 12.6 47.9
Oil and gas 10.8 11.1 10.4 40.7 10.5 3.5 4.0 4.0 14.5
Change, % Y/Y
Trade balance 108.7 81.5 ‐55.0 17.6 ‐58.0 ‐68.9 ‐50.8 ‐138.5 ‐74.2
Non‐oil and gas 79.3 49.2 ‐45.4 17.5 ‐50.6 ‐62.8 ‐14.6 ‐100.9 ‐62.2
Oil and gas ‐207.8 ‐307.2 ‐132.4 23.7 415.5 ‐302.4 ‐382.8 91.4 169.9
Exports 43.8 39.6 9.4 28.9 6.9 8.9 5.4 ‐3.5 4.1
Non‐oil and gas 37.3 28.8 8.6 24.8 3.9 4.6 3.5 ‐2.4 2.3
Oil and gas 74.4 98.5 12.9 47.9 20.4 28.4 13.9 ‐7.3 12.0
Imports 35.8 34.8 23.9 30.8 17.9 26.5 12.7 11.6 16.2
Non‐oil and gas 30.1 25.7 22.2 26.3 15.9 23.6 6.1 15.6 15.8
Oil and gas 57.4 75.5 30.1 48.5 25.3 37.3 39.3 0.8 17.5
Source: CEIC and PT Kim Eng Securities estimates
4 June 2012
Regional Daily
RESEARCH OFFICES REGIONAL
P K BASU Regional Head, Research & Economics (65) 6432 1821 [email protected]
WONG Chew Hann, CA Regional Head of Institutional Research (603) 2297 8686 [email protected]
THAM Mun Hon Regional Strategist (852) 2268 0630 [email protected]
ONG Seng Yeow Regional Products & Planning (852) 2268 0644 [email protected]
ECONOMICS Suhaimi ILIAS Chief Economist Singapore | Malaysia (603) 2297 8682 [email protected]
Luz LORENZO Economist Philippines | Indonesia (63) 2 849 8836 [email protected]
Chaiyachoke SUWISUTTANGKUL Economist Thailand (662) 658 6300 [email protected]
MALAYSIA WONG Chew Hann, CA Head of Research (603) 2297 8686 [email protected] Strategy Construction & Infrastructure Desmond CH’NG, ACA (603) 2297 8680 [email protected] Banking - Regional LIAW Thong Jung (603) 2297 8688 [email protected] Oil & Gas Automotive Shipping ONG Chee Ting (603) 2297 8678 [email protected] Plantations Mohshin AZIZ (603) 2297 8692 [email protected] Aviation Petrochem Power YIN Shao Yang, CPA (603) 2297 8916 [email protected] Gaming – Regional Media Power WONG Wei Sum, CFA (603) 2297 8679 [email protected] Property & REITs LEE Yen Ling (603) 2297 8691 [email protected] Building Materials Manufacturing Technology
LEE Cheng Hooi Head of Retail [email protected] Technicals
HONG KONG / CHINA Edward FUNG Head of Research (852) 2268 0632 [email protected] Construction Ivan CHEUNG (852) 2268 0634 [email protected] Property Industrial Ivan LI (852) 2268 0641 [email protected] Banking & Finance Jacqueline KO (852) 2268 0633 [email protected] Consumer Staples Andy POON (852) 2268 0645 [email protected] Telecom & equipment Samantha KWONG (852) 2268 0640 [email protected] Consumer Discretionaries Alex YEUNG (852) 2268 0636 [email protected] Industrial Catherine CHAN (852) 2268 0631 [email protected] Cement Anita HWANG, CFA | Jacky WONG, CFA [email protected] | [email protected] (852) 2268 0142 | (852) 2268 0107 Special Situations Quants
INDIA Jigar SHAH Head of Research (91) 22 6623 2601 [email protected] Oil & Gas Automobile Cement Anubhav GUPTA (91) 22 6623 2605 [email protected] Metal & Mining Capital goods Property Haripreet BATRA (91) 226623 2606 [email protected] Software Media Ganesh RAM (91) 226623 2607 [email protected] Telecom Contractor Darpin SHAH (91) 226623 2610 [email protected] Banking & Financial Services Gagan KWATRA (91 )226623 2612 [email protected] Small Cap
SINGAPORE Stephanie WONG Head of Research (65) 6432 1451 [email protected] Strategy Small & Mid Caps Gregory YAP (65) 6432 1450 [email protected] Technology & Manufacturing Telcos - Regional Wilson LIEW (65) 6432 1454 [email protected] Hotel & Resort Property & Construction James KOH (65) 6432 1431 [email protected] Logistics Resources Consumer Small & Mid Caps YEAK Chee Keong, CFA (65) 6433 5730 [email protected] Healthcare Offshore & Marine Alison FOK (65) 6433 5745 [email protected] Services S-chips Bernard CHIN (65) 6433 5726 [email protected] Transport (Land, Shipping & Aviation) ONG Kian Lin (65) 6432 1470 [email protected] REITs / Property Wei Bin (65) 6432 1455 [email protected] S-chips Small & Mid Caps
INDONESIA Katarina SETIAWAN Head of Research (62) 21 2557 1125 [email protected] Consumer Strategy Telcos Lucky ARIESANDI, CFA (62) 21 2557 1127 [email protected] Base metals Coal Oil & Gas Rahmi MARINA (62) 21 2557 1128 [email protected] Banking Multifinance Pandu ANUGRAH (62) 21 2557 1137 [email protected] Auto Heavy equipment Plantation Toll road Adi N. WICAKSONO (62) 21 2557 1130 [email protected] Generalist Anthony YUNUS (62) 21 2557 1134 [email protected] Cement Infrastructure Property Arwani PRANADJAYA (62) 21 2557 1129 [email protected] Technicals
PHILIPPINES Luz LORENZO Head of Research +63 2 849 8836 [email protected] Strategy Laura DY-LIACCO (63) 2 849 8840 [email protected] Utilities Conglomerates Telcos Lovell SARREAL (63) 2 849 8841 [email protected] Consumer Media Cement Mining Kenneth NERECINA (63) 2 849 8839 [email protected] Conglomerates Property Ports/ Logistics Katherine TAN (63) 2 849 8843 [email protected] Banks Construction Ramon ADVIENTO (63) 2 849 8842 [email protected] Mining
THAILAND Mayuree CHOWVIKRAN Head of Research (66) 2658 6300 ext 1440 [email protected] Strategy
Maria BRENDA SANCHEZ LAPIZ Co-Head of Research Dir (66) 2257 0250 | (66) 2658 6300 ext 1399 [email protected]
Andrew STOTZ Strategist (66) 2658 6300 ext 1399 [email protected]
Suttatip PEERASUB (66) 2658 6300 ext 1430 [email protected] Media Commerce Sutthichai KUMWORACHAI (66) 2658 6300 ext 1400 [email protected] Energy Petrochem Termporn TANTIVIVAT (66) 2658 6300 ext 1520 [email protected] Property Woraphon WIROONSRI (66) 2658 6300 ext 1560 [email protected] Banking & Finance Jaroonpan WATTANAWONG (66) 2658 6300 ext 1404 [email protected] Transportation Small cap. Suchot THIRAWANNARAT (66) 2658 6300 ext 1550 [email protected] Automotive Construction Materials Soft commodity
VIETNAM Michael KOKALARI, CFA Head of Research +84 838 38 66 47 [email protected] Strategy Nguyen Thi Ngan Tuyen +84 844 55 58 88 x 8081 [email protected] Food and Beverage Oil and Gas Ngo Bich Van +84 844 55 58 88 x 8084 [email protected] Banking Nguyen Quang Duy +84 844 55 58 88 x 8082 [email protected] Rubber Dang Thi Kim Thoa +84 844 55 58 88 x 8083 [email protected] Consumer Nguyen Trung Hoa +84 844 55 58 88 x 8088 [email protected] Steel Sugar Macro

4 June 2012
Regional Daily
APPENDIX I: TERMS FOR PROVISION OF REPORT, DISCLAIMERS AND DISCLOSURES DISCLAIMERS This research report is prepared for general circulation and for information purposes only and under no circumstances should it be considered or intended as an offer to sell or a solicitation of an offer to buy the securities referred to herein. Investors should note that values of such securities, if any, may fluctuate and that each security’s price or value may rise or fall. Opinions or recommendations contained herein are in form of technical ratings and fundamental ratings. Technical ratings may differ from fundamental ratings as technical valuations apply different methodologies and are purely based on price and volume-related information extracted from the relevant jurisdiction’s stock exchange in the equity analysis. Accordingly, investors’ returns may be less than the original sum invested. Past performance is not necessarily a guide to future performance. This report is not intended to provide personal investment advice and does not take into account the specific investment objectives, the financial situation and the particular needs of persons who may receive or read this report. Investors should therefore seek financial, legal and other advice regarding the appropriateness of investing in any securities or the investment strategies discussed or recommended in this report. The information contained herein has been obtained from sources believed to be reliable but such sources have not been independently verified by Maybank Investment Bank Berhad, its subsidiary and affiliates (collectively, “Maybank Kim Eng”) and consequently no representation is made as to the accuracy or completeness of this report by Maybank Kim Eng and it should not be relied upon as such. Accordingly, Maybank Kim Eng and its officers, directors, associates, connected parties and/or employees (collectively, “Representatives”) shall not be liable for any direct, indirect or consequential losses or damages that may arise from the use or reliance of this report. Any information, opinions or recommendations contained herein are subject to change at any time, without prior notice. This report may contain forward looking statements which are often but not always identified by the use of words such as “anticipate”, “believe”, “estimate”, “intend”, “plan”, “expect”, “forecast”, “predict” and “project” and statements that an event or result “may”, “will”, “can”, “should”, “could” or “might” occur or be achieved and other similar expressions. Such forward looking statements are based on assumptions made and information currently available to us and are subject to certain risks and uncertainties that could cause the actual results to differ materially from those expressed in any forward looking statements. Readers are cautioned not to place undue relevance on these forward-looking statements. Maybank Kim Eng expressly disclaims any obligation to update or revise any such forward looking statements to reflect new information, events or circumstances after the date of this publication or to reflect the occurrence of unanticipated events. Maybank Kim Eng and its officers, directors and employees, including persons involved in the preparation or issuance of this report, may, to the extent permitted by law, from time to time participate or invest in financing transactions with the issuer(s) of the securities mentioned in this report, perform services for or solicit business from such issuers, and/or have a position or holding, or other material interest, or effect transactions, in such securities or options thereon, or other investments related thereto. In addition, it may make markets in the securities mentioned in the material presented in this report. Maybank Kim Eng may, to the extent permitted by law, act upon or use the information presented herein, or the research or analysis on which they are based, before the material is published. One or more directors, officers and/or employees of Maybank Kim Eng may be a director of the issuers of the securities mentioned in this report. This report is prepared for the use of Maybank Kim Eng’s clients and may not be reproduced, altered in any way, transmitted to, copied or distributed to any other party in whole or in part in any form or manner without the prior express written consent of Maybank Kim Eng and Maybank Kim Eng and its Representatives accepts no liability whatsoever for the actions of third parties in this respect. This report is not directed to or intended for distribution to or use by any person or entity who is a citizen or resident of or located in any locality, state, country or other jurisdiction where such distribution, publication, availability or use would be contrary to law or regulation. This report is for distribution only under such circumstances as may be permitted by applicable law. The securities described herein may not be eligible for sale in all jurisdictions or to certain categories of investors. Without prejudice to the foregoing, the reader is to note that additional disclaimers, warnings or qualifications may apply based on geographical location of the person or entity receiving this report. Malaysia Opinions or recommendations contained herein are in the form of technical ratings and fundamental ratings. Technical ratings may differ from fundamental ratings as technical valuations apply different methodologies and are purely based on price and volume-related information extracted from Bursa Malaysia Securities Berhad in the equity analysis. Singapore This report has been produced as of the date hereof and the information herein may be subject to change. Maybank Kim Eng Research Pte. Ltd. (“Maybank KERPL”) in Singapore has no obligation to update such information for any recipient. Recipients of this report are to contact Maybank KERPL in Singapore in respect of any matters arising from, or in connection with, this report. If the recipient of this report is not an accredited investor, expert investor or institutional investor (as defined under Section 4A of the Singapore Securities and Futures Act), Maybank KERPL shall be legally liable for the contents of this report, with such liability being limited to the extent (if any) as permitted by law. US This research report prepared by Maybank Kim Eng is distributed in the United States (“US”) to Major US Institutional Investors (as defined in Rule 15a-6 under the Securities Exchange Act of 1934, as amended) only by Maybank Kim Eng Securities USA Inc (“Maybank KESUSA”) , a broker-dealer registered in the US (registered under Section 15 of the Securities Exchange Act of 1934, as amended). All responsibility for the distribution of this report by Maybank KESUSA in the US shall be borne by Maybank KESUSA. All resulting transactions by a US person or entity should be effected through a registered broker-dealer in the US. This report is not directed at you if Maybank Kim Eng is prohibited or restricted by any legislation or regulation in any jurisdiction from making it available to you. You should satisfy yourself before reading it that Maybank KESUSA is permitted to provide research material concerning investments to you under relevant legislation and regulations. UK This document is being distributed by Maybank Kim Eng Securities (London) Ltd (“Maybank KESL”), which is authorized and regulated by the Financial Services Authority and is for Informational Purposes only. This document is not intended for distribution to anyone defined as a Retail Client under the Financial Services and Markets Act 2000 within the UK. Any inclusion of a third party link is for the recipients convenience only, and that the firm does not take any responsibility for its comments or accuracy, and that access to such links is at the individuals own risk. Nothing in this report should be considered as constituting legal, accounting or tax advice, and that for accurate guidance recipients should consult with their own independent tax advisers.
4 June 2012
Regional Daily
DISCLOSURES Legal Entities Disclosures Malaysia: This report is issued and distributed in Malaysia by Maybank Investment Bank Berhad (15938-H) which is a Participating Organization of Bursa Malaysia Berhad and a holder of Capital Markets and Services License issued by the Securities Commission in Malaysia. Singapore: This material is issued and distributed in Singapore by Maybank KERPL (Co. Reg No 197201256N) which is regulated by the Monetary Authority of Singapore. Hong Kong: KESHK (Central Entity No AAD284) is regulated by the Hong Kong Monetary Authority and the Securities and Futures Commission. US: Maybank KESUSA is a member of/ and is authorized and regulated by the FINRA – Broker ID 27861. UK: Maybank KESL (Reg No 2377538) is authorized and regulated by the Financial Services Authority. Disclosure of Interest Malaysia: Maybank Kim Eng and its Representatives may from time to time have positions or be materially interested in the securities referred to herein and may further act as market maker or may have assumed an underwriting commitment or deal with such securities and may also perform or seek to perform investment banking services, advisory and other services for or relating to those companies. Singapore: As of 4 June 2012, Maybank KERPL and the covering analyst do not have any interest in any companies recommended in this research report. Hong Kong: KESHK may have financial interests in relation to an issuer or a new listing applicant referred to as defined by the requirements under Paragraph 16.5(a) of the Hong Kong Code of Conduct for Persons Licensed by or Registered with the Securities and Futures Commission. As of 4 June 2012, KESHK and the authoring analyst do not have any interest in any companies recommended in this research report. Maybank Kim Eng may have, within the last three years, served as manager or co-manager of a public offering of securities for, or currently may make a primary market in issues of, any or all of the entities mentioned in this report or may be providing, or have provided within the previous 12 months, significant advice or investment services in relation to the investment concerned or a related investment. US: As of 4 June 2012, Maybank Kim Eng and the covering analyst do not have any interest in any companies recommended in this Market themes report. OTHERS Analyst Certification
The views expressed in this research report accurately reflect the analyst’s personal views about any and all of the subject securities or issuers; and no part of the research analyst’s compensation was, is or will be, directly or indirectly, related to the specific recommendations or views expressed in the report. Research Analyst Policies of KESHK
• Research analysts who are not directly supervised by, and do not report directly to, investment banking or sales and trading personnel.
• Research analysts’ compensation or remuneration should not be linked to any specific investment banking function or to recommendations in research.
• Research analysts or their associates are prohibited from dealing in the securities or any derivatives of any companies the research analysts review/analyze/cover.
• Research analysts or their associates are prohibited from holding any directorship or other position in any company the research analysts’ review/analyze/cover.
Reminder
Structured securities are complex instruments, typically involve a high degree of risk and are intended for sale only to sophisticated investors who are capable of understanding and assuming the risks involved. The market value of any structured security may be affected by changes in economic, financial and political factors (including, but not limited to, spot and forward interest and exchange rates), time to maturity, market conditions and volatility and the credit quality of any issuer or reference issuer. Any investor interested in purchasing a structured product should conduct its own analysis of the product and consult with its own professional advisers as to the risks involved in making such a purchase. No part of this material may be copied, photocopied or duplicated in any form by any means or redistributed without the prior consent of Maybank Kim Eng.
4 June 2012
Regional Daily
Definition of Ratings Kim Eng Research uses the following rating system: BUY Total return is expected to be above 15% in the next 12 months HOLD Total return is expected to be between -15% to +15% in the next 12 months SELL Total return is expected to be below -15% in the next 12 months Applicability of Ratings The respective analyst maintains a coverage universe of stocks, the list of which may be adjusted according to needs. Investment ratings are only applicable to the stocks which form part of the coverage universe. Reports on companies which are not part of the coverage do not carry investment ratings as we do not actively follow developments in these companies. Some common terms abbreviated in this report (where they appear): Adex = Advertising Expenditure FCF = Free Cashflow PE = Price Earnings BV = Book Value FV = Fair Value PEG = PE Ratio To Growth CAGR = Compounded Annual Growth Rate FY = Financial Year PER = PE Ratio Capex = Capital Expenditure FYE = Financial Year End QoQ = Quarter-On-Quarter CY = Calendar Year MoM = Month-On-Month ROA = Return On Asset DCF = Discounted Cashflow NAV = Net Asset Value ROE = Return On Equity DPS = Dividend Per Share
NTA = Net Tangible Asset ROSF = Return On Shareholders’ Funds EBIT = Earnings Before Interest And Tax P = Price WACC = Weighted Average Cost Of Capital EBITDA = EBIT, Depreciation And Amortisation P.A. = Per Annum YoY = Year-On-Year EPS = Earnings Per Share PAT = Profit After Tax YTD = Year-To-Date EV = Enterprise Value PBT = Profit Before Tax Malaysia
Maybank Investment Bank Berhad (A Participating Organisation of Bursa Malaysia Securities Berhad) 33rd Floor, MenaraMaybank, 100 JalanTun Perak, 50050 Kuala Lumpur Tel: (603) 2059 1888; Fax: (603) 2078 4194
Singapore Maybank Kim EngSecurities Pte Ltd Maybank Kim EngResearch Pte Ltd 9 Temasek Boulevard #39-00 Suntec Tower 2 Singapore 038989 Tel: (65) 6336 9090 Fax: (65) 6339 6003
London Maybank Kim Eng Securities (London) Ltd 6/F, 20 St. Dunstan’s Hill London EC3R 8HY, UK Tel: (44) 20 7621 9298 Dealers’ Tel: (44) 20 7626 2828 Fax: (44) 20 7283 6674
New York Maybank Kim Eng Securities USA Inc 777 Third Avenue, 21st Floor New York, NY 10017, U.S.A. Tel: (212) 688 8886 Fax: (212) 688 3500
Stockbroking Business: Level 8, Tower C, DataranMaybank, No.1, JalanMaarof 59000 Kuala Lumpur Tel: (603) 2297 8888 Fax: (603) 2282 5136
Hong Kong Kim Eng Securities (HK) Ltd Level 30, Three Pacific Place, 1 Queen’s Road East, Hong Kong Tel: (852) 2268 0800 Fax: (852) 2877 0104
Indonesia PT Kim Eng Securities Plaza Bapindo Citibank Tower 17th Floor Jl Jend. Sudirman Kav. 54-55 Jakarta 12190, Indonesia
Tel: (62) 21 2557 1188 Fax: (62) 21 2557 1189
India Kim Eng Securities India Pvt Ltd 2nd Floor, The International 16, Maharishi Karve Road, Churchgate Station, Mumbai City - 400 020, India Tel: (91).22.6623.2600 Fax: (91).22.6623.2604
Philippines Maybank ATR Kim Eng Securities Inc. 17/F, Tower One & Exchange Plaza Ayala Triangle, Ayala Avenue Makati City, Philippines 1200 Tel: (63) 2 849 8888 Fax: (63) 2 848 5738
Thailand Maybank Kim Eng Securities (Thailand) Public Company Limited 999/9 The Offices at Central World, 20th - 21st Floor, Rama 1 Road Pathumwan, Bangkok 10330, Thailand Tel: (66) 2 658 6817 (sales) Tel: (66) 2 658 6801 (research)
Vietnam In association with Kim Eng Vietnam Securities Company 1st Floor, 255 Tran Hung Dao St. District 1 Ho Chi Minh City, Vietnam Tel : (84) 838 38 66 36 Fax : (84) 838 38 66 39
Saudi Arabia In association with Anfaal Capital Villa 47, Tujjar Jeddah Prince Mohammed bin Abdulaziz Street P.O. Box 126575 Jeddah 21352 Tel: (966) 2 6068686 Fax: (966) 26068787
South Asia Sales Trading Connie TAN [email protected] Tel: (65) 6333 5775 US Toll Free: 1 866 406 7447
North Asia Sales Trading Eddie LAU [email protected] Tel: (852) 2268 0800 US Toll Free: 1 866 598 2267
www.maybank-ke.com | www.kimengresearch.com