Regent Honeyeater: On the Edge - NSW Environment, Energy ...
39
SAVING OUR SPECIES Regent Honeyeater: On the Edge A Woodland Birds of the Hunter Project Student Workbook environment.nsw.gov.au/sos
Transcript of Regent Honeyeater: On the Edge - NSW Environment, Energy ...

SAVING OUR SPECIES
Regent Honeyeater: On the EdgeA Woodland Birds of the Hunter Project
Student Workbook
environment.nsw.gov.au/sos

© 2020 State of NSW and Department of Planning, Industry and Environment
With the exception of photographs, the State of NSW and Department of Planning, Industry and Environment are pleased to allow this material to be reproduced in whole or in part for educational and non-commercial use, provided the meaning is unchanged and its source, publisher and authorship are acknowledged. Specific permission is required for the reproduction of photographs.
The Department of Planning, Industry and Environment (DPIE) has compiled this report in good faith, exercising all due care and attention. No representation is made about the accuracy, completeness or suitability of the information in this publication for any particular purpose. DPIE shall not be liable for any damage which may occur to any person or organisation taking action or not on the basis of this publication. Readers should seek appropriate advice when applying the information to their specific needs.
All content in this publication is owned by DPIE and is protected by Crown Copyright, unless credited otherwise. It is licensed under the Creative Commons Attribution 4.0 International (CC BY 4.0), subject to the exemptions contained in the licence. The legal code for the licence is available at Creative Commons.
Acknowledgement: Thanks to St Phillip’s Christian College Cessnock and Kurri Kurri High School for their help trialling earlier versions of this workbook and BirdLife Australia for their revisions and images.
DPIE asserts the right to be attributed as author of the original material in the following manner: © State of New South Wales and Department of Planning, Industry and Environment 2020.
Cover photo: Regent honeyeater (Anthochaera phrygia), Michael Todd
Published by: Department of Planning, Industry and Environment 4 Parramatta Square, 12 Darcy St, Parramatta NSW 2150 Phone: +61 2 9995 5000 (switchboard) Phone: 131 555 (environment information and publications requests) Phone: 1300 361 967 (national parks, general environmental enquiries, and publications requests) Fax: +61 2 9995 5999 TTY users: phone 133 677, then ask for 131 555 Speak and listen users: phone 1300 555 727, then ask for 131 555 Email: [email protected] Website: www.environment.nsw.gov.au
Report pollution and environmental incidents Environment Line: 131 555 (NSW only) or [email protected] See also www.environment.nsw.gov.au
ISBN 978 1 922318 26 8 EES 2020/0040 March 2020
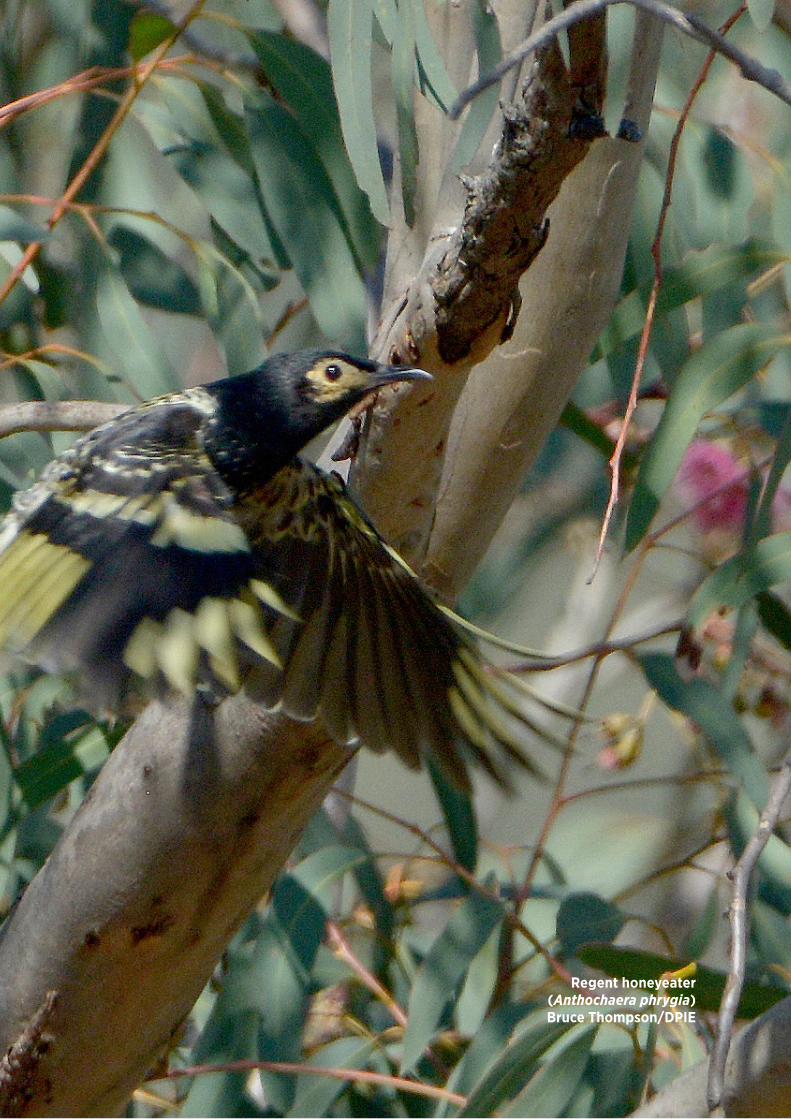
Regent honeyeater (Anthochaera phrygia) Bruce Thompson/DPIE

Contents
1. About this resource 1 1.1 Biology 1 1.2 Earth and environmental science 1 1.3 Investigating science 2 1.4 Science extension 2 1.5 Depth study 2
2. Introduction to threatened species 3 2.1 About threatened species 3 2.2 Regent honeyeater 4
3. Background 5 3.1 Investigation practice 5 3.2 Regent honeyeater habitat 6 3.3 Regent honeyeater threats 8
4. How to navigate geographc information systems 9 4.1 Using the layer list 9 4.2 Changing layers 10 4.3 Using the distance tool 11 4.4 Using the identity tool 12
5. Student tasks 13 5.1 Using the regent honeyeater geographical information system 13 5.2 Capture-mark-recapture 29
6. More information 32
Glossary 34
iii

List of tablesTable 1 Investigation practice 5
Table 2 Geographic information system task worksheet 16
Table 3 Study area specific environmental factors 26
Table 4 Results for each capture-mark-recapture exercise 31
List of figuresFigure 1 Some of the regent honeyeater’s favourite native trees and mistletoe 7
Figure 2 Regent honeyeater, noisy friarbird, and noisy miner sharing a water dish during heatwave conditions in New South Wales in early January 2020 8
Figure 3 Screenshot of the opening page of the Regent Honeyeater: On the Edge viewer 9
Figure 4 Screenshot of the Regent Honeyeater: On the Edge viewer showing state forest and national park areas 10
Figure 5 Screenshot of the Regent Honeyeater: On the Edge viewer showing the distance tool in use 11
Figure 6 Screenshot of the Regent Honeyeater: On the Edge viewer showing the ‘identify’ tool being used to identify the Branxton study area 12
Figure 7 Screenshot of the Regent Honeyeater: On the Edge viewer showing the seven study areas on the map 13
Figure 8 Screenshot of the Regent Honeyeater: On the Edge viewer with the elevation layer on 14
Figure 9 Screenshot of the Regent Honeyeater: On the Edge viewer with the habitat patch size layer on 15
Figure 10 Diagram of (a) classroom (quadrat) and (b) quadrat with transect line 20
Figure 11 Screenshot showing that site C has poor, moderate, and good water availability in different parts of the site 22
Figure 12 Screenshot showing Site G has medium connectivity 23
Figure 13 Screenshot showing that Site B has medium-high and high ranking preferred woodland habitat 24
Figure 14 Screenshot showing that Site F has areas with low and high amounts of mistletoe 25
Figure 15 Example graph included in grant application 27
Figure 16 Images of regent honeyeater to use to make capture-tag-capture cards 33
iv

1. About this resource
This workbook is a resource to support senior students in learning about how conservation agencies monitor and manage threatened species. By looking at the biodiversity of the Hunter Region, using the regent honeyeater as a case study, combined with geographic information system (GIS) mapping, students will learn how to interpret visual data and examine ecological issues relevant to the protection and management of ecosystems.
The glossary at the back of this workbook lists specific terms used with explanations. Bolded text throughout the workbook indicates a term is listed in the glossary.
Throughout this workbook you will find icons that aim to draw your attention to specific information. These include:
Indicates where to write your answers.
Indicates that you need to record data on the GIS task worksheet.
Indicates instructions for using the GIS viewer.
Please let us know about any issues or challenges you had using this workbook resource. We welcome your feedback. If you have any questions or suggestions, please contact us via email: [email protected]
This resource is linked to the following science stage 6 subjects for the year 11 and 12 syllabus for New South Wales schools, which incorporates the Australian Curriculum. Each module and relevant subjects are listed with a brief description about what each subject covers.
1.1 Biology
Module 4: Ecosystem dynamicsFuture ecosystems
BIO11/12-3 Conduct investigations to collect valid and reliable primary and secondary data and information.
BIO11/12-4 Select and process appropriate qualitative and quantitative data and information using a range of appropriate media.
BIO11/12-5 Analyse and evaluate primary and secondary data and information.
BIO11-11 Analyse ecosystem dynamics and the interrelationships within an ecosystem.
1.2 Earth and environmental science
Module 4: Human impactsInquiry question: How do introduced species affect the Australian environment and ecosystems?
EES11/12-2 Design and evaluate investigations in order to obtain primary and secondary data and information.
EES11/12-3 Investigate environments and ecosystems to collect valid and reliable primary and secondary data and information.
1Regent Honeyeater: On the Edge - student workbook

EES11-11 Describe human impacts on the environment in relation to hydrological processes, geological processes and biological changes.
Module 8: Resource management
Inquiry question: How can humans manage natural resources sustainably?
EES11/12-5 Analyse and evaluate primary and secondary data and information.
EES11/12-7 Communicate scientific understanding using suitable language and terminology for a specific audience or purpose.
1.3 Investigating science
Modules 1 and 2: Cause and effect
INS11/12-1 Develop and evaluate questions and hypotheses for scientific investigation.
Module 3: Scientific models
INS11/12-4 Process qualitative and quantitative data and information.
INS11/12-6 Solve scientific problems using primary and secondary data, critical thinking skills and scientific processes.
1.4 Science extension
Module 2: The scientific research proposal
SE-1 Apply the ‘working scientifically’ process in relation to scientific research.
Module 3: The data, evidence and decisions
SE-6 Analyse and report on contemporary issues using publicly available data sets.
1.5 Depth study
Regent honeyeater on the edge
Data analysis using statistics and GIS analysis, secondary sourced investigations and information on the regent honeyeater and its management from the NSW Department of Planning, Industry and Environment – Environment, Energy and Science website as a starting point for a depth study. You’ll find a profile of the regent honeyeater in the Saving our Species database as well as details about how this species is being managed.
Saving our Species2
2. Introduction to threatened species
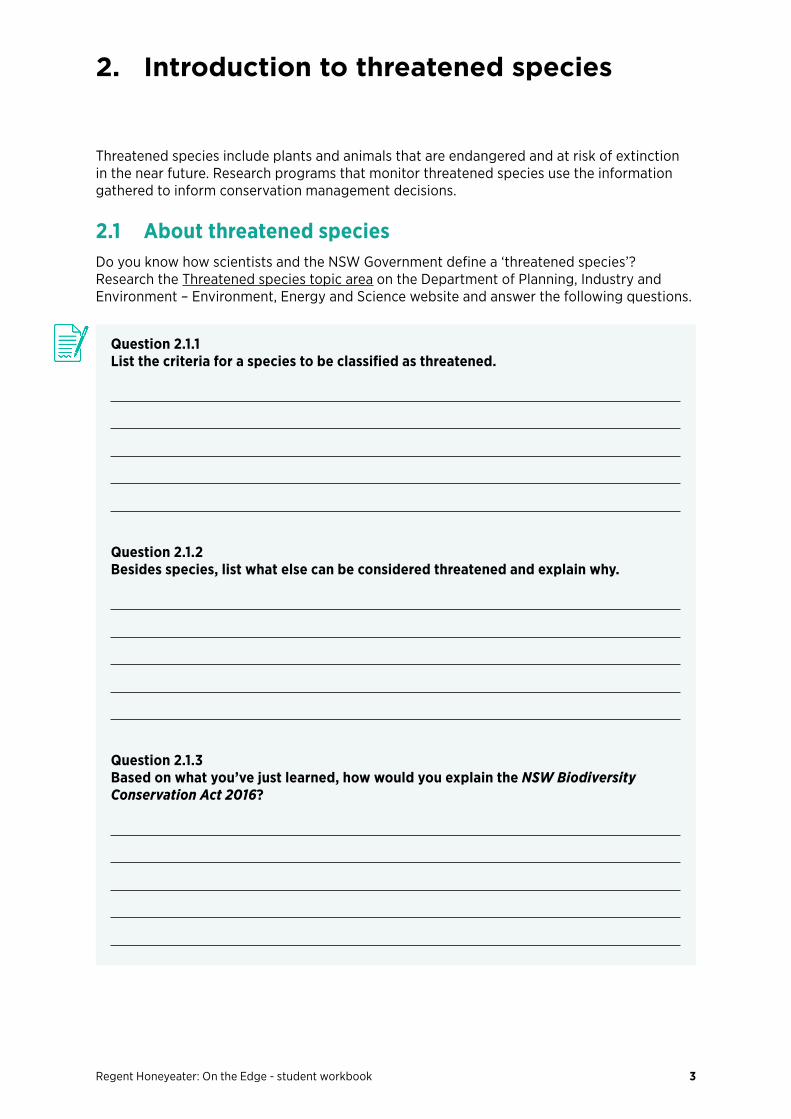
Threatened species include plants and animals that are endangered and at risk of extinction in the near future. Research programs that monitor threatened species use the information gathered to inform conservation management decisions.
2.1 About threatened speciesDo you know how scientists and the NSW Government define a ‘threatened species’? Research the Threatened species topic area on the Department of Planning, Industry and Environment – Environment, Energy and Science website and answer the following questions.
Question 2.1.1 List the criteria for a species to be classified as threatened.
Question 2.1.2 Besides species, list what else can be considered threatened and explain why.
Question 2.1.3 Based on what you’ve just learned, how would you explain the NSW Biodiversity Conservation Act 2016?
3Regent Honeyeater: On the Edge - student workbook

2.2 Regent honeyeaterThe regent honeyeater (Anthochaera phrygia) is a critically endangered Australian species. The distribution of this woodland bird used to extend from Adelaide to the central coast of Queensland but is now limited to north-eastern Victoria and a few valleys in New South Wales.
Historical records from the mid-1800s enthusiastically describe regent honeyeaters occurring in the thousands in many locations. In the early 1900s they were at times the most common species in an area and often seen overhead in flocks of hundreds. Today, between 350 and 400 adults are estimated to survive in the wild.
The Regent Honeyeater: On the Edge project provides quality educational material for teachers and secondary school students. It aims to increase understanding of threatened species conservation and conservation management.
The project involves two student tasks:
1. Identify the most suitable location in the Hunter Valley for protecting the regent honeyeater (secton 5.1).
Geographic information system (GIS) tools are used to complete this task. Integrated digital tools can be used to explore spatial or geographical data. By transforming numbers into visual layers, these tools allow you to handle, process, and analyse data more easily. Visual layers can be laid over each other to see where a range of features intersect.
2. Estimate the size of the regent honeyeater population using an established survey method (section 5.2).
The capture-mark-recapture (CMR) method is used to complete this task. (CMR) is a survey system used to calculate population size.
To complete these tasks, you will need to apply the scientific process. GIS tools are used to answer conservation management questions.
Instructions and worksheets to complete these tasks are included in this booklet along with follow-up questions. The first task (section 5.1) uses a publicly accessible, online GIS.
Saving our Species4

3. Background
Is the Hunter’s most iconic bird about to disappear?
A yellow flash no more! Only high-quality research and a good management plan can save the regent honeyeater.
Saving our Species is a state-wide program that aims to safeguard threatened plants and animals across New South Wales (NSW).
3.1 Investigation practiceRead the Saving our Species regent honeyeater management strategy Help save the regent honeyeater.
Briefly summarise each management site, threats that may exist, and actions that could be taken to counter these threats in Table 1. We have done Site 1 for you.
Table 1 Investigation practice
Site Threats Actions
Site 1: Bundarra–Barraba • historical loss, fragmentation and degradation of habitat
• degradation of habitat by clearing for agricultural and residential development
• suppression of natural regeneration of overstorey tree species and shrub species from overgrazing
• target 500 hectares of high-quality habitat over 20 years for landholder covenants
• community engagement to raise awareness
• liaise with relevant agencies to ensure species’ requirements are considered in future management planning
Site 2:
Site 3:
Site 4:
5Regent Honeyeater: On the Edge - student workbook

Question 3.1.1 What is the most common threat to the regent honeyeater habitat?
Question 3.1.2 List the three most common actions (not including monitoring) across all sites.
3.2 Regent honeyeater habitatThe Lower Hunter Region of NSW is a critically important area for regent honeyeaters. This is because large remnant temperate woodlands exist here, which provide an excellent habitat for the birds to forage as well as numerous breeding sites in spring, autumn and winter. Because the regent honeyeater mainly feeds on nectar from old and large blossoming trees, maintaining these woodlands is a priority. Their favourite tree species include:
• white box (Eucalyptus albens; Figure 1)
• yellow box (Eucalyptus melliodora; Figure 1)
• mugga ironbark (Eucalyptus sideroxylon; Figure 1)
• spotted gum (Corymbia maculata)
• swamp mahogany (Eucalyptus robusta)
• river sheoak (Casaurina cunninghamiana).
Along with these trees, however, regent honeyeaters also feed on long-flowered mistletoe (Dendropthoe vitellina; Figure 1) which occurs in spotted gum-ironbark forests. Box mistletoe (Amyema miquelli; Figure 1) which grows in box-ironbark forests. Needle-leaf mistletoe (Amyema cambagei; Figure 1) which grows on river sheoak.
Saving our Species6

Figure 1 Some of the regent honeyeater’s favourite native trees and mistletoe. Circles contain close-up images of the flowers of each species.
White box (Eucalyptus albens)
Mugga ironbark (Eucalyptus sideroxylon)
Long-flowered mistletoe (Dendropthoe vitellina)
Yellow box (Eucalyptus melliodora)
Needle-leaf mistletoe (Amyema cambagei)
Box mistletoe (Amyema miquelli)
Main photo: Steve Lewer/DPIE Circle: GM Browne/Australian Plants Society NSW
Main photo: Barry Collier/DPIE Circle: John Rawlings
Main photo: Tony Rodd Circle: John Tann
Main photo: Steven Douglas/DPIE Circle: Flagstaffotos
Main photo and circle: Barry Collier/DPIE
Main photo: Ern Perkins/Castlemaine Field Naturalist Club Circle: Kevin Thiele
7Regent Honeyeater: On the Edge - student workbook

3.3 Regent honeyeater threatsThe regent honeyeater is critically endangered as its population has decreased to very low numbers. The number of mature birds that remain is estimated to be between 350 and 400. These estimates come from capture-mark-recapture (CMR) programs in NSW and Victoria, as well as from monitoring of the species coordinated by the Regent Honeyeater Recovery Team and BirdLife Australia.
Many factors have contributed to the regent honeyeater’s critically endangered status:• Fragmentation or ongoing loss of key habitats such as temperate woodlands
• small population size, which means that any disturbance (e.g. disease) can result in no birds being available to replenish the population.
Sometimes conservation efforts can also be threatened by:• planning decisions that result in the continuing loss of important habitats
• increased potential for invasive bird species to establish.
3.3.1 2019–2020 fire impact updateThere have been 169 regent honeyeater nests identified from 2015 to 2019. Using a buffer of 1 kilometre around these nests to encompass their foraging area, we overlayed the most recent fire layer (at 10 January 2020) and found that 80 (47%) of these sites had been impacted by fire.
Note: This only captures the impact of the fires on breeding areas. The effects of fires on preferred woodland habitats of regent honeyeaters were yet to be assessed at the time of publishing.
Figure 2 Regent honeyeater, noisy friarbird, and noisy miner sharing a water dish during heatwave conditions in New South Wales in early January 2020. Photo: Gary McGuigan.
Saving our Species8

4. How to navigate geographic information systems
4.1 Using the layer listThe geographic information system (GIS) viewer for this task is located at: Regent Honeyeater: On the Edge.
4.1.1 Opening page
1. Click on Regent Honeyeater: On the Edge and you will arrive at the opening page (Figure 3).
2. The map you will see on the GIS is orientated with the north at the top.
3. Open the ‘Layer List’ in the top menu.
4. GIS data are displayed in layers. Layers can be switched on and off using the tick boxes in the Layer List.
Figure 3 Screenshot of the opening page of the Regent Honeyeater: On the Edge viewer.
9Regent Honeyeater: On the Edge - student workbook

4.2 Changing layersThe GIS viewer for this task is located at: Regent Honeyeater: On the Edge.
4.2.1 Initial view
This button returns you to the initial view of the study area (Figure 4).
4.2.2 Bookmarks
This button brings up a list of pre-set areas of the map. Click on any of the areas to switch between sections on the map.
4.2.3 Layer details
Plus and minus signs are used to open the GIS layers and allow further detail of a layer to be explored.
Within the layer list, click on the ‘+’ beside Tenure. This will display additional layers.
Tick the Tenure box to see more options. The ‘State Forest Estate’ and ‘National Parks and Wildlife Service (NPWS) Managed Land’ boxes will both be ticked (Figure 4). When the boxes are ticked, state forest and national park areas can be seen on the map.
Figure 4 Screenshot of the Regent Honeyeater: On the Edge viewer showing state forest and national areas.
Saving our Species10

4.3 Using the distance toolThe GIS viewer for this task is located at: Regent Honeyeater: On the Edge.
4.3.1 Zoom in/zoom out
When you select the distance tool, instructions on its use appear at the top of the page.
Make a single click to start measuring and a double click to end. This will also show the distance (Figure 5). Once you’ve finished measuring, click the distance tool icon to turn it off.
To delete a measurement or shape, left click on the line or shape and select ‘delete’ from the information box.
You can also return to the initial view.
Figure 5 Screenshot of the Regent Honeyeater: On the Edge viewer showing the distance tool in use.
11Regent Honeyeater: On the Edge - student workbook
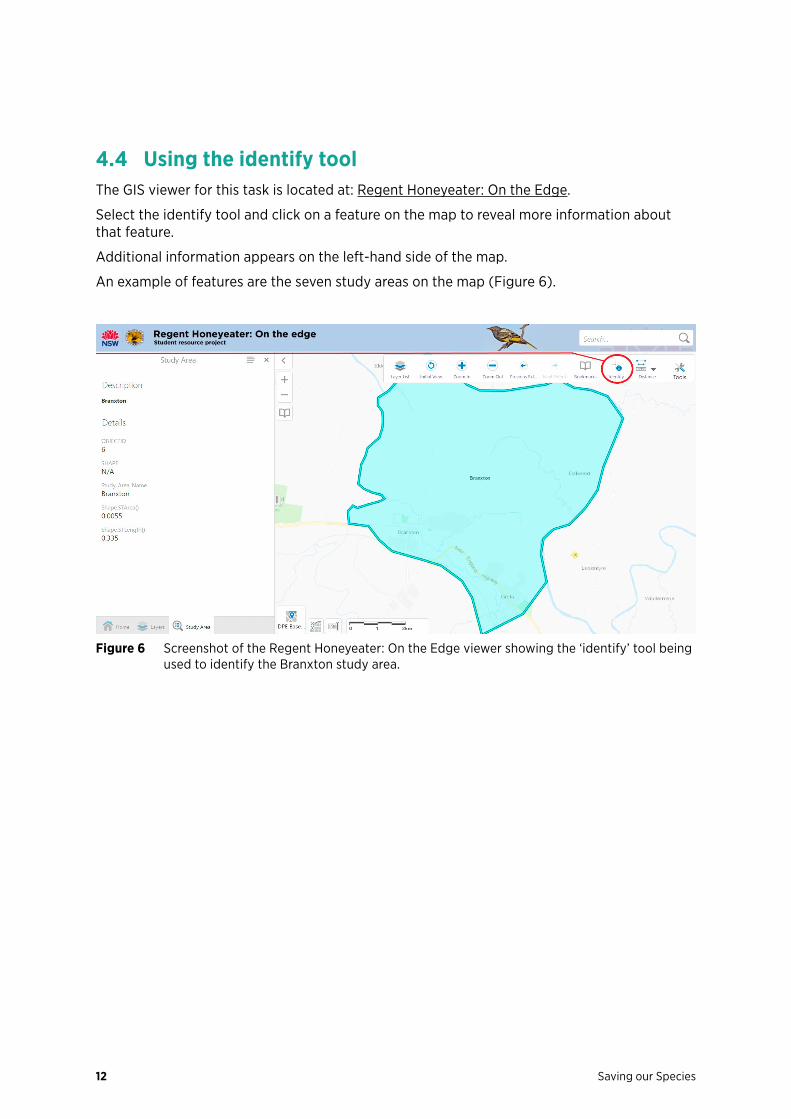
4.4 Using the identify toolThe GIS viewer for this task is located at: Regent Honeyeater: On the Edge.
Select the identify tool and click on a feature on the map to reveal more information about that feature.
Additional information appears on the left-hand side of the map.
An example of features are the seven study areas on the map (Figure 6).
Figure 6 Screenshot of the Regent Honeyeater: On the Edge viewer showing the ‘identify’ tool being used to identify the Branxton study area.
Saving our Species12

5. Student tasks
5.1 Using the regent honeyeater geographical information systemThe geographic information system (GIS) viewer for this task is located at: Regent Honeyeater: On the Edge.
5.1.1 Investigating elevation and habitat patch size
Seven study areas or sites in the Lower Hunter Region have been chosen because they are within the elevation range where regent honeyeaters have previously been found (Figure 7). They also have areas of spotted gum–ironbark forest, an essential habitat for the regent honeyeater to breed and forage. The study areas include:
Area one: Singleton
Area two: Branxton
Area three: Pokolbin
Area four: Corrabare
Area five: Werakata
Area six: Watagans
Area seven: Sugarloaf.
Your task for this section is to investigate the elevation and habitat patch size for each of the seven study areas. Then determine which study area/s has/ve the best habitat conditions for regent honeyeaters.
Use the GIS task worksheet to record your data (see Table 2).
Figure 7 Screenshot of the Regent Honeyeater: On the Edge viewer showing the seven study areas on the map.
13Regent Honeyeater: On the Edge - student workbook

ElevationThe GIS viewer for this task is located at: Regent Honeyeater: On the Edge.
Elevation is measured using metres (m) above sea level (ASL). Research indicates that regent honeyeaters prefer areas of lower elevation.
To find the elevation of each site:
Review the elevation of the seven bookmarked study areas and give each study area a score, with the following range:
• 1 = greater than >218 m
• 2 = 6–218 m
• 3 = less than <6 m.
Use the GIS task worksheet to record your data (see Table 2).
Figure 8 Screenshot of the Regent Honeyeater: On the Edge viewer with the elevation layer on.
1. Start at the home page in the GIS viewer, click the tool icon, click the layer icon.
2. Click on the ‘Study Areas’ box.
3. Use the ‘Bookmarks’ tool to switch between the seven study areas.
4. Switch on the ‘Elevation’ layer, the elevation key will be displayed (Figure 8).
5. Record the elevation at each study area.
Saving our Species14

Habitat patch sizeThe GIS viewer for this task is located at: Regent Honeyeater: On the Edge.
Although regent honeyeaters occur in a variety of landscape settings (e.g. large forest blocks, roadside vegetation), they are primarily considered to be open forest/woodland specialists. Habitat assessments confirm that most regent honeyeater sightings occur in habitat patches of >1000 hectares (ha). To investigate the patch size of sites within each study areas:
Use the bookmark icon to move between the study areas and give each site (A-H) within a study area a score:
• 1 = <1 ha• 2 = 1–100 ha • 3 = 100–1000 ha • 4 = >1000 ha.
Use the GIS task worksheet to record your data (see Table 2).
Rank study areasBased on your examination of elevation and habitat patch size data, rank the seven study areas. Add up your total score for elevation and patch size for each site. Describe what makes each study area suitable or not suitable for regent honeyeaters. Rank each study area based on the highest total.The study area with the highest total ranking is the area most likely to provide the best conditions for regent honeyeaters. The worst sites will have the lowest number.
Use the GIS task worksheet to record your data (see Table 2).
Figure 9 Screenshot of the Regent Honeyeater: On the Edge viewer with the habitat patch size layer on.
1. Switch off the ‘Elevation’ layer.
2. Switch on the ‘Sites’ layer.
3. Switch on the ‘Habitat Patch Size’ layer (Figure 9).
15Regent Honeyeater: On the Edge - student workbook
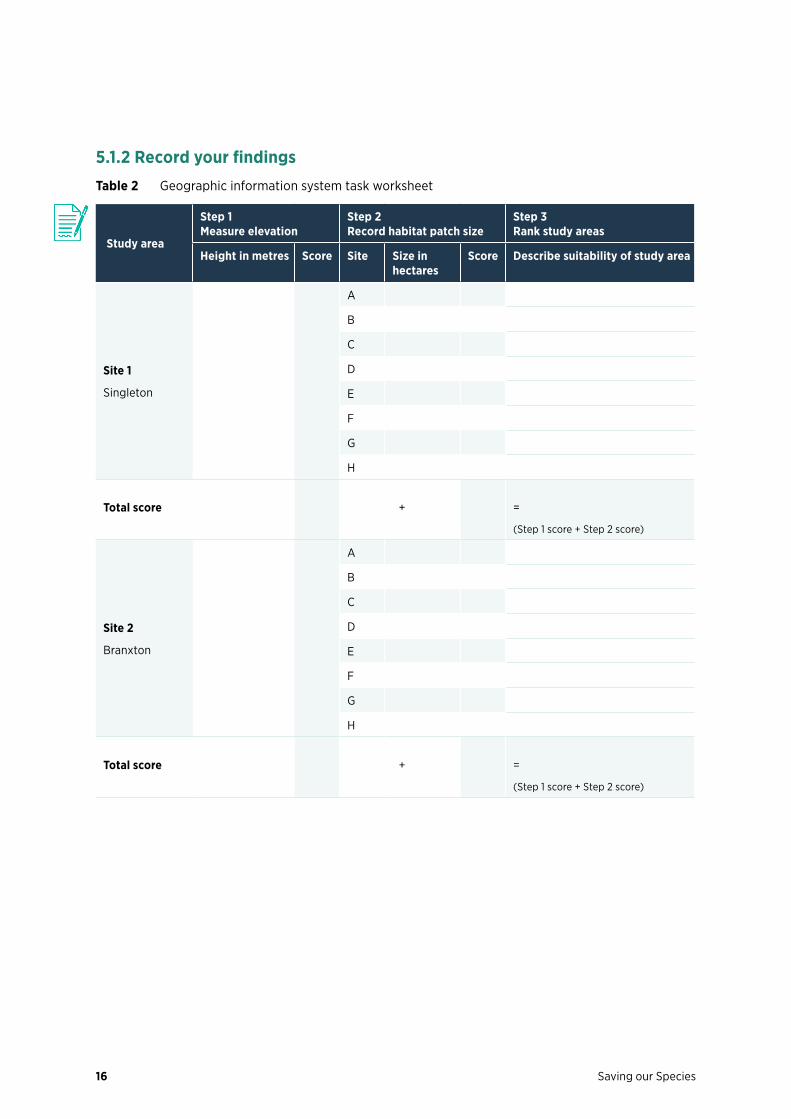
5.1.2 Record your findingsTable 2 Geographic information system task worksheet
Study area
Step 1 Measure elevation
Step 2 Record habitat patch size
Step 3 Rank study areas
Height in metres Score Site Size in hectares
Score Describe suitability of study area
Site 1
Singleton
A
B
C
D
E
F
G
H
Total score + =
(Step 1 score + Step 2 score)
Site 2
Branxton
A
B
C
D
E
F
G
H
Total score + =
(Step 1 score + Step 2 score)
Saving our Species16

Study area
Step 1 Measure elevation
Step 2 Record habitat patch size
Step 3 Rank study areas
Height in metres Score Site Size in hectares
Score Describe suitability of study area
Site 3
Pokolbin
A
B
C
D
E
F
G
H
Total score + =
(Step 1 score + Step 2 score)
Site 4
Corrabarre
A
B
C
D
E
F
G
H
Total score + =
(Step 1 score + Step 2 score)
17Regent Honeyeater: On the Edge - student workbook

Study area
Step 1 Measure elevation
Step 2 Record habitat patch size
Step 3 Rank study areas
Height in metres Score Site Size in hectares
Score Describe suitability of study area
Site 5
Werakata
A
B
C
D
E
F
G
H
Total score + =
(Step 1 score + Step 2 score)
Site 6
Watagans
A
B
C
D
E
F
G
H
Total score + =
(Step 1 score + Step 2 score)
Saving our Species18
Study area
Step 1 Measure elevation
Step 2 Record habitat patch size
Step 3 Rank study areas
Height in metres Score Site Size in hectares
Score Describe suitability of study area
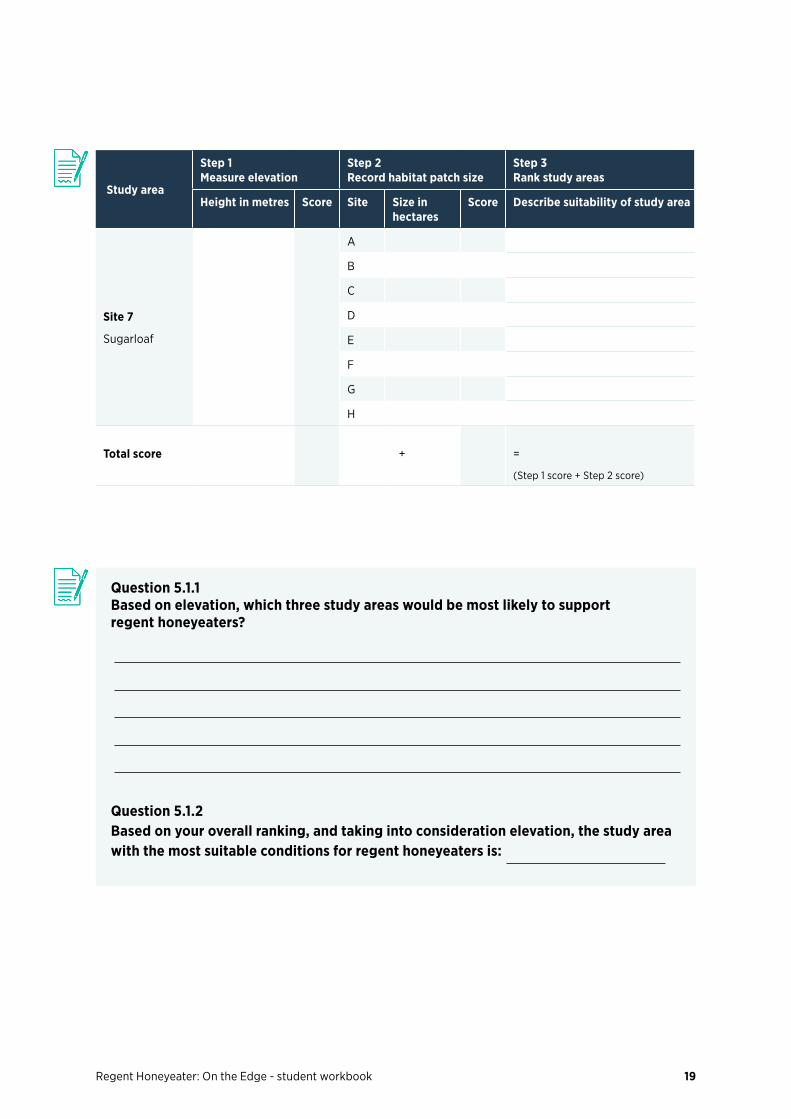
Site 7
Sugarloaf
A
B
C
D
E
F
G
H
Total score + =
(Step 1 score + Step 2 score)
Question 5.1.1 Based on elevation, which three study areas would be most likely to support regent honeyeaters?
Question 5.1.2 Based on your overall ranking, and taking into consideration elevation, the study area with the most suitable conditions for regent honeyeaters is:
19Regent Honeyeater: On the Edge - student workbook

5.1.3 Field study – getting out and about
Transects and quadrats In the next section, you will ‘tick’ on and off different layers of information. Mistletoe for example is one of these layers. The information to put these layers together was obtained using common ecological sampling methods. Transects and quadrats are two of these methods and they allow us to quantify the relative abundance of different species and/or ecological communities in an area.
To understand transects and quadrats, imagine a school classroom with chairs, desks, backpacks, pencils, books, etc. Let’s assume the classroom is square (Figure 10a).
Now, I ask you to tell me the number of backpacks in the classroom. ‘Easy’, you say since you can count the backpacks. This is time consuming and I point out you’ll waste your afternoon counting them. There’s a faster way to count the backpacks and that’s to use a transect line.
A transect line is a line that is marked at regular intervals. You can lay it diagonally across an area (Figure 10b) and count the backpacks that touch the line. This will give you an estimate of the backpacks in the classroom and will be much quicker than counting each one. The square classroom is the quadrat. Before continuing to part two, find a green area around your school. Could you make a quadrat? How about a transect line? What questions could you ask? If you’re unsure about how to proceed get in touch with the experts: National Parks and Wildlife Service Discovery Rangers via the NPWS School excursions webpage.
Figure 10 Diagram of (a) classroom (quadrat) and (b) quadrat with transect line.
Saving our Species20

5.1.4 Investigating study-area-specific environmental factors
The GIS viewer for this task is located at: Regent Honeyeater: On the Edge.
Site-area-specific environmental factors
Hint: This should be your answer for question 5.1.2.
BackgroundSpotted gum–ironbark-dominated woodlands are a preferred habitat for regent honeyeaters. Due to land clearing, there are now less of these woodlands. In addition, biotic and abiotic factors make some woodland forests higher-quality habitat than others for the regent honeyeater.
These factors include:
• water availability
• connectivity of habitat
• diversity of habitat and food tree species
• available food, importantly spotted gum, ironbark and mistletoe.
Use these factors to work out the most suitable site within your identified study area that will support regent honeyeaters.
Study area chosen:
21Regent Honeyeater: On the Edge - student workbook
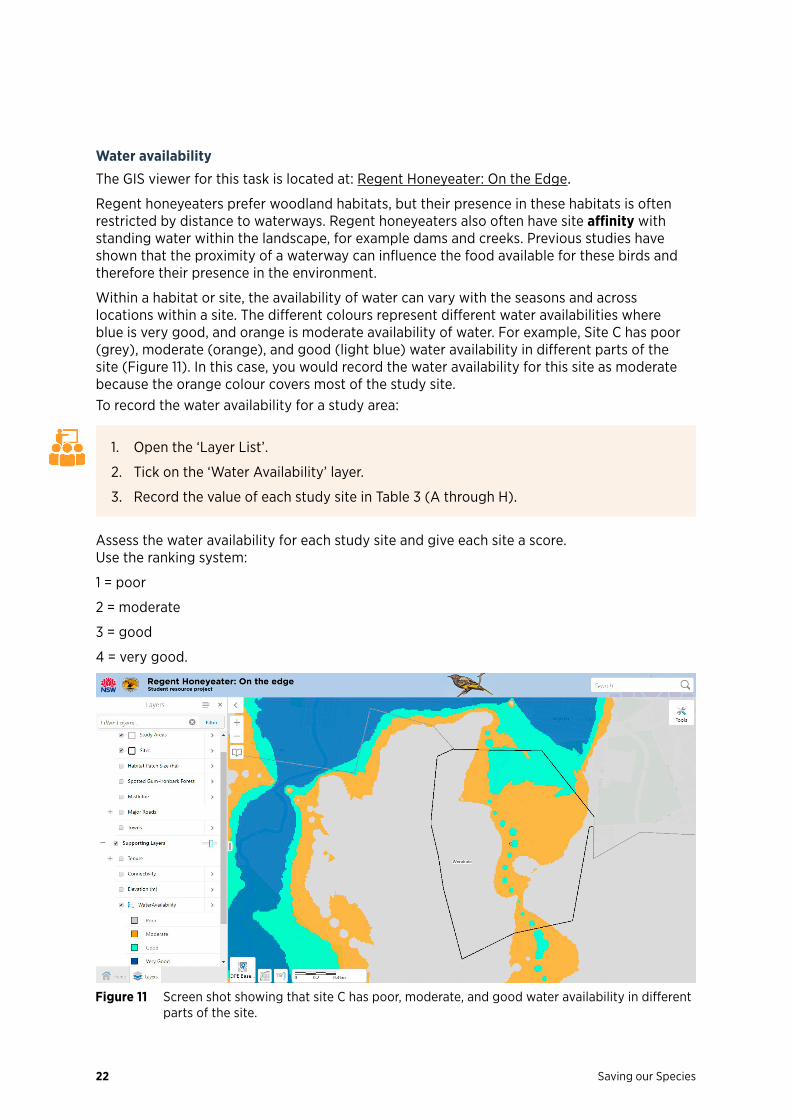
Water availabilityThe GIS viewer for this task is located at: Regent Honeyeater: On the Edge.
Regent honeyeaters prefer woodland habitats, but their presence in these habitats is often restricted by distance to waterways. Regent honeyeaters also often have site affinity with standing water within the landscape, for example dams and creeks. Previous studies have shown that the proximity of a waterway can influence the food available for these birds and therefore their presence in the environment.
Within a habitat or site, the availability of water can vary with the seasons and across locations within a site. The different colours represent different water availabilities where blue is very good, and orange is moderate availability of water. For example, Site C has poor (grey), moderate (orange), and good (light blue) water availability in different parts of the site (Figure 11). In this case, you would record the water availability for this site as moderate because the orange colour covers most of the study site. To record the water availability for a study area:
Assess the water availability for each study site and give each site a score. Use the ranking system:
1 = poor
2 = moderate
3 = good
4 = very good.
Figure 11 Screen shot showing that site C has poor, moderate, and good water availability in different parts of the site.
1. Open the ‘Layer List’.
2. Tick on the ‘Water Availability’ layer.
3. Record the value of each study site in Table 3 (A through H).
Saving our Species22

ConnectivityThe GIS viewer for this task is located at: Regent Honeyeater: On the Edge.
Habitat fragmentation is a major threat to the regent honeyeater. The loss of habitat areas and connecting green corridors limits the ability of the birds to find food and to breed.
Connectivity is the distance between areas of habitat. In previous studies, regent honeyeaters were more likely to be seen in areas of high connectivity (85.5%) and less likely to occur in sites with low connectivity (3%).
For example, Site G (Figure 12) has medium connectivity because it occurs within a national park, but is not connected to a green corridor.
Assess the connectivity for each study site and give each site a score. Use the ranking system:
1 = low, isolated from all green spaces
2 = medium, connected to either type of green space
3 = high, connected to both types of green spaces.
Figure 12 Screen shot showing Site G has medium connectivity.
1. Open the ‘Layer List’.
2. Tick on the ‘Connectivity Layer’.
3. Make sure that ‘DPE Basemap’ is ticked.
4. Record the value of each study area in Table 3.
23Regent Honeyeater: On the Edge - student workbook

Preferred woodland habitatThe GIS viewer for this task is located at: Regent Honeyeater: On the Edge.The diversity of tree species within preferred woodland habitats is crucial for robust regent honeyeater populations. The higher the diversity of flowering tree species, the more likely the woodland will support regent honeyeater populations.Most studies on regent honeyeater habitats have identified box-ironbark eucalypt woodlands as important. In the Lower Hunter spotted gum–ironbark woodlands are regionally important foraging and breeding habitats for the birds. Many sites in the Lower Hunter have a high diversity of tree species (more than four species). Habitat assessment studies have found that 49.2% of sites with regent honeyeaters present had a high tree species diversity, whereas 13% of the sites with regent honeyeaters present had a low tree species diversity (only one or two species).For example, Site B has medium–high and high ranking habitat and would be ranked as high for preferred woodland habitat (Figure 13).
Assess each study site for spotted gum–ironbark forest and give each site a score. Use the ranking system:
0 = almost none1 = poor2 = low3 = medium 4 = medium–high5 = high.
Figure 13 Screen shot showing that Site B has medium–high and high ranking preferred woodland habitat.
1. Tick on the ‘Spotted gum–Ironbark Forest’ layer.
2. Use the ‘Zoom In’ and ‘Zoom Out’ (+ and –) features to investigate each site.
3. Record the presence of spotted gum–ironbark forest for each study area in Table 3.
Saving our Species24

Mistletoe presence The GIS viewer for this task is located at: Regent Honeyeater: On the Edge.
Regent honeyeaters are often referred to as generalist foragers and, like most honeyeaters, rely on habitats with blossoming trees where there is abundant nectar flow. The relatively small number of eucalypt species that regent honeyeaters feed on produce high volumes of nectar from their blossoms. Several mistletoe species that live on eucalypts are also important sources of nectar and fruit for the regent honeyeater, including the long-flowered mistletoe (Dendropthoe vitellina), box mistletoe (Amyema miquelli), and needle-leaf mistletoe (Amyema cambagei). These key mistletoe species are crucial components for woodland habitats to support healthy regent honeyeater populations.
For example, Site F (Figure 14) has areas of low and high mistletoe. This site would be ranked as 1 or low because the mistletoe present is mostly low.
Assess each study area for the presence of mistletoe and give each area a score. Use the ranking system:
0 = mistletoe not present
1 = low mistletoe present
2 = high mistletoe present.
Figure 14 Screen shot showing that Site F has areas with low and high amounts of mistletoe.
1. Tick on the ‘Mistletoe’ layer.
2. Use the ‘Zoom In’ and ‘Zoom Out’ (+ and –) features to investigate each study area.
3. Record the mistletoe for each study area in Table 3.
25Regent Honeyeater: On the Edge - student workbook

Study-area-specific environmental factors
Hint: This should be your answer for question 5.1.2.
Table 6 Site-area-specific environmental factors
Water availability
Connectivity Preferred woodland habitat
Mistletoe presence
Site total
A
B
C
D
E
F
G
H
Study area chosen:
Question 5.1.3 Based on the site-specific environment factors you have assessed, which site within your identified study area is the most suitable for regent honeyeaters?
Saving our Species26

5.1.5 Scenario
After studying the regent honeyeater, you and your friends form an organisation to help conserve the species. The 20 Million Trees Program works with the community to re-establish green corridors and urban forests. Your organisation applied for a grant and was successful! The grant is for $100,000
5.1.6 Questions
Figure 15 Example graph included in grant application showing number of regent honeyeaters sighted between 1995 and 2017; R² = coefficient of determination. Source: Mick Roderick, BirdLife Australia 2020.
From the results of your research you chose as the most suitable study area.
Question 1. Briefly summarise the characteristics that make your site suitable for regent honeyeaters.
27Regent Honeyeater: On the Edge - student workbook

Question 2. Figure 15 is a graph that you included in your grant application. Why was it included?
Question 3. List your top management action and justify why it’s important (look back at the investigation practice section 3.1).
Question 4. Estimate how much it will cost to carry out this management action. Take into consideration the costs of equipment, surveying, etc. How long will the project run for? What will happen when the money/project ends?
Question 5. You hold a community meeting to get the project off the ground. At the meeting two people ask questions. Respond to their questions.
a. Fourth generation farmer: I’m concerned I won’t be able to keep my farm going and I don’t see why the bird is so important. How will this project help me?
b. A self-described ‘green’ couple just moved into the area: We’re excited to bring back the regent honeyeater but we don’t want to wait and feel everyone needs to do something immediately. How do you channel their energy?
Saving our Species28

5.2 Capture-mark-recapture
5.2.1 Regent honeyeater population management
Where it is too difficult to count every individual in a species, capture-mark-recapture (CMR) is a commonly used method in ecology to estimate a population.
A population is a group of individuals from the same species that live within a defined area and compete to use the same resources (e.g. food, shelter and breeding partners).
It is important to know how many individuals exist within a population and how that number changes over time. When the size of a population is known, it’s possible to track increases and decreases in the number of individuals.
Natural resource managers who work on threatened species conservation use CMR programs to monitor and learn whether a population is in decline. A CMR program traps and captures individuals from a population and tags them.
The tag can be an ear tag, a collar or in the case of the regent honeyeater a banding system attached to a bird’s leg. After an animal is tagged, it is released. Individuals from the same population are trapped and tagged at the same time the following year. The proportion of tagged animals caught the second time represents the proportion of the total population that has been tagged.
Using the following formula, you can calculate the approximate population size:
P =XM S
R
where,P = population sizeM = marked animals (animals caught and tagged in first capture)S = size of sample (animals caught in second capture)R = recaptured marked animals (animals caught in second capture that were already tagged).
Example calculation
The original number of birds caught, tagged and released was 20. The number of birds captured in the second capture was also 20. The number caught in the second capture that were previously tagged was 7. Note that it is very unlikely that you would capture the same number of birds twice.
P =X20 20
7
The population size estimate in the example calculation is 57 individuals.
29Regent Honeyeater: On the Edge - student workbook

5.2.2 Capture-tag-capture card exercise
For this exercise, you will need the following materials:
• a set of regent honeyeater (RH) cards (Figure 16)
• a dry erase marker
• paper towel.
Your task for this exercise is to use the regent honeyeater cards to complete the following simulations. Use the spaces provided to complete the formulas as you complete each step. Make sure to use table 4 to write in your P values.
Capture-mark-recapture 1
Capture 1: Catch and tag 20 regent honeyeaters (RH). This is your M value.
Capture 2: Release RH back into the population shuffle all the cards).
Catch 20 RH. This is your S value.
How many of these were tagged? This is your R value.
Capture-mark-recapture 2
Capture 1: Catch and tag RH (more or less than 20). This is your M value.Capture 2: Release RH back into the population (shuffle all the cards).
Catch 20 RH. This is your S value.
Count how many were tagged. This is your R value.
Capture-mark-recapture 3
Capture 1: Catch and tag 20 RH. This is your M value.Capture 2: Release RH back into the population (shuffle all the cards).
Catch a number of RH (more or less than 20). This is your S value.
Count how many were tagged. This is your R value.
P =
M S
R
X
P =
M S
R
X
P =
M S
R
X
Saving our Species30

Record your data
Table 8 Results for each capture-mark-recapture (CMR) exercise
Exercise Results
CMR 1
CMR 2
CMR 3
Analyse your dataWhen collecting data in the field the larger the sampling size the more accurate your population estimate will be. When you analyse your data, think about how close your estimate is to the original population i.e. number of cards you started with.
DiscussionDoes altering the values of M or S impact the accuracy of the population estimates?
31Regent Honeyeater: On the Edge - student workbook

6. More information
Lower Hunter Spotted Gum-Ironbark Forest in the Sydney Basin Bioregion, NSW Department of Environment & Climate Change, Published August 2007, Date accessed: 16 January 2020, https://www.epa.nsw.gov.au/~/media/EPA/Corporate%20Site/resources/threatenedspecies/EECLowerHunterSpottedGumLowRes.ashx
NSW Threatened Species Scientific Committee webpage, Department of Planning, Industry and Environment – Environment, Energy and Science, Date accessed: 16 January 2020, https://www.environment.nsw.gov.au/topics/animals-and-plants/threatened-species/nsw-threatened-species-scientific-committee
Our local fauna webpage, Cessnock City Council, NSW Government, Date accessed: 16 January 2020, http://www.cessnock.nsw.gov.au/environment/biodiversity/cessnocklocalfauna
Regent honeyeater (Anthochaera phrygia) conservation management webpage, NSW Department of Planning, Industry and Environment – Environment, Energy and Science, Date accessed: 16 January 2020, www.environment.nsw.gov.au/savingourspeciesapp/project.aspx?ProfileID=10841
Regent Honeyeaters at Quorrobolong, Lower Hunter Valley NSW, May 2017, www.youtube.com/watch?v=73k8ZIx6Zqo
Regent honeyeater webpage, BirdLife Australia, Date accessed: 16 January 2020, http://www.birdlife.org.au/projects/woodland-birds-for-biodiversity/regent-honeyeater-wl
Regent honeyeater webpage, NSW Department of Planning, Industry and Environment – Environment, Energy and Science, Date accessed: 16 January 2020, www.environment.nsw.gov.au/threatenedspeciesapp/profile.aspx?id=10841
Saving our Species Program webpage, NSW Department of Planning, Industry and Environment – Environment, Energy and Science, Date accessed: 16 January 2020, https://www.environment.nsw.gov.au/topics/animals-and-plants/threatened-species/saving-our-species-program
Significant breeding event of Regent Honeyeaters Anthochaera phrygia near Kurri Kurri, New South Wales, during spring 2007, Australian Field Ornithology 2014, http://www.birdlife.org.au/documents/IBAiD-Roderick_et_al_2014-Regent_HE_HEZ_breeding_event.pdf
Swift Parrots and Regent Honeyeaters in the Lake Macquarie City Council area New South Wales, Published June 2014, Date accessed: 16 January 2020, http://www.environment.gov.au/system/files/pages/25570c73-a276-4efb-82f4-16f802320e62/files/regent-honeyeater-swift-parrot-report.pdf
Swift Parrots and Regent Honeyeaters in the Lower Hunter Region of New South Wales, Published May 2013, Date accessed: 16 January 2020, https://www.environment.gov.au/system/files/pages/25570c73-a276-4efb-82f4-16f802320e62/files/birdlife-swpa-reho.pdf
Threatened Fauna of the Hunter & Mid Coast, Local Land Service, NSW Government, Published March 2019, https://hunter.lls.nsw.gov.au/__data/assets/pdf_file/0008/1118564/regent-honey-eater.pdf
Threatened species topic area webpage, NSW Department of Planning, Industry and Environment – Environment, Energy and Science www.environment.nsw.gov.au/topics/animals-and-plants/threatened-species
Our Bushland with Tim Faulkner, Cessnock City Council, NSW Government, 2018, www.youtube.com/watch?v=AojHcD5ePZ4&t=1s
Saving our Species32

Figure 16 Images of regent honeyeater to use to make capture-mark-recapture cards Photo: Dean Ingwersen/BirdLife Australia
33Regent Honeyeater: On the Edge - student workbook
Glossary
Abiotic Relating or resulting from nonliving parts of an ecosystem.
Affinity A natural liking for or connection with something.
Coefficient of Determination (R²) A measure used in statistical analysis that assesses how well a model explains and predicts future outcomes. Its value ranges from 0 to 1.
Biotic Relating to life or resulting from living organisms.
Ecological community Naturally occurring group of plants, animals and other organisms that are interacting in a unique space/area.
Elevation Height above sea level.
Forage When an animal species searches for wild food resources.
Fragmentation/ongoing loss Process by which habitat loss results in the division of large continuous habitats into smaller, more isolated habitat fragments.
Green corridors Areas of habitat that connect wildlife populations with other areas of habitat that have been separated by human activities or structures.
Habitat patch size Term used to describe the size of an ecosystem.
Invasive bird A bird species that is not native to an area and threatens the local ecosystem.
Relative abundance Used when talking about biodiversity and refers to how common or rare a species is relative to other species in a defined space or community
Scientific process A method of research in which a problem is identified, relevant data are gathered, a hypothesis is formulated from these data, and the hypothesis is empirically tested.
Spotted gum–ironbark forest A type of forest community that is characterised by spotted gum (Corymbia maculate) and various ironbarks (predominantly Eucalyptus fribrosa).
Temperate woodlands Term generally used to describe ecosystems which contain widely spaced trees where the crowns do not touch. In Australia, woodlands are mainly dominated by eucalyptus species.
END OF DOCUMENT
Regent honeyeater (Anthochaera phrygia) Bruce Thompson/DPIE