Referensi HDO
15
Applied Catalysis A: General 260 (2004) 137–151 A series of NiMo/Al 2 O 3 catalysts containing boron and phosphorus Part I. Synthesis and characterization D. Ferdous a , A.K. Dalai a,∗ , J. Adjaye b a Catalysis and Chemical Reactor Engineering Laboratories, Department of Chemical Engineering, University of Saskatchewan, Saskat oon, Canada SK S7N 5C9 b Syncrude Canada Ltd., Edmonton Research Center, Canada Received 13 March 2003; received in revised form 9 October 2003; accepted 9 October 2003 Abstract In this work , a seri es of nicke l–mo lybden um, nickel–mo lybde num–b oron and one nick el–molybde num–p hosph oruscatalystswere prepa red by incipient wetness impregnation method. Calcination temperature , nickel, molybdenum and boron concentrations in -Al 2 O 3 were varied from 450 to 600 ◦ C, 1.8 to 3.1 wt.%, 10.6 to 13.2 wt.% and 0.5 to 1.7 wt.%, respe cti vely . Nick el–molybd enum–phosp horus catal yst was prepared using 2.7 wt.% phosphorus. All catalys ts were thoroughly charac terized. The cata lyst containing 10.6 wt.% Mo and 2.4 wt.% Ni in -Al 2 O 3 gave maxim um BET area of 211 m 2 /g. In these catalysts, the molybdenum oxides were present predominantly as polymolybdate and tetrahedral form. Addition of boron to NiMo/Al 2 O 3 caused an increase in weak acid centers, whereas phosphorus caused the formation of acid centers with intermediate strength. Also, addition of boron caused the formation of crystalline B 2 O 3 and MoO 3 on the catalyst surface, evident from both XRD and SEM analyses. Whereas addition of phosphorus caused the formation of irregular particle size and agglomeration on the catalyst surface, evident from SEM-EDS analysis. New Lewis and Brönsted acid sites on the catalyst surface were observed from FTIR analysis because of the addition of boron and phosphorus to NiMo/Al 2 O 3 . © 2003 Elsevier B.V. All rights reserved. Keywords: NiMo/Al 2 O 3 catalysts; Boron; Phosphorus; TPR; TPD; XRD; NMR; FTIR; HDN; HDS 1. Intro ducti on Oil sand bitumen and the bitumen derived gas oil contain high levels of nitrogen and sulfur compounds. Thus, the products such as heavy gas oil obtained from the processing of bitumen also contain very high levels of nitrogen. Cat- alytic hydrodenitrogenation (HDN) is the only process used comme rcial ly for reducing the lev el of nitrog en conte nt in those types of feed stocks. Because of high nitrogen content hydrodenitrogenation (HDN) of this heavy gas oil is more difficult and less effective with conventional NiMo/Al 2 O 3 catalyst. In the past some attempts have been made to modify NiMo/Al 2 O 3 catalyst using boron to improve hydrodenitri- genation (HDN) of model nitrogen compounds. Borate ion incorporated on alumina forms a system exhibiting acidic ∗ Corresponding author. Tel.: +1-306-966-4771; fax: +1-306-966-4777. E-mail address: [email protected] (A.K. Dalai). properties. Peil et al. [1] and Wang and Chen [2] showed that incorporation of borate ions increased alumina acid- ity. Moreover, borate ions brought about an increase in the activity of CoMo/Al 2 O 3 and NiMo/Al 2 O 3 catalysts in the reaction of HDS [3,4]. Lulic [5] investigated the perfor- mance of NiMo/Al 2 O 3 –B 2 O 3 catalyst on the HDN activity and concluded that the catalysts containing boron are more active than commercial HDN catalyst. DeCanio and Weiss- man [6] studied the characterization and activity of boron (0.3–1.8 wt.%) modified c ommercial NiMo/Al 2 O 3 catalyst. At higher boron loadi ngs of over 1.8 wt.% boron , poor cat- alytic performance was observed due to the presence of bulk borate phase. Lewandowski and Sarbak [7] studied the effect of boron addition on texture and structure of NiMo/Al 2 O 3 catalysts. They found that addition of boron did not change the pore volume significantly; however, it increased the pore radius to 20, 25, 30 and 40 Å in comparison with the unmod- ified catalyst. Lewandowski and Sarbak [8] studied the HDS and HDN activities of boron modified NiMo/Al 2 O 3 catalyst using quinoline, carbazole and coal liquid. The support with 0926-860X/$ – see front matter © 2003 Elsevier B.V. All rights reserved. doi:10.1016/j.apcata.2003.10.010
Transcript of Referensi HDO
8/13/2019 Referensi HDO
http://slidepdf.com/reader/full/referensi-hdo 1/15
Applied Catalysis A: General 260 (2004) 137–151
A series of NiMo/Al2O3 catalysts containing boron and phosphorusPart I. Synthesis and characterization
D. Ferdous a, A.K. Dalai a,∗, J. Adjaye b
a Catalysis and Chemical Reactor Engineering Laboratories, Department of Chemical Engineering, University of Saskatchewan,
Saskatoon, Canada SK S7N 5C9b Syncrude Canada Ltd., Edmonton Research Center, Canada
Received 13 March 2003; received in revised form 9 October 2003; accepted 9 October 2003
Abstract
In this work, a series of nickel–molybdenum, nickel–molybdenum–boron and one nickel–molybdenum–phosphorus catalystswere preparedby incipient wetness impregnation method. Calcination temperature, nickel, molybdenum and boron concentrations in -Al2O3 were variedfrom 450 to 600 ◦C, 1.8 to 3.1 wt.%, 10.6 to 13.2wt.% and 0.5 to 1.7 wt.%, respectively. Nickel–molybdenum–phosphorus catalyst wasprepared using 2.7wt.% phosphorus. All catalysts were thoroughly characterized. The catalyst containing 10.6 wt.% Mo and 2.4 wt.% Ni in-Al2O3 gave maximum BET area of 211m2 /g. In these catalysts, the molybdenum oxides were present predominantly as polymolybdateand tetrahedral form. Addition of boron to NiMo/Al2O3 caused an increase in weak acid centers, whereas phosphorus caused the formation of acid centers with intermediate strength. Also, addition of boron caused the formation of crystalline B2O3 and MoO3 on the catalyst surface,evident from both XRD and SEM analyses. Whereas addition of phosphorus caused the formation of irregular particle size and agglomerationon the catalyst surface, evident from SEM-EDS analysis. New Lewis and Brönsted acid sites on the catalyst surface were observed from FTIRanalysis because of the addition of boron and phosphorus to NiMo/Al2O3.© 2003 Elsevier B.V. All rights reserved.
Keywords: NiMo/Al2O3 catalysts; Boron; Phosphorus; TPR; TPD; XRD; NMR; FTIR; HDN; HDS
1. Introduction
Oil sand bitumen and the bitumen derived gas oil containhigh levels of nitrogen and sulfur compounds. Thus, theproducts such as heavy gas oil obtained from the processingof bitumen also contain very high levels of nitrogen. Cat-alytic hydrodenitrogenation (HDN) is the only process usedcommercially for reducing the level of nitrogen content inthose types of feed stocks. Because of high nitrogen contenthydrodenitrogenation (HDN) of this heavy gas oil is moredifficult and less effective with conventional NiMo/Al2O3catalyst.
In the past some attempts have been made to modifyNiMo/Al2O3 catalyst using boron to improve hydrodenitri-genation (HDN) of model nitrogen compounds. Borate ionincorporated on alumina forms a system exhibiting acidic
∗ Corresponding author. Tel.: +1-306-966-4771;fax: +1-306-966-4777.
E-mail address: [email protected] (A.K. Dalai).
properties. Peil et al. [1] and Wang and Chen [2] showedthat incorporation of borate ions increased alumina acid-ity. Moreover, borate ions brought about an increase in theactivity of CoMo/Al2O3 and NiMo/Al2O3 catalysts in thereaction of HDS [3,4]. Lulic [5] investigated the perfor-mance of NiMo/Al2O3–B2O3 catalyst on the HDN activityand concluded that the catalysts containing boron are moreactive than commercial HDN catalyst. DeCanio and Weiss-man [6] studied the characterization and activity of boron(0.3–1.8 wt.%) modified commercial NiMo/Al2O3 catalyst.At higher boron loadings of over 1.8 wt.% boron, poor cat-alytic performance was observed due to the presence of bulkborate phase. Lewandowski and Sarbak [7] studied the effectof boron addition on texture and structure of NiMo/Al2O3catalysts. They found that addition of boron did not changethe pore volume significantly; however, it increased the poreradius to 20, 25, 30 and 40 Å in comparison with the unmod-ified catalyst. Lewandowski and Sarbak [8] studied the HDSand HDN activities of boron modified NiMo/Al2O3 catalystusing quinoline, carbazole and coal liquid. The support with
0926-860X/$ – see front matter © 2003 Elsevier B.V. All rights reserved.doi:10.1016/j.apcata.2003.10.010
8/13/2019 Referensi HDO
http://slidepdf.com/reader/full/referensi-hdo 2/15
138 D. Ferdous et al. / Applied Catalysis A: General 260 (2004) 137–151
borate ions increased the acidity of Ni–Mo catalyst; in partic-ular, the amount of acid centers of intermediate strength. TheHDN activity of the catalyst containing 9.1 and 11.7 wt.%boron was considerably higher than that of NiMo catalyst.They concluded that the HDN of carbazole indeed dependson the number of acid centers present on the catalyst surface.
On the other hand, in the case of quinoline, the acid centersalso play a certain role; however reaction may proceed oncenters of weak strength. They also concluded that a supportmodification with borate ions led to a decrease in deactiva-tion of the Ni–Mo catalyst in the HDN of coal liquid.
The presence of small amounts of phosphorus in sulfidedNiMo/Al2O3 catalyst has been shown to have a positiveeffect on both their HDN and HDS activities. In addition,these catalysts are less susceptible to coking [9]. Variousexplanations are proposed for this improvement. It hasbeen reported that phosphorus enhances the solubility of the molybdate by the formation of phosphomolybdate com-plexes, which make the catalyst preparation easier and may
lead to a different dispersion of the Mo and Co/Ni. Also,addition of phosphorus causes the formation of easily re-ducible and sulfided forms, such as multilayered molybdate,crystalline Al2(MoO4)3 and MoO3 on the catalyst surface[9–11]. On the other hand, phosphorus causes interactions of metal atoms with alumina support surface in case of sulfidedcobalt and nickel [12]. However, Iwamoto and Grimblot [13]reported that phosphorus modifies the textural characteristicand acidity of the catalysts. From work on the unpromotedMoP/Al2O3 catalyst, they have shown that the thiopheneHDS activity was not promoted by phosphorus loading,while large amount of phosphorus decreased the catalytic
performances, probably by formation of bulk MoO3 in ox-ide precursor. Eijsbouts et al. [14] found beneficial effectsof phosphorus in studies of quinoline HDN. They have sug-gested that, phosphorus may play a direct role in C–N bondcleavage. On the other hand, Lewis et al. [11] and Eijsboutset al. [14] did not find any positive effect of phosphorus dur-ing hydrodesulfurization of thiophene. This discrepancy wasexplained by assuming that the HDN and HDS reactions takeplace on different catalytic sites and phosphorus has differ-ent influence on them. Jian et al. [15] found no effects in theHDN of piperidine and pyridine over NiMo/Al2O3 catalyst.But in the presence of phosphorus the HDN activity de-creased as the phosphorus content in the catalyst increased.They have concluded that phosphorus has a negative effecton the C–N bond cleavage in piperidine, as well as on thesubsequent hydrogenation of the C5 alkene intermediates.
In the past, most of the research has been performed bymodifying the support with boron. However, little informa-tion is available on the modification of NiMo/Al2O3 itself with boron. Although a number of researchers and com-mercial operations use P modified NiMo/Al2O3 catalysts, inthe open literature, most studies have been conducted usingHDN of model compounds and for short run lengths. Infor-mation on performance of B and P on the hydroprocessingof actual feed is scarce. The correlation between catalyst
properties with the HDN activity is also missing especiallywhen the feed is gas oils derived from the oil sands. Conse-quently, in the present work, a series of NiMo/Al2O3 cata-lyst was prepared using different concentrations of B and P,and thoroughly characterized (Part I). The impact of B andP on the catalytic properties as well as on HDN and HDS
performances of heavy gas oil derived from oil sands bitu-men were also investigated (the results of which constitutesPart II of this work).
2. Experimental
2.1. Catalyst preparation
A series of NiMo/Al2O3 was prepared using incipientwetness coimpregnation method using extruded -Al2O3(∼1.4mm of diameter) obtained from Sud Chemical In-dia Ltd., New Delhi. In this method an ammoniacal so-
lution (28 wt.% concentrated NH3) was prepared at apH of 9.5 using required amount of ammonium hep-tamolybdate [(NH4)6Mo7O24·4H2O] and nickel nitrate[Ni(NO3)2·6H2O]. The solution was heated at 70 ◦C untilit produced a clear solution, and was impregnated withsupport (dried at 120 ◦C for overnight). The impregnatedsupport was dried for 12 h at 120 ◦C. The catalyst was thencalcined at different temperatures (450–600 ◦C) for 4h.Catalysts were prepared at different Ni (1.8–3.1 wt.%) andMo (10.6–13.2wt.%) concentrations.
NiMoB/Al2O3 catalysts were prepared by impregnatingappropriate solution of boric acid on to a NiMo/Al2O3 cat-
alyst. The pH of the solution was maintained at ∼7. Theresulting modified catalysts were then dried at 120 ◦C for12 h. Finally the catalysts were calcined at 500 ◦C for 4 h.
NiMoP/Al2O3 catalyst was prepared using incipient wet-ness coimpregnation method. In this method, a solutioncontaining required amount of ammonium heptamolybdate[(NH4)6Mo7O24·4H2O], nickel nitrate [Ni(NO3)2·6H2O]and phosphoric acid (H3PO4) in water was impregnatedonto an Al2O3 support. The pH of the solution was main-tained ∼3.5 using 28 wt.% concentrated NH3 solution.Impregnation of the support was followed by drying for12h at 120 ◦C and calcined at 500 ◦C for 4 h.
2.2. Catalyst characterization
Catalyst characterization was carried out to identify theproperties of the catalysts that are responsible for the catalystactivity. Different characterization techniques used in thisstudy are described below.
2.2.1. Elemental analysis
The analysis of the elemental composition of Ni, Mo, Band P in the calcined catalyst was performed using inductiv-ity coupled plasma-mass spectrometer (ICP-MS). The pro-cedure is described by Ferdous [16].
8/13/2019 Referensi HDO
http://slidepdf.com/reader/full/referensi-hdo 3/15
D. Ferdous et al. / Applied Catalysis A: General 260 (2004) 137–151 139
2.2.2. BET surface area, pore volume and pore size
measurement
BET surface area, pore volume and pore size measure-ments of the calcined catalysts (∼0.1 g) were performed us-ing a Micromeritics adsorption equipment (Model ASAP2000, manufactured by Micromeritics Instruments Inc., Nor-
cross, GA, USA) at 78 K using liquid N2. Before analysis,catalyst sample was evacuated at 200 ◦C for 4 h in a vacuumof 5 × 10⁻⁴ atm to remove all adsorbed moisture from thecatalyst surface and pores.
2.2.3. Temperature programmed reduction
The temperature programmed reduction (TPR) analysis of the catalyst (∼0.03g) was performed using Quantachromeequipment (Model ChemBET 3000, Manufactured by Quan-tachrome Corporation, FL, USA). The sample U tube wasplaced in an electric furnace and heated from 22 to 1050 ◦Cat 20 ◦C/min at 1atm in a reducing gas of 3mol% H2 inN2 (obtained from Praxiar, Mississauga, Ont., Canada) with
a flow rate of 30ml/min. H2 consumption during the TPRexperiments was measured with a thermal conductivity de-tector (TCD). The TPR plots were logged using an on-linedata acquisition system.
2.2.4. Temperature programmed desorption
The temperature programmed desorption (TPD) of ammo-nia was performed using Quantachrome equipment (ModelChemBET 3000, Manufactured by Quantachrome Corpo-ration, FL, USA) for the measurement of the acidic prop-erties of catalysts. For TPD analysis, 0.1 g catalyst samplewas placed in an adsorption vessel (U-shaped), heated with
a flow of 0.1% NH3 in N2 at the flow rate of 20ml/min andat heating rate of 10 ◦C/min up to 400 ◦C and kept at thistemperature for 1 h. Then it was cooled to room tempera-ture using this gas mixture at the same flow rate. Finally, theTPD was run from room temperature to 1050 ◦C at heatingrate of 10 ◦C/min with He flow at 20 ml/min. The amountof NH3 desorbed was measured using a TCD.
2.2.5. X-ray diffraction
Powder X-ray diffraction (XRD) studies were performedon the calcined sample in order to identify the crystallinespecies present. XRD analysis was performed using Rigakudiffractometer (Rigaku, Tokyo, Japan) using Cu K radi-ation filtered by a graphic monochromator at a setting of 40 kV and 130mA. The powdered catalyst samples weresmeared on glass slide with methanol and dried at room tem-perature. The X-ray diffraction analysis was carried out inthe scanning angle (2θ ) range of 3–60◦ at scanning speed of 5◦ /min.
2.2.6. Scanning electron microscopy–energy dispersion
spectroscopy
Scanning electron microscopy (SEM) analysis was per-formed on NiMo/Al2O3 catalysts using Hitachi S-2700 withPrinceton Gamma-Tech Prism EDS Detector at Syncrude
Canada Ltd. For doing this analysis, a few pellets of the cat-alyst samples were attached onto an aluminum stub usingepoxy as the adhesive. Before doing the analysis the sam-ples were coated with carbon by vacuum evaporation to re-duce charging and improve the secondary electron signalsfor imaging. Analysis was done for the surface and also for
the radial direction of the catalyst samples at the magnifica-tion of 12 000×. In addition, energy dispersion spectroscopy(EDS) was also used to obtain the elemental analysis forselected particles.
2.2.7. Nuclear magnetic resonance
NMR analysis of all calcined catalysts was performedusing an Advance DRX NMR spectrometer, manufacturedby Bruker Analytik GmbH. The study looks at the differenthydroxyl structures present on the catalyst surface. For thisanalysis 1H (proton) nucleus (360.13 MHz) was observed.Approximately 0.5 g of sample was packed in the rotor. Therotor was placed in the probe and spinning started to a speed
of 5kHz. The sample sits at an angle of 54.7 ◦, which isreferred to as magic angel spinning (MAS). The data wascollected for 2.2 min and then transformed to produce thespectra.
2.2.8. Fourier transform infrared spectroscopy
Fourier transform infrared (FTIR) analysis of all catalystswas performed using an FTIR spectrometer attached to aphoto acoustic spectroscopy (PAS) cell. Before doing analy-sis all samples were powdered and dried in an oven at 400 ◦Cfor 3 h, cooled in the desiccator until it reached about 50◦Cwhereupon it was transferred into a sample cup stored in the
desiccator. The loaded cup was inserted into the PAS mea-surement chamber and the atmosphere control valve rotatedto the open purge position to allow helium gas to flow overthe sample. Then the rear lever was rotated to the closedpurge position and the sample allowed to cool to room tem-perature, in the sealed cell, under helium. All spectra wererecorded after 512 scans at a resolution of 8 cm−1 in orderto achieve desired signal to noise ratio.
3. Results and discussion
3.1. Catalyst characterization
3.1.1. Elemental analysis
Table 1 shows the elemental analysis of the different cat-alyst formulations. It is observed that for all catalysts themeasured concentrations are comparatively lower than thoseof targeted ones particularly in case of Mo. For example,for the catalyst with the targeted Ni and Mo concentrationsof 4 and 14wt.%, the actual concentrations were 3.1 and11.1 wt.%, respectively. Part of this discrepancy is due tothe inherent nature of these compounds to form consider-able metal vacancies, depending on the preparation or heattreatment conditions [17]. Also, the significant difference in

8/13/2019 Referensi HDO
http://slidepdf.com/reader/full/referensi-hdo 4/15
140 D. Ferdous et al. / Applied Catalysis A: General 260 (2004) 137–151
Table 1Summary of ICP results of different NiMo/Al2O3, NiMoB/Al2O3, andNiMoP/Al2O3 catalysts calcined for 4 h
Catalyst Calcinationtemperature(◦C)
Targeted (wt.%) Measured (wt.%)
Ni Mo B P Ni Mo B P
A 450 3 14 0 0 2.7 12.2 0 0
B 500 3 14 0 0 2.9 13.2 0 0C 600 3 14 0 0 3.0 13.2 0 0
D 500 2 14 0 0 1.8 12.5 0 0B 500 3 14 0 0 2.9 13.2 0 0E 500 4 14 0 0 3.1 11.1 0 0
F 500 3 12 0 0 2.4 10.6 0 0B 500 3 14 0 0 2.9 13.2 0 0
G 500 3 14 0.6 0 2.6 11.7 0.53 0H 500 3 14 1.2 0 2.6 11.8 1.1 0I 500 3 14 1.3 0 2.8 9.1 1.2 0J 500 3 14 1.4 0 2.5 11.8 1.3 0K 500 3 14 2.0 0 2.2 10.2 1.7 0L 500 3 14 0 3 3.1 12.5 0 2.7
expected and targeted Mo concentrations could be due to thehygroscopic nature of the Mo precursor (ammonium hepta-molybdate) thus preventing complete impregnation of Mofrom the solution to the support.
3.1.2. BET surface area, pore volume, and pore size
measurement
The BET surface area, pore volume and pore size of dif-ferent catalysts are given in Table 2. From this table, it isobserved that the surface area, pore volume, and pore diam-
eter of the support decreased with the incorporation of Ni,Mo, B and P in -Al2O3, due to: (a) the pore blocking of alumina with impregnated material [7], and (b) the partialsolubility of alumina in acid and alkaline media [18]. It isalso seen that the increase in calcination temperature caused
Table 2BET surface area, pore volume and pore diameter of different NiMo/Al2O3, NiMoB/Al2O3 and NiMoP/Al2O3 catalysts calcined for 4h
Ni Mo (wt.%) B P Calcination temperature (◦C) BET (m2 /g) Pore volume (cm3 /g) Pore diameter (Å)
Support – – – – 235 0.657 1122.7 12.2 – – 450 183 0.452 99
2.9 13.2 – – 500 193 0.487 1013.0 13.2 – – 600 201 0.479 95
1.8 12.5 – – 500 186 0.44 952.9 13.2 – – 500 193 0.487 1013.1 11.1 – – 500 197 0.469 95
2.4 10.6 – – 500 211 0.482 912.9 13.2 – – 500 193 0.487 101
2.6 11.7 0.5 – 500 195 0.522 1072.6 11.8 1.1 – 500 194 0.444 922.8 9.1 1.2 – 500 192 0.459 962.5 11.8 1.3 – 500 185 0.474 1032.2 10.2 1.7 – 500 164 0.422 1033.1 12.5 – 2.7 500 194 0.43 96
an increase in surface area of the catalyst. For example, itincreased from 183 to 201m2 /g with calcination tempera-ture from 450 to 600 ◦C (see Table 2 for catalysts A–C).On the other hand Brito and Laine [19] reported no signif-icant change in surface area but slight increase in the porevolume with the increase in calcination temperature from
400 to 500◦
C. This is probably due to migration of Ni andMo metal from pore to surface, with the increase in calci-nation temperature. The surface area increased from 186 to197 wt.% with the increase in Ni concentration from 1.8 to3.1wt.% (Table 2) (catalysts B, D and E). These results arein agreement with those results reported by Brito and Laine[19]. However, an increase in Mo concentration from 10.6 to13.2 wt.% (catalysts B and F) caused a decrease in surfacearea from 211 to 193m2 /g.
Itisseenfrom Table 2 that the surface area (192–195 m2 /g)did not change significantly with the addition of 0.5–1.2 wt.%B to the NiMo/Al2O3 catalyst (catalysts G–I) but it de-creased significantly with the increase in B to 1.7wt.%
(catalysts J and K). This decrease is due to the blockageof pores and the formation of bulk and crystalline B2O3 athigher boron loading. Lewandowski and Sarbak [7] also re-ported a decrease in surface area of NiMoB/Al2O3 catalystfrom 163 to 123m2 /g with an increase in boron concentra-tion from 2.8 to 11.7 wt.%. The surface area of the catalystdid not change with the addition of P to this catalyst. Incontrast, Jian and Prins [20] reported decrease in surfacearea from 212 to 174m2 /g with the addition of 2 wt.% Pto NiMo/Al2O3. The pore volume and pore diameter of allcatalysts varied between 0.42 and 0.52 cm3 /g, and 91 and107 Å, respectively.
3.1.3. Temperature programmed reduction
Temperature programmed reduction (TPR) analysis wasperformed to determine the nature of different oxide speciespresent on the calcined catalyst surface as well as to study
8/13/2019 Referensi HDO
http://slidepdf.com/reader/full/referensi-hdo 5/15
D. Ferdous et al. / Applied Catalysis A: General 260 (2004) 137–151 141
the reducibility of the catalyst. TPR has been shown tobe a sensitive technique for studying reducibility [21] andhas been applied successfully for the characterization of CoMo/Al2O3 [22], NiO/Al2O3 [23], MoO3 /Al2O3 [23,24],and NiMo/Al2O3 [23].
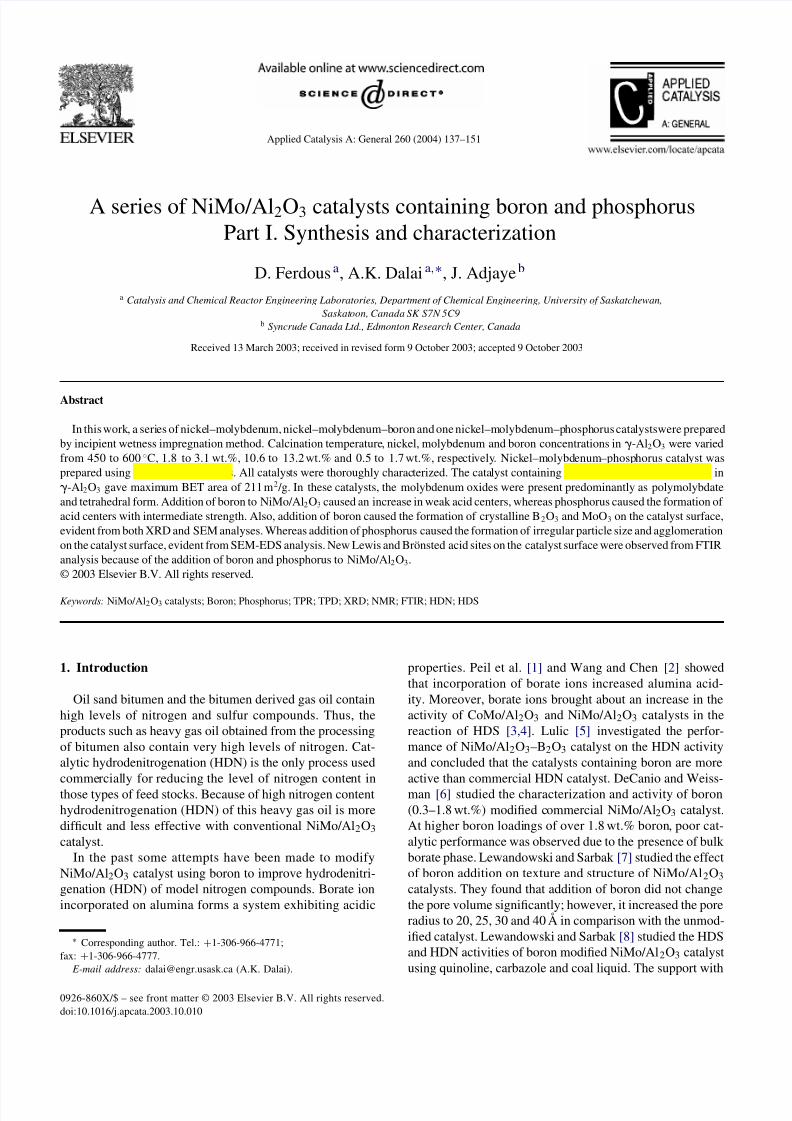
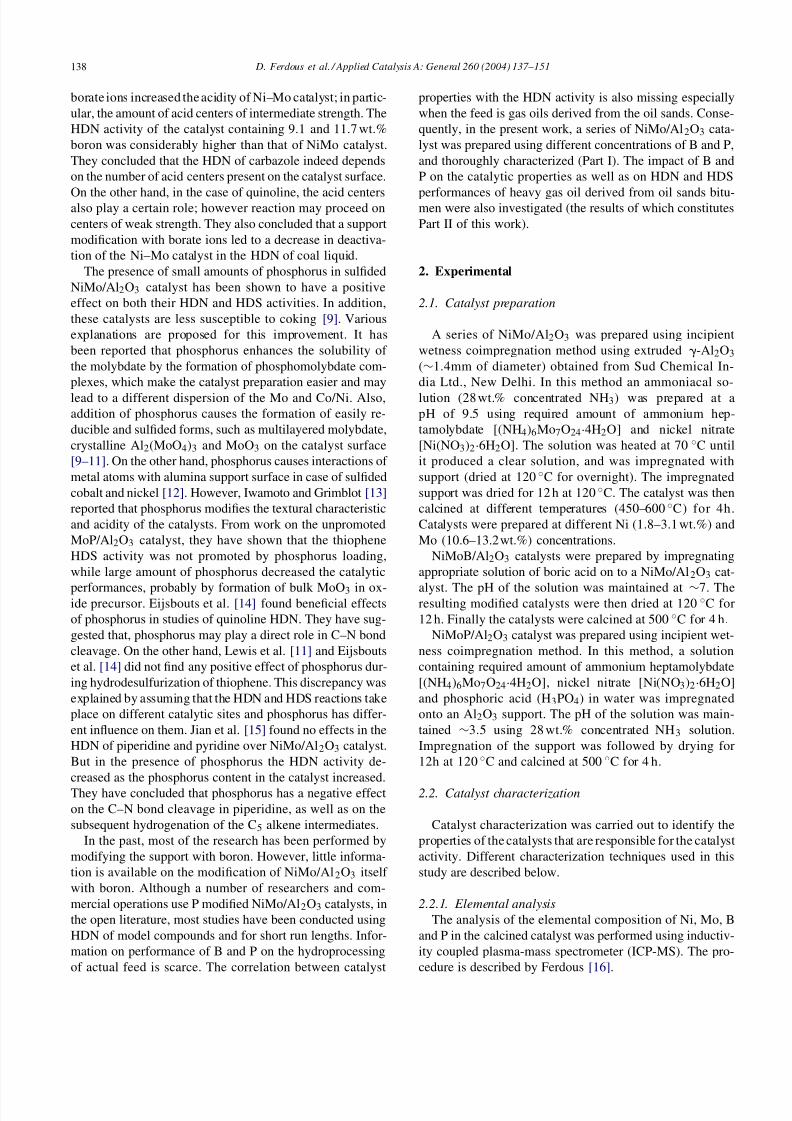
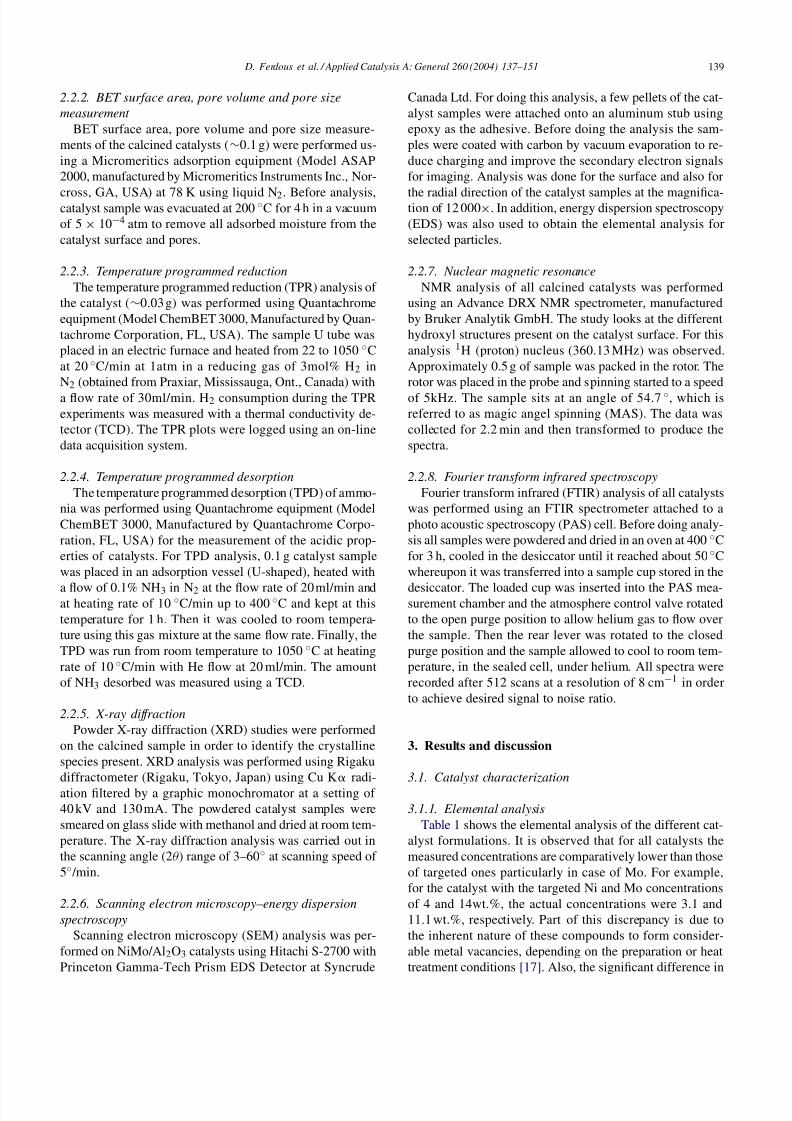
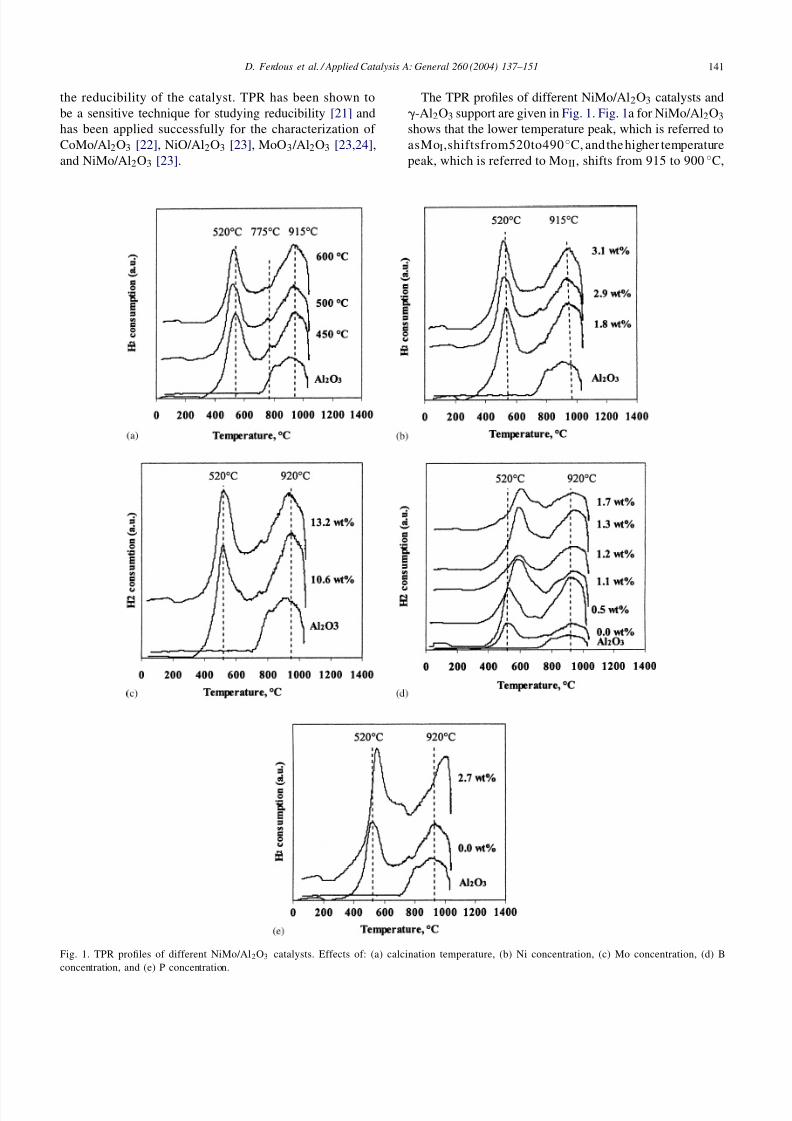
Fig. 1. TPR profiles of different NiMo/Al2O3 catalysts. Effects of: (a) calcination temperature, (b) Ni concentration, (c) Mo concentration, (d) Bconcentration, and (e) P concentration.
The TPR profiles of different NiMo/Al2O3 catalysts and-Al2O3 support are given in Fig. 1. Fig. 1a for NiMo/Al2O3shows that the lower temperature peak, which is referred toasMoI,shiftsfrom520to490◦C, andthe higher temperaturepeak, which is referred to MoII, shifts from 915 to 900 ◦C,
8/13/2019 Referensi HDO
http://slidepdf.com/reader/full/referensi-hdo 6/15
142 D. Ferdous et al. / Applied Catalysis A: General 260 (2004) 137–151
with the increase in calcination temperature from 450 to600 ◦C. The peak at 520 ◦C is probably the result of the par-tial reduction of well-dispersed polymolybdate-like species,i.e. Mo6+
→ Mo4+. The peak at 775 ◦C (see Fig. 1a) isbecause of the reduction of Ni [19]. Its intensity decreasedsignificantly with the increase in calcination temperature
from 450 to 600◦
C. Brito and Laine [19] reported that atthe calcination temperature <600 ◦C, all Ni reduced underthe Nii band. The reducibility of Ni depends upon the cal-cination temperature of the catalyst. It was reported that inNiMo/Al2O3 catalyst, most of the Ni reduced simultane-ously with Mo under the low temperature peak [25]. But athigher calcination temperatures >600 ◦C, essentially all thenickel present reduces with MoII [19]. In contrast, Park et al.[23] reported that the peak at 775 ◦C is probably becauseof the further reduction of polymolybdate, which exerts astronger interaction with the support. The peak at highertemperature (915 ◦C) represents complete reduction of poly-molybdate plus the reduction of the tetrahedrally coordinated
molybdate group i.e. Mo6+ → Mo4+ and Mo4+ → Mo0+
[23]. Fig. 1a also shows that increase in calcination temper-ature caused a decrease in peak intensity at 520 ◦C, proba-bly because of Mo loss at the higher calcination temperature[26]. However, hydrogen consumption for these catalystsdid not change significantly with the increase in calcinationtemperature from 450 to 600 ◦C, which remained at ∼0.2l/gof catalyst for all calcination temperatures.
The lower temperature peak shifts from 520 to 490 ◦C andpeak intensity decreased with increase in Ni concentrationfrom 1.8 to 3.1 wt.% (catalysts B, D and E) but the highertemperature peak did not shift (Fig. 1b). The hydrogen con-
sumption for these catalysts decreased from 0.3 to 0.2 l/gof catalyst with the increase in Ni concentrations from 1.8to 3.1wt.%. This may be due to the interaction betweenNi and Mo is suggested by Dufresne et al. [27], producingNi–Mo–O phase, which is the precursor of the Ni–Mo–S,known as the active site for HDN reaction. A possible roleof Ni in enhancing Mo reducibility could be to facilitatehydrogen activation (i.e. decomposition of H2 to atomic hy-drogen and migration of polymolybdates e.g. by spill over)[19]. Higher Mo concentration did not change the reductiontemperature of the lower temperature peak but decreased thereduction temperature for higher temperature peak slightlyfrom 920 to 915 ◦C (Fig. 1c). No significant change in totalhydrogen consumption (∼0.2 l/g of catalyst) was observedfor these catalysts.
The effects of B concentration on TPR profile are given inFig. 1d, which shows that the addition of B to NiMo/Al2O3catalyst (catalysts G–K) decreases the reducibility of thecatalyst. The reduction temperature of polymolybdate in-creased from 520 to 605 ◦C with increase in boron concen-tration from 0 to 1.7 wt.%. Increase in boron concentrationalso changed the molybdenum oxide structure and causedthe formation of less-reducible molybdenum borate. This isconfirmed by DeCanio and Weissman [6] using FTIR tech-niques by NO adsorption that addition of B up to 0.3 wt.%
to NiMo/Al2O3 catalyst changes molybdenum oxide struc-ture, rendering it more susceptible to reduction. However,by adding B from 0.3 to 1.8 wt.%, decreased the intensityof the Ni–Mo band which indicates that some molybdenumconverts to a less easily reducible form such as molybde-num borate. This study confirms the decrease in reducibil-
ity of B (0.6–1.7 wt.%) containing catalysts. The hydrogenconsumption for these catalysts increased from 0.2 to 0.5 l/gof catalyst with the increase in B concentration from 0 to1.7 wt.%. This indicates that addition of B to NiMo/Al2O3catalyst caused the migration of higher amounts of Ni andMo oxides to the catalyst surface.
The reduction temperature of polymolybdate andtetramolybdate increased from 520 to 550◦C and 920to 1000 ◦C with the addition of 2.7wt.% phosphorus toNiMo/Al2O3 catalyst (see Fig. 1e). The reducibility of thecatalyst decreased probably because of the strong interac-tion of Ni with aluminum phase, and because of the forma-tion of AlPO4 at the support surface [12]. The hydrogen
consumption increased from 0.2 to 0.4 l/g of catalyst withthe incorporation of 2.7 wt.% P to NiMo/Al2O3 catalyst.
3.1.4. Temperature programmed desorption
Temperature programmed desorption (TPD) of adsorbedammonia was used to measure the acidic properties of thecatalyst. NH3 can be absorbed on the catalyst surface phys-ically and chemically. The physically absorbed NH3 is des-orbed at lower temperature whereas chemically absorbedNH3 is desorbed at higher temperature. From the literature,it is observed that there are three ranges of temperature forthe desorption of ammonia, namely, 20–200, 200–350 and
350–550◦
C, which correspond to weak, intermediate, andstrong acid centers, respectively [8]. On the other hand, thedesorption peak intensity and area measures the number of acid sites, i.e. if the peak intensity and area are high, thenumber of acid sites is more and vice versa [28].
The profiles in Fig. 2 show the acid center for support(Al2O3) as well as for different NiMo/Al2O3 catalysts cal-cined at different temperatures and those containing dif-ferent concentrations of Ni, Mo, B, and P. From this fig-ure, two peaks from 100 to 400 ◦C and 500 to 1000 ◦Cfor the desorption of NH3 are observed, corresponding toweak–intermediate and strong acid centers. The figure showsthat the intermediate acid strength increased and the strengthof strong acid centers decreased by impregnation of sup-port with molybdenum, nickel, boron, and phosphorus ions,which are evident from the peak intensity and area.
The effect of calcination temperature on TPD profileshows that increase in calcination temperature from 450 to600 ◦C caused an increase in intermediate acid centers but adecrease in strong acid centers (Fig. 2a f or catalysts A–C).Fig. 2b shows that the increase in Ni concentration causeda decrease in number of acid sites as well as in intermediateacid strength. However, the number of strong acid sites,and those with intermediate and higher strength of supportincreased with increase in Ni concentration. The increase

8/13/2019 Referensi HDO
http://slidepdf.com/reader/full/referensi-hdo 7/15
D. Ferdous et al. / Applied Catalysis A: General 260 (2004) 137–151 143
Fig. 2. TPD profile of different NiMo/Al2O3 catalysts. Effects of: (a) calcination temperature, (b) Ni concentration, (c) Mo concentration, (d) Bconcentration, and (e) P concentration.
in Mo concentration from 10.6 to 13.2 wt.% caused an in-crease in number of intermediate and strong acid centers(see Fig. 2c).
Increase in boron loading from 0.5 to 1.3wt.% (cata-lysts G–J) caused the formation of intermediate acid centers,
whereas 1.7 wt.% boron (catalyst K) concentration causedthe formation of weak acid centers as observed from theirdesorption peak temperature (Fig. 2d). However, addition of phosphorus to NiMo/Al2O3 catalyst (catalyst L) caused theformation of intermediate acid centers (Fig. 2e).
8/13/2019 Referensi HDO
http://slidepdf.com/reader/full/referensi-hdo 8/15
144 D. Ferdous et al. / Applied Catalysis A: General 260 (2004) 137–151
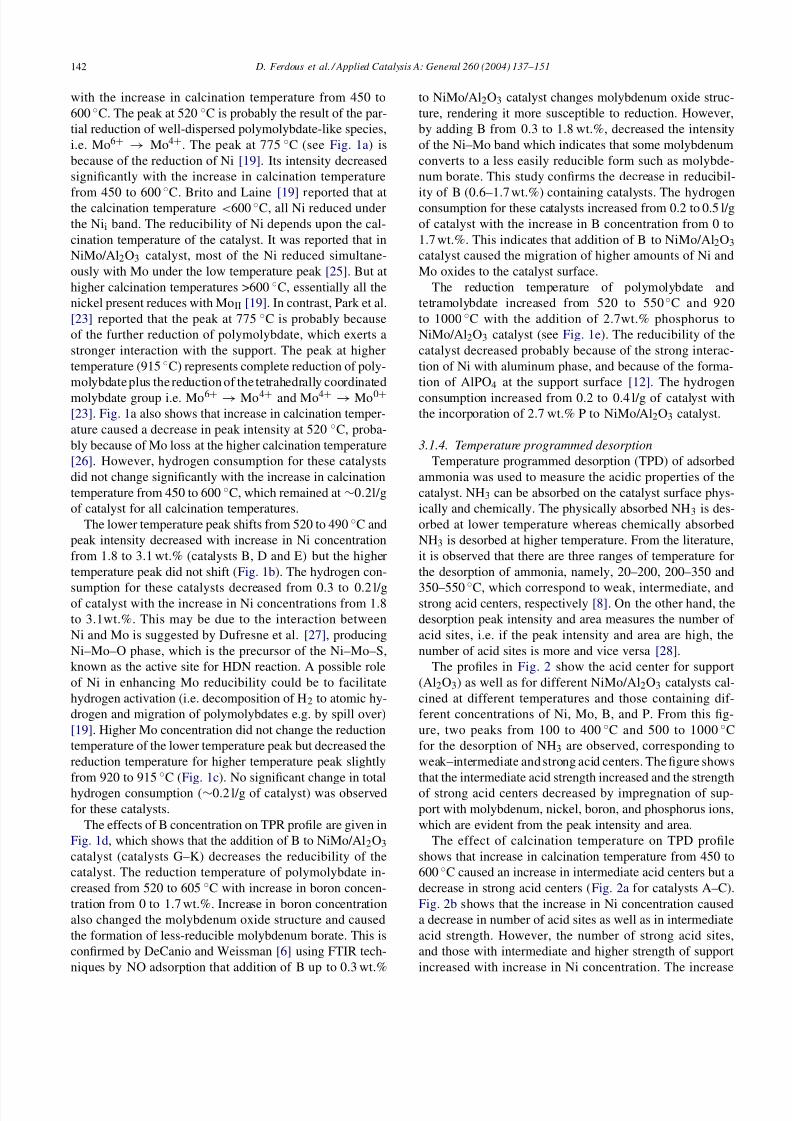
3.1.5. Scanning electron microscopy–energy dispersion
spectroscopy
Scanning electron micrographs are used to study the sur-face morphology of the fresh catalysts whereas EDS is usedto quantify the elemental composition of a single particlepresent on the catalyst surface.
With reference to SEM micrographs from the surfacesof samples calcined in the range of 450–600 ◦C (catalystsA–C), it is seen that an increase in calcination temperatureup to 500 ◦C caused an increase in particle size from ∼0.2to ∼0.4m (Fig. 3b and c), after which the particle sizedecreased to∼0.25m (Fig. 3d). At 500 ◦C, sintering due toAl2O3 transformation by forming Al2(MoO4)3 might playa role in enhancing the particle size. Decrease in particlesize at >500 ◦C is probably because of sublimation of MoO3
Fig. 3. Effects of calcination temperatures on surface morphology of different NiMo/Al 2O3 catalysts: (a) -Al2O3, (b) 450 ◦C, (c) 500 ◦C, and (d) 600 ◦C.
as reported by Kasztelan et al. [29]. It is seen that at thecalcination temperature of 500 ◦C (Fig. 3c), the particle sizesare more uniform, which may lead to efficient reduction of metals during hydrotreating process. This indicates that theoptimum calcination temperature may be 500 ◦C.
Increase in Ni concentration in NiMo/Al2O3 catalyst (cat-
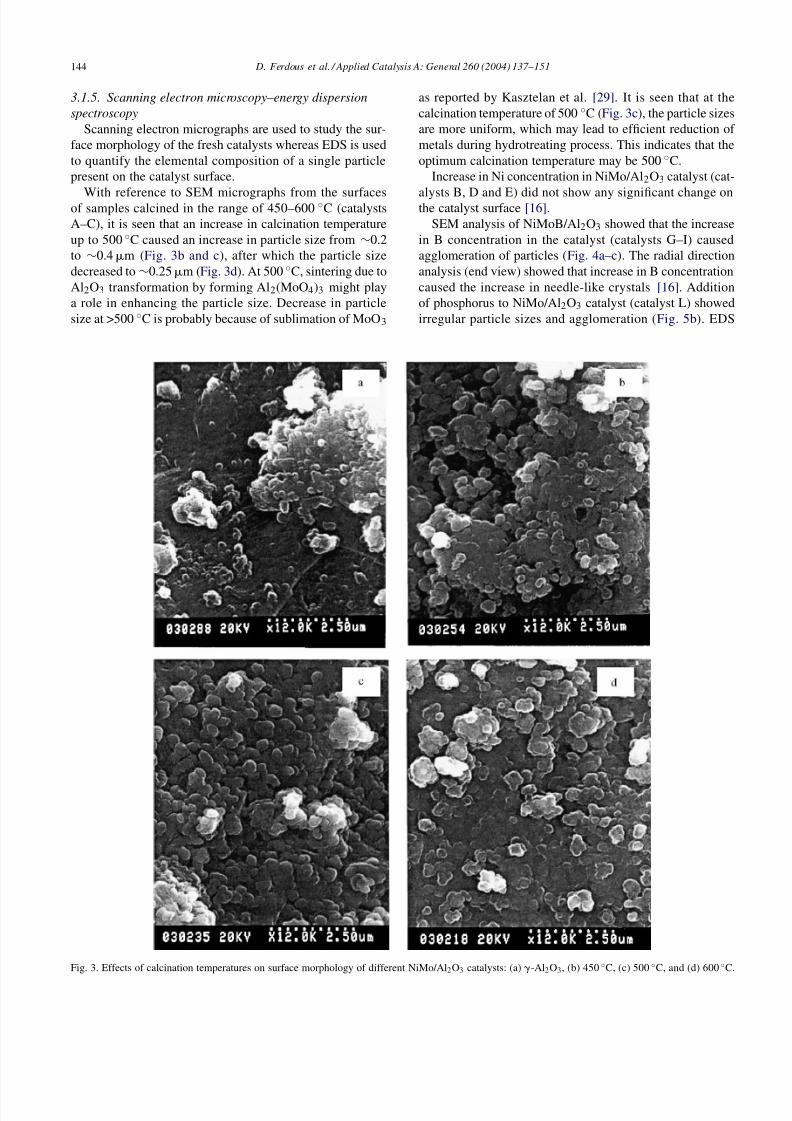
alysts B, D and E) did not show any significant change onthe catalyst surface [16].SEM analysis of NiMoB/Al2O3 showed that the increase
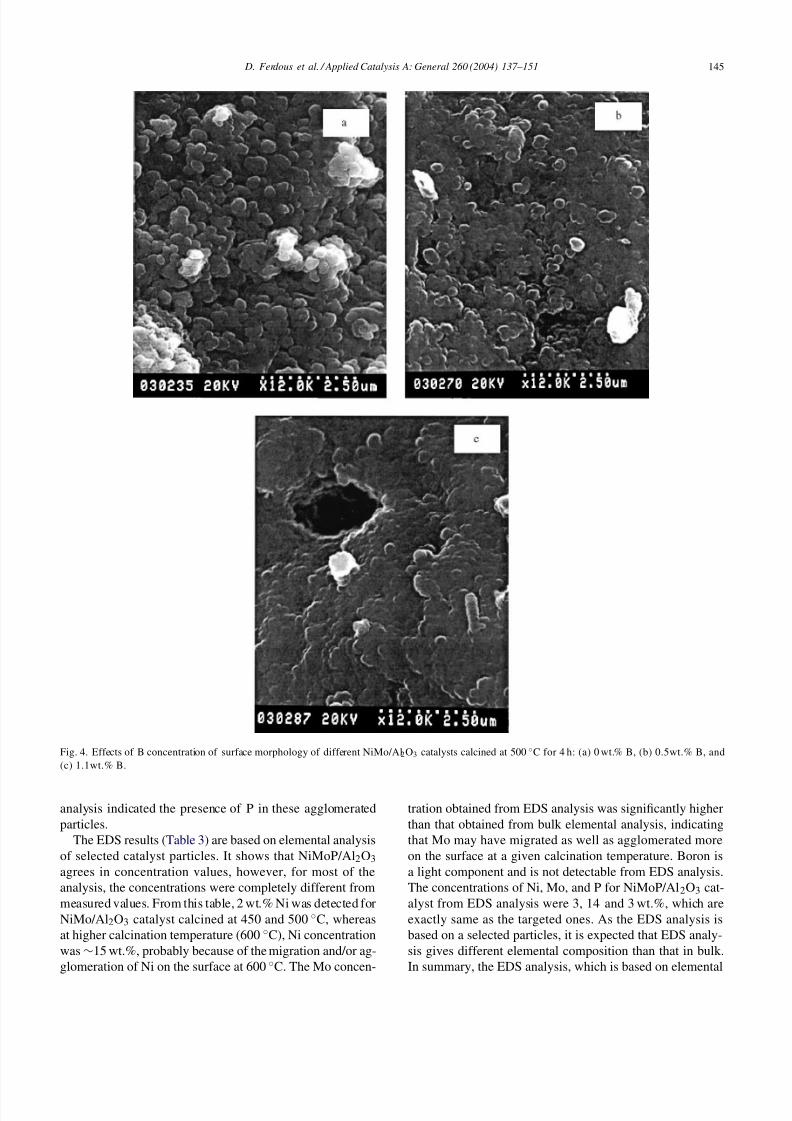
in B concentration in the catalyst (catalysts G–I) causedagglomeration of particles (Fig. 4a–c). The radial directionanalysis (end view) showed that increase in B concentrationcaused the increase in needle-like crystals [16]. Additionof phosphorus to NiMo/Al2O3 catalyst (catalyst L) showedirregular particle sizes and agglomeration (Fig. 5b). EDS
8/13/2019 Referensi HDO
http://slidepdf.com/reader/full/referensi-hdo 9/15
D. Ferdous et al. / Applied Catalysis A: General 260 (2004) 137–151 145
Fig. 4. Effects of B concentration of surface morphology of different NiMo/Al2O3 catalysts calcined at 500 ◦C for 4 h: (a) 0 wt.% B, (b) 0.5wt.% B, and(c) 1.1wt.% B.
analysis indicated the presence of P in these agglomeratedparticles.
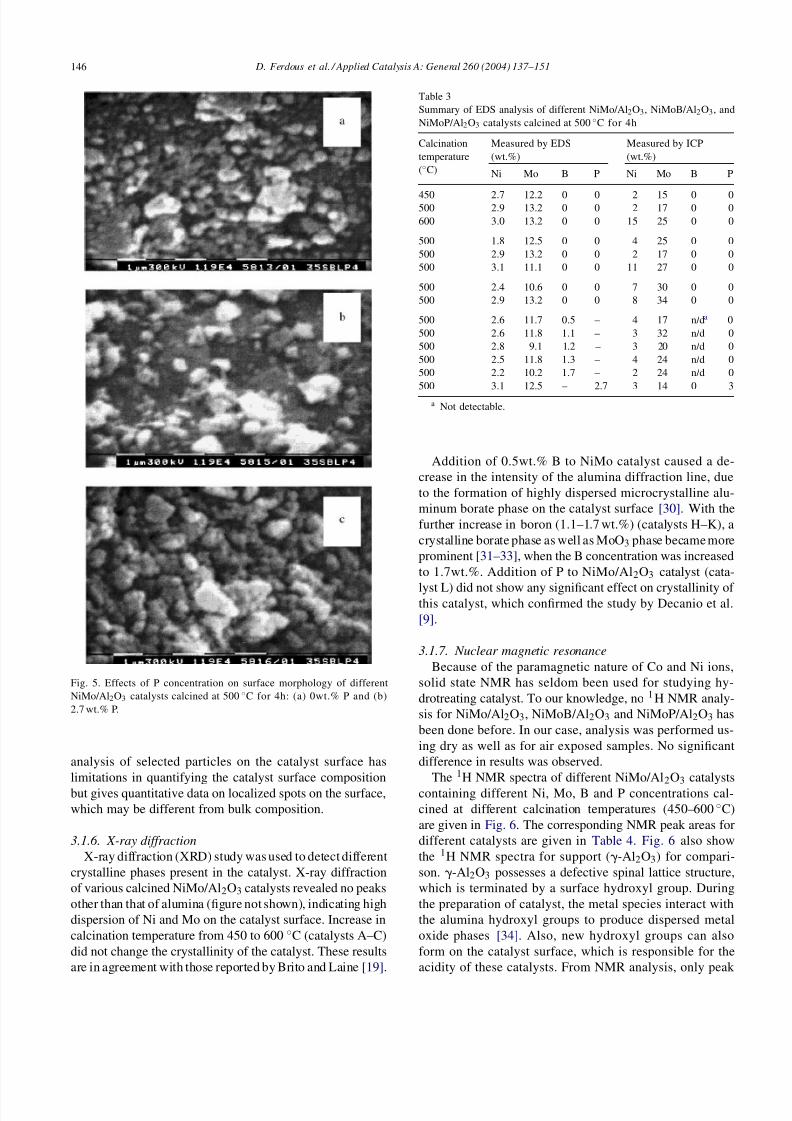
The EDS results (Table 3) are based on elemental analysisof selected catalyst particles. It shows that NiMoP/Al2O3agrees in concentration values, however, for most of theanalysis, the concentrations were completely different frommeasured values. From this table, 2 wt.% Ni was detected forNiMo/Al2O3 catalyst calcined at 450 and 500 ◦C, whereasat higher calcination temperature (600 ◦C), Ni concentrationwas∼15 wt.%, probably because of the migration and/or ag-glomeration of Ni on the surface at 600 ◦C. The Mo concen-
tration obtained from EDS analysis was significantly higherthan that obtained from bulk elemental analysis, indicatingthat Mo may have migrated as well as agglomerated moreon the surface at a given calcination temperature. Boron isa light component and is not detectable from EDS analysis.The concentrations of Ni, Mo, and P for NiMoP/Al2O3 cat-alyst from EDS analysis were 3, 14 and 3 wt.%, which areexactly same as the targeted ones. As the EDS analysis isbased on a selected particles, it is expected that EDS analy-sis gives different elemental composition than that in bulk.In summary, the EDS analysis, which is based on elemental
8/13/2019 Referensi HDO
http://slidepdf.com/reader/full/referensi-hdo 10/15
146 D. Ferdous et al. / Applied Catalysis A: General 260 (2004) 137–151
Fig. 5. Effects of P concentration on surface morphology of differentNiMo/Al2O3 catalysts calcined at 500 ◦C for 4h: (a) 0wt.% P and (b)2.7 wt.% P.
analysis of selected particles on the catalyst surface haslimitations in quantifying the catalyst surface compositionbut gives quantitative data on localized spots on the surface,which may be different from bulk composition.
3.1.6. X-ray diffraction
X-ray diffraction (XRD) study was used to detect differentcrystalline phases present in the catalyst. X-ray diffractionof various calcined NiMo/Al2O3 catalysts revealed no peaksother than that of alumina (figure not shown), indicating highdispersion of Ni and Mo on the catalyst surface. Increase incalcination temperature from 450 to 600 ◦C (catalysts A–C)did not change the crystallinity of the catalyst. These resultsare in agreement with those reported by Brito and Laine [19].
Table 3Summary of EDS analysis of different NiMo/Al2O3, NiMoB/Al2O3, andNiMoP/Al2O3 catalysts calcined at 500 ◦C for 4h
Calcinationtemperature(◦C)
Measured by EDS(wt.%)
Measured by ICP(wt.%)
Ni Mo B P Ni Mo B P
450 2.7 12.2 0 0 2 15 0 0500 2.9 13.2 0 0 2 17 0 0600 3.0 13.2 0 0 15 25 0 0
500 1.8 12.5 0 0 4 25 0 0500 2.9 13.2 0 0 2 17 0 0500 3.1 11.1 0 0 11 27 0 0
500 2.4 10.6 0 0 7 30 0 0500 2.9 13.2 0 0 8 34 0 0
500 2.6 11.7 0.5 – 4 17 n/da 0500 2.6 11.8 1.1 – 3 32 n/d 0500 2.8 9.1 1.2 – 3 20 n/d 0500 2.5 11.8 1.3 – 4 24 n/d 0500 2.2 10.2 1.7 – 2 24 n/d 0500 3.1 12.5 – 2.7 3 14 0 3
a Not detectable.
Addition of 0.5wt.% B to NiMo catalyst caused a de-crease in the intensity of the alumina diffraction line, dueto the formation of highly dispersed microcrystalline alu-minum borate phase on the catalyst surface [30]. With thefurther increase in boron (1.1–1.7 wt.%) (catalysts H–K), acrystalline borate phase as well as MoO3 phase became moreprominent [31–33], when the B concentration was increasedto 1.7wt.%. Addition of P to NiMo/Al2O3 catalyst (cata-
lyst L) did not show any significant effect on crystallinity of this catalyst, which confirmed the study by Decanio et al.[9].
3.1.7. Nuclear magnetic resonance
Because of the paramagnetic nature of Co and Ni ions,solid state NMR has seldom been used for studying hy-drotreating catalyst. To our knowledge, no 1 H NMR analy-sis for NiMo/Al2O3, NiMoB/Al2O3 and NiMoP/Al2O3 hasbeen done before. In our case, analysis was performed us-ing dry as well as for air exposed samples. No significantdifference in results was observed.
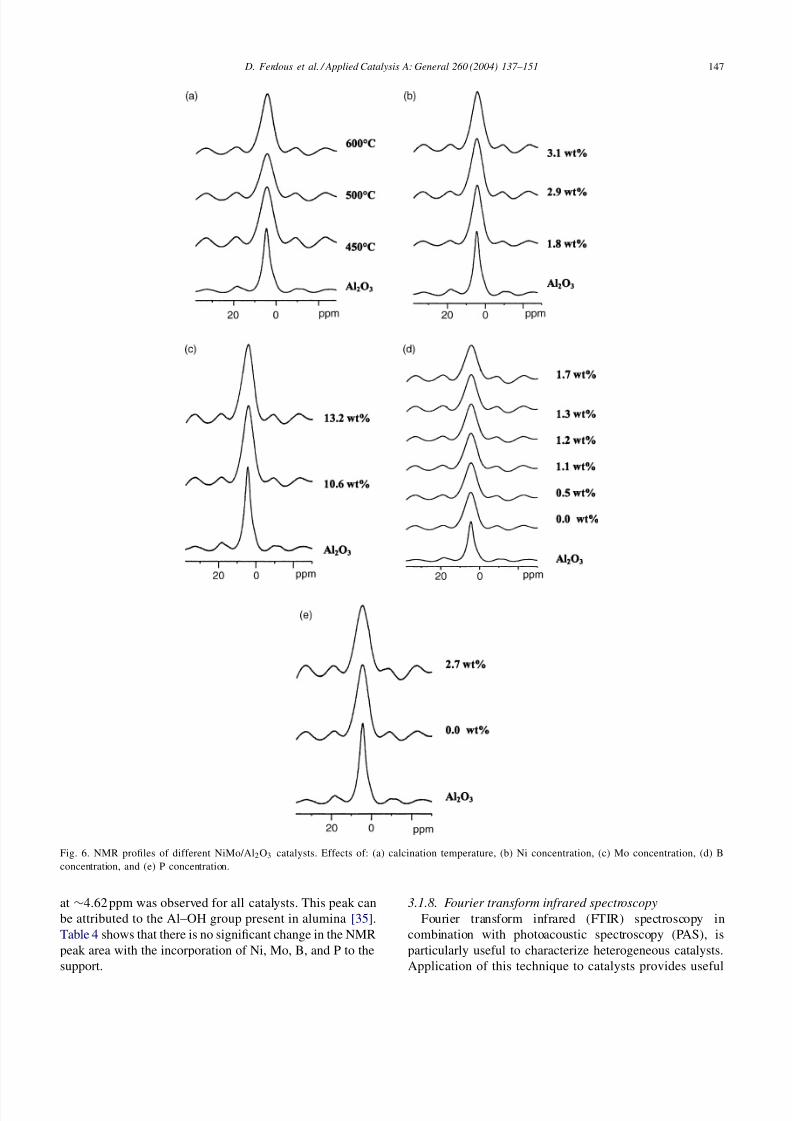
The 1H NMR spectra of different NiMo/Al2O3 catalystscontaining different Ni, Mo, B and P concentrations cal-cined at different calcination temperatures (450–600 ◦C)are given in Fig. 6. The corresponding NMR peak areas fordifferent catalysts are given in Table 4. Fig. 6 also showthe 1H NMR spectra for support (-Al2O3) for compari-son. -Al2O3 possesses a defective spinal lattice structure,which is terminated by a surface hydroxyl group. Duringthe preparation of catalyst, the metal species interact withthe alumina hydroxyl groups to produce dispersed metaloxide phases [34]. Also, new hydroxyl groups can alsoform on the catalyst surface, which is responsible for theacidity of these catalysts. From NMR analysis, only peak
8/13/2019 Referensi HDO
http://slidepdf.com/reader/full/referensi-hdo 11/15
D. Ferdous et al. / Applied Catalysis A: General 260 (2004) 137–151 147
Fig. 6. NMR profiles of different NiMo/Al2O3 catalysts. Effects of: (a) calcination temperature, (b) Ni concentration, (c) Mo concentration, (d) Bconcentration, and (e) P concentration.
at ∼4.62 ppm was observed for all catalysts. This peak canbe attributed to the Al–OH group present in alumina [35].Table 4 shows that there is no significant change in the NMRpeak area with the incorporation of Ni, Mo, B, and P to thesupport.
3.1.8. Fourier transform infrared spectroscopy
Fourier transform infrared (FTIR) spectroscopy incombination with photoacoustic spectroscopy (PAS), isparticularly useful to characterize heterogeneous catalysts.Application of this technique to catalysts provides useful
8/13/2019 Referensi HDO
http://slidepdf.com/reader/full/referensi-hdo 12/15
148 D. Ferdous et al. / Applied Catalysis A: General 260 (2004) 137–151
Table 4NMR peak area of different NiMo/Al2O3, NiMoB/Al2O3 and NiMoP/ Al2O3 catalysts calcined for 4h
Ni Mo(wt.%)
B P Calcinationtemperature (◦C)
NMR peakarea (a.u.)
Support – – – – 1.92.7 12.2 – – 450 2.12.9 13.2 – – 500 1.93.0 13.2 – – 600 2.0
1.8 12.5 – – 500 2.02.9 13.2 – – 500 1.93.1 11.1 – – 500 2.1
2.4 10.6 – – 500 2.12.9 13.2 – – 500 1.9
2.6 11.7 0.5 – 500 2.12.6 11.8 1.1 – 500 2.22.8 9.1 1.2 – 500 2.12.5 11.8 1.3 – 500 2.22.2 10.2 1.7 – 500 2.23.1 12.5 – 2.7 500 2.2
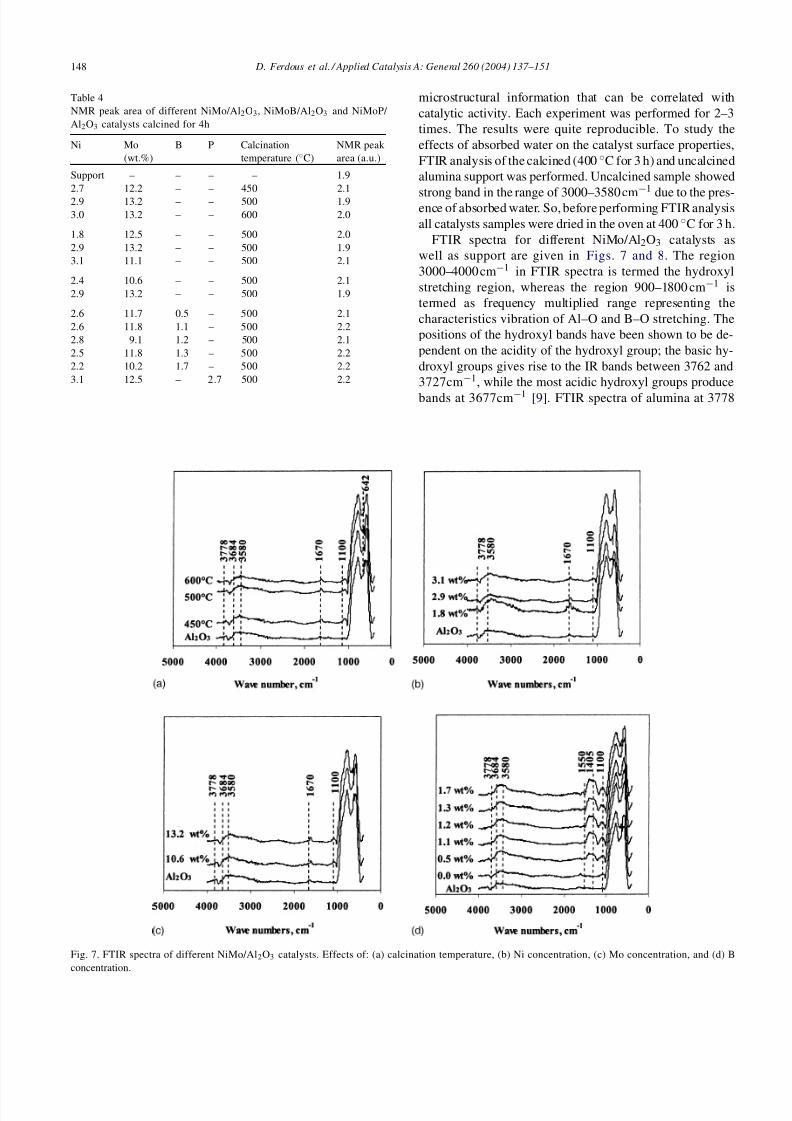
Fig. 7. FTIR spectra of different NiMo/Al2O3 catalysts. Effects of: (a) calcination temperature, (b) Ni concentration, (c) Mo concentration, and (d) Bconcentration.
microstructural information that can be correlated withcatalytic activity. Each experiment was performed for 2–3times. The results were quite reproducible. To study theeffects of absorbed water on the catalyst surface properties,FTIR analysis of the calcined (400 ◦C for 3 h) and uncalcinedalumina support was performed. Uncalcined sample showed
strong band in the range of 3000–3580cm−1
due to the pres-ence of absorbed water. So, before performing FTIR analysisall catalysts samples were dried in the oven at 400 ◦C for 3 h.
FTIR spectra for different NiMo/Al2O3 catalysts aswell as support are given in Figs. 7 and 8. The region3000–4000cm−1 in FTIR spectra is termed the hydroxylstretching region, whereas the region 900–1800 cm−1 istermed as frequency multiplied range representing thecharacteristics vibration of Al–O and B–O stretching. Thepositions of the hydroxyl bands have been shown to be de-pendent on the acidity of the hydroxyl group; the basic hy-droxyl groups gives rise to the IR bands between 3762 and3727cm−1, while the most acidic hydroxyl groups produce
bands at 3677cm−1 [9]. FTIR spectra of alumina at 3778
8/13/2019 Referensi HDO
http://slidepdf.com/reader/full/referensi-hdo 13/15
D. Ferdous et al. / Applied Catalysis A: General 260 (2004) 137–151 149
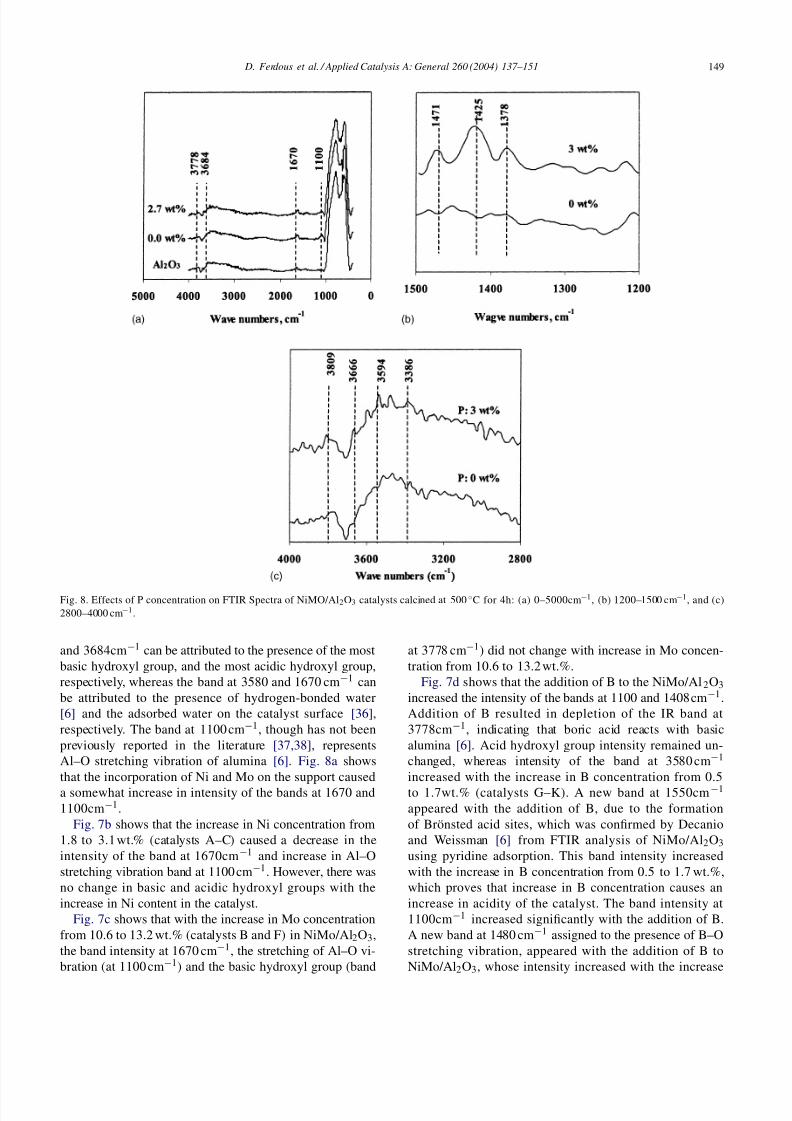
Fig. 8. Effects of P concentration on FTIR Spectra of NiMO/Al2O3 catalysts calcined at 500 ◦C for 4h: (a) 0–5000cm−1, (b) 1200–1500 cm−1, and (c)2800–4000 cm−1.
and 3684cm−1 can be attributed to the presence of the mostbasic hydroxyl group, and the most acidic hydroxyl group,respectively, whereas the band at 3580 and 1670 cm−1 canbe attributed to the presence of hydrogen-bonded water[6] and the adsorbed water on the catalyst surface [36],respectively. The band at 1100 cm−1, though has not beenpreviously reported in the literature [37,38], representsAl–O stretching vibration of alumina [6]. Fig. 8a showsthat the incorporation of Ni and Mo on the support causeda somewhat increase in intensity of the bands at 1670 and1100cm−1.
Fig. 7b shows that the increase in Ni concentration from1.8 to 3.1wt.% (catalysts A–C) caused a decrease in theintensity of the band at 1670cm−1 and increase in Al–Ostretching vibration band at 1100 cm−1. However, there wasno change in basic and acidic hydroxyl groups with theincrease in Ni content in the catalyst.
Fig. 7c shows that with the increase in Mo concentrationfrom 10.6 to 13.2 wt.% (catalysts B and F) in NiMo/Al2O3,the band intensity at 1670 cm−1, the stretching of Al–O vi-bration (at 1100 cm−1) and the basic hydroxyl group (band
at 3778 cm−1) did not change with increase in Mo concen-tration from 10.6 to 13.2 wt.%.
Fig. 7d shows that the addition of B to the NiMo/Al2O3increased the intensity of the bands at 1100 and 1408cm−1.Addition of B resulted in depletion of the IR band at3778cm−1, indicating that boric acid reacts with basicalumina [6]. Acid hydroxyl group intensity remained un-changed, whereas intensity of the band at 3580 cm−1
increased with the increase in B concentration from 0.5to 1.7wt.% (catalysts G–K). A new band at 1550cm−1
appeared with the addition of B, due to the formationof Brönsted acid sites, which was confirmed by Decanioand Weissman [6] from FTIR analysis of NiMo/Al2O3using pyridine adsorption. This band intensity increasedwith the increase in B concentration from 0.5 to 1.7 wt.%,which proves that increase in B concentration causes anincrease in acidity of the catalyst. The band intensity at1100cm−1 increased significantly with the addition of B.A new band at 1480 cm−1 assigned to the presence of B–Ostretching vibration, appeared with the addition of B toNiMo/Al2O3, whose intensity increased with the increase
8/13/2019 Referensi HDO
http://slidepdf.com/reader/full/referensi-hdo 14/15
150 D. Ferdous et al. / Applied Catalysis A: General 260 (2004) 137–151
in B concentration. The band can also be assigned to Lewisacid sites, as indicated by Decanio and Weissman [6].
Fig. 8a shows no significant effect of P on FTIR spec-tra. However, when the spectra are enlarged for the range of 1200–1550 and 2800–4000 cm−1 (Fig. 8b and c), some dif-ferences appear. From Fig. 8b, it is seen that the addition of
P to NiMo/Al2O3 catalyst (catalyst L) caused the formationof bands at 1378, 1425, and 1471cm−1, probably due to theformation of new Lewis acid sites on the catalyst surface.The sharp band at 3666cm−1(see Fig. 8c) could be due tothe –OH associated with phosphate [9]. This –OH group onthe catalyst surface is responsible for the formation of Brön-sted acid sites. The bands at 3594 and 3386 cm−1 could bedue to the formation of new –OH groups on the catalystsurface in the presence of phosphorus.
3.2. Implication of the characterization results
on HDN activity
There was no significant difference in surface areawith the addition of small concentrations of B and P toNiMo/Al2O3 catalyst. However, increase in B concentra-tion above 1.3 wt.% caused a significant decrease in surfacearea. From the literature, it is observed that higher HDNactivity is related to decrease in surface area. Lewandowskiand Sarbak [7] reported a decrease in surface area and an in-crease in HDN activity with an increase in B concentrationfrom 2.8 to 6.3 wt.%. Similarly, Jian et al. [15] also reporteda decrease in surface area and increase in HDN activitywith the addition of 2 wt.% P to NiMo/Al2O3. However, itis difficult to correlate the HDN activity with surface area,
since HDN activity is dependent not only on the physicalsurface area but also on the other surface physicochemicalproperties of the catalyst.
Addition of B and P caused a decrease in reducibilityof the catalyst. The reducibility of NiMo oxide catalystsfavored by their conversions to sulfided state is an impor-tant factor for the HDN activity. Several attempts have beenmade to correlate the reducibility of oxidic NiMo catalyst tohydroprocessing activity of their sulfided state [25]. It maybe noted that in Mo supported catalysts and under normalsulfiding conditions, O–S exchange is a more important re-action than reduction with hydrogen [26]. Thus, it is notgenerally true that phases more easily reducible are moresulfidable and/or active after sulfidation [19].
It is indicated in the literature that high activity for HDNis associated with an increase in the number of acid centersof weak and intermediate strength [8]. From TPD analy-sis it was observed that addition of B from 0.5 to 1.2 wt.%to NiMo/Al2O3 catalyst led to the formation of strong acidcenters and the further addition of B caused the formationof weak acid centers. So, higher HDN activity can be antic-ipated from these catalysts.
It is known that two types of reactions occur during HDNreaction: (1) hydrogenation and (2) hydrogenolysis. Two cat-alytic sites have been proposed in the literature to account
for these two types of reaction. These two catalytic sites canbe viewed as an equilibrium between Lewis (L) and Brön-sted (B) acid sites [39,40]:
Kwart et al. [39] reported that the B-sites are responsiblefor hydrogenation reactions whereas L-sites for hydrogenol-ysis. So, B-sites would act as the electron-withdrawing sitesfor hydrogenation reactions and L-sites would act as theelectron-donating sites for hydrogenolysis of Csp2–X bonds[41]. Consequently, high HDN activity of NiMoB/Al2O3and NiMoP/Al2O3 is anticipated because of the formationof new Lewis and Brönsted sites on these catalysts and theacidity of the catalyst would increase with the increase in Bconcentration from 0.5 to 1.7 wt.%, as is evident from FTIRanalysis.
It is known that addition of P to NiMo/Al2O3 has a ge-ometric effect, such as an increase in the number of stacks[42]. When H3PO4 is used during catalyst preparation,AlPO4 is formed by partial solubilization of Al cations[12], which increases the amount of molybdenum fractionsin easily sulfidable forms, such as multilayered molybdateor MoO3 [10]. Large nitrogen containing compounds, suchas heavy gas oil molecules, can better coordinate to theactive sites at the top of the MoS2 stacks than to sites close
to the Al2O3 surface [12]. So, it can be anticipated that theHDN activity of B and P containing NiMo/Al2O3 catalystswill give higher HDN activity of heavy gas oil than thosewithout B and P. The reactivity test of these catalysts willbe presented in Part II of this paper.
4. Conclusions
A number of NiMo/Al2O3 catalysts promoted with B andP were prepared and extensively characterized. The maxi-mum BET area of 211m2 /g was obtained for the catalystcontaining 10.6wt.% Mo and 2.4 wt.% Ni calcined at 500◦Cfor 4 h. In these catalysts, polymolybdenum and tetramolyb-denum oxides were predominantly present. Due to the ad-dition of Ni and Mo to support, the acidity on the catalystsurface decreased to some extent. However, the addition of B from 0.5 to 1.2 wt.% to NiMo/Al2O3 catalyst led to theformation of strong acid centers of intermediate strength andthe further addition of B caused the formation of weak acidcenters of intermediate strength. SEM-EDS analyses indi-cated the formation of crystalline B2O3 and MoO3 due toaddition of B, whereas addition of P caused the formationirregular particle size and agglomeration on the catalyst sur-face. NMR analysis showed the presence of Al–OH groups
8/13/2019 Referensi HDO
http://slidepdf.com/reader/full/referensi-hdo 15/15
D. Ferdous et al. / Applied Catalysis A: General 260 (2004) 137–151 151
on the catalyst surface. No characteristic peak for B–OHwas observed for NiMoB/Al2O3 catalyst. New Lewis andBrönsted acid sites were observed from FTIR analysis of NiMoB/Al2O3 and NiMoP/Al2O3, which complemented theresults obtained from TPD analysis.
Acknowledgements
The financial supports to A.K. Dalai from (1) NSERCCollaborative Research and Development Grant, (2) Syn-crude Canada Ltd. and NSERC IPS 2 scholarship to D. Fer-dous are acknowledged. The authors are grateful to Drs. L.S.Kotlyar and Z. Li at National Research Council, Ottawa,Canada for FTIR and to Mr. P. Abel at Syncrude ResearchCenter, Edmonton, Canada for SEM-EDS analysis.
References
[1] K. Peil, G.L. Galya, G. Marcelin, J. Catal. 115 (1989) 441.[2] J.W. Wang, W.Y. Chen, Catal. Lett. 10 (1991) 297.[3] C. Li, W.Y. Chen, J.S. Yang, C.J. Wu, Ind. Eng. Chem. Res. 32
(1993) 1573.[4] W.Y. Chen, M.C. Tsai, C. Li, Ind. Eng. Chem. Res. 33 (1994) 2040.[5] P. Lulic, Oil Gas Eur. Mag. 26 (2000) 33.[6] E.C. DeCanio, J.G. Weissman, Colloids Surf. A 105 (1995) 123.[7] M. Lewandowski, Z. Sarbak, Appl. Catal. A 156 (1997) 181.[8] M. Lewandowski, Z. Sarbak, Fuel 79 (2000) 487.[9] E.C. DeCanio, J.C. Edwars, T.R. Scalzo, D.A. Storm, J.W. Bruno,
J. Catal. 132 (1991) 498.[10] R.C. Lopez, S.G. Lopez, G.L.J. Fierro, A.A. Lopez, J. Catal. 126
(1990) 8.[11] M.J. Lewis, A.R. Kydd, M.P. Boorman, H.P. Van Rhyn, Appl. Catal.
A 84 (1992) 103.[12] H. Kraus, R. Prins, J. Catal. 170 (1997) 20.[13] R. Iwamoto, J. Grimblot, Stud. Surf. Sci. Catal. 127 (1999) 169.[14] S. Eijsbouts, M.N.J. van Gestel, R.A.J. van Veen, H.H.V. de Beer,
R. Prins, J. Catal. 131 (1991) 412.[15] M. Jian, R. Cerda, R. Prins, Bull. Soc. Chim. Belg. 104 (1995) 225.
[16] D. Ferdous, Ph.D. Thesis, University of Saskatchewan, Saskatoon,SK, 2003.
[17] C.Y. Charles, S. Ramanathan, S.T. Oyama, J. Catal. 173 (1998)1.
[18] J. Cruz, M. Avalos-Borja, R.L. Cordero, M.A. Banares, J.L.G. Fierro,J.M. Palacios, A.L. Agudo, Appl. Catal. A 224 (2002) 97.
[19] J.L. Brito, J. Laine, J. Catal. 139 (1993) 540.[20] M. Jian, R. Prins, Ind. Eng. Chem. Res. 37 (1998) 834.[21] W.N. Hurst, J.S. Gentry, A. Jones, D.B. McNicol, Catal. Rev. 24
(1982) 233.[22] P. Arnoldy, A.J. Moulijn, J. Catal. 93 (1985) 38.[23] C.Y. Park, S.E. Oh, K.H. Rhee, Ind. Eng. Chem. Res. 36 (1997)
5083.[24] R. Thomas, J.H.V.d. Beer, A.J. Moulijn, Bull. Soc. Chim. Belg. 90
(1982) 1349.[25] R. Burch, A. Collins, Appl. Catal. 18 (1985) 389.[26] P. Arnoldy, M.A.J.v.d. Heijkant, G.D.d. Bok, A.J. Moulijn, J. Catal.
92 (1985) 35.[27] P. Dufresne, E. Payen, J. Grimblot, P.J. Bonnelle, J. Phys. Chem. 85
(1981) 2344.[28] S. Kozai, H. Kabashima, H. Hattori, Fuel 79 (2000) 305.[29] S. Kasztelan, E. Payen, H. Toulhoat, J. Grimblot, P.J. Bonnelle,
Polyhedron 5 (1986) 157.[30] T. Curtin, J.B. McMonagle, B.K. Hodnett, Appl. Catal. A 93 (1992)
91.[31] D. Li, T. Sato, M. Imamura, H. Shimada, Appl. Catal. B. 16 (1998)
255.[32] K. Hada, J. Tanabe, S. Omi, M. Nagai, J. Catal. 207 (2002) 10.[33] S.K. Maity, M.S. Rana, S.K. Bej, J. Ancheyta-Juarez, G.M. Dhar,
T.S.R.P. Rao, Appl. Catal. 205 (2001) 215.[34] E.C. DeCanio, J.C. Edwards, J.W. Bruno, J. Catal. 148 (1994) 76.[35] L.J. Lakshmi, P.K. Rao, V.M. Mastikhin, A.V. Nosov, J. Phys. Chem.
97 (1993) 11373.[36] L. Pattersson, I. Anderson, L.-O. Öhman, Inorg. Chem. 25 (1986)
4726.[37] R.A.J. van Veen, M.J.A.P. Hendriks, R.R. Andréa, M.G.J.E. Romers,
E.A. Wilson, J. Phys. Chem. 94 (1990) 5282.
[38] W.-C. Cheng, P.N. Luthra, J. Catal. 109 (1988) 163.[39] H. Kwart, J. Katzer, J. Horgan, J. Phys. Chem. 86 (1982) 2641.[40] S.H. Yang, C.N. Satterfield, J. Catal. 81 (1983) 168.[41] C. Moreau, C. Aubert, R. Durand, N. Zmimita, P. Geneste, Catal.
Today 4 (1988) 117.[42] C.R. Ryan, A.R. Kemp, A.J. Smegal, R.D. Denley, E.G. Spinnler,
Adv. Hydrol. Catal. 50 (1989) 21.