Reduction of hematite (Fe2O3) to wüstite (FeO) by carbon monoxide (CO) for chemical looping...
7
Reduction of hematite (Fe 2 O 3 ) to wüstite (FeO) by carbon monoxide (CO) for chemical looping combustion Esmail R. Monazam b , Ronald W. Breault a,⇑ , Ranjani Siriwardane a a National Energy Technology Laboratory, U.S. Department of Energy, 3610 Collins Ferry Rd., Morgantown, West Virginia 26507-0880, United States b REM Engineering Services, PLLC, 3537 Collins Ferry Rd., Morgantown, West Virginia 26505, United States highlights TGA reduction of hematite (Fe 2 O 3 ) in CO (5–20%) was conducted at temperatures from 750 to 900 °C. A single reaction scheme was applied to the reduction data. The reaction is first-order. The reaction rate increases with temperature and CO concentration. article info Article history: Received 5 November 2013 Received in revised form 10 December 2013 Accepted 16 December 2013 Available online 21 December 2013 Keywords: Chemical looping combustion Carbon monoxide kinetics abstract Thermogravimetric analysis (TGA) of the reduction behavior of hematite by using continuous streams of 5%, 10%, and 20% CO concentrations in N 2 was conducted at temperatures ranging from 750 to 900 °C over ten cycles. The reduced hematite was then oxidized using dry air. The rate of reduction was determined by the sample weight loss. Analysis of the data indicated that the reduction behavior can be described by single rate-determining step and it was controlled by the chemical reaction at the particle surface. The mass spectroscopy analysis of product gas indicated that no carbon deposition was found when operating at these temperature ranges (750–900 °C). The analysis of reduction showed that two reduction steps (Fe 2 O 3 ? Fe 3 O 4 , Fe 3 O 4 ? FeO) proceed simultaneously. The activation energy was estimated to be 19.0 ± 0.14 kJ/mole. Published by Elsevier B.V. 1. Introduction It is hypothesized that the rapidly occurring climate changes observed are a consequence of the increasing emissions of anthro- pogenic CO 2 into the earth’s atmosphere. About 75% of the CO 2 emission comes from combustion of fossil fuels such as coal, petro- leum, and natural gas [1]. To counter act this effect on climate, it has been proposed that carbon dioxide emissions should be re- duced to stabilize the atmospheric concentration to a level equal to the level in 1990 [2]. Among available technologies and strate- gies to achieve this stabilization of the atmospheric carbon dioxide concentration at an acceptable level, chemical looping combustion (CLC) has been identified as a promising technology to reduce CO 2 capture cost from power plant [2]. Chemical looping combustion has the advantages that the oxygen needed for fuel combustion is supplied by means of oxygen carrier instead of being taken directly from air. Hence, the air and fuel never mix and the com- bustion product consists mainly of CO 2 and steam where steam is then removed by condensation [3]. Different metal oxides have been proposed as possible candi- date for the CLC process [4]; the four most studied supported oxy- gen carriers in descending order by reactivity are NiO/Ni > CuO/ Cu > Mn 3 O 4 /MnO > Fe 2 O 3 /FeO [4]. In general, the metal oxide is combined with an inert, such as Al 2 O 3 , SiO 2 , ZrO 2 or TiO 2 [4–8]. Some of these oxides have a number of disadvantages, for example, the Cu-based carriers have a low melting point and a ten- dency to agglomerate due to high temperature. Ni-based oxygen carrier introduces a high level of toxicity into the environment and is very expensive. Alternatively, Fe-based carriers are rela- tively inexpensive, environmentally benign, readily available, and endure physical stress and thermal cycling. Furthermore, it also has enough reactivity at atmospheric [7–11] and pressurized conditions [12]. Jerndal et al. [13] concluded that sulphur should not be a problem with Fe-based oxygen carriers. Cho et al. [10] observed no or very little carbon formation using an iron-based oxygen carrier. Therefore, iron oxides, natural hematite, are materials poten- tially suitable as oxygen carriers for a CLC and in present study it 1385-8947/$ - see front matter Published by Elsevier B.V. http://dx.doi.org/10.1016/j.cej.2013.12.040 ⇑ Corresponding author. Tel.: +1 304 285 4486; fax: +1 304 285 4403. E-mail address: [email protected] (R.W. Breault). Chemical Engineering Journal 242 (2014) 204–210 Contents lists available at ScienceDirect Chemical Engineering Journal journal homepage: www.elsevier.com/locate/cej
Transcript of Reduction of hematite (Fe2O3) to wüstite (FeO) by carbon monoxide (CO) for chemical looping...

Chemical Engineering Journal 242 (2014) 204–210
Contents lists available at ScienceDirect
Chemical Engineering Journal
journal homepage: www.elsevier .com/locate /ce j
Reduction of hematite (Fe2O3) to wüstite (FeO) by carbon monoxide (CO)for chemical looping combustion
1385-8947/$ - see front matter Published by Elsevier B.V.http://dx.doi.org/10.1016/j.cej.2013.12.040
⇑ Corresponding author. Tel.: +1 304 285 4486; fax: +1 304 285 4403.E-mail address: [email protected] (R.W. Breault).
Esmail R. Monazam b, Ronald W. Breault a,⇑, Ranjani Siriwardane a
a National Energy Technology Laboratory, U.S. Department of Energy, 3610 Collins Ferry Rd., Morgantown, West Virginia 26507-0880, United Statesb REM Engineering Services, PLLC, 3537 Collins Ferry Rd., Morgantown, West Virginia 26505, United States
h i g h l i g h t s
� TGA reduction of hematite (Fe2O3) in CO (5–20%) was conducted at temperatures from 750 to 900 �C.� A single reaction scheme was applied to the reduction data.� The reaction is first-order.� The reaction rate increases with temperature and CO concentration.
a r t i c l e i n f o
Article history:Received 5 November 2013Received in revised form 10 December 2013Accepted 16 December 2013Available online 21 December 2013
Keywords:Chemical looping combustionCarbon monoxide kinetics
a b s t r a c t
Thermogravimetric analysis (TGA) of the reduction behavior of hematite by using continuous streams of5%, 10%, and 20% CO concentrations in N2 was conducted at temperatures ranging from 750 to 900 �C overten cycles. The reduced hematite was then oxidized using dry air. The rate of reduction was determinedby the sample weight loss. Analysis of the data indicated that the reduction behavior can be described bysingle rate-determining step and it was controlled by the chemical reaction at the particle surface. Themass spectroscopy analysis of product gas indicated that no carbon deposition was found when operatingat these temperature ranges (750–900 �C). The analysis of reduction showed that two reduction steps(Fe2O3 ? Fe3O4, Fe3O4 ? FeO) proceed simultaneously. The activation energy was estimated to be19.0 ± 0.14 kJ/mole.
Published by Elsevier B.V.
1. Introduction
It is hypothesized that the rapidly occurring climate changesobserved are a consequence of the increasing emissions of anthro-pogenic CO2 into the earth’s atmosphere. About 75% of the CO2
emission comes from combustion of fossil fuels such as coal, petro-leum, and natural gas [1]. To counter act this effect on climate, ithas been proposed that carbon dioxide emissions should be re-duced to stabilize the atmospheric concentration to a level equalto the level in 1990 [2]. Among available technologies and strate-gies to achieve this stabilization of the atmospheric carbon dioxideconcentration at an acceptable level, chemical looping combustion(CLC) has been identified as a promising technology to reduce CO2
capture cost from power plant [2]. Chemical looping combustionhas the advantages that the oxygen needed for fuel combustionis supplied by means of oxygen carrier instead of being takendirectly from air. Hence, the air and fuel never mix and the com-
bustion product consists mainly of CO2 and steam where steamis then removed by condensation [3].
Different metal oxides have been proposed as possible candi-date for the CLC process [4]; the four most studied supported oxy-gen carriers in descending order by reactivity are NiO/Ni > CuO/Cu > Mn3O4/MnO > Fe2O3/FeO [4]. In general, the metal oxide iscombined with an inert, such as Al2O3, SiO2, ZrO2 or TiO2 [4–8].
Some of these oxides have a number of disadvantages, forexample, the Cu-based carriers have a low melting point and a ten-dency to agglomerate due to high temperature. Ni-based oxygencarrier introduces a high level of toxicity into the environmentand is very expensive. Alternatively, Fe-based carriers are rela-tively inexpensive, environmentally benign, readily available, andendure physical stress and thermal cycling. Furthermore, it alsohas enough reactivity at atmospheric [7–11] and pressurizedconditions [12]. Jerndal et al. [13] concluded that sulphur shouldnot be a problem with Fe-based oxygen carriers. Cho et al. [10]observed no or very little carbon formation using an iron-basedoxygen carrier.
Therefore, iron oxides, natural hematite, are materials poten-tially suitable as oxygen carriers for a CLC and in present study it
Nomenclature
A arrhanious pre-exponential factor, 1/minE activation energy, kJ/molk reaction rate constant, 1/minn kinetics exponentR universal gas constant
t time of reaction, minT temperature, KX conversionyCO CO mole fraction
E.R. Monazam et al. / Chemical Engineering Journal 242 (2014) 204–210 205
was selected as an oxygen carrier, based on the advantages men-tioned earlier. The CO reduction process of hematite is very com-plex and there are possibilities of several intermediate reactionswhich are usually simultaneous, i.e. hematite (Fe2O3) ? magnetite(Fe3O4) ? wüstite (FeO) ? iron (Fe). Carbon monoxide is an inter-mediate in many CLC reactions and it is important to know thekinetic parameters with CO to describe the CFD models. The reduc-tion of hematite with CO has been studied extensively, but thedetailed reaction mechanism is still not fully understood as sum-marized in detailed by Turkdogan and Vinters [14–16] and canbe seen in the wide array of proposed mechanisms presented inTable 2. They reported that there are considerable disagreementand diversity in the reaction rate constant values. We have previ-ously reported kinetic analysis for the methane CLC reaction withhematite [17]. Therefore, the objective of this paper is to under-stand the kinetic parameters of the reduction reactions of hematite(Fe2O3), using CO. Effect of temperature and CO concentration wasevaluated.
In chemical looping systems, the fuel, say methane, undergoesindirect combustion and most likely starts with its partial oxida-tion to produce hydrogen and carbon monoxide [9,17]. These par-tial combustion products either react within the particle in whichthey were produced or further downstream in the reactor withother particles completing the combustion process to form carbondioxide and water. The development and construction of these ad-vanced chemical looping processes can take numerous years asresearchers successively scale-up the various technologies to thepoint that they a finally of commercial scale. The US Departmentof Energy is focused on reducing the commercialization time scalethough the development of validated CFD models. To accomplishthis, reaction kinetics are needed. This paper presents a kineticmodel for the reaction of carbon monoxide with hematite for thispurpose.
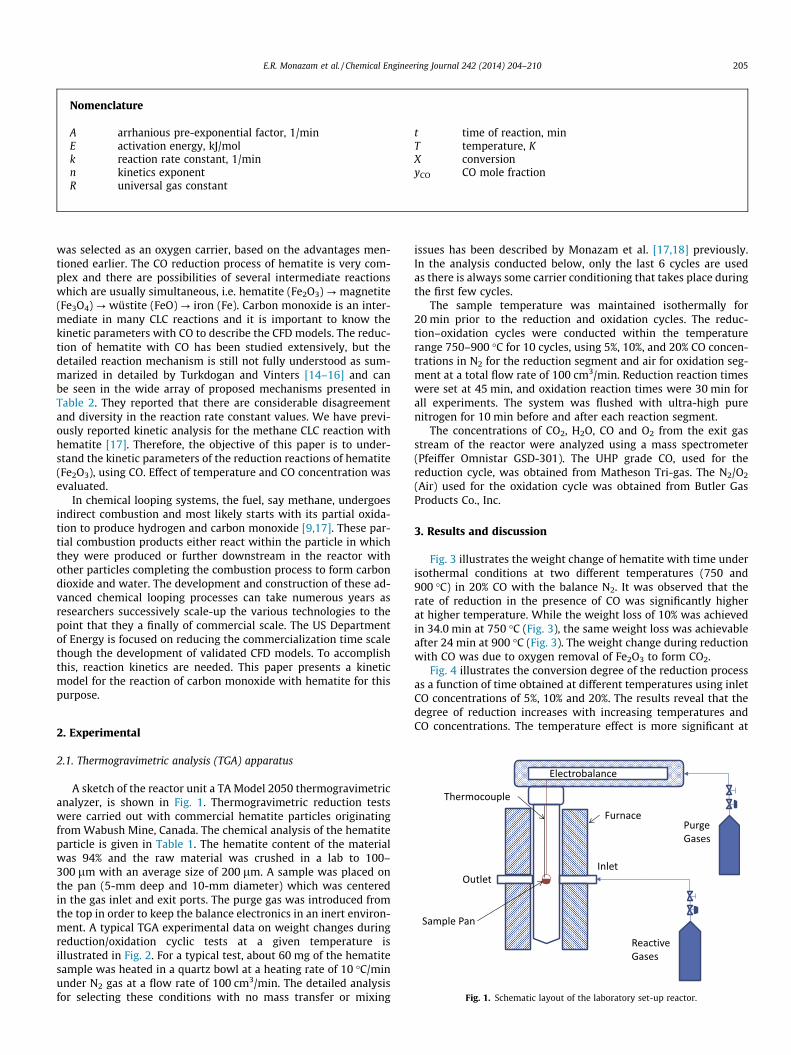
Fig. 1. Schematic layout of the laboratory set-up reactor.
2. Experimental
2.1. Thermogravimetric analysis (TGA) apparatus
A sketch of the reactor unit a TA Model 2050 thermogravimetricanalyzer, is shown in Fig. 1. Thermogravimetric reduction testswere carried out with commercial hematite particles originatingfrom Wabush Mine, Canada. The chemical analysis of the hematiteparticle is given in Table 1. The hematite content of the materialwas 94% and the raw material was crushed in a lab to 100–300 lm with an average size of 200 lm. A sample was placed onthe pan (5-mm deep and 10-mm diameter) which was centeredin the gas inlet and exit ports. The purge gas was introduced fromthe top in order to keep the balance electronics in an inert environ-ment. A typical TGA experimental data on weight changes duringreduction/oxidation cyclic tests at a given temperature isillustrated in Fig. 2. For a typical test, about 60 mg of the hematitesample was heated in a quartz bowl at a heating rate of 10 �C/minunder N2 gas at a flow rate of 100 cm3/min. The detailed analysisfor selecting these conditions with no mass transfer or mixing
issues has been described by Monazam et al. [17,18] previously.In the analysis conducted below, only the last 6 cycles are usedas there is always some carrier conditioning that takes place duringthe first few cycles.
The sample temperature was maintained isothermally for20 min prior to the reduction and oxidation cycles. The reduc-tion–oxidation cycles were conducted within the temperaturerange 750–900 �C for 10 cycles, using 5%, 10%, and 20% CO concen-trations in N2 for the reduction segment and air for oxidation seg-ment at a total flow rate of 100 cm3/min. Reduction reaction timeswere set at 45 min, and oxidation reaction times were 30 min forall experiments. The system was flushed with ultra-high purenitrogen for 10 min before and after each reaction segment.
The concentrations of CO2, H2O, CO and O2 from the exit gasstream of the reactor were analyzed using a mass spectrometer(Pfeiffer Omnistar GSD-301). The UHP grade CO, used for thereduction cycle, was obtained from Matheson Tri-gas. The N2/O2
(Air) used for the oxidation cycle was obtained from Butler GasProducts Co., Inc.
3. Results and discussion
Fig. 3 illustrates the weight change of hematite with time underisothermal conditions at two different temperatures (750 and900 �C) in 20% CO with the balance N2. It was observed that therate of reduction in the presence of CO was significantly higherat higher temperature. While the weight loss of 10% was achievedin 34.0 min at 750 �C (Fig. 3), the same weight loss was achievableafter 24 min at 900 �C (Fig. 3). The weight change during reductionwith CO was due to oxygen removal of Fe2O3 to form CO2.
Fig. 4 illustrates the conversion degree of the reduction processas a function of time obtained at different temperatures using inletCO concentrations of 5%, 10% and 20%. The results reveal that thedegree of reduction increases with increasing temperatures andCO concentrations. The temperature effect is more significant at

Table 1Composition of hematite, wt.%.
C O Si Mn Fe Ag Au Total
1.24 36.89 1.38 1.9 57.78 0.08 0.73 100
0
200
400
600
800
1000
48
50
52
54
56
58
60
62
0 200 400 600 800 1000 1200
Tem
pera
ture
(ºC
)
Wei
ght (
mg)
Time (min)
T=900 ºC, 20% CO
Fig. 2. Typical mass and temperature measurement for hematite particle of 200 lmusing 20% CO for reduction and air for oxidation reactions.
0
2
4
6
8
10
12
14
16
50
52
54
56
58
60
62
0 10 20 30 40 50
Wei
ght L
oss
(%)
Wei
ght (
mg)
Time (min)
CO=20%
900 ºC
750 ºC
Fig. 3. Weight changes as a function of time, using 20% CO .
206 E.R. Monazam et al. / Chemical Engineering Journal 242 (2014) 204–210
higher temperature. Initially, the reduction proceeds rapidly, afterwhich only gradual increase in reduction rate was observed untilthe completion of tests.
Fig. 4 clearly indicates that with 20% CO there is reduction ofhematite (Fe2O3) to FeO–Fe mixtures (weight loss of >10%) at alltemperatures. However, Fig. 4 also shows that at lower CO concen-tration (5% and 10%), the weight loss is limited to <10% for all thetemperatures tested. A 10% reduction corresponds to the formationof FeO from Fe2O3. Therefore, in order to simplify the analysis inthis study, the reduction conversion was normalized to a value of1 using measured weight decrease of 10%.
Considering the following series of reactions for iron oxide(Fe2O3) reduction:
Fe2O3 ! Fe3O4 ! FeO ð1Þ
and assuming that Fe3O4 is an intermediate state between Fe2O3
and FeO. The two step hematite reduction can be represented bythe two following equations:
3Fe2O3 þ CO! 2Fe3O4 þ CO2 ð2Þ
2ðFe3O4 þ CO! 3FeOþ CO2Þ ð3Þ
Therefore, theoretically weight changes in accordance to reactionstoichiometry for CO reduction of iron oxide (Fe2O3) are a combina-tion of Eqs. (2) and (3),
Fe2O3 þ CO! 2FeOþ CO2
ðDH800C ¼ �5:23 kJ=mole; DG800C ¼ �36:56 kJ=moleÞð4Þ
Table 2Summary of activation energy values reported in literature (Piotrowski et al. [24]).
Source Reduction step Reduction mechanism
Currentinvestigation
Fe2O3 ? FeO Phase boundary
Shimokawabe[28]
Fe2O3 ? Fe3O4 Random nucleation
Piotrowskiet al. [24]
Fe2O3 ? FeO Phase boundary
Sastri et al.[25]
Fe2O3 ? Fe Phase boundary
Tiernan et al.[29]
Fe2O3 ? Fe3O4 Not determined
Tiernan et al.[29]
Fe2O3 ? Fe3O4 Phase boundary
Trushenskiet al. [30]
Fe2O3 ? Fe3O4 Non-topochemical approach, complex mode
Fe3O4 ? FeOFeO ? Fe
El-Geassyet al.[26,27]
Fe2O3 ? Fe Phase boundary limited by gaseous diffusio
[Fe3O4, FeO, Fe3C, Cpresent]
Nasr et al.[27]
Fe2O3 ? Fe [FeO,Fe3C,Fe2C, C present]
Initial stage, combination of gaseous diffusifinal stage, T < 900 �C, gaseous diffusion fin
Moon et al.[31]
Fe2O3 ? FeO [H2]; Chemical surface
Fe2O3 ? FeO [CO] Reaction, intraparticle diffusion through the
The extent of reduction was calculated using the followingequation:
DEa (kJ/mol) Experimental method
19.0 Isothermal TGA
33.27–74 Linear heating rate
58.13 Isothermal TGA
57–73 Isothermal TGA
106 Linear heating rate
96 CRTA ‘‘rate-jump’’
l 69–100 Isothermal TGA
64.46–78.27 Isothermal TGA115.94 Isothermal TGA
n 31.6–53.57 Isothermal, 200 lmsize
9.54–21.51 Isothermal, 100 lmsize
on and interfacial chemical reactional stage, T > 1000 �C, Gaseous diffusion
28.92 Isothermal TGA
23.81 Isothermal TGA14.98 Isothermal TGA19.84–42.15 Isothermal TGA
reduced layer

0
0.1
0.2
0.3
0.4
0.5
0.6
0 10 20 30 40 50
Con
vers
ion
(Fe 2
O3
to F
e)
Time (min)
Fe3O4
Fe2O3
FeO
CO=20%
10%
5%
750-900 oC
Fig. 4. Effect of reaction temperature on conversion of hematite to Fe using20% ,10% and 5% CO.
0.0
1.0
2.0
3.0
4.0
5.0
0 20 40 60 80 100 120 140
CO
2co
ncen
trat
ion
Time (min)
750 ºC
850
900
CO=20%
Reduction N2 Oxidation N2 Reduction
Fig. 5. Outlet gas analysis for the reduction of hematite [Fe2O3] with 20% CO atdifferent temperatures.
E.R. Monazam et al. / Chemical Engineering Journal 242 (2014) 204–210 207
X ¼ mo �mðtÞmo �mf
ð5Þ
where m(t) is the instantaneous weight of the solid during the expo-sure to CO. Parameters mo and mf are initial and final weight of thereactant, respectively. In this study, the initial weight was consid-ered as the weight of hematite and final weight as the weight ofFeO (corresponds to weight decrease of 10 wt.%). Theoretical weightdecrease corresponding to transformation of Fe2O3 into Fe3O4 is3.3 wt.% and of Fe2O3 into Fe corresponds to weight decrease of30 wt.%. Note, the resulting model, as will be shown, does not as-sume that reduction occurs from one composition to the next onlyafter completion of each level but occurs as is shown in Eqs. (2) and(3) above to proceed in parallel with some regions of the particlemore reduced than others.
The data in Fig. 4 also indicates that there is a marked decreasein the reduction time when the temperature is raised from 750 to800 �C with an inlet CO concentration of 20%. This is shown by thedecrease in the reduction time to form FeO from about 30 min at750 �C to about 25 min at 800 �C. Increasing the temperature to850 �C, the reduction time decreases further to about 24 min andthen to about 21 min at 900 �C. These results suggest that the rateof reduction is faster at higher temperatures, especially with 20%CO. There is a slight inflection apparent in the data that indicatesthat the reaction mechanism likely follows reactions (2) and (3).However, the effect is quite small and the following analysis treatsthe process as a single reaction step as shown in reaction (4).
Fig. 5 illustrates the CO2 gas concentration (as measured bymass spectrometer) as a function of time at different temperatures(750–900 �C), with inlet CO concentrations of 20%. Note the 800 �Cdata has been left off of the plot as it falls on top of the 850 �C data.The data in Fig. 5 also shows that during the reduction phase, apeak of CO2 occurs in the initial stage, and then decreases slowlyto the final value. This implies reaction control as will be shownbelow. It should be noted that the CO2 production diminishes com-pletely at about 20 min at 750 �C, whereas at higher temperaturesthe CO2 production continued until the end of the test (45 min). Itshould be noted that for both the 850 �C and the 900 �C data sets,the transition from FeO to Fe occurs at around 20 min of reactiontime. The same time that the conversion shown in Fig. 4 crossesthe FeO–Fe transition line. Note, again, that this discussion andanalysis is limited to conversions less than complete conversionto FeO (33% on an overall basis).
As expected, the data in Fig. 5 also indicates that during the oxi-dation phase, after air was introduced into the reactor, there wasno production of CO2 in the reactor outlet gases. This indicated thatthe there was no or little carbon deposited during the reductionphase.
4. Kinetic models
Hancock and Sharp [19] used generalized Johnson–Mehl–Avrami (JMA) [20–23] model as the classical method of analyzingall types of kinetic data for solid-state reactions. This model whichdescribes a wide variety of isothermal solid state transformationsand has the form
X ¼ 1� e�ðktÞn ð6Þ
where X is the reduction conversion at time t, n is the kinetic expo-nent, which depends on the mechanism of growth and the dimen-sionality of the nuclei, and k (min�1) is the overall nucleation rateconstant. Generally when n < 1, the mechanism is diffusion-con-trolled; when n is close to 1, the mechanism approaches a phase-boundary-controlled, i.e. kinetic controlled mechanism, and whenn is close to 2 the mechanism is well represented by a nucleationmodel.
The temperature dependence of k is generally expressed by theArrhenius equation:
kðTÞ ¼ Aeð�E=RTÞ ð7Þ
where A is the frequency factor, T is the absolute temperature, and Eis activation energy for the transformation process with R the gasconstant.
Eq. (6) can also be written as;
lnð� lnð1� XÞÞ ¼ n lnðkÞ þ n lnðtÞ ð8Þ
At a given temperature, values of n and k can be determined byplotting ln(�ln(1 � X)) vs lnt. The plot of ln(�ln(1 � X)) againstln(t) is illustrated in Fig. 6 for two CO concentrations (20% and10%) and at different temperatures (750–900 �C). The resultingstraight lines have slopes that increase gradually from a low tem-perature to high temperature. The values of n range from 0.96 to1.1 with a mean value of 1.01 for 20% CO concentration and valuesof n range from 0.9 to 1.07 with a mean value of 0.97 for 10% COconcentration with R2 for all fits being greater than 99%. These val-ues of n are close to 1, indicating a phase-boundary-controlled or ashrinking core type mechanism [19] as was postulated above.Therefore, if the rate determining step is a phase-boundary-controlled at the FeO/Fe interface, the rate equation for a sphericalsolid may be given as;
1� ð1� XÞ1=3 ¼ kt ð9Þ
Plotting ‘‘1 � (1 � X)1/3’’ vs ‘‘t’’ at different temperatures and forvarious CO concentrations (Fig. 7) indicated that a linear relation-ship exists for all the temperatures and concentrations. In fact, theR2 values for all the fits were greater than 99% for the data

-7
-6
-5
-4
-3
-2
-1
0
1
2
-4 -2 0 2 4
ln (
-ln
(1-X
))
ln (t)
750 ºC
800
850
900 T (ºC) n750 0.96800 0.991850 1.02900 1.1
CO=20%
-7
-6
-5
-4
-3
-2
-1
0
1
2
-4 -2 0 2 4 6
ln (
-ln
(1-X
))
ln (t)
800
850
900750 0.90800 0.92850 0.96900 1.07
CO=10%750 ºC
T (ºC) n
Fig. 6. The plot of ln[�ln[1 � X]] against ln[t] for extraction the kinetic exponent, n,in Eq. (2).
Fig. 8. Arrhenius plot for FeO/Fe, kinetic reaction phase-boundary-controlled.
208 E.R. Monazam et al. / Chemical Engineering Journal 242 (2014) 204–210
presented in Fig. 7. Therefore, it appears likely that phase boundaryis the rate-controlling steps in the mechanism and it is reasonableto assume a single step reaction mechanism as shown in reaction(4). If this is the case, the chemical reaction rate, k, can be obtainedby Eq. (9). Hence, Eq. (7) can be rewritten as
ln k ¼ ln A� E=RT ð10Þ
The pre-exponential factor, A, and activation energy, E, were ob-tained from the intercept and slope of the straight line in Fig. 8. Thevalue of, A, increased with increasing CO inlet concentration.Apparent activation energy, E, was fairly constant for different COconcentrations, as evidenced by the parallel lines, of ln k vs 1/T inFig. 8. Combining all the values of k for different CO concentrations(Fig. 9), the following equation is obtained;
k ¼ 2:33yCO expð�2285:23=TÞ ð11Þ
0
0.1
0.2
0.3
0.4
0.5
0.6
0 10 20 30 40 50
1-(1
-X)1/
3
Time (min)
750 ºC
800
850
900
CO=20%
10%
5%
Fig. 7. Plot of (1 � (1 � X)1/3) vs time, Eq. (9).
where yCO is the mole fraction of CO. The activation energy wasfound to be 19.0 ± 0.14 kJ/mole. Eq. (11) which also shows thatthe order of reaction with respect to the gaseous reactant (CO)was one. This is similar to the stoichiometric ratios of CO to Fe2O3
in Eq. (4).The comparison of the experimental hematite reduction, X, data
to the phase boundary control model as presented by followingequation
X ¼ 1� ð1� ktÞ3 ð12Þ
is illustrated in Fig. 10 at different temperatures for 20% inlet COconcentration. The model data and experimental data agree overthe entire conversion time with overall variance (R2) greater than99%. It should be noted that only few data points are shown at eachtemperature for clear illustration of the trend of the curves inFig. 10. The solid lines represent the model fit to experimental data.
A comparison of the mechanisms and activation energies for theFe2O3 reduction with CO and H2 reported in the literature withthose reported in this study is shown in Table 2 [24]. The data inTable 2 also indicates that discrepancies exist among the measuredactivation energies for the reduction of iron oxides. Such variationsmay be associated with differences in experimental conditions andthe samples studied. The sample size and partial pressure of reduc-ing gas can also affect its kinetics [24]. For example, Sastri et al.[25] reported that pretreatment at 850 �C of a-Fe2O3 resulted inan increase in activation energy to 73 kJ/mol relative to a valueof 57 kJ mol�1 for a sample that had undergone no heat treatment.El-Geassy et al. [26,27] found that the activation energies increased
A(m
in1 )-
0.1
0.2
0.3
0.4
0.5
00
A = 2.3279yR2 = 0.9845
0.05
CO
0.1
yCO (mole fraction)
0.15 0.2 0.25
Fig. 9. Effect of CO concentration on reaction rate.

0
0.2
0.4
0.6
0.8
1
0 10 20 30 40 50
Con
vers
ion
(X)
Time (min)
750 ºC
800
850
900
CO=20%
Fe2O3
FeO
Fe3O4
Fig. 10. Comparison of the experimental hematite reduction, X, data to the phaseboundary control model for different reaction temperature using 20% CO.
0
0.01
0.02
0.03
0.04
0.05
0.06
0.07
0.08
0.09
0 0.2 0.4 0.6 0.8 1
dX/d
t (m
in-1
)
Conversion, X
750 ºC
800
850
900
CO=20%
10%
Fig. 12. Effect of temperature on reaction rate as a function of fractional conversionusing 20% and 10% CO.
y = -2315x - 0.6542
y = -2293.4x - 0.8658
y = -2301.1x - 1.1294
y = -2293.8x - 1.5985-5
-4
-3
-2
0.00084 0.00088 0.00092 0.00096 0.001
ln (
dX/d
t)
0.2 0.4 0.6 0.8
E.R. Monazam et al. / Chemical Engineering Journal 242 (2014) 204–210 209
from 9.54–21.51 to 31.6–53.57 kJ/mole by changing the particlesize from 100 lm to 200 lm. Shimokawabe [28] reported activa-tion energies in the range of 33.27–74 kJ/mole at temperatures be-low 700 �C and above 900 �C. They also show that the reduction ofFe2O3 proceeded by two distinct step mechanism below 700 �Cwhile at temperature above 900 �C both steps occurred simulta-neously. It should be noted that the values of the activation energyreported here are comparable with those cited in the literature.Moon et al. [31] estimated the activation energy for the reductionreaction in CO to be 19.8 kJ/mole in pure CO stream which is com-parable to 19.0 ± 0.14 kJ/mole in this study.
An expression for the reaction rate, dX/dt; can be derived by dif-ferentiating Eq. (9) with respect to t, at constant temperature, as
1/T (K-1)
Fig. 13. Arrhenius plot for different conversion.
dXdt¼ 3kð1� XÞ2=3 ð13ÞThe rate can be computed as a function of reduction conver-sions of the iron oxide at a given temperature.
The experimental rate-time (dX/dt vs t) data obtained at differ-ent temperatures (750–900 �C) are shown by Fig. 11. The rate-timecurves for all the temperatures show that the maximum rate ofprocess is obtained at times equal 0. This is indication of kineticcontrolled reaction in which the maximum rate occurs at timeequal to 0. Data in Fig. 11 show that the value of maximum rate in-creased with the increasing temperature and CO concentration.
The rate of reaction as a function of conversion is also presentedin Fig. 12 at different temperatures (750–900 �C). The rate-conver-
0
0.02
0.04
0.06
0.08
0.1
0 10 20 30 40 50
dX/d
t (m
in-1
)
Time (min)
750 ºC
800
850
900
CO=20%
10%
Fig. 11. Effect of reaction temperature on the rate reduction of hematite and COreaction.
sion curves for all the temperatures also show that the maximumrate of process is obtained at times equal to 0.
A plot of ln(dX/dt) as a function of 1/T for different conversionswith 20% CO inlet concentration is shown in Fig. 13. The activationenergies and Arrhenius constant, A, was also determined by thevalues obtained from the slope and intercept of straight line ofFig. 13. The similarities of these values also suggest that particlesare completely penetrated by the reactive gas without any porediffusion resistance between the grains; resulting in uniform reac-tive gas concentration inside the particle.
In this study, reduction by CO shows low activation energycompared with reduction by CH4 (at least by half) [17] becauseCO as the reducing agent is thermodynamically favorable for thereduction.
5. Summary
The purpose of this study was to determine the reaction kineticsof the fuel reactor in the chemical-looping combustion (CLC) pro-cess, and to determine the performance of hematite as an oxygencarrier by evaluating the parameters that affect the reaction rate.Experiments were carried out using a thermogravimetric analyzer(TGA) to measure weight change during the reduction of hematiteusing N2–CO mixtures. Analysis of experimental data suggests thatthe reaction controlling mechanism is phase boundary reactionscheme. The activation energy was estimated to be 19.0 ± 0.14 kJ/mole. The reaction rate increases with increasing temperatureand CO content in the inlet gas. An empirical rate is developed topredict the course of reduction of hematite in chemical loopingcombustion.

210 E.R. Monazam et al. / Chemical Engineering Journal 242 (2014) 204–210
Acknowledgments
The authors acknowledge the Department of Energy for fundingthe research. Special thanks go to Duane D. Miller, Hanjing Tianand Thomas Simonyi of URS Energy & Construction, Inc. for theirassistance with experimental work and data.
References
[1] IPCC, Climate Change-The Scientific Basis, Cambridge university Press,Cambridge, 2001.
[2] H.R. Kerr, Capture and separation technologies gaps and priority researchneeds, in: D. Thomas (Ed.), The CO2 Capture and Storage Project [CCP] forCarbon Dioxide Storage in Deep Geologic Formations for Climate ChangeMitigation. Capture and Separation of Carbon Dioxide from CombustionSources, vol. I, vol. 38, Elsevier Science, London, 2005, pp. 655–660.
[3] H.J. Richter, K.F. Knoche, Reversibility of combustion processes, ACSSymposium Series 71 (1983) 235.
[4] P. Cho, T. Mattison, A. Lyngfelt, Comparison of iron, nickel, copper andmanganese -based oxygen carriers for chemical-looping combustion, Fuel 83(2004) 1215.
[5] M. Ishida, T.A. Okamoto, A fundamental study of a new kind of mediummaterial for chemical-looping combustion, Energy Fuels 10 (1996) 958.
[6] M. Ishida, M. Yamamoto, T. Ohba, Experimental results of chemical loopingcombustion with NiO/NiAl2O4 particle circulation at 1200 �C, Energ. Convers.Manage. 43 (2002) 1469.
[7] J. Adánez, L.F. de Diego, F. García-Labiano, P. Gayán, A. Abad, J.M Palacios,Selection of oxygen carriers for chemical-looping combustion, Energy Fuels 18(2004) 371–377.
[8] Q. Zafar, T. Mattison, B. Gevert, Integrated hydrogen and power productionwith CO2 capture using chemical-looping reforming redox reactivity ofparticles of CuO, Mn2O3, NiO and Fe2O3 using SiO2 as a support, Ind. Eng.Chem. Res. 44 (2005) 3485.
[9] A. Abad, J. Adánez, F. García-Labiano, L.F. de Diego, P. Gayán, J. Celaya, Mappingof the range of operational conditions for Cu–, Fe–, and Ni-based oxygencarriers in chemical-looping combustion, Chem. Eng. Sci. 62 (2007) 533–549.
[10] P. Cho, T. Mattisson, A. Lyngfelt, A Carbon formation on nickel and iron oxidecontaining oxygen carriers for chemical-looping combustion, Ind. Eng. Chem.Res. 44 (2005) 668.
[11] T. Mattisson, M. Johansson, A. Lyngfelt, Multicycle Reduction and oxidation ofdifferent types of iron oxide particles – application to chemical-loopingcombustion, Energy Fuel 18 (2004) 628–637.
[12] F. García-Labiano, J. Adánez, L.F. de Diego, P. Gayán, A. Abad, Effect of pressureon the behavior of copper-iron-, and nickel-based oxygen carriers forchemical-looping combustion, Energy Fuel 20 (2006) 26–33.
[13] E. Jerndal, T. Mattisson, A. Lyngfelt, Thermal analysis of chemical loopingcombustion, Chem. Eng. Res. Des. 84 (2006) 795–806.
[14] E.T. Turkdogan, J.V. Vinters, Gaseous reduction of iron oxides: Part I. Reductionof hematite in hydrogen, Metall Trans. 2 (1971) 3175–3188.
[15] E.T. Turkdogan, R.G. Olsson, J.V. Vinters, Gaseous reduction of iron oxides. PartII. Pore characteristics of iron reduced from hematite in hydrogen, Metal.Trans. 2 (1971) 3189–3196.
[16] E.T. Turkdogan, J.V. Vinters, Gaseous reduction of iron oxides: Part III.Reduction–oxidation of porous and dense iron oxides and iron, Metal. Trans.3 (1972) 1561–1574.
[17] E.R. Monazam, R.W. Breault, R. Siriwardane, G. Richards, S. Carpender, Kineticsof the reduction of hematite (Fe2O3) by methane (CH4) during chemicallooping combustion: a global mechanism, Chem. Eng. J. 232 (2013) 478–487.
[18] E.R. Monazam, R.W. Breault, R. Siriwardane, D. Miller, Thermogravimetricanalysis of modified hematite by methane (CH4) for chemical loopingcombustion: a global kinetics mechanism, Ind. Eng. Chem. Res. ie (2013)024116.
[19] J.D. Hancock, J.H. Sharp, Method of comparing solid-state kinetic data and itsapplication to the decomposition of kaolinite, brucite, and BaCO3, J Am. Ceram.Soc. 55 (1972) 74e7.
[20] W.A. Johnson, R.F. Mehl, Reaction kinetics in processes of nucleation andgrowth, Trans. Am. Inst. Min. Engrs 135 (1939) 416–458.
[21] M. Avrami, kinetics of phase change. I: general theory, J. Chem. Phys. 7 (1939)1103–1112.
[22] M. Avrami, Kinetics of phase change. II: transformation-time relations forrandom distribution of nuclei, J. Chem. Phys. 8 (1940) 212–224.
[23] M. Avrami, Kinetics of phase change. III: granulation, phase change anmicrostructures, J. Chem. Phys. 9 (1941) 177–184.
[24] K. Piotrowski, K. Mondal, T. Wiltowski, P. Dydo, G. Rizeg, Topochemicalapproach of kinetics of the reduction of hematite to wustite, Chem. Eng. J. 131(2007) 73–82.
[25] M. Sastri, R. Viswanath, B. Viswanathan, Studies on the reduction of iron-oxidewith hydrogen, Int. J. Hydrogen Energy 7 (1982) 951–955.
[26] A.A. Elgeassy, K.A. Shehata, S.Y. Ezz, Steel research – effect of silica onreducibility of iron-oxide, Iron Steel Int. 50 (1977) 629–635.
[27] A.A. ElGeassy, M.I. Nasr, M.M. Hessien, Effect of reducing gas on the volumechange during reduction of iron oxide compacts, ISIJ Int. 36 (1996) 640–649.
[28] M. Shimokawabe, R. Furuichi, T. Ishii, Influence of the preparation history ofalpha-Fe2O3 on its reactivity for hydrogen reduction, Thermochim. Acta 28(1979) 287–305.
[29] M.J. Tiernan, P.A. Barnes, G.M.B. Parkes, Reduction of iron oxide catalysts: theinvestigation of kinetic parameters using rate perturbation and linear heatingthermoanalytical techniques, J. Phys. Chem. B 105 (2001) 220–228.
[30] S.P. Trushenski, K. Li, W.O. Philbroo, Nontopochemical reduction of iron oxides,Metall. Trans. 5 (1974) 1149–1158.
[31] I.J. Moon, C.H. Rhee, D.J. Min, Reduction of hematite compacts by H2–CO gasmixtures, Steel Res 69 (1998) 302–306.