The complex nonstoichiometry of wüstite Fe O: review and ...
42
Gavarri, Carel, Progress in Solid State Chemistry, Elsevier, October 2018 1 The complex nonstoichiometry of wüstite Fe 1-z O: review and comments Jean-Raymond Gavarri 1* and Claude Carel 2 1 University of Toulon, Aix Marseille Univ., CNRS 7334, IM2NP, Toulon, France. BP 20132, 83957 La Garde Cedex, France * to whom correspondence must be addressed - e-mail = [email protected] 2 Honorary Professor, University of Rennes1, 2 rue du Thabor CS 46510, 35065 Rennes Cedex, France e-mail = [email protected] Abstract Thermodynamic properties and structural aspects of the nonstoichiometric wüstite Fe 1- z O, and its modifications - the so-called pseudo-phases - as functions of departure z from stoichiometry and of equilibrium temperature are reviewed from 1960 to present. The complexity of the equilibrium phase diagram is described in some details. The first order transition W W’ is specified on the iron / wüstite boundary near 1185 K. Transitions correlated to the modifications Wi at T(W)>1185 K and W’j at T(W’) <1185 K (i and j =1,2,3) are re-examined. Structural determinations based on the characterization of point defects stabilization and of their clustering are reviewed. Additionally, the pseudo-phases are examined based on the transformation of defect clusters or of their mode of distribution (i.e., percolation or superstructure) with the inclusion of changes in electronic charge carriers. Keywords: wüstite, alpha-gamma transition, point defects, defect clusters, pseudo-phases, percolation 1. Introduction The nonstoichiometric iron monoxide Fe 1-z O is the main constituent of traditional blast furnace slags. Historically, this oxide was the subject of numerous studies in the general context of iron metallurgy improvement, and for its role in the fields of recycling of industrial waste, catalysis and nanoparticles. Fe1-zO, also written equivalently as Fe y O or FeO x , is named after the German mineralogical appellation “wüstit” 1 . The wüstite is considered of particular interest by the geophysicists because it is a constituent of the lower mantel of earth. This oxide is in a steady state, between an invariant point near 600 °C and its melting temperature around 1400 °C, under an equilibrium oxygen pressure p’ in the range 10 -25 to 10 -6 bar. Its large iron deficiency is expressed by the departure of stoichiometry z [0.04 - 0.18] around 1400 °C and z 0.065 near 600 °C. Because of so many papers published before, numerous reviews about the nonstoichiometric wüstite are available in the literature. So, the present authors make choices of some of them or equivalent works: Goodenough [1], Kofstad [2], Vallet [3], Burgmann [4], Gokcen [5], Men’ et al. [6], Spencer, Kubaschewski [7], Bauer, Pianelli [8], Sorensen [9], Hazen, Jeanloz [10], Gleitzer, Goodenough[11], Gokcen [12], Lykasov et al. [13], Mrowec, Podgorecka [14], Long, Grandjean [15], Sundman [16], Wriedt [17], Collongues [18], Gleitzer [19], Smyth [20], Desré, Hodaj [21], Worral, Coley [22]. 1 There is no equivalent available in the English language for the German phoneme ‘ü’.
Transcript of The complex nonstoichiometry of wüstite Fe O: review and ...

Gavarri, Carel, Progress in Solid State Chemistry, Elsevier, October 2018
1
The complex nonstoichiometry of wüstite Fe 1-z O:
review and comments
Jean-Raymond Gavarri 1*
and Claude Carel 2
1 University of Toulon, Aix Marseille Univ., CNRS 7334, IM2NP, Toulon, France.
BP 20132, 83957 La Garde Cedex, France
* to whom correspondence must be addressed - e-mail = [email protected]
2 Honorary Professor, University of Rennes1, 2 rue du Thabor CS 46510, 35065 Rennes Cedex, France
e-mail = [email protected]
Abstract
Thermodynamic properties and structural aspects of the nonstoichiometric wüstite Fe1-zO, and its modifications -
the so-called pseudo-phases - as functions of departure z from stoichiometry and of equilibrium temperature are
reviewed from 1960 to present. The complexity of the equilibrium phase diagram is described in some details.
The first order transition W W’ is specified on the iron /wüstite boundary near 1185 K. Transitions correlated
to the modifications Wi at T(W)>1185 K and W’j at T(W’) <1185 K (i and j =1,2,3) are re-examined. Structural
determinations based on the characterization of point defects stabilization and of their clustering are reviewed.
Additionally, the pseudo-phases are examined based on the transformation of defect clusters or of their mode of
distribution (i.e., percolation or superstructure) with the inclusion of changes in electronic charge carriers.
Keywords: wüstite, alpha-gamma transition, point defects, defect clusters, pseudo-phases,
percolation
1. Introduction
The nonstoichiometric iron monoxide Fe1-zO is the main constituent of traditional blast furnace
slags. Historically, this oxide was the subject of numerous studies in the general context of iron
metallurgy improvement, and for its role in the fields of recycling of industrial waste, catalysis and
nanoparticles. Fe1-zO, also written equivalently as FeyO or FeOx, is named after the German
mineralogical appellation “wüstit”1. The wüstite is considered of particular interest by the geophysicists
because it is a constituent of the lower mantel of earth. This oxide is in a steady state, between an
invariant point near 600 °C and its melting temperature around 1400 °C, under an equilibrium oxygen
pressure p’ in the range 10-25
to 10-6
bar. Its large iron deficiency is expressed by the departure of
stoichiometry z [0.04 - 0.18] around 1400 °C and z 0.065 near 600 °C.
Because of so many papers published before, numerous reviews about the nonstoichiometric
wüstite are available in the literature. So, the present authors make choices of some of them or
equivalent works:
Goodenough [1], Kofstad [2], Vallet [3], Burgmann [4], Gokcen [5], Men’ et al. [6], Spencer,
Kubaschewski [7], Bauer, Pianelli [8], Sorensen [9], Hazen, Jeanloz [10], Gleitzer, Goodenough[11],
Gokcen [12], Lykasov et al. [13], Mrowec, Podgorecka [14], Long, Grandjean [15], Sundman [16],
Wriedt [17], Collongues [18], Gleitzer [19], Smyth [20], Desré, Hodaj [21], Worral, Coley [22].
1 There is no equivalent available in the English language for the German phoneme ‘ü’.

2
Multiple studies have addressed the nature of the point defects (iron vacancies and interstitials)
in wüstite, and the concept of defect clustering was systematically developed with a large variety of
structural models. The NaCl face centered cubic structure of wüstite is characterized by a high rate of
iron vacancies, and the existence of a certain proportion of iron ions occupying interstitial sites.
Crystallographic determinations showed that these defects are not disordered in the lattice. Diverse
models of clusters of iron vacancies and interstitials have been proposed.
Because it simplifies the structural description of defects, the oxygen site is assumed to be fully
occupied (i.e., there is no significant amount of oxygen vacancies). Adopting the notation of Kröger
and Vink [23], the formula of this monoxide can be developed as
Fe1-zO = (FeFe)(1-3z)(FeFe°)(2z-t)(Fei
°°°)t(VFe
q (’ )) (z+t)OO (1)
The ionic species Fe2+
and Fe3+
, in octahedral sites, are noted FeFe and FeFe°. The Fe
3+ cations in
tetrahedral (interstitial) sites are noted Fei°°°
. Iron vacancies noted VFeq (’) can be charged negatively
corresponding to q=2 or q=1, or neutral corresponding to q=0. Electric neutrality would result from
electrons jumping in the conduction band or interacting with holes in the valence band. It can be
recalled that the band gap of wüstite was recently evaluated at about 1.0 eV at 25 °C, which means that
a large population of electrons in the conduction band and/or holes in the valence band can be expected
at high temperature, depending on the oxygen partial pressure [24].
In this paper, we review historical (1960-2014) observations and concepts for wüstite at
equilibrium and in quenched samples. Then, we show how the complex nonstoichiometry of wüstite
can be better described using mixtures of point defects and their associations in clusters which fall into
order progressively at increasing z.
2. The complex behavior of wüstite
2.1. Early work (1921-1961)
In 1921, G. Chaudron worked in H. Le Chatelier’s lab. when he determined experimentally
the external boundaries of the stable domain of ferrous oxide considered to be the daltonide ‘FeO’ [25].
Point C is at the intersection of the two boundaries, where three solid phases (Fe, Fe3O4 and ‘FeO’)
coexist at equilibrium at 570°C, temperature that has been revised particularly by Raccah, Vallet, Carel
[26-29], and that is named Chaudron’s point.
Jette and Foote demonstrated -measurements of the cell parameter and density- that wüstite
was an iron deficient solid solution. They deducted that for the ionic compound, a missing Fe2+
was
necessarily compensated by the oxidation of two other Fe2+
giving rise to electron holes Fe3+
[30].
Darken and Gurry studied in detail the phase diagram when determining the composition of
wüstite chemically after slow quenching from °C= 1100, 1200, 1300 and 1400. The boundaries with
iron and magnetite were determined down to Chaudron’s point. Additionally, the authors determined
exhaustively the molar partial and integral thermodynamic properties of wüstite [31].
By comparison of calculated and experimental entropy values, Todd and Bonnickson, and
Humphrey, King and Kelley deducted that the lacunary iron lattice envisaged by Jette and Foote was
ordered [30] [32] [33].
Brynestad and Flood observed that some (electron holes) Fe3+
are necessarily located in
tetrahedral sites written as [FeIII
O4] [34].
Using neutron diffraction analyses, Roth determined the proportion of Fe3+
occupying the
tetrahedral sites of the fcc structure and concluded to the formation of clusters (2:1) constituted of
two iron vacancies and one tetrahedral site occupied by a cation Fe3+
[35]. Tarte et al. also showed
directly by I.R. spectroscopy the existence of these Fei°°°
ions [36].

3
Using the formalism of the mass action law initially proposed by Carl Wagner et al. [37] [38],
Brynestad and Flood [34], and subsequently Smyth [39] established a simplified expression linking the
composition z to the equilibrium oxygen pressure as:
z p’ 1/s (2)
In a first attempt, Smyth characterized the defect structure of both Mn1-zO and Fe1-zO based on the
experimental compositional data from Darken and Gurry [31]. His work often referenced has been
continued by many authors in different areas of the defect chemistry, particularly the study of the
clustering.
2.2. Modifications or pseudo-phases W1, W2, W3
2.2.1. Raccah-Vallet’s team
During years 1962-65, three supposed « allotropic varieties » or « modifications » noted Wi
(i=1,2,3) named later « subphases » and then « pseudo-phases » by other authors are discovered by
Raccah (doctoral thesis [40]), Vallet, and Kléman additionally [41-45] from their experimental
measurements. An initial layout of the corresponding phase diagram is proposed, based on coordinates
(Θ °C, x) [26].
During their studies from 1961 to 1989, Vallet et al. establish correlations between mass
variation, i.e., departure from stoichiometry expressed by x in FeOx , temperature T and oxygen partial
pressure p’ under equilibrium (see also [3]). They describe the phase diagram of wüstite FeOx above
911°C through the following three equations connecting log p’ noted l’ with the composition x and
temperature T, and expressing the three thermodynamic behaviors or pseudo-phases W1, W2 and W3,
successively [29]:
W1 : l’ = (46753.4T-1
- 7.3781).x + (-78825.3T-1
+ 16.0613) (3a)
W2: l’ = (- 9568.9T-1
+ 31.1728).x + (- 18413.3T-1
- 25.2569) (3b)
W3: l’ = (- 33238.9T-1
+ 48.3669).x + (6883.9T-1
- 43.5669) (3c)
To better relate the nonstoichiometry and equilibrium pressure p’ to the presence of defects (mainly
cation vacancies and interstitials), we have expressed l’ as a function of z instead of x and we have
reported l’ as a function of log z values. It can be recalled that these relationships derive from the
general expression of equilibrium constants K(T) linking the composition z to the oxygen partial
pressure p’, following the basic setup:
½ O2 OO + VFe q (’) + q h
° (4a)
with [h°] = q.[VFe
q (’)] = q.z,
K(T) = {[OO].[VFeq ( ’ )
].[h°]q} / (p’ )½
= C.(zs / p’ )½
(4b)
log z = (1/s).log(K(T)/C)2 + (1/s) l’ (4c)
where C depends on q [39]. For iron vacancies expressed VFe, exponent q(’) indicates a charge q times
minus; h° correspond to an electron hole. In the expression of K(T), we have neglected the activity
coefficients, considering that they are slowly varying with z in a limited composition range. The
activity [OO] of oxygen on its site fcc is considered equal to 1 because no significant amount of
vacancies can be present in the oxygen lattice. Finally, we have taken into account the relationship -
q.[VFeq(’)]+[h
°] = 0 (electroneutrality condition) with [VFe
q(’)] = z.
The equilibrium constants depend on the values 2, 1, and 0 of q. The three hypothetical
corresponding values of exponent s should be 6 (q=2), 4 (q=1), and 2 (q=0) (more likely close to these
values, taking into account the various approximations made). In the remainder of this review,

4
exponent s is taken as characteristic of the specific equilibrium equation connecting the fractions of
point defects between them.
Let us note that the relationships between activities and compositions z are not strictly linear.
They assume the existence of three domains and allow a comparison with classical models of defect
equilibria. In each domain, a unique model of defect equilibrium is supposed to be valid, which is not
strictly exact because of the continuous evolution of interactions between defects, as composition and
temperature vary in the phase diagram.
2.2.2. Fixed temperature and variable composition
To illustrate the different behaviors or transitions between one and another in Fig. 1 below,
we detail the relation log z vs l’ (see relationship 4c) in the specific case of the Vallet et al. data, as
obtained at 1000 °C (T=1273 K), using the relationships (3a, b, c) above, and transforming them into
the following relationships:
W1: log z = 0.2036 l ’ + 1.7511 s = 4.9 (±0.10) (5a)
W2: log z = 0.1369 l ’ + 0.8352 s = 6.7 (±0.12) (5b)
W3: log z = 0.1124 l ’ + 0.5246 s = 8.9 (± 0.15) (5c)
From the three segments observable on the curve l’ vs log z in Fig. 1, we can derive three
different values: s(W1) = 4.9, s(W2) = 6.7, and s(W3) = 8.9. These values are similar to the ones
found by Toft Sørensen and El Sayed Ali, and Rekas and Mrowec [46] [47]. In reality, there is no
reason for assuming linear relationships given the probable existence of mixtures of defects, and of
their continuous evolution conditioned by the changes in charge of VFeq(‘)
(q=0,1,2).
Fig. 1. The logarithm l’ of oxygen partial pressure p’ vs the logarithm of composition z
derived from the data [29] at 1273 K.
2.2.3. Fixed composition and variable temperature
For a fixed value x = 1.130 (z = 0.115), we report in Fig. 2 the experimental values of l’ versus 1/T
using the data of Vallet and Carel [29]. Three quasi linear domains can be distinguished suggesting
the existence of three Gibbs free energies of reaction in relation with the equilibrium constant K(T), with the
classical relationship G(reaction) = H – TS = - RTlnK. The linear correlations are:
W1: l’ = -2.5994(104.T
-1) + 7.724 (6a)
W2: l’ = -2.9226(104.T
-1) + 9.9684 (6b)
W3: l’ = -3.0676(104.T
-1) + 11.088 (6c)

5
Using the simplified relationship (4b) without activity coefficients, we can derive the following relations for
the fixed value z= 0.115 following:
log K(T) = (s/2).log z – ½ l’ + logC = - (2/2.3026) G/RT (7a) dl’ / d(1/T) = (2/2.3026) H/R (7b)
From relation (7b), three values of enthalpies can be determined, linked to the changes in slopes and
attributable to the pseudo-phases:
W1: H1/R = - 25526 K H1 = - 2.20 eV
W2: H2/R = - 29322 K H2 = - 2.52 eV
W3: H3/R = - 31008 K H3 = - 2.67 eV
Fig. 2. Variation of l’ vs 1/T for a fixed value z =
0.115: three quasi linear correlations corresponding
to the initial determinations in the three domains W1
(high T), W2 (intermediate T) and W3 (low T) give
rise to three activation energies Hi.
At the same time, a qualitative dilatometric study under CO2/CO indicates weak changes of slopes in
curves l(T) with intersections located on the boundary W2/W3 [48]. In addition, several correlations between
the cubic cell parameter obtained after quenching or in situ and the composition x in FeOx led correspond to
the separation in three pseudo phases or subdomains of the equilibrium phase diagram [49] [50].
In the equations above, we have neglected the activity coefficients, assuming that the ionic
interactions remained constant as z varies. Another point of view would be to consider that a significant
evolution of the activity coefficients can be observed and that the variation is associated with molar fractions
[i] of point defects at equilibrium (the activity ai being proportional to the molar fraction: ai = i .[i]). In the
case of ionic solids, these activity coefficients i are generally used to express deviations from ideal models of
isolated defects at equilibrium.
2.3. Abnormal behavior near 1184/1185 K
2.3.1. A splitting of the phase diagram
Vallet proposes a separation of an upper subdomain W of the phase diagram from the lower
subdomain W’ on each part of the first order transformation -Fe -Fe [51]. Each subdomain is constituted
of three pseudo-phases W’j below and Wi above 1184 K. Because the properties of W’ and W are distinct, the
boundaries with - or -iron of the stability domains are also distinct. That is the reason for the existence of
points B and A, at the upper and lower end respectively of the corresponding curves in the phase diagram (see
[28], lines at 1184.15 K in Tables IV and V p. 723 and 724). The limit compositions on these boundaries yo(1)
= 0.9427 or zo(1) = 0.0573, and y’o(1’) = 0.9528 or zo(1’) = 0.0472 of W1 and W’1 in equilibrium with Fe-O
and Fe-O’ are proposed at points A and B, respectively, both assumed at 1184 K, which cannot strictly occur
as discussed below.

6
2.3.2. Thermodynamic inconsistency
In an extended and careful review published in 1991, Wriedt [17] asks questions about the isotherm
at 1184 K, and its assumed continuity, while it seems to correspond with transitions Wi/W’j, i.e., with five
sub-boundaries for the indexes 1/1, 2/1, 2/2, 2/3 and 3/3. Are they linked to the - Fe transformation? These
pending questions have no answer until the 1980s.
The basic equations governing the various equilibria between gases and solid phases (see equilibrium
diagram in Fig. 3) are listed below. Particularly at the two boundaries involving-Fecr or -Fecr (subscript
‘cr’ for ‘solid’, i.e., ‘crystallized’), equilibriacan be expressed:
1) on the boundaryFe/W’1 from point B to point C,
(1-zo(1’)) -Fecr + ½ O2 Fe1-zo(1’)O K = exp (Go/RT) (8a)
-Fecr Fegas K(gas) = p(Fegas) (8b)
(1-zo(1’)) Fegas + ½ O2 Fe1-zo(1’)O K(, gaz)= exp -(Go1/RT) = 1 / (p(Fegas). p’
½) (8c)
2) similarly, on the boundary Fe/W1 from point A to melting,
(1-zo(1)) -Fecr + ½ O2 Fe1-zo(1’)O K = exp (Go/RT) (8d)
-Fecr Fegas K(gas) = p (Fegas) (8e)
(1-zo(1)) Fegas + ½ O2 Fe1-zo(1)O K(, gaz)= exp -(Go2/RT) = 1 / (p(Fegas).p’
½) (8f )
At the arbitrarily unique temperature of 1184 K, it is thus necessary to apply two different partial
pressures p1 and p2 of Fe(gas), at equilibrium with the solid at points A and B. Obviously, at the unique
Fe equilibrium temperature, it exists only one value of the pressure p(Fegas) = 3.005x10⁻¹¹
atm. Thus, the
points A and B cannot be at the same temperature. Correlatively, in the case of the points A and B differing in
temperatures T(A) and T(B), the compositions zo(W)(A) and zo(W’)(B), the equilibrium partial pressures p'(A)
and p2(A), p'(B) and p1 (B) of oxygen and iron gas are necessarily different. Finally, a small difference in
temperatures, probably a few degrees, are to be determined experimentally in order to adjust this set of
parameters, which determines the phase diagram (Fig.II-3) close to the stable temperature of the -Fe
transition. In this situation, the bottom row in Table IV should be changed to a value of T(A) higher than
1184/1185 K, and the header line of Table V to a value of T(B) also higher than 1185 K, but lower than T(A)
in ([28] p. 723 and 724).
Note: If T(A) and T(B) differ from a typical value of 4 °C (see 2.3.4. Fe-O phase diagram close to 1185 K ), for example T(A) = 1191
K and T(B) = 1187 K, the partial pressures of iron are necessarily p(A)=p1=3.692 x10⁻¹¹ atm and p(B) = p2=3.220 x10⁻¹¹ atm
following tabulated data [52], [53], [54]. Thus, the differences between the two iron partial pressures is on the order of 0.4x10⁻¹¹ atm.
The corresponding partial pressures of oxygen are p’(A) = 4.829 x10⁻¹⁷ atm and p’(B) = 4.229 x10⁻¹⁷ atm, i.e. a difference of 0.6 x10⁻¹⁷
atm. The compositions zo(A) = 0.0571 and zo(B) = 0.0468 correspond to a gap of 0.01 in composition.
2.3.3. Phenomena observed close to the isotherm at 1185 K
Experimental confirmations of this hypothetical separation exist in the literature. Several of them are
interesting to be examined. Löhberg and Stannek separate the pre-exponential term a and the energy term b =
G/RT of an expression functionally similar to a Boltzmann distribution pH2O/pH2 = a.exp(b.z) expressed as a
function of T-1
in two segments intersecting in the vicinity of the Fe transition temperature in ([55] Fig. 8
and 9 p. 250).
Similarly, Janowski, Mrowec, Stokłosa separate in two segments the variation of the self-diffusion
coefficient D*Fe of iron in wüstite as a function of T-1
from their own results and several sets from the
literature in ([56] Fig. 7 p. 99). The intersection occurs for T-1
= 8.28 x 10⁻⁴
K-1
, i.e., at 935°C, of the segments
attributed to W and W’.
7
Jacobsson and Rosén, Guillermet and Per Gustafson, Sjödén, Seetharaman and Staffanson, Grønvold
et al. publish new experimental thermodynamic data of highly improved accuracy about the molar
thermodynamic properties of iron and wüstite [57] [58] [59] [60].
Sundman, in an assessment of the entire Fe-O system, formulate a model for the ‘pure iron corner’
(solid solutions Fe-O and Fe-O’) [16]. The assessment of Spencer and Kubaschewski is also relevant in
the same context [7].
A departure from a monotonous variation of the electromotive force of galvanic cells, near the
Fe transition, is evidenced from measurements at the iron/wüstite electrode, in several galvanic cells [57]
[59]. In addition, authors [59] publish their numerous determinations of the electromotive force (e.m.f.)
between 866.7 and 1339.3 K. An anharmonic transitional zone between two separate continuous variations,
not in continuation of each other, can be identified in the temperature range [1186-1194 K].
2.3.4. Consequences relevant to the Fe-O phase diagram
The Fe first order transition in the ‘pure iron corner’ of the phase diagram Fe-O is not
documented sufficiently. The left side in Fig. 3 displays literature data (relative to FeOx) concerning the
domain of this transition [7] [16] [61]. The temperature of the strictly pure FeFe transition is tabulated at
1184 3 K in the data base NIST-Janaf (1999-2011) [54]. At present, it is generally taken to be 1185 K (point
ø in Fig. 3).
Fig. 3. Equilibrium diagram (FeOx) between W1 and W’1 and ‘pure iron’, with both limit points A and B
of -Fe/W1 and -Fe/W’1 boundaries. Compositions NO = x/(1+x) are arbitrarily taken at 1184 K in paper [28].
Dashed lines correspond with hypothetical limits.
The Fe transitional enthalpy is known with a twenty percent dispersion from assessed and experimental
data, (see [58] Table 3 p. 604). Very few experimental studies are available concerning the P(eritectoid)
invariant point (Fe-O’, W’1, Fe-O) close to the temperature of the pure -Fe -Fe transition [61].
Sundman takes up the molar fractions ( at point P, ’ at point b in Fig. 3) of dissolved oxygen NO = x/(1+x)
= 16 x 10-6
and 6.8 x10⁻⁶
in - and -Fe respectively at 1185 K or 912 °C [16] (Fig. 3).
The separation of the boundary iron/wüstite into parts Fe-O/W1 from point A and Fe-O’ /W’1
from point B arises distinctly in the temperature range characterized in [59], following the suggested phase
diagram in the right part of Fig. 3. Two types of two-phase domains ( + W’1) and (W1 + W’1) have been
added hypothetically as well as an invariant point a’ (W’1, Fe-O, W1). As of now, the location of points A
and B remains to be determined precisely. New experimental data is necessary to confirm the preceding
suggestions.

8
For the subdomain of W’ below 912 °C, the information equivalent to that of W above 912 °C is more
difficult to access (see [44] Figs. 6 and 7 p. 12 and 13). An empirical relationship associated with the three
W’j requires a curvature term. The analytical expression has been taken as follows:
l’ = (a’jT-1
+ b’j) x2 + (c’j T
-1 + d’j) x + (e’j T
-1 + f’ j) (9)
The corresponding coefficients (a’j - f’ j) are available numerically in ([29] Table 1 p. 210).
Fig. 4. Phase diagram °C (l’, x) of solid wüstite FeOx under equilibrium following Raccah-Vallet-Carel; upper
temperature 1250 °C, lower one 592 °C at point C; coordinate l’ for log10p(O2). Points noted
by a capital letter are tabulated in [27], except the point in [28] and the point T in [62] [63] [64].
The sets of numerical relations detailed above for l’ as functions of x and T-1
allow the determination of the
transition lines or boundaries between domains of the pseudo-phases W1, W2 and W3, from -iron to
magnetite between 912 and around 1400 °C, and W’1, W’2 and W’3, from -iron to magnetite between 912
and 592 °C, at point C, as drawn in Fig. 4 (see precedent drawings [26] [27] [29]).
2.4. First evidences of phase modifications or pseudo-phases in the literature
2.4.1. Wagner jr’s team
In the course of (thermodynamics - defect structure) approaches by Carl Wagner, Wagner jr et al.
study the electrical conductivity at equilibrium as function of log pO2 [65]. With the help of their own
thermogravimetric data l’(x) [66], they state that the composition of the break on their curves (x) well agree
with that of the transitions Wi Wi+1 determined in Raccah’s work. So, the pseudo-phases are identified at
equilibrium outside of Vallet’s group for the first time (see [65] Table IV p. 955; also Annex A Fig. A1 a-).
The further studies of Wagner jr’s group about wüstite were concerned with transport phenomena in the bulk
and on the surface, in relation with the p to n transition.
2.4.2. Fender and Riley
From numerous accurate electromotive force measurements (e.m.f.) in galvanic cells, Fender and
Riley [67] brought the second experimental confirmation, outside of Vallet’s team, of the likely existence of

9
three pseudo-phases, and the location of the boundaries of the subdomains in the range 700-1350 °C. Their
plot of the equilibrium diagram is in fairly good agreement with that of Vallet et al. (see Annex A, Fig. A2).
2.5. Partial molar enthalpies and entropies. Convergence point
Fender and Riley, then later Vallet and Carel assessed the partial molar properties of an oxygen solid
solution (HO HO - ½ H°O2, SO SO - ½ S°O2) as functions of x [1.058 -1.172] for the three pseudo-
phases Wi (i=1,2,3) named also wI, wII and wIII (see [67] Table I p. 796, and infra in Figs. 5 and 6).
The following relations were formulated in [28] for the three Wi (i=1,2,3) at T >1184 K:
HO = 19.14475(ai.x + ci), (10h)
SO = -19.1447 (bi.x + di) (10s)
Fig. 5. HO from some authors. ─ : derived for the Wi (i=1-3) i.e. at T [1193 - 1523 K] from
thermogravimetry + CO2/CO [28]; : w I, - - : wII, and : wIII (two points only) by emf
at T [1023-1623 K] [67]; dash-dot line -.-.-: by calorimetry at 1348 K under vacuum (+ nO2) [68];
: by emf at T [873-1273 K] [69]; : by thermogravimetry + CO2/H2 at T [1373-1673 K] [70];
: by emf at T [823-1323 K] [71]; : by emf data at T [873-1373 K] [72] [13].
and, for the three W’j (j=1,2,3) at T< 1184 K:
(HO)’ = 19.14475 (a’j.x2 + c’j.x + e’j) (11h)
(SO)’ = -19.14475 (b’j.x2 + d’j.x + f’j) (11s)
Relations (10) for the Wi, and (11) for the W’j are independent of T, in accordance with the property
of regularity ([12] p. 81-85) of the solid solution wüstite identified in [41] but contested in [68]. HO is
represented in Fig. 5 from numerous available data sets. A convergence in the vicinity of the common
intersection point at x = 1.0713 (0.001) of the straight lines HO(x) from (10h) is globally noticeable.
Contrary to this contrived amalgamation process, the numerical adjustments presented next are related
principally to the initial results from Raccah [40] to [44] which form a well populated and coherent data set
at equilibrium, and for which it exists now a systematic interpretation by Vallet’s group [27] [28] [29], and
experimental confirmations [65] [67] [73].
The graphical representation of the relations (10h) and (11h), (10s) and (11s), in the case of the
isotherms at 1000 and 820 °C, is given in Fig. 6. Along the isotherm at 1000 °C, the three Wi are represented
by successive linear segments. For the two transitions Wi Wi+1 at decreasing iron content, a jump is
observed toward the lower molar heat and entropy of solution which are exothermic and exo-entropic. For x1/2
= 1.0782: (HO) = -3.5 kJ, (SO) = -2.3 J. K-1
, and x2/3 = 1.1154: (HO) = -10.5 kJ, (SO) = -8.3 J.K-1
.
Above 1184 K, the exothermic HO for W1 increases with x and z corresponding to oxygen
dissolution. For each O a vacancy and zero, one or two electronic holes are created simultaneously as the

10
clustering is in progress (see equation (4a)). For W3, HO is decreasing with x, probably because of the
formation of long-range ordering. For W2, HO varies in a manner intermediate between that for W1 and W3,
which corresponds to the observation that W2 is a solid solution of W1 and W3 [67].
Fig. 6. Partial molar enthalpy (HO - ½HoO2) and entropy (SO - ½S°O2) of solution of oxygen, through the stability
field of wüstite, whatever the temperature. Transitional jumps are at 820 °C (W’i) and 1000 °C (Wi).
Dashed lines are drawn in extrapolated or metastable zones.
Along the isotherm at 820 °C, the three W’i are represented by parabolic curves. Jumps (weaker in
amplitude than the ones at 1000 °C) are observed toward higher values for the molar exothermic transitions
W’jW’j+1, x1’/2’ = 1.071: (HO)’ = +10.9 kJ, (SO)’ = +6.3 J.K-1 and x2’/3’ = 1.1154: (HO)’ = +2.9 kJ, (SO)’ =
+2.7 J.K-1. A convergence of parabolas HO’(x) is observed for x = 1.0852 or y = 1-z = 0.9215 (0.004). This
convergence occurs for a composition different (y =1.3 10-2
) from that of point C (y = 0.935), and is not
defined as precisely for W’ as it is for W.
The Gibbs-Duhem relation leads to the iron solution property H Fe from HO (Fig. 7).
Fig. 7. Variations of the partial molar enthalpy (HFe - H°Fe) vs x for the isotherms at 1000 °C (Wi)
and 820 °C (W’j). For comparison: - . -: H Fe from e.m.f. measurements at 1000 °C by Asao et al.
([69] Table 3 p. 75); : Darken and Gurry determinations ([31] Table X p. 1408).
In the domain of W, exothermic transitional jumps are observed toward the higher values for the two
transitions Wi Wi+1 at equilibrium. At 1000 °C, the transition W1/W2 (x1/2=1.0782) is characterized by
(HFe)1/2 = 3.25 kJ.mol-1
, (SFe)1/2 = 2.56 J. K-1
.mol-1
. The transition W2/W3 (x2/3=1.1164) is characterized
by (HFe)2/3 = 12.06 kJ.mol-1
, ( Fe)2/3 = 9.47 J.K-1
.mol-1. In the domain of W’, the equivalent jumps are
exothermic as shown in Fig. 7 drawn for transitions at 820 °C.

11
As iron deficiency increases, the partial molar enthalpy of solution of iron HFe decreases for W1
and increases for W3, variations that are opposite to that of HO. The five determinations of Asao et al. at
1000 °C are distributed on a curve noticeably parallel to the set of the successive segments concerning W1,
W2 and W3 [69].
Equations xi/i+1(T) of the lines -the so-called boundaries- separating the domain of stability of single
pseudo-phases Wi and Wi+1 were adjusted following the analytical equations:
xi/i+1 = [(ci+1 - ci ) + T.(di+1 - di)] / [(ai – ai+1 ) + T.(bi – bi+1 )]
(see [26] p. 3680, equations (6)). Numerically, they are adjusted now to
x1/2 = (60412.0 - 41.3182T) / (56322.3 - 38.5509T) (12)
x2/3 = (25297.2 - 18.310T) / (23670.0 - 17.1941T) (13)
A metastable boundary can also be envisaged
x1/3 = (85709.2 - 59.6282T) / (79992.3 - 55.7450T) (14)
The authors in [43] remarked that the corresponding terms in the numerator and the denominator [of
equations (12), (13) and (14)] are almost exactly proportional in a same ratio of 1.07, i.e., (ci+1 - ci) / (ai - ai+1)
= (di+1 - di) / (bi - bi+1) 1.07, also close to Chaudron’s point composition. It results that the three pseudo-
phases are under equilibrium at T (K) under the same oxygen pressure for a composition x 1.07 (e.g., p’ 8
x10 -17
, 4 10 -15
or 8 x10 -11
atm at 1184, 1273, or 1573 K respectively), irrespective of index i. This result
constitutes the reason why the property HO (= -274.8 kJ.mol-1) of equation (9h) is shared by the three Wi's
with the same composition x 1.07 under the same equilibrium oxygen potential. The convergence at point
results of that fact. The iron partial molar properties converge also for H Fe = +87.8 kJ.mol-1
at 1000 °C. At
invariant point C (-Fe, W’1, Fe3O4) of abscissa xC = 1.0700, these properties are merged (HO = - 290.4
kJ.mol-1
and HFe = + 21.4 kJ.mol-1
).
It is noticeable that a common « kinetic origin » is characterized by x = 1.070 0.001 in W’ (see
Annex 2 « Re-analysis of kinetic data at 850 °C», derived from the experimental results [73]).
2.6. The triple point (W1, W2, W3) out of equilibrium
The point 8 (W1, W2, W3) was determined as the intersection of the extrapolated boundaries W1/W2
and W2/W3 at temperature 302 °C and composition y = 0.9322, directly below point and point C (yC
0.9350) (see [26] Table III and Fig. p. 3681).
Manenc et al. observed a disproportionation near 300 °C, in a miscibility gap, by inducing a slow
drop in temperature [74-75]. Fender and Riley remarked that wII (W2) behaves [(GO vs 1-x)/T] in its
specific region as a two-phase system above its critical temperature. Similarly to Vallet and Raccah [26], they
remarked that the extrapolation into the metastable domain below point C shows the phase separation into wI
(W1) and wIII (W3) in the vicinity of 315 °C » [67].
As early as 1977, Andersson and Sletnes studied conjointly the ordering and the preceding behavior
below 300 °C, in reference with the spinodal decomposition using electron diffraction and microscopy
(dark field images) [76] [77]. Typical patterns were attributed to the phase P’ (periodicity of 2.6ao), in the
composition interval y (of FeyO) [0.95-0.92]. After heat treatment for 20 min at 300 °C, a tetragonal or
orthorhombic symmetry was observed which can be compared to ordered P’-type regions. For compositions
less than y = 0.91 in Fe0.91O (z ≥ 0.09), the more ordered structure identified as P” was observed even after
quenching. Its parameters are a = b = c = 5ao.
These different observations indicate that W2 can be represented as a solid solution of W1 and W3,
consistent with the determinations of [HFe (x)]ie as determined below.

12
2.7. Trends to ordering at increasing z
The difference [HFe(x)] ie between the partial molar enthalpy of iron in (FeOx)i and FeOxo(i) on the
boundary with Fe was envisaged as an excess type property in order to tentatively establish links between
thermodynamic and defect structure properties [45]. The corresponding relations, using the previous
formalism established for [HO(x)] i ,[HFe(x)] i ,[SO(x)] i and [SFe(x)] i leading to Figs. II-6 and II-7 above, are
simply:
[ HO(x)] i
e = [HO(x) - HO(xo)]i = 19.14475(ai/2(x - xo(i))) (15h)
[SO(x)] i
e = [SO(x) -SO(xo)]i = -19.14475(bi/2(x - xo(i))) (15s)
[ HFe(x)] i
e = [HFe(x)- HFe(xo)]i = -19.14475(ai/4(x
2-xo(i)
2)) (16h)
[ SFe(x)] i
e = [SFe(x) -SFe (xo)]i = 19.14475(bi/4(x
2-xo(i)
2)) (16s)
Substituting the coefficients ai, bi and xo(i) on the -Fe/Wo(i) boundary by their numerical values yields Table
1. The sign of the term [HFe(y)] ie as well as the sign of its derivative /x is the sign of -a i. This term
corresponds to the energetic effect U on the iron lattice for the interaction between each additional O and a
mole of FeOx into which it is dissolved (at constant iron content), a vacancy and zero, one or two electronic
hole(s) being created (see supra relations 4a-4c).
Table 1 - Variations at 1273 K of excess properties [HO]ie and [SO]i
e .
FeOx/Fe1-zO x=1.0950
or z =0.0868
x=1.1420
or z =0.1243
W1: a1= 46753.4
b1= -7.3781
xo(1)= 1.0572*
z o(1)= 0.0541
[HO]1
e
[HFe]1
e
**
16.90 -18.19
[SO]1
e
[SFe]1
e**
2.67 -2.87
[HO]1
e [HFe]1
e
37.94 -41.72
[SO]1
e [SFe]1
e
5.99 -6.58
W2: a2= -9568.9
b2= 31.1728
xo(2)= 1.0522
z o(2)=0.0496
[HO]2
e
[HFe]2
e
-3.92 4.21
[SO]2
e [SFe]2
e
-12.78 13.76
[HO]2
e
[HFe]2
e
-8.23 9.03
[SO]2
e [SFe]2
e
-26.80 29.41
W3: a3= -33238.9
b3= 48.3669
xo(3) =1.0482
z o(3)=0.0460
[HO]3
e
[HFe]3
e
-14.90 15.97
[SO]3
e [SFe]3
e
-21.68 23.24
[HO]3
e [HFe]3
e
-29.85 32.69
[SO]3
e [SFe]3
e
-43.44 47.57
* For x= xo(i), all terms are equal to zero. ** The terms [HO]i
e and [HFe]i
e
are expressed in kJ.mol-1
, and the terms [SO]i
e and [SFe]i
e in J.K
-1.mol
-1.
The values of [HFe]ie in Table 1 show that:
1) for W1, the internal energy Um of the iron lattice (the term PVm is negligible compared to the
contribution Um in Hm) decreases as z increases, which corresponds to the exothermic formation energy of
clusters (m:n) that are thus favored (see Gokcen [5] p. 241-44, and [12] p. 42-44, and Desré and Hodaj [21] p.
91-96).

13
2) conversely, W3 is characterized by an increase in the lattice energy, which corresponds to the
completion of the cluster percolation and the formation of the superstructure (2.55a x 2.55a x 2.55a) named
P” by Manenc and characterized using HREM by Iijima [75] [78] [79].
3) likely because W2 is more than likely a solid solution of W1 and W3, the variation of Um is
intermediate.
Such trends were discussed previously by Fender and Riley when considering GO and HO in ([67] p. 797).
The positive and negative values of the term [SO] ie (see Table I) correspond mainly to a vibrational
entropy change in the oxygen sublattice [20] [70] [80]. In the case of the initially disordered pseudo-phase
W1, the excess entropy term weakly increasing with z shows that the disorder due to the formation of point
defects is predominant. Reversely, in the case of the pseudo-phase W3, increasing short- and long-range
orderings would be associated with increasing z values as indicated by a strong decrease of [ SFe(x)]3
e. These
entropy variations are related to the increasing frequency of the Fe-O bond because of larger clusters and/or
an increasing degree in their percolation until completion and superstructure. The pseudo-phase W2 can be
thought to appear at the starting threshold of the percolation of clusters, when the lattice becomes more rigid.
3. Several approaches of investigation
3.1. Burgmann’s review
In 1968, this author gathers some experimental results (electrical conductivity and transition p-to-n).
Because of numerous analogies with pyrrhotine Fe1-zS [81], he describes tentatively the defect structure in
terms of clusters (see [4] Fig. 5 p. 173). He proposes a conduction model involving the formation of an
acceptor band or of new states produced by the interaction of defects as z increases. The lattice contraction at
increasing z reduces the gap between the valence and conduction bands, inducing a p-to-n transition for
compositions z= 1/12 = 0.083 at 900 °C and z = 1/13 = 0.076 at 1300 °C ([4], Hillegas [82]). Such an overlap
is also considered later by Molenda, Stoklosa and Znamirowski [83].
3.2. Manenc’s phases P, P’, P”
As the most important result of a seminal work, Manenc describes three types of « phases » named P,
P’ and P”. He characterizes them after (rapid) quenching into water using X-ray diffraction. For an iron rich
wüstite (z < 0.08), vacancies and ions Fe3+
seem to be randomly distributed. This corresponds to the phase P
which has a weakly incomplete NaCl-type structure alone. Other diffraction patterns of more iron deficient
samples (0.08< z < 0.11) have additional reflections corresponding to a cubic cell with a repeating distance
2.6ao. Diffuse trails parallel to 100 directions connect these reflections. These features are characteristic of
the phase P’ alloyed with the phase P, and individually observed only in « oxygen rich » samples. Iron
vacancies are ordered in the two phases [75, 78].
Diffraction for a heated single crystal such as z = 0.08 shows that a superstructure exists in the range
800-1000 °C for this composition. The phase P’’ is observed in wüstite such as z 0.10 near 300 °C and when
slowly cooled, at the threshold of disproportionation yielding Fe and Fe3O4. New superstructure lines are then
characteristic of a commensurate 5X cubic cell [75, 78].
3.3. Mössbauer spectroscopy
Greenwood and Howe [84] interpret Mössbauer spectra in modeling the asymmetrical doublet as
evidencing the differing defect structures of the pseudo-phases identified by Vallet and Raccah [44], and
Fender and Riley [67] at high temperature. The quenching process produces nuclei leading to Manenc phases
P, P’, [(P+P’) for z [0.05-0.08], (P’) for z [0.08-0.10], and (P’’) for z > 0.10] below point C. The phases are
detectable from fine variations of quadrupole splitting resulting from cubic symmetry distortions. These
distortions can be evaluated for the single cluster (4:1), and the Koch and Cohen cluster (13:4). From a sample

14
such as z 0.05, the disproportionation gives rise to Fe0.918O (defect rich phase P’) and Fe0.976O (defect poor
phase P), because of a mixture of the (13:4) and (4:1) clusters.
Among numerous other Mössbauer studies reviewed by Long and Grandjean [15], Romanov,
Checherskaya and Tatsienko [85] [86], Hrynkiewicz et al. [87], Pattek-Janczyk et al. [88], this latter is of
particular interest. The authors modeled the asymmetric doublet with a singlet attributed to Fe3+
in
tetrahedral sites, and two doublets attributed to octahedral Fe2+
and Fe3+
. They associated the maximum
observed in the variation of the quadrupole splitting to the p-n transition described by [89]. This transition is
likely the same as the transition « metal Mott insulator » identified by Molenda, tokłosa and
Znamirowski [83].
Aldon and Jumas use the Mössbauer spectroscopy to evaluate precisely the reversible insertion of
lithium and the effects on the local and long-range orderings of the wüstite lattice. They characterize the
lithium as « an actor of electronic pressure » (see infra [110] in section 4.3. Nanocomposites. Epsilon-Fe).
3.4. First electronic-structural modeling
Goodenough’s modeling [1] is proposed as early as 1971. Considering the relations (2) associated
with thermogravimetric analyses, and relation p’1/s (17) corresponding to the conductivity [65], the
result s=6 in the W1 subdomain above 1060 °C characterizes a statistical distribution of vacancies and
electronic holes (Fe3+
), possibly corresponding to Manenc’s phase P. Below 1060 °C, the changes in values of
s correspond to an increasing association between vacancies and holes. In the W2 domain, triplets Fe3+
- VFe -
Fe3+
are partially ordered, improving Madelung energy. Numerous (4:1) clusters which form a superstructure
according to Koch & Cohen (see infra section 7.2. The historical cluster (13:4) and [130]) correspond to W3.
A mapping of the transfers of iron ions, and electronic exchanges is proposed as a mechanism, needing small
polarons related to energy differences between the top of the valence band and an acceptor level [1]. Later,
this author with Gleitzer will consider the wüstite again from the point of view of its electronic properties and
crystallographic structure. They will express some doubt concerning the role of the cluster (4:1) as only
building unit of larger clusters (see [11] p. 51-4).
3.5. Zvintchuk’s team
In 1973, Tchiong Tki Khong in Zvintchuk’s team, in collaboration with J. Manenc, studies samples
of wüstite of composition z [0.065-0.108] quenched from 1100 °C [90]. Electron diffraction reveals three
forms I, II and III corresponding to the modifications wI, wII and wIII of the phase diagram by Fender and
Riley [67], and to the phases P, P’, P’’. A correspondence with the three Wi is specified. The authors describe
a defect complex (16:6) of point symmetry m3m, formed of six tetrahedral corner sharing clusters (4:1)
distributed on the six faces of an empty cube. This cluster is represented on Fig.8.
Fig. 8. The m3m cluster (16:6) of <110> type corresponding to (z+t)/t = 2.66 (from ref. [90]).
Iron vacancy VFe (octahedral site)
Interstitial Fe3+
(tetrahedral site)

15
A later work by Shaïovitch, Zvintchuk and Vergazov describes a superstructure with a quadratic cell
P4 3m for a wüstite Fe1-0 .10O [91].
3.6. Worral and Coley. Isotopic kinetic transitions
More than 40 years after Raccah, Vallet et al. [26, 41-44, 48-49], Wagner jr et al. [65] [66], and
Fender and Riley [67], Worral and Coley evidence kinetic transitions related evidently to the pseudo-phases
[73]. Following the process first used by Temkin et al. at the surface of iron oxides [92-93], and then applied
by Grabke [94], Cramb and Belton [95], Mori, Morita and Sano [96], later by Zhang et al. [97] [98], Worral
and Coley study the kinetics of the carbon exchange in the equilibrium W/(CO2/CO mixtures) in which a
controlled proportion of 13
CO2 species was introduced. In such an environment, a specific equilibrium of
the carbon isotopes is established following:
13CO2 + CO
13CO + CO2
which can be viewed as the sum of the two half-reactions:
13CO2
13CO + Oads and CO + Oads CO2
as reflecting oxygen exchange on the surface of the sample and being conditioned by the electronic structure
in the bulk. The apparent rate constant is expressed as a function of oxygen activity aO as follows:
ka = k0.aO-m
or log ka = - m.log aO + logk0 (18)
The variation of log ka with the activity aO defined as being the ratio p(CO2)/p(CO), can be described by
three successive linear segments at 995 °C, with m = 0.51 (w1), 0.66 (w2), 1.03 (w3) in ([73] Fig. 8 and
equations [36] [37] [38] p. 820-1).
The authors observe only one transition attributed to two pseudo phases w’1-2 and w’3 along the
isotherm at 850 °C, no change being observed in the vicinity of the forecasted boundary w’1/w’2 by Vallet
and Carel [27]. The only observed transition appears as a discontinuity at the location of the transition W’2
W’3 forecasted for x = 1.090 at equilibrium. Nevertheless, the authors state that three pseudo-phases w’1, w’2
and w’3 probably exist, but that two of them could not be separated, either because they were not detectable
by electrical conductivity measurements as found before in [65], or because they were possibly « obscured by
the scatter ». Finally, Worral and Coley declared that, in their study, transitions at 850 °C and 995 °C were
observed « correspond[ing] exactly with the proposed pseudo-phase boundaries in quite good agreement with
the phase diagram by Vallet and Carel». Because of the identity of coefficients m in the correlations
concerning Wi and W’j for i=j, they attributed in a following review [22] three predominant clusters (7:2)
type II to w1 and w’1, (12:4) type II to w2 and w’2 and (16:5) type I to w3 and w’3.
Note: In Annex B and Fig. B2, a graphical and numerical re-analysis of Fig. 9 by ([73] p. 821) shows a possible
separation of the data in three sets at 850 °C, which correspond likely to the three W’j, provided that some data or groups
of data are located in subdomains not proposed as stable. In Annex A, Fig.A1, the location of the observed transitions is
represented by the set f-).
3.7. Takayama and Kimizuka’s phase modifications
Using thermogravimetric analyses under equilibrium oxygen pressure p’ defined by CO2/H2 mixtures,
Takayama and Kimizuka observe significant modifications in curves representing l’ vs log x in FeOx [70]. The
authors conclude to the existence of a transition between pseudo-phases (see [70] Table I and Annex A Fig.
A1 d-). Typical changes in slopes are clearly observed from their data.

16
Fig. 9. Variation of l’ vs log z for Fe1-zO at 1250 °C.
Three sets of data can be defined as three quasi-
linear relations.
To illustrate their results, we have transformed their representations for one temperature T=1523 K.
For this temperature, their data are interpreted in terms of two relations only:
For low x values (x = 1/(1-z)):
l’ = M1.x + B1 = 28.512 x - 41.366 (19)
For high x values:
l’ = M2.x + B2 = 23.288 x - 35.715 (20)
The new representations for l’ vs log z are done in Fig. 9. Two coefficients s can be defined as a first step,
using the hypothesis of a transition implying two pseudo-phases proposed by the authors: s close to 4 and s
close to 7.5. However, three correlations can be also defined as follows:
l’ = 4.4539 log z - 5.5685, l’ = 6.1378 log z - 3.6876, l’ = 9.5059 log z - 0.5046 (21)
from which three values for s can be derived. A first domain for low z values yields a coefficient s = 4.5. So,
it is possible to interpret the non-linear second domain in terms of two linear sequences with two coefficients
s = 6.1 and s = 9.5: these two last coefficients are quite close to those obtained from the data of Vallet et al.
The results of Takayama and Kimizuka [70] and those of Bransky and Hed [99] show a relative
agreement in the same domain of temperature (see also Annex A Fig. A1 b-), but disagree with results of
Fender, and those of Vallet because these authors did not observe any breaking point on the isothermal lines
above 911 °C (see infra section 10. Percolation approach, Nota: Metastabilities).
4. Electrical properties. Transitions. Percolation
In an extensive review about electrical properties, Gleitzer points out that the modeling of the electrical
conductivity of wüstite is relevant of the percolation concept [19]. The superimposition of the two kinds of
p-n and Wi Wi+1 transitions, almost independent of each other, and both function of z, is already
referenced in the Burgmann’s review [4].
Because of this common stress, it is not easy to correlate the p-n transition to the structure. Since the
percolation process is characterized experimentally by a steep variation of the studied property at a threshold
composition, the curves for the electrical conductivity vs composition can be interpreted in terms of
upgradable clusters and long-range ordering in the subdomains of W1, W2 and W3 [65] [100] [101].
Later in the present review (see Section 10 Percolation approach, Fig. 20), a statistical distribution of
clusters with two types of percolation modes is schematically represented through the phase diagram. This
cluster distribution can justify structurally the singularities of the integral and partial thermodynamic

17
properties (see above Figs. 1, 2, 5, 6, 7). Also, it can justify the distinct rate constants observed in kinetic
processes (see section 3.6. Kinetics transitions, and Annex B: Figs. B-1 and B-2).
4.1. The p to n transition
Tannhauser observe a thermo-electronic p to n transition around 1300 °C by thermal e.m.f. analyses of
a highly nonstoichiometric wüstite [89]. More precisely with Bransky [102], a change in sign of the Seebeck
coefficient is observed for polycrystalline samples near O/Fe 1.09 or z 0.083 at T [1010-1310 °C] and
near z 0.066 at 910 °C (Fig.10). The authors formalize the Seebeck coefficient , in the case of completely
ionized vacancies, when the hopping process is predominant:
= (k/e).(A/kT + ln (co-c)/c) (22)
where c = ‘concentration’ of charge carriers, co= ‘concentration’ of available sites for the charge carriers (see
also [103]).
The same formalism is used by Lafollet and Duquesnoy in the case of non-localized when the wüstite is
considered as an intrinsic semiconductor, i.e., doped by its own impurities [104].
They modeled = 0 for z = 0.104 at 1100 °C, and z = 0.108 at 1000 °C (see [104] in Fig. 10).
Fig. 10: Some determinations of the p-n transition by thermal e.m.f.. : Geiger et al. [66] not corrected for
platinum ; : Bransky and Tannhauser [102]; : Lafollet and Duquesnoy [104] by modeling; : Hillegas jr and
Wagner jr [105]; : Gartstein and Mason [106] by re-examination of Hillegas jr’s thesis [82].
Like in previous studies, Hodge and Bowen state that the experimental sign change of the thermal
electromotive force, from positive to negative, occurs at increasing values of z [107]. Their model considers
principally clusters (4:1) and electron holes trapped in octahedral sites adjacent to cluster vacancies. The
thermally activated hopping of these holes permits continuous paths through the crystal because of the high
point defect concentration between the zones separating the clusters.
In their studies on electrical conductivity, Ariya and Bratch, and Kozheurov and Mikhailov
observe modifications to the relationship (p’)1/n, closely related to the relationship z (p’)1/n
, where their
coefficient n ( s) varied in such a way that three subdomains can be defined [100] [101]. They find an
increase of the conductivity in two composition ranges, from z 0.048 to 0.079 then from 0.079 to 0.097, in
relation with the Fe/W and W/Fe3O4 boundaries.
4.2. Electrical conductivity
Neuschütz and Towidi establish a variation of the conductivity for T[700-1220 °C] from which
they inferred that the defect electrons jumped between Fe2+
and Fe3+
, the activation energy of the process
being 9.6 kJ.mol-1
[108].

18
Following Molenda, Stokłosa and Znamirowski, the conductivity can be the sum of an « extrinsic
conductivity σy » related to the nonstoichiometry and of an « intrinsic component σo » independent of the
defect concentration, i.e., of p’ [83]. Charge transport at high temperature would occur simultaneously in the
valence and conduction bands, and the dopant acceptor band due to Fe3+
in octahedral and tetrahedral sites.
Near the composition z ≈ 0.08, the acceptor band would overlap the valence band giving rise to a broad
metallic band close to the thermoelectric transition p to n for z ≈ 0.09 and corresponding to the stability limits
of W1 and W2-3. Experimental details are given in ref. [83] (Fig. 2 p. 519 and Fig. 4, see also Annex A, Fig.
A1 e-), where successive segments and breaks corresponding to the Raccah-Vallet’s isotherms have been
observed.
More recently, Toroker and Carter examined the possible improving of the conductivity of Fe1-zO
by doping the p- or n- conduction mode, with the aim of stabilizing the nanoscale fabrication of wüstite, and
then adapting the nanoparticles to create efficient solar light conversion materials [109].
They listed the procedures allowing the calculation of Marcus theory parameters for cluster models with
hydrogen dopant and substitutional Cu+, Li
+ and Na
+. They concluded that « iron vacancies drastically limit
the hole conductivity » while Li, H and Na dopants improve it. So, it would be interesting to suppress the
formation of vacancies by « alloying FeO », which would amplify the p-type conductivity.
Note: An extensive thermodynamic study of multiple substituted wüstites can be found in the work of Lykasov et al.
which is reviewed partly in [13] and [111]. Structural aspects of calcio- and magnesio-wüstites are available infra (see
Table II, and in Fig. 15)).
4.3. Nanocomposites. Epsilon-Fe
Aldon and Jumas examine the electrochemical redox phenomena at the negative electrode Fe/Fe1-z0O
formed by wüstite of limit-composition z0 (= 0.050 0.013) in Li-ion batteries [110]. The initial samples of
hematite powder, reduced in H2 at 800 °C, are quenched outside the furnace. The analyses by Mössbauer
spectroscopy and X-ray diffraction, after the first discharge, yield the nature and concentration of the products of
reduction of wüstite by Li. Nanoparticles of iron (2nm) embedded in a Li2O matrix are identified. A part of the
iron atoms appearing in the disproportionation is made of the -Fe phase which is stressed in the matrix under
a pressure evaluated at 6.7 GPa, and which is not ferromagnetic. It can be due to the extrusion from the W
structure. At the same time, small clusters of lacunary hematite are formed. These phenomena have been still
identified in the formation of « planetary materials, in the Earth’s inner core ». See also geological observations by
Hazen and Jeanloz [10].
5. Other kinetic and diffusional works
5.1. Iron self-diffusion
In 1963, Desmarescaux and Lacombe study self-diffusion in using isotopes 55
Fe and 59
Fe [112]. They
state experimentally (Fig. 11) that the self-diffusion coefficient D*Fe increases with z at a given temperature
T. At increasing T, because the clusters are dissociated, the rate of free vacancies is increased, the self-
diffusion coefficient too. They deduce that self-diffusion proceeded through a vacancy driven mechanism,
especially noticeable at high temperature. At lower temperatures, fewer free vacancies and more complex
vacancy-electron holes exist. Diffusion is then slower. The number of vacancies associated to Fe3+
cations
[the clusters] increases with z, so a compensation with the free vacancies implies a quasi-constant D*Fe
whatever z below 850 °C. These observations are interpreted in the Collongues’s review [18] with the help of
theoretical evaluations of the binding energies in clusters (see Sections 6.5. Cluster stability, and 6.6.
Diffusion and stability).

19
Fig. 11: Fe diffusion (from ref. [112], Fig.4) : log D*Fe vs 1/T.
Fe % = 75.6 z= 0.112; 76.0 0.093; 76.2 0.083; 76.5 0.067.
5.2. Isothermal kinetics
Landler and Komarek measure the loss of mass vs time M(t) in H2/H2O mixtures when reducing
polycrystalline samples by thermogravimetry [113]. In their calculations, the coefficients of iron self- and
chemical diffusion decrease for increasing z at constant T[800 - 1050 °C] because of « the increased
freezing due to repulsive interaction of the vacancies ». That corresponds to activation energy independent of
T. This observation is related primarily to the formation of clusters, then to the ordering of clusters in the bulk
(see Section 2.7. Trends to ordering).
Considering the relationship log(M/Mo) = n.log t + k, in which Mo is the total mass loss,
reduction kinetics data from the authors at 950, 1000 and 1050 °C can be separated into three regimes II, III,
and IV (see Annex B, Fig. B1). At 1000 °C, the calculated mean values of n are -0.72 (W3?), -0.49 (W2?) and
-0.3 (W1?), respectively [114]. A brief anharmonic sequence is observed at the transitions between two
reduction processes. The increase of 0.6 eV in the activation energies EIII = 1.31 eV and EII = 1.89 eV, for the
reduction sequences III then II, is observed a decreasing z, i.e., when the vacancy concentration decreases. It
corresponds to the decrease of the ordering on the boundary W3W2. This variation is opposite to other
results in the literature, particularly to ([112] Fig 5, see section 5.1. Self-diffusion). The three coefficients n
are primarily the signature of the bulk modifications by Landler and Komarek, while the three kinetic
coefficients m by Worral and Coley are primarily characteristic of surface phenomena [113] [73] (see [115]:
Bulk and surface process in the course of the reduction).
Similarly, successive different reduction sequences using H2O/H2 gas mixtures that exhibit
transitional anomalies can be observed by Rieke and Bohnenkamp [116] (see Annex A, Fig. A1 c-).
5.3. In situ diffusion
Rickert and Weppner combine a solid galvanic cell for the ionic conduction by O2-
through the
sample while with the other sample face in contact with a platinum foil [117]. The diffusion is studied in situ
during the relaxation from a composition to another, driven by controlled impulses of electrical potential.
Their main result is that the chemical diffusion coefficient increases with increasing z (i.e., with the vacancy
concentration), which disagrees with Landler and Komarek [113] and not with any other authors. Transitional
anomalies are clearly noticed (see [117] Fig. 6 and 7 p. 1856, and Fig. 8 p. 1857).

20
6. Relationships between defect structures and the phase diagram
We review key publications from authors who have attempted to solve the key challenge formulated
by Carl Wagner in 1930 of linking more tightly defect structure and thermodynamics, such as partial molar
properties or the equilibrium constant of formation of the clusters. Kinetics (diffusional) relations were also
developed.
6.1. Per Kofstad and Zeev Hed
Theses authors remark that z increases at constant p’ as T decreases, which is different than other
oxides, and likely due to a complex defect structure [2] [118] (see section 5.1. Iron self-diffusion by authors
[112]). They emphasize that there is some doubt that all the iron vacancies are doubly charged. The electron
holes associated to a vacancy can jump into only one of the 12 next nearest octahedral neighbors (FeFe°) and
one tetrahedral site (Fei°°°
). Most of octahedral vacancies are singly charged.
A model can thus be elaborated from the Roth complex [VFem(’) - Fei
n(°)-VFe
p(’)]q(’), n=1,3, (m,p) = 0,1,2. In
the relationship p’1/s, the s value is larger than the value in the similar relationship connecting z to p’
because vacancies would be neutral.
6.2. Toft Sørensen’s works
In a book devoted to nonstoichiometric oxides, Toft Sørensen then with El Sayed Ali [9] [46]
tentatively identify the defect structure of the « subphases » in using thermogravimetric data [l’- z] at 1000 -
1300 °C exclusively by Bransky and Hed [99]. They consider three main defects (doubly charged vacancy
VFe”, and tetrahedral complex defects (4:1)(m)-
and (6:2)) as defined by Catlow et al. (see [9] chapter 2). They
focus on the defect cluster differently ionized, which leads them to define a linear plot of l’ vs log y (≡z) with
minimal slopes 1/s in the relation z (p’)1/s. A second criterion concerns the so-called exclusion envelope,
i.e., the long-range order as a layer or a close packing structure. They localize in the wüstite equilibrium area
T(z) the predominant defect (4:1) plus a layer structure, (4:1) plus a close packing, (6:2) plus a layer structure,
according to T layers above 1300 °C, between 1300 and 1200 °C and below 1200°C, respectively. In
addition, iron vacancies VFe” are present on the right side of a line at composition z close to 0.09 (see [46], Fig. 7
p. 20). So, a structural characterization is roughly proposed, and the phase diagram of Fender and Riley [67]
and Vallet and Raccah [44] is approximately drawn again.
6.3. The C(luster) C(omponent) M(ethod)
Structural unit blocks S.S. I, II, III: positions : (16d), : (16c), : (8b), : (8a), : (48f), : (32e); a and d are for iron,
c and f for vacancies (see ref. (6), Table 7.1., p. 186). Short range order in terms of S.S and C.C. in the three sub-
domains; C.C. 1: I-6III, C.C. 2: II-6III, C.C. 3: I-6III-II. In the range [zo- z1/2], II and III increase, I decreases; in [z1/2-
z2/3], II and III decrease, 1 or 2 increases; in [z2/3- z1], 1 and 2 decrease, 3 increases.
Fig. 12: C.C.M. applied to wüstite (from ref. [121]). The three pseudo phases from zo on the -Fe/W1 boundary to
z1 on the W3/Fe3O4 boundary described with the help of three cluster components , , .

21
In the course of their theoretical work about oxides properties, Men’ et al. were concerned with the
wüstite phase [6] [119]. Men’ and Carel apply C.C.M. to model the wüstite solid solution [120] [121] [122].
The « cluster components » are defined from crystallographic positions forming unit blocks in the general
spinel structure. For example, three cluster components , and , and their concentration as a function of
z allow to build the lattice of the wüstite Fe1-zO, and to model some of its physical properties, taking into
account the pseudo-phases (Fig. 12).
6.4. Other modeling approaches.
Mrowec et al. work on defect clustering in the wüstite phase using a collection of data (z, log p’) from the literature [47], [14]. They envisage all the defect clusters suggested by Catlow and Fender [123], i.e.,
(4:1), (6:2), (8:3), (10:4), (12:4) and (16:5) with several ionization degrees including the highest. Elaborate
calculations of the equilibrium constants lead them to the assessment of the enthalpy and entropy of formation
of all these ionized clusters, then to HO independently of z and T, and to SO for z [0.055-0.145]. They
conclude that the (4:1) cluster is the most likely to occur and that the ionization degree increases with
temperature to reach the maximum value 5- at 1573 K.
Nowotny and Rekas [124] describe the defect structure and thermodynamic properties. They
investigate the clustering of point defects (iron vacancies and electron holes) across the entire domain using
the Debye-Hückel theory, which allows to use a product .[xi] in place of [xi], particularly for i=h°. With this
approach, the activity coefficients are merged with the sole mean coefficient f determined as a function of
the ionic force of the solution (and not of its square root). They modeled the interactions during the formation
of the cluster (4:1) taking into account activity instead of concentration. Sets of data (z, log p’) and (HO, z)
were gathered from the literature. They evaluated the enthalpy and entropy of formation of a cluster (4:1)5-
at
-396.7 kJ.mol-1
and +267.4 J.K-1
.mol-1
, respectively. They concluded that this cluster (4:1)n-
would be the
constitutive module of more extended clusters. An expression of the equilibrium constant for the cluster
formation is determined across the whole domain independently of the existence of pseudo-phase transitions.
6.5. Cluster stability
Catlow and Fender try first to access the defect structure by means of large-scale computation of the
binding energies following the Born model [123]. They envisage in a theoretical manner the clusters unity
(4:1), edge-sharing (6:2) and (8:3), corner sharing (16:5) precursor of Fe3O4. The location (zone [z, T] of the
phase diagram) of these clusters is suggested qualitatively, but not in relation with the pseudo phases.
Later, Catlow et al. assessed the formation energy and the relative stability of the clusters by means of
the Mott-Littleton method [125]. The cluster (12:4) <110> type by Lebreton and Hobbs is considered as
being the most stable extended cluster, after clusters (6:2) and (8:3) [126]. In a summary-paper [127], four
classes of clusters are envisaged: corner-sharing clusters (4:1), (7:2), and (16:5); edge-sharing clusters (6:2),
(8:3) and (12:4); ZnS blende like cluster (10:4) [127] [128] [129]; clusters (13:4) and (5:2) [130] [131].
The authors note that the (10:4) blende ZnS cluster envisaged by Grimes et al. [129] [132] is not the most
likely because it was characterized without taking into account the geometric relaxation [127].
Tomlinson and Catlow attempt to relate the structural modeling of short-range order, and the
macroscopic variation of z as a function of p’. The calculated binding energy per vacancy leads them to order
the clusters as follows: [(8:3)+1
, (12:4), (6:2), (16:5)-1, (12:5)
-1, (13:4)
-2, (4:1)
-1, (10:4)
-4, (5:2 M), (5:2 G)] from
2.24 to 0.71 eV, successively. Finally, they propose a mixture of clusters [(12:4), (6:2), (4:1)] for the
incommensurate sub-phase P’ [133].
Then, Grimes et al. consider the structure and stability of clusters with different coordination types
[132] [134]. They base their analysis on a generalized crystal field for the 3d electrons of Fe3+
and Fe2+
,
including the energy of the orbitals 2s and 2p of oxygen. Their computation of the binding energy per

22
vacancy favors the clusters <110> ZnS blende and <111> spinel type stacking. It rules out clusters (8:3) and
(10:4), based on <100> stacking of (4:1) units, and the Koch and Cohen (13:4) cluster. Within the lower field
of stoichiometry (P’ phase), smaller clusters coexist including (4:1), (6:2), (7:2) <110>, (10:4) ZnS blende type,
and (7:2) <111> spinel type. Larger clusters from the (12:4) <110> type, (18:6), (16:5) spinel <111> type, (16:5)
<110> type and (16:7) <110> ZnS blende type clusters can be invoked at higher nonstoichiometry (P’’ phase).
Finally, they assert that the charge of the clusters should be zero in order to agree with experimental data.
6.6. Diffusion and stability
In a review about nonstoichiometric oxides, Collongues [18] envisages particularly the clustering as
specified by Desmarescaux and Lacombe (see section 5.1. Self-diffusion of iron). The activation energy of the
diffusion increases with increasing z, while the opposite effect is the principal rule. « Vacancy clusters » are
the reason of this unusual behavior. Catlow et al.’s calculations of (Fe3+
- vacancy) binding energy indicate
that clusters, such as (6:2) or (8:3) of size lower than that of (16:5) (precursor of magnetite), are more stable
than this latter cluster. This feature would indicate that even a cluster structurally far from magnetite is
responsible of the reduced diffusion process. The existence of three domains in the phase diagram is
envisaged.
Note: The classification of the clusters become more complicated because of the increasing number of proposals in the
literature. Initially, only the criterion of corner or edge sharing of the basic (4:1) units was needed. Mixed cases were
thought to be the exception. Lebreton and Hobbs [126] introduced three way of clustering: edge sharing along <100>
(Type I), corner sharing along <110> (Type II), and corner sharing along <111> (Type III). Mixed ways are also to be
envisaged. Clusters based on composition alone are possible exceptions (e.g., cluster (10:3)). Labidi and Monty (see
[135] p. 100-101) resumed the situation differently with the types 1 (face shared) aligned in <100> direction, 2 (edge
shared) aligned in <110> direction, and 3 (corner shared) aligned in <111> direction. Worral and Coley (see [22] p.
24-26) classified the clusters in three types defined as either type 1 (corner shared as in magnetite), type 2 (edge shared
sharing one octahedral vacancy), or type 3 (edge shared sharing two octahedral vacancies).
7. Structural approaches. Models for short- and long-range ordering
7.1. Roth model: the cluster (2:1)
Considering the experimental uncertainties inherent to X-ray diffraction on polycrystalline oxides, it
is more suitable to use neutron diffraction experiments to determine correctly the site occupancies relative to
iron atoms in octahedral and tetrahedral sites of the NaCl-like lattice. Initial results relative to quenched
wüstite are obtained using neutron diffraction by W. L. Roth who determines the octahedral and tetrahedral
site occupancies of vacancies and Fe3+
cations, respectively represented by (z+t) and t [35]. The
characterization of the ratio R = (z+t)/t was found close to R=2 for samples quenched from high temperatures.
The neutron diffraction patterns obtained at 290 K and 4.2 K suggested the presence of defects constituted of
two cation vacancies associated with one interstitial cation in the tetrahedral site. These two characteristics
suggested a trend to the magnetite structure. In addition, the average magnetic moment per cation site was
found to be much smaller than expected.
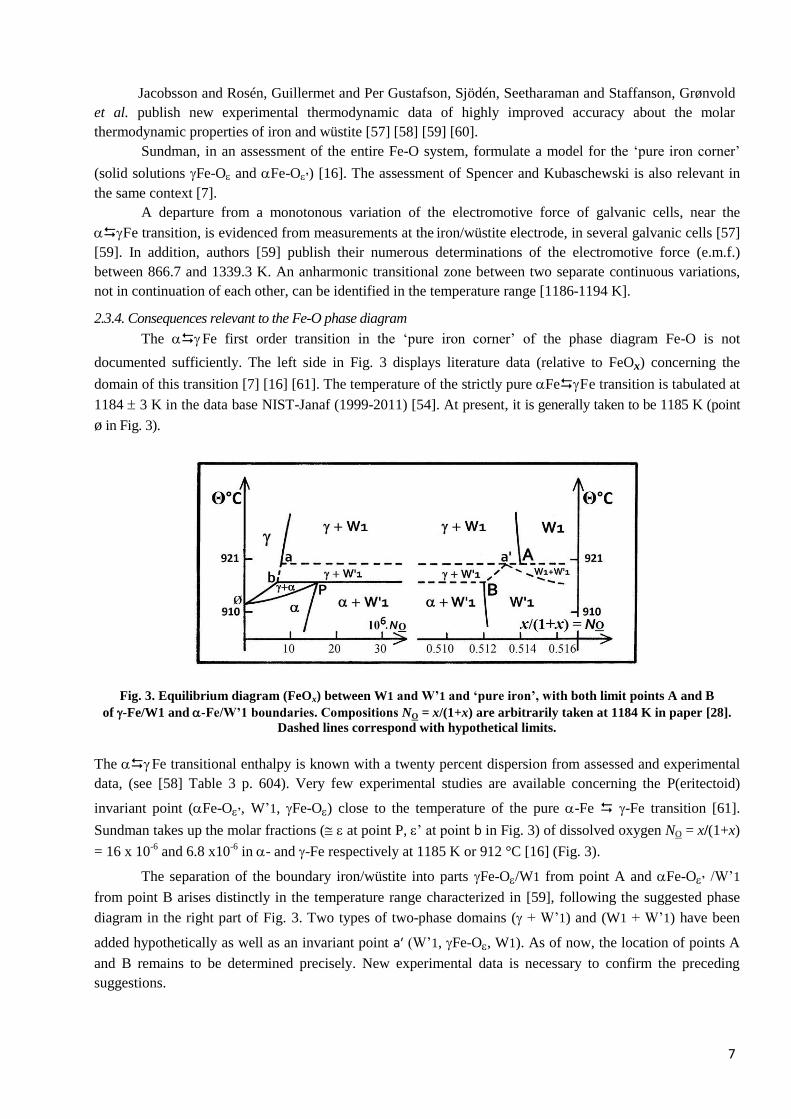
7.2. The historical Koch and Cohen cluster (13:4)
In 1969, Koch and Cohen publish a study by X-ray diffraction on a single crystal of wüstite Fe0.902O
(z=0.098) obtained after quenching from 1000 °C, and « corresponding to the P’ phase of Manenc » [130].
The authors proposed a new commensurate defect structure based on (13:4) large clusters (Fig. 13) distributed
in the fcc lattice (cell parameter a) with a repetition distance (3a, 3a, 3a) noted as 3X. For the first time, a
detailed crystallographic determination proposed a cluster corresponding to the corner sharing <110> type
agglomeration of four basic (4:1) clusters.
23
Fig. 13: The Koch and Cohen cluster (13:4)
associated with a 3X commensurate structure of
wüstite Fe0.902O.
To perform their structural refinements, the authors fixed this cluster model assuming that the resulting
superstructure should have a periodicity of 3X (the clusters being arranged only with regular distances of
three cell parameters), in agreement with the known composition z=0.098, despite the fact that the additional
peaks correspond to a superstructure 2.6X incompatible with their assumption.
7.3. Neutron diffraction
Using in situ neutron diffraction experiments, Cheetham, Fender and Taylor [136] show that the
ratio R = (z+t)/t ranges between 3 and 4, with a mean value of 3.2, which can be compatible with a specific
(13:4) cluster (R = 3.25).
Using neutron diffraction at low and room temperature, coupled with magnetic scattering, Battle and
Cheetham determine ratios R = 2.78, 2.82, and 3.01 and conclude that a cluster (8:3) can be consistent with
their observations [137] and the preceding calculations of Catlow et al. (see [9] Chapter 8 p. 407-410:
summary of these results by Cheetham). They couple neutron diffraction experiments to Mössbauer effect
analyses and study the antiferromagnetic coupling of iron cations in octahedral and tetrahedral sites of the
FeO lattice (see [137] Fig. 4 p. 343). For the first time, these authors show that atomic clustering observed in
quenched samples (out of equilibrium) can be characterized from the study of magnetic properties of clusters
in a lattice. This result will be used again by Saines et al. [138].
The numerous results obtained by Radler, Cohen and Faber jr from neutron diffraction patterns of
polycrystalline samples, under equilibrium, yield values of R > 3 corresponding to mixtures of clusters at high
temperature, and R < 3 to clusters larger than (10:3) below 1173 K [139]. This result could indicate a possible
differentiation between the structures of W and W'.
Schweika et al. find a ratio of vacancies to interstitials R = 4.0 (±0.5) obtained under in situ
conditions by neutron diffuse scattering from a single crystal with composition z = 0.08, at T=1150 °C [140,
141]. Their analysis of the diffuse scattering patterns leads them to conclude that 30% of the vacancies are
free, while a further 15% of the defects are bound in isolated clusters (4:1). In their analysis, the authors state
that their results invalidate the predominance of large clusters at elevated z. For example, the (13:4) cluster
cannot fit the diffuse scattering that they characterized near the origin.
Saines et al. in Cheetham’s team study by neutron diffraction a polycrystalline sample of wüstite
Fe0.902O quenched from 900 °C (from the domain of W’) [138]. They derive nuclear and magnetic clusters
from an elaborate Reverse Monte Carlo modeling technique. The nuclear structure is described by islands of
V4T units connected along the <110> directions « into a Koch-Cohen arrangement ». The magnetic structure
in the bulk between the clusters is described as a « non-collinear variant » of the antiferromagnetic structure
along the [111] axis as previously envisaged in [137]. Free vacancies are near the clusters. This structural
approach can be compared with the paracrystalline description of the defect distribution by Welberry et al.
[142] [143] [144].

24
7.4. X-ray diffraction
Welberry et al. present a detailed study of X-ray diffuse scattering for a single crystal with
composition z=0.057, obtained after quenching from a temperature which is not specified. Their sample
corresponds either to the Manenc’s phase P (see [75] [76]), or to the W1 domain proposed by Vallet et al.
[26]-[29]. The X-ray diffuse scattering analysis coupled with a paracrystalline modeling gives information
on defect distribution, defect cluster size, number of interstitials, and lattice strain. The authors describe
(statistically) a specific crystal constituted of ordered zones of clusters randomly distributed in a fcc lattice
[142] [143] [144].
7.5. Gavarri et alii ’s works
In 1979, using in situ neutron diffraction experiments, Gavarri, Carel and Weigel develop an analysis
of the structural evolution of wüstite in CO2/CO environments at high temperature [145]. A systematic
determination of the ratio of the vacancy rate (z+t) divided by the interstitial rate t, R= (z+t)/t, is carried out.
Quasi constant values of R close to 2.4 ± 0.4, at two equilibrium temperatures (985 and 1075 °C) and
compositions z ranging between 0.058 and 0.120, are determined, with standard errors induced by the
uncertainties on the separation between Bragg peaks and a complex diffuse scattering.
Fig. 14: R =(z+t)/t values vs z, determined under equilibrium, from the literature.
: at 900°C [131]; : at 800°C and : at 925, 1050, 1125, 1180°C [136]; : at 1050°C and : at 850-1100°C
[139]; : at 1150°C [141]; : at 1075°C and : at 985°C [145].
Fig. 14 displays the values of R obtained by different authors. In the case of studies made in situ,
most of the values of R range between 2.4 and 3.5. The authors observe two types of signals: (i) Bragg peaks
from which the ratio R is determined, (ii) additional scattering corresponding to superstructure peaks, and
thermal and static diffuse scattering associated with defect clustering, disorder and static distortions (see [145]
and infra Fig. 15). The intensities IA(T, z) of this additional scattering increases linearly with composition z
and decreases with temperature.
The ratios IA/I220, where I220 is the intensity of the (220) Bragg peak, vary as follows:
• IA/I220 (985 °C) = 0.19 + 4.05(z-0.062) (23)
• IA/I220 (1075 °C) = 0.15 + 4.25 (z-0.058) (24)
Therefore, these linear variations coupled with a small variation of the superstructure parameter k suggest a
quasi-invariance of cluster size with clusters agglomerated in domains, and with the size of these domains

25
increasing with z. The position of the centroid of this scattering allows the determination of an average
superstructure corresponding to an irregular spacing of clusters quasi-constant with z or T. The average
distance between clusters is evaluated to 2.7a0, a0 being the cell parameter of ideal wüstite for a fixed
temperature.
In later works by neutron diffraction on quenched samples of magnesio- and calcio-wüstites, using
Rietveld refinements, Gavarri et al. [128] [146] determined R values close to 2.5 for pure wüstites or for
magnesio-wüstites Fe(1-z-y)MgyO. In the case of calcio-wüstites Fe(1-z-y)CayO, as the composition y increased,
the ratio R increased strongly with R > 4 and the superstructure vanished. Under these conditions, the cluster
sizes would be strongly modified, and a majority of free vacancies would appear likely. These studies
demonstrate that the formation of clusters is stabilized by Mg doping, and destabilized by Ca doping,
producing free vacancies coexisting with residual clusters.
Fig. 15 shows a neutron diffraction pattern obtained from a quenched polycrystalline calcio-wüstite
(z= 0.065; y = 0.030; R = 3.3 ±0.5). In addition to Bragg peaks, the complex signal due to the superstructure
and the structural disorder can be observed.
Fig. 15. Neutron diffraction pattern ( = 1.9 Å) of a quenched polycrystalline calcio-wustite Fe1-z-yCayO in room
conditions [146]. Presence of a large diffuse scattering (IA) due to the superstructure (k close to 2.7), and (110)
small peak (36° 2) due to vacancies and interstitial Fe3+
in the lattice. The intensity of IA decreases with the
calcium fraction y. Cell parameter a(25 °C) = 4.3164 Å. R=(z+t)/t=3.3.
Fig. 16. R values vs z from literature determined after quenching.
Quenched Fe1-zO: : Gavarri, Carel, Weigel [145]; WMg and WCa: : Carel and Gavarri [146];
Quenched Fe1-zO: : Roth [35]; : Smuts [147]; : Battle and Cheetham [137]

26
It is to be noted that the diffuse scattering due to long-range ordering is similar in diffraction patterns
of quenched and in situ samples. Consequently, only a slight difference would exist between high
temperatures and room temperature for the nature of defects and their organization in the fcc lattice.
Table 2 lists the values of R corresponding to the quenched pure and substituted wüstites resulting
from these studies (magnesio- and calcio- wüstites are noted WMg and WCa respectively). The values of the
ratio R = (z+t)/t obtained from the literature on quenched, pure and Ca or Mg substituted, wüstites are
displayed in Fig. 16. The utmost value R = 8.2 is obtained for a calcium rich calcio-wüstite (y=0.05).
Table 2- R = (z+t)/t values obtained from Rietveld analyses
of neutron diffraction patterns of quenched substituted wüstites (from ref. [146]).
Fe1-z-y MgyO Fraction y (Mg) R = (z+t)/t (*)
z=0.065 0.075 2.53(0.5)
z=0.085 0.030 2.88(0.6)
Fe1-z-y CayO Fraction y (Ca) R = (z+t)/t
z=0.0688 0.010 2.20(0.5)
z=0.0649 (**) 0.030 (*) 3.31(0.5)
z= 0.0534 0.050 8.22(4.0)
z=0.085 0.010 2.37(0.5)
z=0.0899 0.030 3.39(0.5)
(*) experimental uncertainty (due to diffuse scattering); (**) See Fig. 16.
7. 6. T(ransmission) E(lectron) M(icroscopy) analyses
In the past, microstructural analyses using electron diffraction and HREM images were performed (see
Andersson and Sletnes [76]). The images obtained by Iijima for a sample Fe0.92O « provided by Prof. Cohen
» are often referenced [79]. The presence of the hypothetical cluster (10:4) <110> type with a ZnS-blende
configuration has been particularly envisaged.
When re-interpreting the images obtained from electron microscopy experiments by Ishiguro and
Nagakura [148], Gavarri, Carel, Weigel [149], then Nihoul, Gavarri, Carel [150] show that this cluster
corresponding to the ideal ratio R = 2.5 is compatible with the experimental data available (at least for
quenched wüstites). This cluster depicted in Fig. 17 is formed of a « FeO » cubic cell surrounded by an
envelope of Fe3+
cations with total 3D dimension (2a x 2a x 2a).
Fig. 17. The cluster (10:4) ZnS blende <110> type.
= Fe3+
in tetrahedral site
= Iron vacancy in octahedral site
Fe1-zO unit cell
parameter

27
In the case of crystals quenched from1000 °C, and with a composition z = 0.10 [148], the formation
of local ordered domains of these clusters can be at the origin of all observations corresponding to a mean
ratio R close to 2.5, and a quasi-invariant superstructure. The authors propose a progressive ordering of
clusters as z increased: for low z values, repetition distances 3a linkable to variety P by Manenc [73], or W1,
are observed. For intermediate z values, repetition distances 3a and (2.55a x 2.55a x 2.55a) are formed in local
zones linkable to W3 or P”.
A specific well-ordered superstructure can be based on a 3D supercell with parameters (5a x 5a x 5a). This
superlattice can be associated with the limit evolution at the boundary W3/Fe3O4. Such a superstructure was
depicted at equilibrium by Shaïovitch, Zvinchuk and Vergazov [91]. Finally, the distinction between
« varieties of wüstite » or pseudo-phases can be due to both modifications of long-range order of clusters and
the coexistence of different clusters that include free vacancies.
To define an isolated cluster correctly, particularly the ZnS blende defect cluster (10:4), it is
necessary to take into account its envelope of Fe2+
and Fe3+
cations in octahedral sites.
The charge of the cluster can be postulated as a first approximation by assuming the individual charges of
vacancies and of iron atoms. In Fig. 18 is illustrated the possible arrangement of these defect clusters (10:4), in
the fcc lattice. The minimum distance between clusters is [(2.5a)2 + (0.5a)
2]½ = 2.55a, and with allowed
distances up to 3a. This model is based on a cluster core (10:4) with double envelope of octahedral iron
cations.
If we assume that a cluster (m:n) has a global charge Q= 3n-mq (m vacancies with formal charges q
(=2,1,0) and n interstitials Fei°°°
with charges +3), then the (10:4) cluster has a charge of Q= -8, +2, or +12
for q= 2, 1 or 0, respectively. The electroneutrality is ensured by envelopes with charges -Q.
Using this type of defect structure, a model of ordered (10:4) clusters is proposed [149] [150], thus allowing
simulation of HREM images in the two directions [001] and [101] of the crystal. These hypothetical
distributions of clusters (Fig. 19) are in agreement with the HREM images by Ishiguro and Nagakura [148].
Fig. 18. Various orderings of clusters (10:4) in the fcc
lattice of wüstite. The basic cluster can be the (13:4),
the (10:4) or other possibilities with 4 interstitial sites
occupied by cations Fe3+
. The disorder can develop
by statistical displacement in one, two or three
directions. 2.55a could be the smaller inter-cluster
distance (a = cell parameter of the “FeO” lattice).

28
Fig. 19. Model of local ordering of (10:4) blende ZnS clusters, in agreement
with the experimental HREM images by Ishiguro and Nagakura [148] (from ref. [149]).
8. Hypothesis of a mixture of defect clusters, and/or cluster zones
8.1. Mixture of clusters
Based on previous publications by Gavarri et al. [145] [151], a specific relationship can be established
taking into account ordered zones of clusters and zones in which free vacancies are distributed. A mixture of
different clusters (m:n)1 and (m:n)2 can coexist with additional free vacancies. As a first approximation, the
authors consider a lattice based on N cells of Fe1-zO, with a proportion V(z) of zones without defect. If Ni is
the number of cells where clusters (m:n)i are formed, with the characteristics mi and ni of a specific cluster,
and the distance ki.a between two clusters, then the relation between cluster size and long-range order in the
case of the fcc lattice of wüstite can be expressed as follows:
1-V(z) = 4z . i { i (ki)3 / (mi-ni) } with i = Ni/N (25)
For a unique cluster with continuous order (high z values), the relation (25) yields:
(m-n) / (k)3 = 4z (m-n) = 4zk
3 (26)
Considering the experimental values of k available in the literature, ranging between 2.5 and 3, this
parameter k is characteristic of zones in which clusters are ordered partially. This means that, for low
values of z, zones without clusters would exist and that they would be occupied by isolated defects (i.e., free
vacancies). The major part of the crystal lattice would be dominated by disordered point defects, and
electrical conduction would be due to holes. For intermediate values of z, the cluster zones would be
progressively joining together, forming percolation paths of ordered zones. A mixed conduction mode would
be expected. For high values of z, the lattice would be occupied fully by ordered clusters, with likely small
changes in the arrangement of clusters. Electrons in conduction band would mainly condition the electrical
conduction.
This hypothetical description is in correspondence with the W1 disordered pseudo-phase and a
conduction of p type, the intermediate pseudo-phase W2 as a mixture of cluster zones and free vacancy zones
with mixed conduction, i.e., (holes +) and (electrons -) coexisting at short distance, and the ordered pseudo-
phase W3 with conduction of n type from electrons in the conduction band.

29
8.2. Variation of parameter k
Numerous structural data can be found in the studies by Bauer, Pianelli et al. ([8] Part I and [152]
Part II). These authors develop a series of experiments using X-ray diffraction on powders of quenched
wüstites. They observe linear variations of the cell parameter as a function of composition z, and of the
position of superstructure peaks. They characterize these peaks with parameter = 1/k, where k designates
the superstructure parameter discussed previously. Parameter varies between 0.37 and 0.39, corresponding
to values of k between 2.7 and 2.56. This variation observed in quenched samples is in good agreement with
the model presented in (section 7.6. TEM analysis) with a minimum k value of 2.55. Authors [8, 152] consider
that their data did not permit to observe any phase transition. However, they suggest that wüstite can be
described by an incommensurate lattice of clusters, with the presence of different clusters based on cluster
(4:1).
8.3. Statistical analysis of diffuse scattering
Gartstein and Mason [106] show that p conduction is observed in wüstite and that electrical
conduction is based on a hopping mechanism between adjacent clusters. Later, Gartstein et al. publish a
crystallographic analysis of a Fe1-zO (z=0.07) single crystal using X-ray diffraction at 1173 K [131] and
[153]. They develop a detailed analysis of diffuse scattering and Bragg peaks, and conclude to the existence
of a mixture of clusters (13:4) and asymmetric new clusters (5:2) constituted of 5 vacancies and 2 interstitials
corresponding to the ideal ratio R = 2.5. They propose an ordering of these clusters with an average
repetition distance of 2.5a, close to the hypothetic value of 2.55a proposed in [149] [150].
8.4. Summary
To conclude this section, it can be noted that there is an inherent difference between the concept of a
mixture of disordered clusters with various forms, and the concept of zones with identical disordered clusters,
coexisting with zones of free point defects. The concept of incommensurability, applied to specific
compositions z, was also proposed as a mathematical approach of disorder (see Yamamoto [154] and Weigel
et al. [155]). Finally, the proposition of the irregular cluster (5:2), resulting from the analysis of diffuse
scattering by Gartstein, Mason, Cohen [131] [153], seemed to be compatible with the quasi-constant value
R=(z+t)/t = 2.4 0.4 [145].
9. Defect clustering and equilibrium equations
In this section, using basic equilibrium equations from the literature (see particularly [9] and [46]), we
propose a new presentation of defect equilibrium equations for wüstite.
It is important to remind that, in Fe1-zO where only Fe2+
(also noted FeFe) and Fe3+
cations (also noted
FeFe°
or FeFe°°°
, for cations in octahedral or tetrahedral sites, respectively) can coexist, cation vacancies can
have one of three possible stable charges: doubly charged vacancies VFe'', simply charged vacancies VFe', and
neutral vacancies VFex (noted VFe). Singly charged iron vacancies VFe’ were proposed previously in place of
doubly charged vacancies VFe” by Kofstad and Hed [118]. Vacancies of the oxygen sublattice are not
considered because they occur in negligible numbers compared to the iron vacancies.
In section 2.2. Modifications or pseudo-phases, the equilibrium constant (4b) of the hypothetical
equilibria (4a), in which the activity of oxygen OO in the solid is taken equal to 1, can be developed with q=0,
1 or 2 following the general expression in which s =2(q+1):
log z = (1/s). l’ + (1/s) log (K/C)2 (with C = (q)
2q) (27)
(identical to equation (4c)). The three hypothetical values of s corresponding to q = 2, 1, and 0 are s = 6, 4,
and 2, respectively.
The modifications of q can be described in terms of two equilibriums involving holes h° in the valence band
VFe”+ h° VFe’
and
VFe’ + h° VFe (28)

30
Therefore, three domains corresponding to the three types of iron vacancies can exist in all systems presenting
significant cation deficiency. In the case of Fe1-zO, additional reactions occur since two valences (Fe2+
and
Fe3+
) exist:
FeFe + h° FeFe
° (Fe3+ in octahedral sites)
and FeFe° Fei
°°° (Fe3+ in tetrahedral sites) + VFe” (additional cation vacancy) (29)
As a first approximation, assuming that the sole point defects are iron vacancies, associated with Fe3+
(FeFe° )
and coexisting with Fe2+
(FeFe) in Fe1-zO, the general relationship between composition z and oxygen partial
pressure p’ is as follows
q FeFe + ½ O2 q FeFe° + V
q(’) + OO Kq = [FeFe° ]
q.[ V
q(’)] / ([FeFe]q.p’
½) (30)
In this expression, [FeFe] ≈ 1-3z and [FeFe°] ≈ 2z.
As all molar fractions are related to the composition z, the next relation can be derived:
Kq = [FeFe°]q.[ V
q(’)] / ([FeFe]q.p’
½) = 2
q.z
(q+1)/(1-3z)
q.p’
½ (31)
If this simple model is correct, then the term (1-3z) should vary slowly with z in a reduced composition range,
meaning that the activity of FeFe can be considered as being constant. Under this assumption, z is roughly
proportional to (p’)1/s, with s = 2(q+1) being an integer characteristic of the nature of the defects. For q = 2
(doubly charged vacancies) we obtain s ≈ 6. For q = 1 (singly charged vacancies), s ≈ 4. For neutral
vacancies, s ≈ 2.
Now, let us consider complex clusters (m:n)Q with variable formal charge Q and successive reactions
in which vacant tetrahedral sites VT are introduced:
2FeFe+½O2 2FeFe° + VFe
q(’) + (2-q)e’+OO (32a)
FeFe° + VT Fei
°°° + VFe
q(’) + (2-q)e’ (32b)
The formation of stable cluster can be written:
nFei°°°
+ mVFeq(’) {n Fei
°°°, m VFe
q(’)}Q (32c)
with Q = 3n-qm (positive or negative charge). The cluster will be noted: CL = {n Fei°°°
, m VFeq(’)}Q
.
The formal charge Q of a cluster is assumed to result from individual charges of vacancies with the invariant
charge of interstitials Fe3+
(Fei°°°
) as a first approximation. However, the Fe3+
interstitial can be modified into
Fe2+
interstitial cation due to electron jumping, and as a result a more complete model should take into
account various possible Q values of cluster charges due to the modification of interstitial cation charges.
Considering the formation of clusters CL coexisting with point defects FeFe° and VFe
q(’), a more
elaborate equation (32a) can be expressed as follows:
2(M)FeFe + nVT + ½(M)O2
{n Fei°°°
, m VFeq(’)}Q
+ (2M-n).FeFe° + (M-m+n).VFe
q(’) + (M+n)(2-q).e’ + (M).OO (33a)
with the hypothesis: Q = 3n-qm (positive or negative).
In equation (33a), the integer M m is introduced arbitrarily to take into account the possible presence of
additional free species FeFe° and VFe
q(’), associated with free electrons in the conduction band. The additional
vacant tetrahedral sites are the vacant sites VT able to receive an interstitial cation Fei°.
As a major fraction of these sites (8 sites for 4 FeO units in a fcc cell) is vacant, their activity can be
considered as being quasi-constant, and does not play a significant role in the calculation of equilibrium

31
constants. The resulting equilibrium constant is as follows, with the reduced notation [CL] = [n Fei°°°
, m
VFeq(’)Q
]:
K(T) = [CL].[FeFe°](2M-n)
.[VFeq(’)](M-m+n)
.[e’](M+n)(2-q)
/ ([FeFe]2M
.[VT]n.(p’)M/2
) (33b)
In this expression, the cluster concentration [CL] is considered as being proportional to z, at least as a first
approximation. Applying the same approximation as in previous equilibrium equations, the equilibrium
constant can be expressed as follows:
K(T) = z.z(2M-n)
.zn.z
(M+n)(2-q) / ((1-3z)
2M.(p’)M/2
) ≈ z(2m+1+(2-q)(m+n))
/ (1-3z)2m
.(p’)m/2 (33c)
No activity coefficient is taken into consideration. Consequently, in a restricted range of composition z,
no significant change of interactions occurs between point defects or clusters. To illustrate the possible values
of parameter s corresponding to the three hypothetical q values, l’ has been simulated as a function of log z
using the expressions of K(T). The slopes of the curves (l’ vs log z) were determined. The two specific
clusters (4:1) and (10:4) have been chosen to calculate the various coefficients s depending on the charges q
of vacancies.
The results are:
- for a cluster (4:1), the three coefficients s are equal to 5.7, 8.2 and 10.7 for q=2, 1 and 0, respectively;
- for a cluster (10:4), the three coefficients s are equal to 5.4, 8.2 and 11 for q=2,1 and 0, respectively.
It can be noted that, for either the cluster (4:1) or the cluster (10:4), the coefficients s resulting from the
calculations are quite similar for a given value of q. Given the approximations included in the model and
expected experimental uncertainties, these simulated values (from s = 5 to 11) can be considered as being
congruent with the experimental s values obtained in the literature and ranging between 4 and 10. In other
terms, the existence of pseudo-phases might be reasonably thought to be associated with the variation of the
electrical charges (q-) of cation vacancies, and, more generally, with the variation of the electrical charges Q
of the clusters.
These changes of electrical charges are strongly correlated with the increasing density of them: in
other terms, two neighboring vacancies V” with the same negative charge 2- can produce two singly charged
V’ or neutral Vx vacancies, which will decrease the coulomb repulsion between them, and require additional
free electrons migrating in the conduction band.
Now, using this general approach delivering specific s values, it is possible to justify the various
modifications observed by many authors including Vallet et al. [26-27, 29], Geiger Levin and Wagner [65],
Fender and Riley [67], Takayama and Kimizuka [70], Worral and Coley [73]. In particular, let us recall the
values s(W1) = 4.6, s(W2) = 6.2, s(W3) = 9.2, extracted from the data by Vallet et al. , as well as values
s(W1) = 4.8, s(W2) = 6, s(W3) = 9 extracted from the data by [70] (see section 3.7. Takayama and
Kimizuka’s phase modifications).
Considering the set of values s = 4.6, 6, 9 associated with W1, W2 and W3 respectively, for low
values of z, the existence of doubly charged iron vacancies VFe’’ can be associated with a major population of
holes corresponding to mode ‘p’ of conduction. For high values of z, the existence of singly charged or
neutral vacancies can be associated with mode ‘n’ of conduction, i.e., to the injection of electrons in the
conduction band. For intermediate values of z, an intermediate state would exist with a mix of holes in the
valence band and electrons in the conduction band, following a rate varying from z1/2 to z2/3.
These considerations can be supported by the p-n transition [89] described many times in the
literature (see Fig. 10). The authors provide a detailed interpretation for the existence of various defect
configurations corresponding to pseudo-phases in the entire wüstite phase diagram.
For mean values of z, neutron diffraction data show that the clusters are assembled in limited ordered
zones. For high values of z, the ordered cluster zones percolate (see [90] HREM images for z=0.08 and

32
z=0.10). The change in vacancy charge as z increases can be accompanied by injection of free electrons in the
conduction band. As temperature T increases, the size of the cluster zones decreases, and the number of
cluster zones increases. Correlatively, the population of free defects increases.
Taking into account all these considerations, the W1 pseudo-phase can be associated with a small
number of clusters assembled in cluster zones, and a large population of free defects with numerous free VFe’’
vacancies. In this domain, holes can be the major electric charge carriers. The W3 pseudo-phase is constituted
of large cluster zones, covering the entire lattice adjacent to the magnetite zone. The neutralization of
vacancies (or decreasing q charges) shall be associated with a large number of electrons occupying the
conduction band. As the W2 pseudo-phase was previously considered as a mix system of pseudo-phases W1
and W3 by several authors, properties can be expected to follow continuous evolutions. In other terms, an
intermediate structural configuration can exist, corresponding to the formation of percolation paths allowing a
mix conduction of holes and electrons.
10. Percolation approach
A primitive « composite picture » of a possible evolution of the defect structure needing only two clusters
and distinct populations through the subdomains was proposed earlier [156]. Nearly at the same time, a
similar simple model of the defect structure was proposed in terms of the so-called theoretical Cluster
Component Method (see Section 6.3. The C. C. M., Fig. 12).
In Fig. 20, a representation of the distribution of cluster zones (CLZ) inside the lattice is drawn as a
schematic percolation process. The size of cluster zones (CLZ) (represented by black squares) is conditioned
by the equilibrium temperature. White squares represent zones with only disordered point defects (free
vacancies, individual Fe3+
in octahedral or tetrahedral sites).
- In the W1 domain, the CLZ’s are isolated and immersed in a defect lattice. The transition line W1/W2
corresponds to a specific threshold z1/2 value (for fixed T) where there is a starting percolation state.
- The W2 domain might be constituted of large black zones, with percolative paths through the lattice
or both types of zones. The W2/W3 transition line might be reached when the residual white zones
are no more percolative.
- The W3 state is reached when black zones envelop white zones up to a limit state where all the lattice
is covered by a continuum of clusters, i.e., at the boundary W3/Fe3O4.
The effect of temperature is to modify the sizes of clusters zones and the limits of composition for
each boundary. As temperature increases, the cluster zones are destabilized, and the size of these zones
decreases.
Because of the complexity of the system, it is obvious that no unique specific model can represent the
various evolutions. Nevertheless, this approach shows that the modifications W1, W2, W3 may be justified
simply from changes in electrical charges of point defects, so of clusters, and are strongly correlated with
composition z, and the degree of ordering. This scheme implies nearly continuous transformations from Wi
to W(i+1) at the level of the slight deviations from the main diffraction process. However, the discontinuities
observed in the partial molar properties (see supra Fig. 6 and 7), and in the kinetic reduction rates by [73] at the
compositions xi/j of the boundary of the subdomains correspond to abrupt and small-scale differences in
internal energy and configurational entropy, due to the change of cluster type (or charge), and to the change
in long range order of the clusters (see also [113] [114] in Fig. B1 of Annex B).
Note: Metastabilities encountered in most of the experimental studies can modify the location of the transitions ij, i.e.,
the characteristic zi/j values as determined by thermodynamic assessments, even suppressed them. As examples, the
thermogravimetric isotherms (W area) in Raccah’s study [40] are grouped together considering a sole modification in
certain temperature intervals, without break all along from -Fe/Wi to Wi/Fe3O4: W3 at 920, 950, 1000°C, W2 at 1067,
1122, 1140 °C, W1 at 1160, 1167,1200, 1250 °C.

33
1-Low z values: pseudo-phase W1
3-Intermediate z values between
the boundaries W1/W2 and W2/W3
(no percolation for white zones)
2-Start of percolation: threshold z1/2 value
on the boundary W1/W2
4- Pseudo-phase W3
5- Limit of existence of W3 (/Fe3O4)
Fig. 20. Three configurations for CLZ (in black) disordered distributions, typically at 1000 °C
from Fe/W1 to W3/Fe3O4: W1 = majority of zones without defect clusters;
W2 = intermediate configuration; W3 = majority of zones with defect clusters.
11. Conclusions
Point defects: Up to now, the subdivision of the equilibrium phase diagram of wüstite appears to be
complex with the existence of several domains corresponding to different thermodynamic behaviors and high
order transitions (at least of second order). The departure from stoichiometry can be described by a complex
system of cation vacancies noted V”, V’ or Vx, depending on their electrical charge or neutrality, giving rise
to FeFe° (cations Fe
3+) coexisting with FeFe (cations Fe
2+) in octahedral sites, and Fe i
°°° (cations Fe
3+)
occupying the tetrahedral sites of the NaCl-type lattice. Changes in electrical charges must be taken into
consideration, with electrons in the conduction band and holes in the valence band.
Clusters: Works from several different sources demonstrate the existence of clusters of defects
constituted of iron vacancies coupled with cations Fe3+
in tetrahedral interstitial sites, and mixture of
Fe2+
/Fe3+
cations in octahedral sites of the basic fcc lattice. These clusters can coexist with free vacancies.
However, at present, the exact form of clusters noted (m:n) (m vacancies Vq(’) linked to n interstitials Fei
°°°)
is far from being determined definitively.

34
The ratio R= (z+t)/t is obtained mainly from neutron diffraction experiments in the range 2 to 4
depending on the authors. Several authors observe quasi-constant R values in the range 2 to 3, while others
observe a variable or constant value in the range 2.8 to 4. It can be noted that if the wüstite lattice is occupied
solely by the (m:n) isolated cluster, then the ratio R is equal to (z+t)/t = m/n.
The pseudo-phases: inside the initial phase diagram, some experimental evidences from different
authors support the existence of distinct areas corresponding more than likely to pseudo-phases W1, W2, W3.
The term « boundary » designates a threshold of percolation at the exact separation between two
thermodynamic behaviors, corresponding to progressive evolutions of short- and long-range orderings. An
additional first order transition W W’ is directly linked to the first order transition -Fe -Fe at 912 °C.
Up to now, the lack of systematic studies close to the isotherm at 912 °C limits the correct definition of
this part of the Fe-O phase diagram, despite the availability of some advanced thermodynamic studies. The
interpretation of them remains to be developed.
Changes in cluster form: With respect to the existence of clusters (m:n) and the variation of the
ratio R observed by some authors, a first description of the pseudo-phases W1, W2, W3 is proposed in
terms of structure changes of these clusters, with an increasing cluster size as z increased.
The ZnS-blende type (10:4) cluster can agree with neutron diffraction experiments at equilibrium and
in quenched samples, and with electron microscopy images for some compositions z of quenched samples.
The (12:4) <110> specific cluster, proposed by Lebreton and Hobbs, can also agree with a superstructure of
P” type (5a x 5a x 10a) for a sufficiently high composition z.
The existence of separated ordered cluster zones can agree with the slowly variable k parameter. Let
us note that significant changes in cluster form (e.g., (13:4) or (10:4) transformed into (4:1)) as z or T vary
have never been demonstrated for the entire phase diagram. In addition, in studies of samples at equilibrium
or after a quenching process, all observations of superstructure Bragg peaks or diffuse scattering due to
disorder show that the k value (k close to 2.6-2.7) varies slowly with z, thus characterizing a quasi-constant
repetition distance between clusters. If the form of clusters (m:n) would change strongly, the repetition
distance k.a would also change strongly, which is not observed.
New possible description of the pseudo-phases: Pseudo-phase W1 (low z values and high T
values) would be characterized likely by free vacancies coexisting with a weak proportion of small zones of
clusters. Pseudo-phase W3 (high z values and low T values) would correspond to clusters covering the whole
lattice with a minimum distance of 2.55a between clusters and to a 5X superstructure resulting from a zigzag
ordering of clusters. Pseudo-phase W2 is identified as a solution of W1 and W3 of opposite energetic
evolutions above its critical temperature near 300 °C. This pseudo-phase is likely constituted of zones of
ordered clusters and zones of free vacancies, with a progressive build up from boundary z1/2 to boundary z2/3
at which the junction arises between cluster zones that percolate.
The p to n transition might be associated with a starting of this percolation. This transition could be
located in the W2 domain in a non-exclusive manner and is likely connected with a given change in electrical
charges of vacancies and clusters.
Finally, an additional feature can explain the observed electrical modifications. As z increases, the
electrical charges of vacancies (Vq(’)= V”, V’ or V
x) and clusters could change with q varying from q=2 (low
z) to q=0 (high z), due to interactions between charges. This modification of charges q is associated with an
increasing number of electrons populating the conduction band.
Transition close to 912 °C: Up to now, the three varieties W’1, W’2 and W’3 associated to -Fe
below 912 °C are not strictly characterized from a structural point of view. According to Worral and Coley in
their isotopic kinetic study, the defect structure identified on the surface of polycrystalline samples appears
as being close to that identified for the pseudo-phases W1, W2, and W3.

35
Nonetheless, these authors in 2010 and 2013, following principally Wagner jr et al. in 1966 and
Fender and Riley in 1969, have drawn new undisputable distinctions between the pseudo-phases that were
identified thermodynamically as soon as 1962.
____________
Annex A
1 - Several sets from the literature of transitions located in diagram (x)
Fig. A1. Transitional effects located in the diagram [ °C, x].
a- Geiger, Levin, Wagner jr in ([65] p. 955 Table 4): “unexpected changes in the slopes of log σ vs log pO2”.
b- Bransky, Hed [99]: breaking points at 1000, 1100, 1200, 1300 °C re-calculated for correlations of l’ vs z.
c- Riecke, Bohnenkamp in ([116] p.722 Fig 7): reaction rate vs 100y (Fe1-yO) at 1000 °C, pH2O/pH2) re-analyzed curves (I), (III)
oxidation, curve (II) reduction [(I): +10°shift, (III): -10°shift]): change in slope of the quasi-linear segments.
d- Takayama, Kimizuka in [70]; see supra re-analyze of the isotherms in §3.7. « phase modifications ».
e- Molenda, tokłosa, Znamirowski in ([83] p. 517; Fig. 2 and p. 519): experimental log(σ) vs l’ (818-1307 °C, successive segments
defined from Raccah-Vallet’s data to model the curvature; Fig.4: isothermal σ(y), resulting intersections of successive linear
segments of σ(y) f- Worral, Coley in [73]: another interpretation of Fig. 9 at 850 °C p. 821) give rise to an additional point close to x = 1.078 as a
second order type transition, identified for W’1 W’2. Another transition for x = 1.090 appears as a discontinuity at the location of
the transition W’2 W’3
Point located close to x = 1.070 approximates the common intersection of the three lines for re-interpreting the kinetics at 850 °C
(see Annex B2)
2 - Two first versions of the (x) phase diagram with three subdomains
Fig. A2. Comparative plot of experimental phase diagram versions (from ref. [50])
by Vallet and Raccah [26] and Fender and Riley [67].

36
______________
Annex B
1 - Separate diffusion sequences in the thermogravimetric study
of reduction in H2/H2O gas mixtures
The first experimental confirmation of the three Wi out of Vallet’s team is published by [65] (see supra in Fig.
A2). At the same time, the work of Landler and Komarek [113] becomes available.
A numerical analysis makes be revealed three diffusion sequences distributed across the analyzed domain [114].
Fig. B1 is drawn as a summarized result of the determinations.
(from ref. [114])
Fig. B1. Typical runs of reduction (in H2/H2O gas mixtures under 1 atm) identified in ref. [113].
2 - Re-analysis of kinetic data related to the isotherm at 850 °C by Worral and Coley [73]
(identified in ref. [73])
Fig. B2. Intersection W’1/W’2 for log CO2/CO = -0.05052 => x=1.0776, expected 1.0779;
W’2/W’3 for log CO2/CO= -0.08468 => x=1.0903, expected 1.0901;
point : x = 1.0698 where the three variations are convergent.
In Fig. 9 p. 821 [73], it is possible to separate three linear variations of log ka= -m.log (CO2/CO) + log k0, as displayed in
Fig. B2, in place of only two variations. The L.S. coefficients m = 0.48 0.03 (W’1?), 0.71 0.05 (W’2?), 1.03 0.09
(W’3?) are statistically identical to those of equations [36], [37], [38] at 1268 K in ([73] p. 820). A discontinuity is
observed at the location of the transition W’2 W’3 forecasted at equilibrium by [29]. It likely corresponds to a sharp

37
process in the bulk and at the surface (nuclear or electronic change in cluster structure, change in percolation mode,
germination of a superstructure (2.5ao) x 3).
Acknowledgements: The present publication can be considered as a Tribute to Professors Pierre Vallet
(1906-1994), Dominique Weigel and Aron Naumovitch Men, at Sverdlovsk (now Ekaterinburg), for being
the first to announce the existence of "varieties of wüstite" in the phase diagram, and for the continuous
impetus they provided to the work until the end of the 80ties. By the present work, two of their Associates
present the culmination of 50 years of a research funded by the Universities of Rennes 1, Paris 13 and
Toulon. We would like also to pay tribute to the memory of our regretted Polish colleagues, Professors Jan
Janowski and Stanisława Jasienska of the AGH University of Krakow, who initiated a long collaboration
with our laboratories, from the 1980s until this day.
____________________________________________________________________
References
[1] Goodenough JB. Metallic oxides. Pergamon Press Ltd 1971. Improved then translated into French by Casalot A: Les
oxydes des métaux de transition. Collection ‘Monographies de Chimie Minérale’. Paris: Gauthier-Villars; 1973. p.
166-171. French.
[2] Kofstad Per. Nonstoichiometry, diffusion, and electrical conductivity in Binary metal oxides. Wiley-Interscience;
1972. p. 221-31.
[3] Vallet P., [thermogravimetry]. Collection ‘Monographies de chimie minérale’. Paris: Gauthier-Villars; 1972.
[Study of the iron oxides]: p. 277-79, 294-96). French.
[4] Burgmann W. The defect structure models for wüstite: A review. Metal Science 1975; 9:169-75.
[5] Gokcen NA. Thermodynamics, Techscience Incorporated Hawthorne, California; 1975. p. 241-244.
[6] Men’ AN. Bogdanovitch MP, Yu. Vorobiev YuP, Dobrovinski RYu, Kamishov VM, Fetisov VB, [Composition-
defect-properties of solid phases. Method of cluster component]. Moscow « Nauka »; 1977. p. 184-90. Russian.
[7] Spencer PJ, O. Kubaschewski O. A thermodynamic assessment of the iron-oxygen system. CALPHAD
1978;2(2):147-167 https://www.sciencedirect.com/science/article/abs/pii/036459167890032-9
[8] Bauer E, Pianelli A. I: [A review of the lacunar structure of wüstite, and the necessity of new experimental
researches]. Mat. Res. Bull. 1980;15(2):177-188. French.
[9] Nonstoichiometric Oxides. Academic Press, Inc. 1981, Toft Sørensen O editor; the same author, chap.1
Thermodynamics and Defect Structure of Nonstoichiometric Oxides; section IX: Recommendations for Future
Work. p.1-59; chap.2 Catlow CRA, Defect clustering in nonstoichiometric oxides. p.61-98; chap.8 Cheetham AK,
Structural studies on nonstoichiometric oxides using X-ray and neutron diffraction. p.399-433.
[10] Hazen RM, Jeanloz R. Wüstite (Fe1-xO): a review of its defect structure and physical properties. Rev. geophys.
and space phys. 1984; 22:37-46. https://doi.org/10.1029/RG022i001p00037
[11] Gleitzer C, Goodenough JB, Mixed-valence iron oxides in structure and bonding. 61: Springer Verlag; 1985. p. 51-4.
[12] Gokcen NA. Statistical thermodynamics of alloys. New York: Plenum Press; 1986.
[13] Lykasov AA, Carel C, Men’ AN, Varshavskii MT, Mikhailov GG [Physics and chemistry properties of wüstite and
its solutions] Sverdlovsk: Riso Yunts AN SSSR; 1987. Russian.
[14] Mrowec S, Podgorecka A. Defect structure and transport properties of non-stoichiometric ferrous oxide. Review, J.
Mater. Sci. 1987; 22:4181-9.
[15] Long GJ, Grandjean F. Mössbauer effect, magnetic and structural studies of wüstite, Fe1-xO. Adv. Solid-State, JAI
Press. 1991; 2:187-221.
[16] Sundman B. An assessment of the Fe-O system, J. of Phase Equilibria Section I: basic and applied research
1991;12(1):127-40.
[17] Wriedt HA. The Fe-O (Iron-Oxygen) system. J. Phase Equilibria Section II: phase diagram evaluations
1991;12(2):169-200.
[18] Collongues R. Nonstoichiometry in Oxides. Prog. Crystal Growth and Charact. 1992; 25:203-40. About the
wüstite: 209-14.
[19] Gleitzer C. Electrical properties of anhydrous iron oxides. Key Engineering Materials 1997;125-6: 355-418. About
wüstite:359-80. 114 ref.:366-7).
[20] Smyth DM. The defect chemistry of metal oxides. N. Y.: Oxford University Press; 2000.
[21] Desré P, Hodaj F. Thermodynamique des matériaux. EDP Sciences; 2010. p. 76-83, 91-6, 258-66. French.
[22] Worral E, Coley KS. Defect structure of pseudo-phases of wüstite. Can. Metall. Quarterly 2013;52(1): 23-33.
https://doi.org/10.1179/1879139512Y.0000000047
[23] Kröger FA, Vink HJ. Solid State Physics. Eds F. Seitz and D. Turnbull, New York: Academic Press Inc. (1956);
“structure elements” 3.

38
[24] Schrettle F, Kant Ch, Lunkenheimer P, Mayr F, Deisenhofer J, Loidl A. Wüstite: electric, thermodynamic and
optical properties of FeO. Eur. Phys. J. B 2012; 85(5) art.164, preprint (arXiv: 1203.1201) [PDF] psu.edu, [PDF]
researchgate.net.
[25] Chaudron G, [Reversible reaction study of hydrogen and carbon oxide on metallic oxides] Philosophical
Dissertation, Paris (1921). French.
[26] Vallet P, Raccah P, [On the boundaries of the solid wüstite domain. General diagram]. Paris: Gauthier-
Villars/editions Elsevier. Compt. Rend. Acad. Sci. Paris. 1964; 258:3679-82. French.
http://gallica.bnf.fr/ark:/12148/bpt6k4011c.image.r=comptes+rendus+academie+sciences+paris+1963.f1301.langF
R.pagination
[27] Vallet P, Carel C. [Contribution to the study of the solid nonstoichiometric iron monoxyde. Diagram T-P(O2)-X].
Mat. Res. Bull. 1979;14(9):1181-94. French. https://doi.org/10.1016/0025-5408(79)90213-7
[28] Vallet P, Carel C, [Evaluation of the molar thermodynamic properties of solid wüstites from their equilibrium
thermodynamic study, Part I: formulas for partial and integral molar properties of the three Wi and three W’i].
Rev. Chim. miné. 1986;23(3):362-77. French. ISSN: 0035- 1032/86/03 362 16; OCLC: 1871287. [Part II: boundaries of Wi and W’i stability sub-domains. Limit conditions of the integrations. Numerical
assessments]. Ibidem 1986; 23(6):709-34. French. ISSN: 0035-1032/86/6 709 26; OCLC: 1871287. [29] Vallet P, Carel C. The Fe-O phase diagram in the range of the nonstoichiometric monoxide and magnetite at the
Fe-rich limit, Bull. Alloy Phase Diagram (=> J. of Phase Equilibria) 1989;10(3):209-18.
https://doi.org/10.1007/BF02877494
[30] Jette ER, Foote F. An X-ray study of the wüstite (FeO) solid solutions. J. Chem. Phys. 1933; 1:29-3.
[31] Darken LS, Gurry RW. The System Iron-Oxygen. Part I. The Wüstite field and related equilibria. J. Am. Chem.
Soc. 1945; 67:1398-412. Part II. Equilibrium and thermodynamics of liquid oxide and other phases. ibidem 1946;
68:788-816.
[32] Todd SS, Bonnickson KR. Low temperature heat capacities and entropies at 298.16°K of ferrous oxide, manganous
oxide and vanadium monoxide. J. Am. Chem. Soc. 1951;73(8):3894-5.
[33] Humphrey GL, King EG, Kelley KK. Some thermodynamic values for ferrous oxide. Report of Investigations
4870, U. S. Department of the Interior Bureau of Mines; 1952. p. 1-16.
[34] Brynestad J, Flood H. The redox equilibrium in wüstite and solid solutions of wüstite and magnesium oxide. Zeit.
Elektrochem. 1958;62(9):953-8.
[35] Roth WL. Defects in the crystal and magnetic structures of ferrous oxide. Acta Cryst. 1960; 13:140-9.
[36] Tarte P, Preudhomme J, Jeannot F, Evrard O. [IR spectrum and presence of trivalent tetrahedral iron in the
structure of iron protoxide Fe1-xO (Wüstite)]. Compt. Rend. Acad. Sci. 1969;269C:1529-31. French.
[37] Wagner C, Koch E. [Electrical conductivity of cobalt and iron oxides]. Z. Phys. Chem. equilibria, J. Am. Chem.
Soc. 1945;67:1398-1412. German.
[38] Wagner Carl. Thermodynamik metallischer Mehrstoffsysteme, Leipzig: Handbuch der Metallphysik Becker and
Erler Kom.-Ges; 1940 Vol 1 Part 2. Enlarged and revised translation: Thermodynamics of Alloys. Addison-Wesley
INC; 1952.
[39] Smyth DM. Deviations from Stoichiometry in MnO and FeO. J. Phys. Chem. Solids 1961;19(1/2): 167-169
[40] Raccah P. [Study of the thermodynamic properties of iron protoxide]. Dissertation érie B N° d’ordre 8 N° de série
7 Université de Rennes- France; 30 juin 1962. French.
[41] Raccah P, Vallet P. [On thermodynamic properties of wüstite, a strictly regular solution of iron and oxygen].
Compt. Rend. Acad. Sci. Paris 1962; 254:1038-40. French.
[42] Raccah P, Vallet P. [New set of isotherms for the solid wüstite]. Compt. Rend. Acad. Sci. Paris 1962; 255:1919-21.
French.
[43] Vallet P, Kléman M, Raccah P. About new thermodynamic properties and a new phase diagram of solid wüstite. C.
Rend. Acad. Sci. Paris 1963; 256:136-138. French.
[44] Vallet P, Raccah P. [Contribution to the study of the thermodynamic properties of the solid iron protoxide]. Mem.
Sci. Rev. Métall. 1965; LXII(1):1-29. French.
[45] Kléman M. [Thermodynamic properties of the solid iron protoxide. Experimental results applied to the drawing of
the equilibrium diagram]. Mém. Sci. Rev. Mét. (1965; LXII(6):457-469. French.
[46] Toft Sørensen O, El Sayed Ali M. Defects on metal-deficient oxides: wüstite, Fe1-yO. The Risø National
Laboratory DK 4000 Roskilde: Risø-R-505. Jan. 1985: p.1-24. ISSN 0106-2840. [47] Rekas M, Mrowec S. On defect clustering in the wustite phase. Solid State Ionics 1987; 22:185-97.
[48] Carel C, Vallet P. [Dilatometric study of diverse varieties of solid wüstite, and existence of a metastable point
between the three varieties]. C. Rend. Acad. Sci. Paris 1964; 258:3281-4. French.
[49] Carel C, Weigel D, Vallet P. [Variation of the cell parameter for three wüstite varieties]. Compt. Rend. Acad. Sci.
1965; 260:4325-28. French. http://gallica.bnf.fr/ark:/12148/bpt6k4019v/f548.image
[50] Carel C, Gavarri J-R. Introduction to description of phase diagram of solid wüstite. I: structural evidence of
allotropic varieties. Mat. Res. Bull. 1976;11(6):745-56.
[51] Vallet P. I: [On the thermodynamic properties of solid wüstite below 911°C], Compt. Rend. Acad. Sci. 1975;
C280:239-41. II: [On the thermodynamic properties of solid wüstite above 911°C]. Ibidem 1975; C281:291-4.
French.

39
[52] Pankratz LB. Thermodynamic properties of elements and oxides. US Bureau of Mines. Bulletin 672. 1982; Fe:151-3.
[53] Desai PD. Thermodynamic properties of iron. J. Phys. Chem. Ref. Data 1986;15(3):967-83.
[54] Chase jr MW. NIST-JANAF thermochemical tables. 4th
edition J. Phys. Chem. Ref. Data, Monograph 9 Part II.
1998; Fe (crystal - δ):1221-2.
[55] Löhberg K, Stannek W. [Thermodynamic description of the wüstite phase in its existence domain]. Ber. Bunsen
Ges. Phys. Chem. 1975;79(3):244-55. German.
[56] Janowski J, Mrowec S, tokłosa A. Determination of chemical diffusion and self-diffusion. Coefficients of iron in
ferrous oxide. 1st Round Table Meeting Fe-Mn-O, Cracovie Kozubnik-Poland Sept 8-9, 1980, in Bull. Acad. Pol.
Sci. Série Sciences chimiques 1981 pub. 1982; XXIX:91-101.
[57] Jacobsson E, Rosén E. Thermodynamic studies of high temperature equilibriums. 25. Solid state emf studies of the
systems iron-ferrous oxide, nickel-nickelous oxide, and cobalt-cobaltous oxide in the temperature range 1000-
1600 K. Scand. J. Met. 1981; 10:39-43.
[58] Guillermet AF, Per Gustafson. An assessment of the thermodynamic properties and the (p, T) phase diagram of
iron. High Temp.-High Press. 1985; 16:591-610. [59] Sjödén O, Seetharaman S, Staffansson L-I. On the Gibbs energy of formation of wustite, Metall. Trans. B
(1986;17B:179-84.
[60] Grønvold F, Stølen S, Tolmach P, Westrum jr EF. Heat capacities of the wüstites Fe0.9379O and Fe0.9254O at
temperatures 5 to 350K. Thermodynamics of the reaction xFe(s) + (1/4) Fe3O4(s) = Fe0.7500+xO(s) = Fe1-yO(s) at
T850 K, properties of Fe1-yO(s) to T=1000 K. Thermodynamics of formation of wüstite. J. Chem.
Thermodynamics 1993; 25:1089-117.
[61] Swisher HH, Turkdogan ET. Solubility, permeability and diffusivity of oxygen in solid iron. Trans. Metall. AIME
1967; 239:426-31.
[62] Carel C, Vallet P. [About a first order transformation of magnetite at 1160 °C]. Bull. Soc. Sci Bretagne 1977-80
pub1981;52(1-4):55-59. Erratum. Ibidem (1982);54(1-4):113. French.
[63] Vallet P, Carel C. [Molar thermodynamic properties and transformations in nonstoichiometric magnetite in
equilibrium with the wüstites]. Rev. Chim. miné. 1987;24(6):719-36. French.
[64] LiLova Ki, PearCe Ci, GorsKi C, rosso KM, navrotsKy a. Thermodynamics of the magnetite-ulvöspinel (Fe3O4-
Fe2TiO4) solid solution. Amer. Mineralog. 2012; 97:1330-8. https://doi.org/10.2138/am.2012.4076
[65] Geiger GH, Levin RL, Wagner jr JB. Studies on the defect structure of wüstite using electrical conductivity and
thermoelectric measurement. J. Phys. Chem. Solids 1966;27:947-56. https://doi.org/10.1016/0022-3697(66)90066-7
[66] Swaroop B, Wagner jr JB. On the vacancy concentrations of wüstite (FeOx) near the p to n transition. Trans.
Metall. Soc. AIME 1967; 239:1215-8.
[67] Fender BEF, Riley FD. Thermodynamic Properties of Fe1-xO. Transitions in the Single-Phase Region. J. Phys.
Chem. Solids 1969; 30:793-8. https://doi.org/10.1016/0022-3697(69)90273-X
[68] Marucco J-F, Picard C, Gerdanian P, Dode M. [Partial molar properties of oxygen mixing into the iron protoxyde
at 1075°C. I.-Direct measurements of partial molar enthalpies by means of a high temperature microcalorimeter of
the Tian-Calvet type]. J. Chim. Phys. 1970; 67:906-13. French. [II.-Measurements of the oxygen partial pressure
in equilibrium with the protoxide. Calculation of sO2M
]. Ibidem 914-6. French.
[69] Asao H, Ono K, Yamaguchi A, Moriyama J. Thermodynamic properties of wüstite (FeO1+y). Memoirs Faculty
Engineer. XXXII Part 1 (1970) 66-77. Same authors. [Defect structure]. Nippon Kinzoku Gakkaishi 1971;9:
871-7. Japanese.
[70] Takayama E, Kimizuka N. Thermodynamic properties and subphases of wustite field determined by means of
thermogravimetric method in the temperature range of 1100-1300°C. J. Electrochem. Soc. 1980;127(4) 970-6.
https://scholar.google.fr/scholar?hl=fr&as_sdt=0%2C5&q=Takayama+E%2C+Kimizuka+N&btn
[71] Barbero JA, Blesa MA, Maroto AJG. The lower temperature range of wustite stability field. Z. Phys. Chem. Neue
Folge 1981; 124:139-47.
[72] Lykazov AA, Mikhailov GG, Chichkov VI. [Gibbs energy of formation of wüstite]. Izv. Vuzov. Tchern.
Metallurgiia 1982;3:6-9. Russian.
[73] Worral EJ, Coley KS. Kinetics of the reaction of CO2/CO gas mixtures with iron oxide. Metall. Materials
Transactions B 2010;41B:813-23. DOI: from https://link.springer.com/article/10.1007/s11663-010-9358-4
[74] Herai T, Manenc J. [Study of decomposition of the iron protoxide]. Rev. Met. Mem. Sci. 1964; LXI(10):677-86.
French.
[75] Manenc J. [Structure of the iron protoxyde, recent results]. Bull. Soc. Fr. minéral. Cristallogr. 1968; 91:594-9.
French.
[76] Andersson B, Sletnes JO. Decomposition and ordering in Fe1-xO. Acta Cryst. 1977; A33:268-76.
[77] Morral JE, Cahn JW. Spinodal decomposition in ternary systems. Acta Metallurgica 1971;19(10): 1037-45.
[78] Manenc J. [Existence of a superstructure in the iron protoxide]. J. Phys. Radium 1963;24(7): 447-50. French.
[79] Iijima S. High resolution EM study of wüstite Proceed. Electron. Microsc. Soc. Am. 1974; 32:352-3.
[80] Lykasov AA, Kuznetsov Yu, Pil’ko EI, hishkov VI, Kozheurov VA. [Thermodynamics of wustite]. J. Phys.
Chem. USSR 1969;43(12):1754-5. Russian
[81] Burgmann jr W, Urbain G, Frohberg MG. [Contribution to the study of the iron-sulfur system, with limitation to
40
the iron monosulfid (pyrrhotine)]. MEM. SCI. REV. METALL. 1968; LXV(7/8):567-78. French.
[82] Hillegas jr WJ. Ph. D. Thesis, Northwestern University 1968:Cat n°6901847; in Ref. [106-107].
[83] J. Molenda J, A. tokłosa A, W. Znamirowski W, Transport properties of ferrous oxide Fe1-yO at high
temperature. physica status solidi (b) 1987; 142:517- 29. The same authors. Electrical properties of manganese
doped ferrous oxide at high temperatures. Solid State Ionics 1987; 24:39-44.
[84] Greenwood NN, Howe AT. Mössbauer studies of Fe1-xO. I.-The defect structure of quenched samples. J. Chem.
Dalton Trans. 1972; 1:110-6. DOI: 10.1039/DT9720000110.
II.-Disproportionation between 300 and 700 K. Ibidem 116-21. III.-Diffusion line broadening at 1074 and 1173 K.
Ibidem 122-6.
[85] Romanov VP, Checherskaya LF. Mössbauer spectra of non-stoichiometric and stoichiometric wustites. phys. stat.
sol. (b) 1972;49: K183-7.
[86] Checherskaya LF, Romanov VP, Tatsienko PA. Mössbauer effect in wustite. phys. stat. sol. (a) 1973;19(2): K177-82.
[87] Hrynkiewicz HU, Kulgawczuk DS, Mazanek ES, Pustowka AM, Tomala K, Wyderko ME. Mössbauer effect
studies of ferrous oxides Fe1-xO, phys. stat. sol. (a) 1972;9:611-6
[88] Pattek-Janczyk A, epiał B, Grenier J-C, Fournès L. Double electron exchange in Fe1-xO: a Mössbauer study. Mat.
Res. Bull. 1986; 21:1083-92.
[89] Tannhauser D. Conductivity in iron oxides. J. Phys. Chem. Solids 1962;23(1-2):25-34.
[90] Tchiong Tki Kong (wrongly referenced as T. K. Hoang), Romanov AD, Shaiovitch YaL, Zvinchuk RA. [About the
structure of Fe1-xO]. Vestnik Leningradskogo Universiteta 1973;4(1):144-49. Russian.
[91] Shaiovitch YaL, Zvintchuk RA, Vergazov AN. Lattice of an equilibrium superstructure of wüstite Fe0.90O. Fiz.
Tverd. Tela (Leningrad) 1987; 29:1890-2, (English translation in Sov. Phys. Solid State 1987;29(6): 1089-90).
[92] troeva , Kul’kova NV, Temkin MI. The Isotopic Exchange between CO and CO2 on various surfaces. Proc.
Acad. Sci. USSR, Physical Chemistry Section 1959;124:113-9.
[93] Temkin MI, Nakhmanovich ML, Morozov NM. Kinetics and Mechanism of Isotopic exchange and Gas Reaction
on Solid Surfaces. Kinetics and Catalysis 1961;2(5):650-4.
[94] Grabke H-J. [Kinetics of oxygen exchange from CO2 to the surface of oxides]. Ber. Bunsenges. 1965;69(1):48-57.
German.
[95] Cramb AW, Belton GR. Studies of the interfacial kinetics of the reaction of CO2 with liquid iron by the 14
CO2-CO
isotope exchange reaction. Metall. Trans. B 1981;12B:699-704.
[96] Mori M, Morita K, Sano N. Determination of the rate of CO2 dissociation on the surface of CaO-SiO2, CaO-Al2O3,
CaO-SiO2-CaF2 and CaO-SiO2-FexO Melts. ISIJ International 1996;36(6):624-30.
[97] Xiaojun Hu, Teng Zhang, Hongyan Yan, Hiroyuki Matsuura, Fumitaka Tsukihashi, Kuo-Chih Chou. Interfacial
rate of CO2-CO reaction with the solid iron and iron oxide by isotope exchange technique at 1 273 K. ISIJ
International 2012; 52:1529-34.
[98] Teng Zhang, Xiao-jun Hu, Kuo-Chih Chou. Kinetic study on the reaction between CO2-CO and wustite using the
isotope exchange method. Internat. J. of Minerals Metall. and Mater. 2013; 20:125-30.
[99] Bransky I, Hed AZ. Thermogravimetric determination of the composition-oxygen partial pressure diagram of
wustite (Fe1-yO). J. Amer. Ceram. Soc.-Discussions and Notes 1968; 51:231-2.
[100] Ariya SM, Bratch BYa. Electrical conductivity of ferrous oxides at high temperatures. Fiz. Tverd. Tela
1963;5(12):3496-9. (English translation in Soviet Physics-Solid State, 1964(June): 2565-7)
[101] Kozheurov VA, Mikhailov GG. Electrical conductivity of wüstite. Zh. Fiz. Khim, English Translation: Russ. J.
Phys. Chem. 1967;41(11):1552-5.
[102] Bransky I, Tannhauser DS. High-Temperature defect structure of ferrous oxide. Trans Metall. Soc. AIME 1967;
239:75-80.
[103] Heikes RR, Miller RC, Maradudin AA. [A study of the transport properties of semiconductors with mixed
valence]. Ann. Phys. 1963;13(8):733-46. French. https://doi.org/10.1051/anphys/196313080733
[104] Lafollet P, Duquesnoy A. [On the variations of the thermoelectric power coefficient of iron protoxide as a
function of the partial pressure of oxygen at high temperature]. Compt. Rend. Acad. Sci. Paris Chimie des solides
1977;284C:359-62. French.
[105] Hillegas WJ, Wagner jr JB. Effect of grain size and magnesium doping on the p to n transition in wustite. Physics
Letters 1967 (20 nov.);25A(10):742-3.
[106] Gartstein E, Mason TO. Reanalysis of wüstite electrical properties. J. Amer. Ceram. Soc. 1982;65 (2):C-24-26.
[107] Hodge JD, Bowen HK. I. Measurement of low-temperature thermoelectric power for quenched wustite. J. Amer.
Ceram. Soc. 1981;64(4):220-3. II. High-temperature thermoelectric power measurements in wustite. Ibidem
1981;64(8):431-6.
[108] Neuschütz D, Towhidi N. [Electrical conductivity of wüstite, Arch. Eisenhüttenwes]. 1970;4:303-7. German.
[109] Toroker MC, Carter AA. Hole transport in nonstoichiometric and doped wüstite. J. Phys. Chem. C 2012;
116(33):17403-13. https://pubs.acs.org/doi/10.1021/jp3047664
[110] Aldon L, Jumas J-C. Lithium-induced conversion reaction in wüstite Fe1-xO studied by 57
Fe Mössbauer. Solid
State Sciences 2012; 14:354-61.
[111] Katkov AE, Lykasov AA. Wüstite solid solutions in Fe-Cu-O system. Inorganic materials 1999;35(7):706-8;

41
ibidem 2003;39(2):171-4.
[112] Desmarescaux P, Lacombe P. [Iron self-diffusion in the iron protoxide]. Mém. Sci. Rev. Mét. 1963; 60:899-906.
French.
[113] Landler PFJ, Komarek KL. Reduction of wüstite within the wüstite phase in H2-H2O mixtures. Trans. Metall.
Soc. AIME 1966; 236:138-49.
[114] Carel C. [Reduction kinetics of solid wüstite in its stability domain]. Compt. Rend. Acad. Sci. 1967; C265:533-6.
French.
[115] Nowotny J, Wagner jr JB. Influence of the surface on the equilibration kinetics of non- stoichiometric oxides.
Oxidation of Metals 1981;15(1/2):169-90.
[116] Riecke E, Bohnenkamp K. [About the oxidation and reduction kinetics of wüstite in its existence domain]. Archiv
Eisenhüttenwesen 1969; 9:717-25. Doi.org/10.1002/srin.196904381. German.
[117] Rickert H, Weppner W. [Electrochemical investigation of the chemical diffusion in wüstite by means of an
oxidizing solid electrolyte], Z. Naturforsch. 1974;29a:1849-59. German.
[118] Per Kofstad, Zeev Hed A. Defect structure model for wustite. J. Electrochem. Soc. Solid State Science
1968;115(1):102-4.
[119] Men’ AN, Bogdanovitch MP, Vorobyov YP, Dobrovinski RY, Tchoufarov GI. [Thermodynamic study of
nonstoichiometric solid solutions with the MO type], Comm. Coll. Internat. « Oxyde ferreux et ses solutions
solides » ENSC Paris 26-28 mars 1969, Ann. Chim. 1970;5(4):309-12. French.
[120] Men’ NA, Carel C. [Investigation of wüstite in its homogeneity domain by means of the Cluster Component
Method]. C. R. Acad. Sc. Paris Série II Cristallochimie 1982; 253:253-6. French.
[121] Men’ AN, Carel C. The cluster component method (C.C.M.) in the chemistry of non-ideal crystal structures.
Application to wüstite. Solid State Chemistry: Proceed. Second Eur. Conf. Veldhoven-The Netherlands 7-9 june
1982. Elsevier: Studies in Inorganic Chemistry, Metselaar R, Heijligers HJM, Schooman J. 1983;3: 335-8.
[122] Men’ AN, Carel C. The cluster component method and ordering in nonstoichiometric monoxides with the rocksalt
structure. J. Phys. Chem. Sol. 1985; 46:1185-99.
[123] Catlow CRA, Fender BEF. Calculations of the defect clustering in Fe1-xO. J. Phys. C: Solid State Chem. 1975;
8:3267-79.
[124] Nowotny J, Rekas M. Defect structure and thermodynamic properties of the wustite phase (Fe1-yO). J. Amer.
Ceram. Soc. 1989;72(7):1221-8.
[125] Catlow CRA, Mackrodt WC, Norgett MJ, Stoneham AM. The basic atomic processes of corrosion. II: Defect
structures and cation transport in transition-metal oxides. Philosophical Magazine A 1979;40:161-72.
[126] Lebreton C, Hobbs LW. Defect structure of Fe1-xO. Radiation Effects 1983; 74:227-36.
[127] Catlow CRA. Recent progress in defect studies of rock-salt transition metal oxides and magnetite. Metallurgia I
Odlewnictwo Krakow-Poland 1987;13(1-2):31-41.
[128] Gavarri J-R, Jasienska St, Orewczyk J, Janowski J. Contribution to the study of substituted Fe1-x-yO. Metalurgia
I Odlewnictwo Krakow-Poland 1987;13(1-2):43-63.
[129] Grimes RW, Anderson AB, Heuer AH. Defect clusters in nonstoichiometric 3d transition-metal monoxides. J.
Amer. Ceram. Soc. 1986; 69:619-23.
[130] Koch F, Cohen JB. The Defect Structure of Fe1-xO. Acta Cryst. 1969; B25:275-87.
[131] Gartstein E, Mason TO, Cohen JB. Defect agglomeration in wüstite at high temperatures - I: The defect
arrangement. J. Phys. Chem. Solids 1986;47(8):759-73.
[132] Anderson AB, Grimes RW, Heuer AH. Defect clusters in wustite, Fe1-xO. J. Sol. State Chem. 1984; 55:353-61.
[133] Tomlinson SM, Catlow CRA. Computer simulation studies of Fe1-xO and Mn1-xO in Non-Stoichiometric
Compounds Surfaces, Grain Boundaries and Structural Defects. Nowotny J, Weppner W eds. Kluwer Academic
Publishers 1989;276:53-75.
[134] Minervini L, Grimes RW. Defect clustering in wüstite. J. Phys. Chem. Solids 1999; 60:235-45.
[135] Labidi M, Monty C. P’ and P” phase structures in Fe1-xO and Fe1-x-yCayO. Phase Transitions 1991; 31:99-106.
[136] Cheetham AK, Fender BEF, Taylor RI. High temperature neutron diffraction study of Fe1-xO. J. Phys. C: Solid
State Chem. 1971; 4:2160-5.
[137] Battle PD, Cheetham AK. The magnetic structure of non-stoichiometric ferrous oxide. J. Phys. C : Solid State
Phys. 1979;12:337-45.
[138] Saines PJ, Tucker MG, Keen DA, Cheetham AK, Goodwin AL. Coupling of the local defect and magnetic
structure of wüstite Fe1-xO. Physical Review B 2013; 88:134418-8.
[139] Radler MJ, Cohen JB, Faber jr J. Point defect clusters in wüstite. J. Phys. Chem. Solids 1990;51(3):217-228.
[140] Schweika W, Hoser A, Martin M. In-situ study of the defect structure of wüstite Fe1- xO by diffuse elastic neutron
scattering. Ber. Bunsenges. Phys. Chem. 1992;96(11):1541-4.
[141] Schweika W, Hoser A, Martin M, Carlsson AE. Defect structure of ferrous oxide Fe1-xO. Physical Review B
1995;51(22):15771-88.
[142] Welberry TR, Christy AG. A paracrystalline description of defect distributions in wüstite, Fe1-xO. J. Solid State
Chem. 1995; 117:398-406.
[143] Welberry TR, Christy AG. Defect distribution and the diffuse X-ray pattern of wüstite, Fe1-x O. Phys. Chem.

42
Minerals 1997; 24:24-38.
[144] Welberry TR, Goossens DJ, Heerdegen AP. Local order in wüstite using a pair distribution function (PDF)
approach. Mineralogical Magazine 2014;78(2):373-85.
[145] Gavarri J-R, Carel C, Weigel D. [Contribution to the structural study of solid wüstite at high temperature]. J. Sol.
State Chem. 1979;29:81-95. French.
[146] Carel C, Gavarri J-R. Structural evolution study of substituted wüstites Fe1-z-y(Ca,Mg)yO. J. Phys. Chem. Solids
1990;51(9):1131-6.
[147] Smuts J. Structure of wüstite and the variation of its X-ray diffraction intensities with composition. J. Iron Steel
Inst. 1966 (Mars):237-9.
[148] Ishiguro T, Nagakura S. Structure of the commensurate phase P” of wüstite Fe0.902O studied by high resolution
electron microscopy. Japan. J. Applied Phys. 1985;24(9): L723-6.
[149] Gavarri J-R, Carel C, Weigel D. Re-examination of the cluster structure on quenched wüstites of P’ and P” types.
C. Rend. Acad. Sci. Paris Cristallographie 1988;307(Série II):705-10 (in French + abridged English version)
[150] Nihoul G, Gavarri J-R, Carel C. The commensurate (10/4) cluster model in quenched wüstite P”. New simulation
of HREM direct images. Acta Cryst. 1991; B47:333-7.
[151] Gavarri J-R, Carel C, Jasienska St, Janowski J. [Morphology and structure of wüstite. Evolution of defect
clusters], Rev. Chim. miné. 1981;18:608-24. French.
[152] Bauer E, Pianelli A, Aubry A, Jeannot F. II: [New structural examination of pure and substituted metastable
wüstites]. Mat. Res. Bull. 1980;15(3):323-37. French.
[153] Gartstein E, Cohen JB, Mason TO. II: An electrical conduction model. J. Phys. Chem. Solids 1986;47(8):775-81.
[154] Yamamoto A. Modulated structure of wustite (Fe1-xO) (Three-dimensional modulation). Acta Cryst. 1982; B38:
1451-6.
[155] Weigel D, Veysseyre R, Carel C. [About symbols of the space group of a tri-incommensurate cubic wüstite, and
Bravais groups of its crystal family in the 6-dimensional Euclidean space]. Compt. Rend. Acad. Sci. 1987;
305(II):349-52. French.
[156] Gavarri JR, Carel C. Structure of wüstite at high temperature. Composite picture. Proceed. Round Table Meeting
Iron and Manganese Oxides Sept. 8-9, 1980, Bull. Acad. Mines Metall. Akademia Gorniczo Hutnicza im.
tanisława taszica w Krakowie 1982(R):7-20.
________________