Red Trail Energy (RTE) Carbon Capture and
39
Transcript of Red Trail Energy (RTE) Carbon Capture and

Red Trail Energy (RTE) Carbon Capture and
Storage (CCS) Project
CCS Technical Workshop 2020
Tokyo, Japan
January 23, 2020
Dustin Willett, Chief Operating Officer
RTE, North Dakota USA
• RTE Ethanol Facility
• CCS Drivers
• RTE CCS Project
• Questions
Outline
3
Image Credit: Red Trail Energy
3
RTE Ethanol Facility
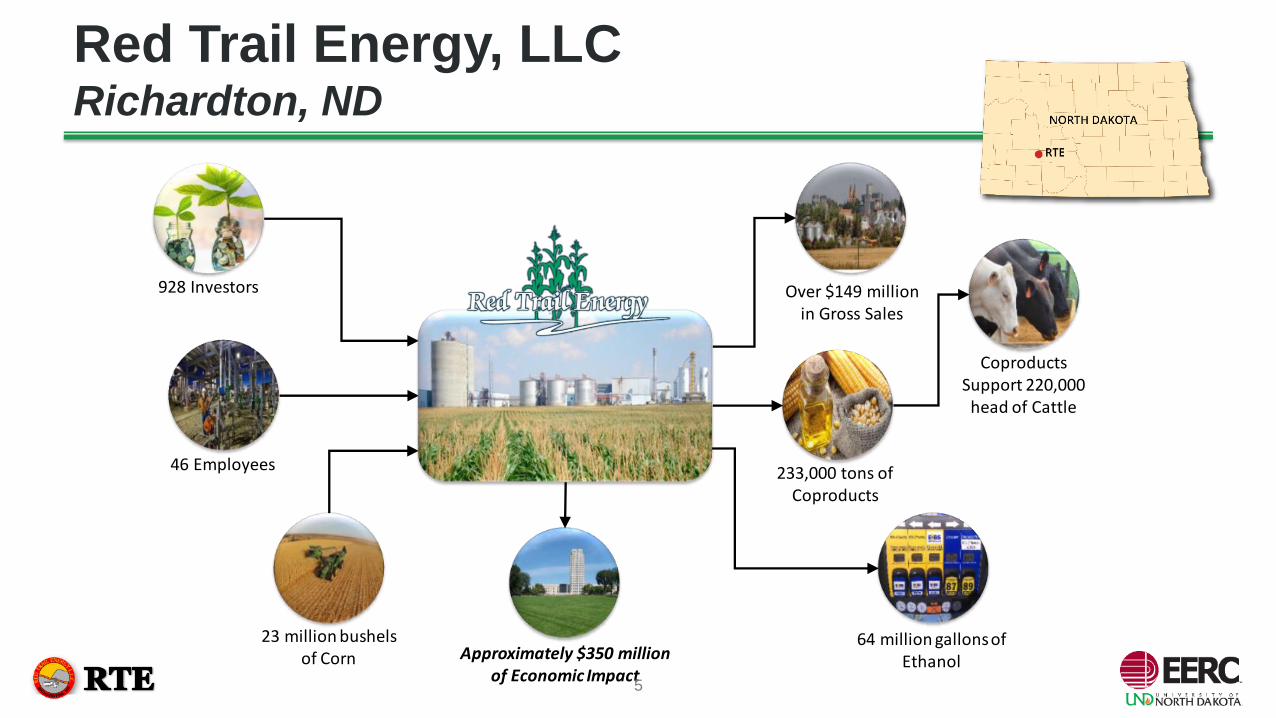
Red Trail Energy, LLC Richardton, ND
23 million bushels of Corn
46 Employees 233,000 tons of Coproducts
64 million gallons of EthanolApproximately $350 million
of Economic Impact
Over $149 million in Gross Sales
CoproductsSupport 220,000
head of Cattle
928 Investors
5

Investor-Owned since 2007
64-million-gallon-per-year Dry
Grind Ethanol Plant:
• Constructed starting July 2005,
operating by January 2007
• 180,000–185,000 gallons/day
ethanol
• 480–500 tons/day dried distillers
grains (DDG’s)
Image Credit: Red Trail Energy
6

Corn Ethanol
A bushel of corn weighing 56 pounds:
• 2.82 gallons ethanol (~18.7 pounds)
• 18.0 pounds CO2
• 18.5 pounds Distillers Grains
• 0.8 pounds Corn Oil
Image Credit: American Corn Growers Foundation
7
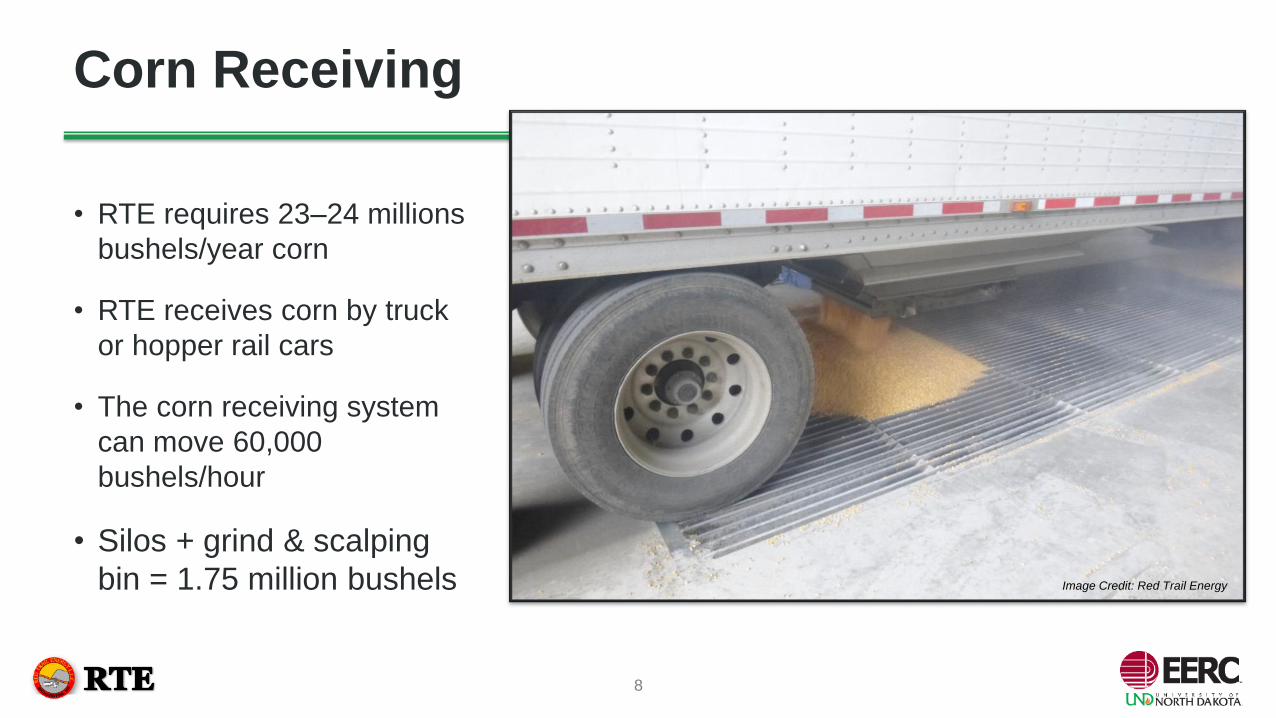
Corn Receiving
• RTE requires 23–24 millions
bushels/year corn
• RTE receives corn by truck
or hopper rail cars
• The corn receiving system
can move 60,000
bushels/hour
• Silos + grind & scalping
bin = 1.75 million bushels Image Credit: Red Trail Energy
8
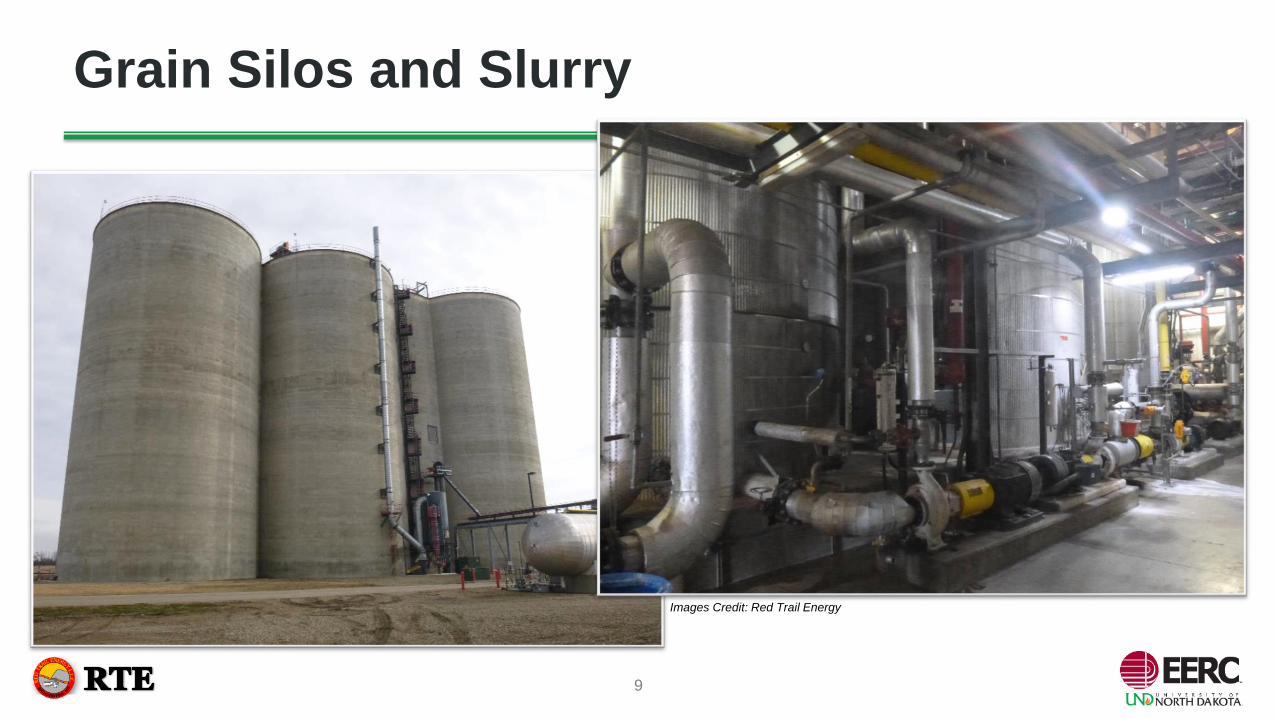
Grain Silos and Slurry
Images Credit: Red Trail Energy
9
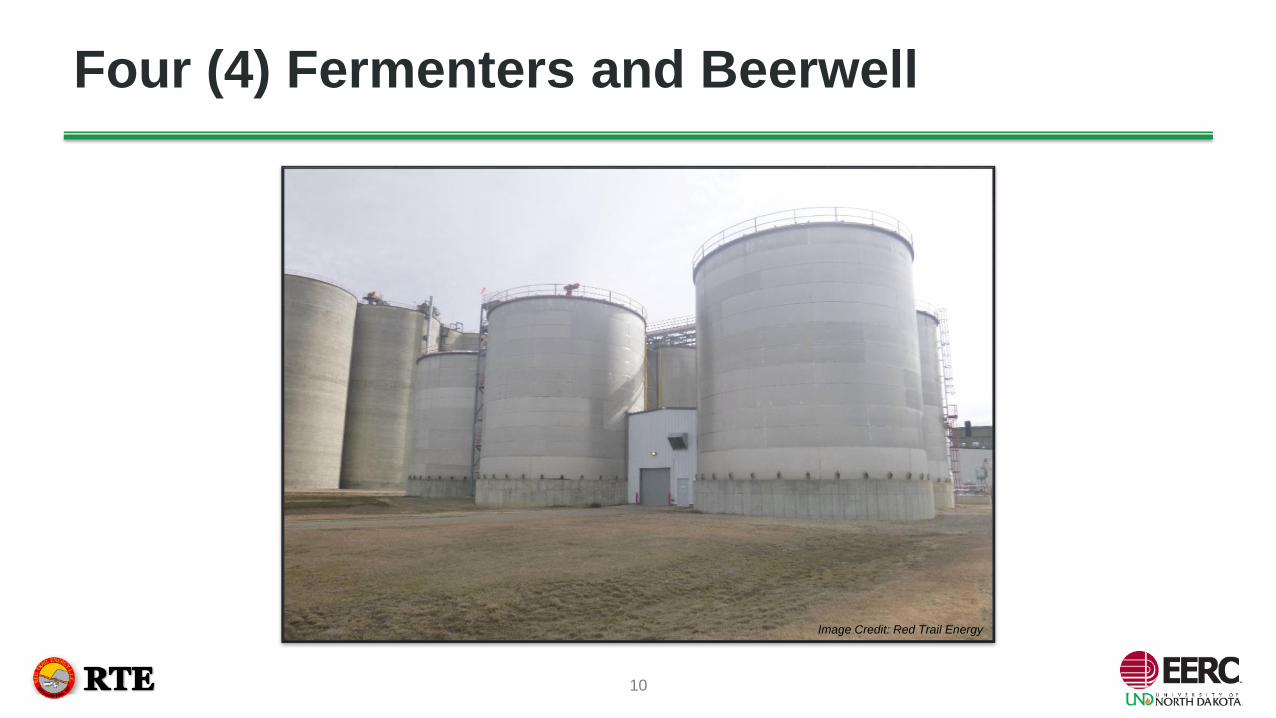
Four (4) Fermenters and Beerwell
Image Credit: Red Trail Energy
10

Vacuum Distillation
Image Credit: Red Trail Energy
11
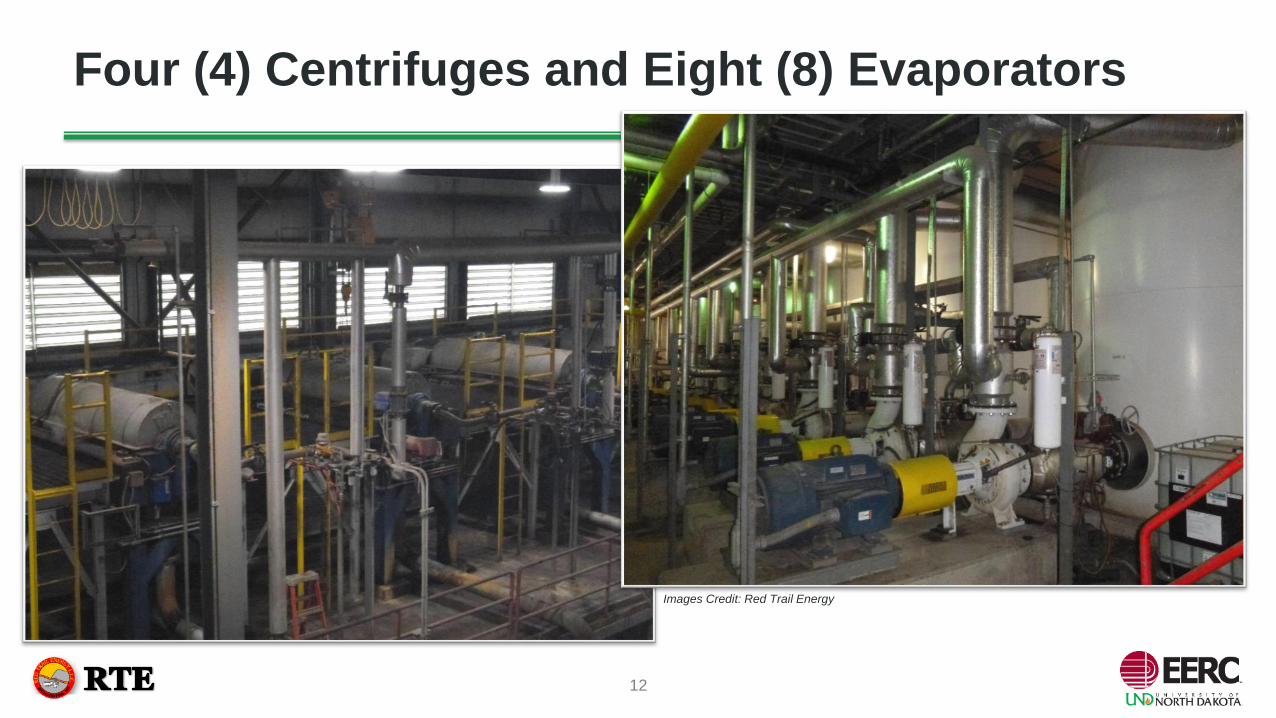
Four (4) Centrifuges and Eight (8) Evaporators
Images Credit: Red Trail Energy
12
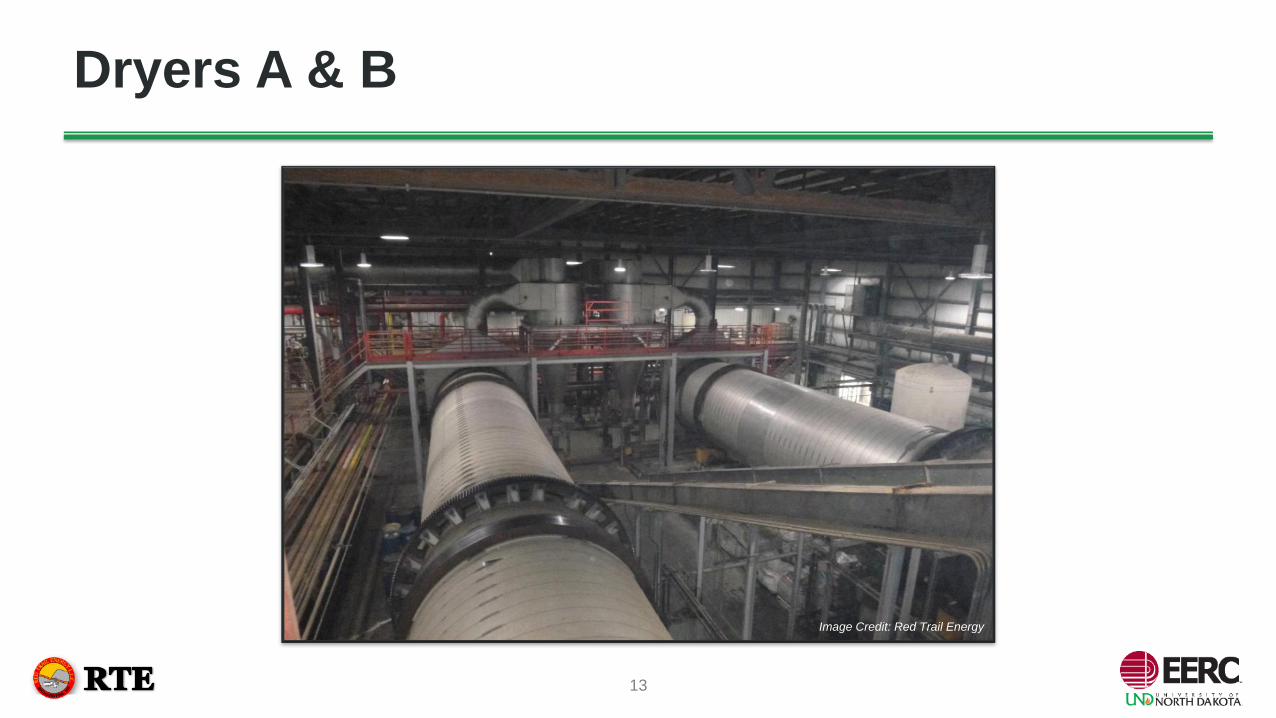
Dryers A & B
Image Credit: Red Trail Energy
13

Dry/Modified Distillers Grains
Images Credit: Red Trail Energy
14
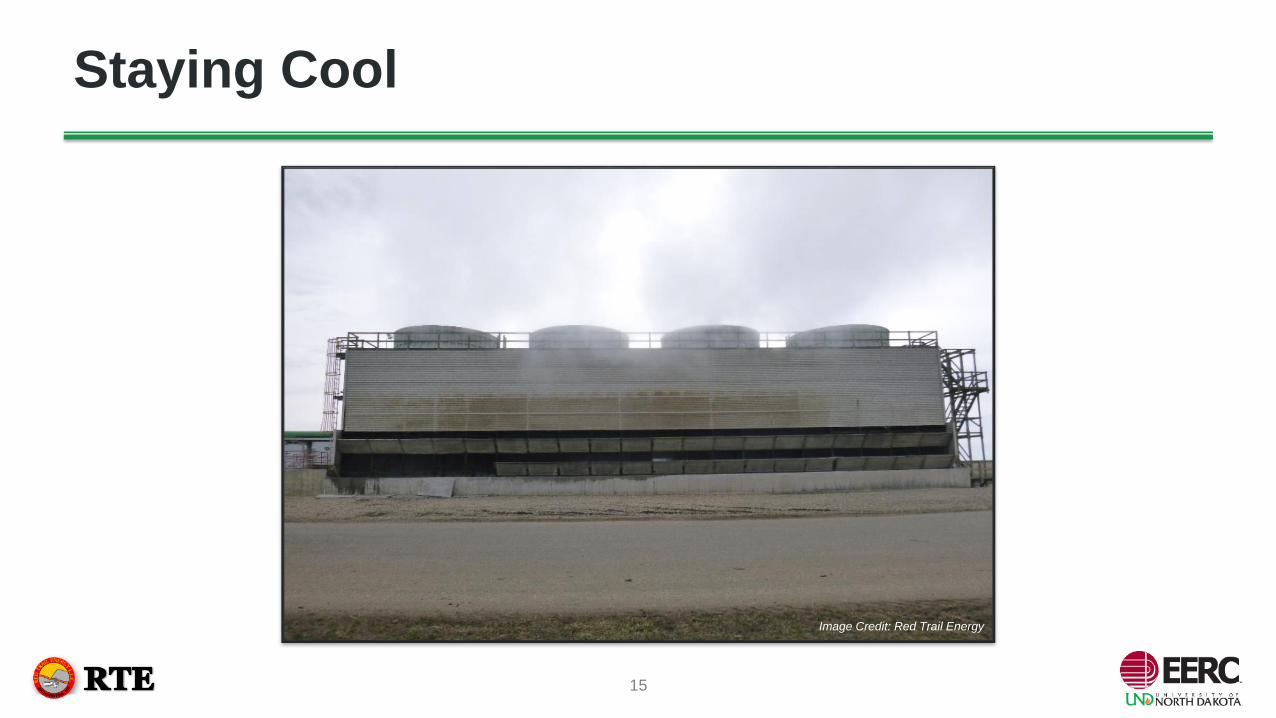
Staying Cool
Image Credit: Red Trail Energy
15
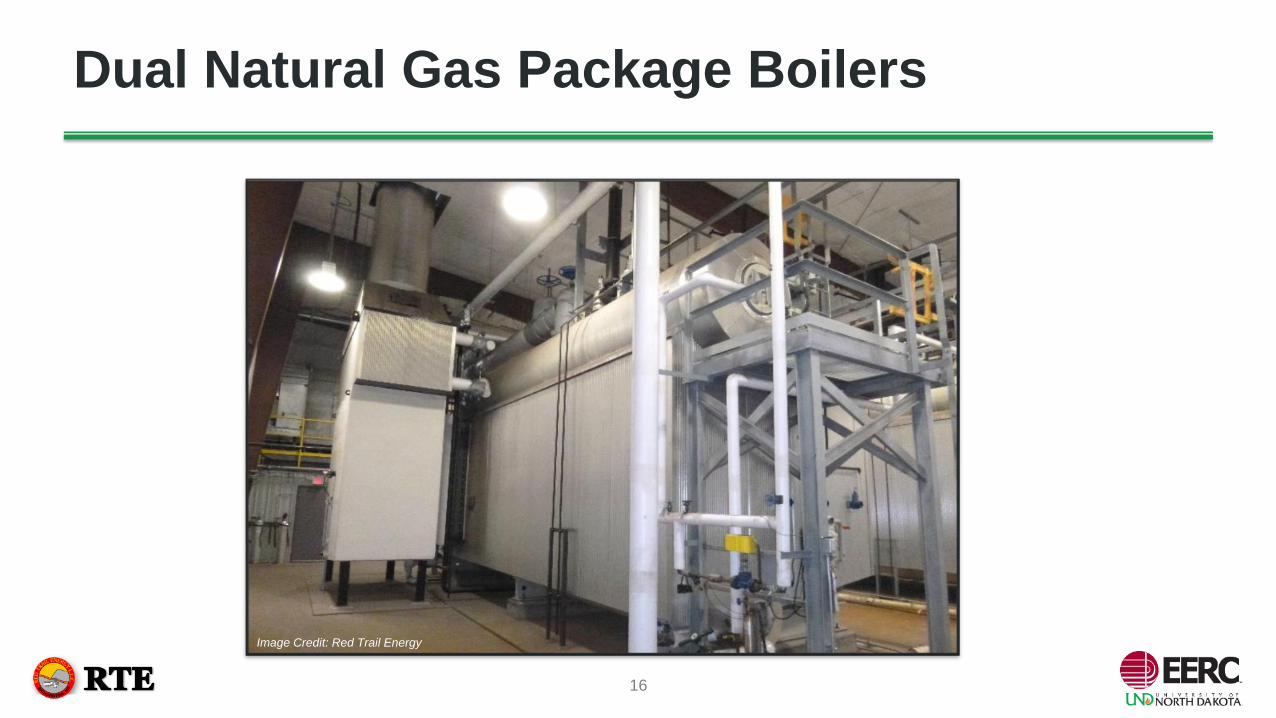
Dual Natural Gas Package Boilers
Image Credit: Red Trail Energy
16
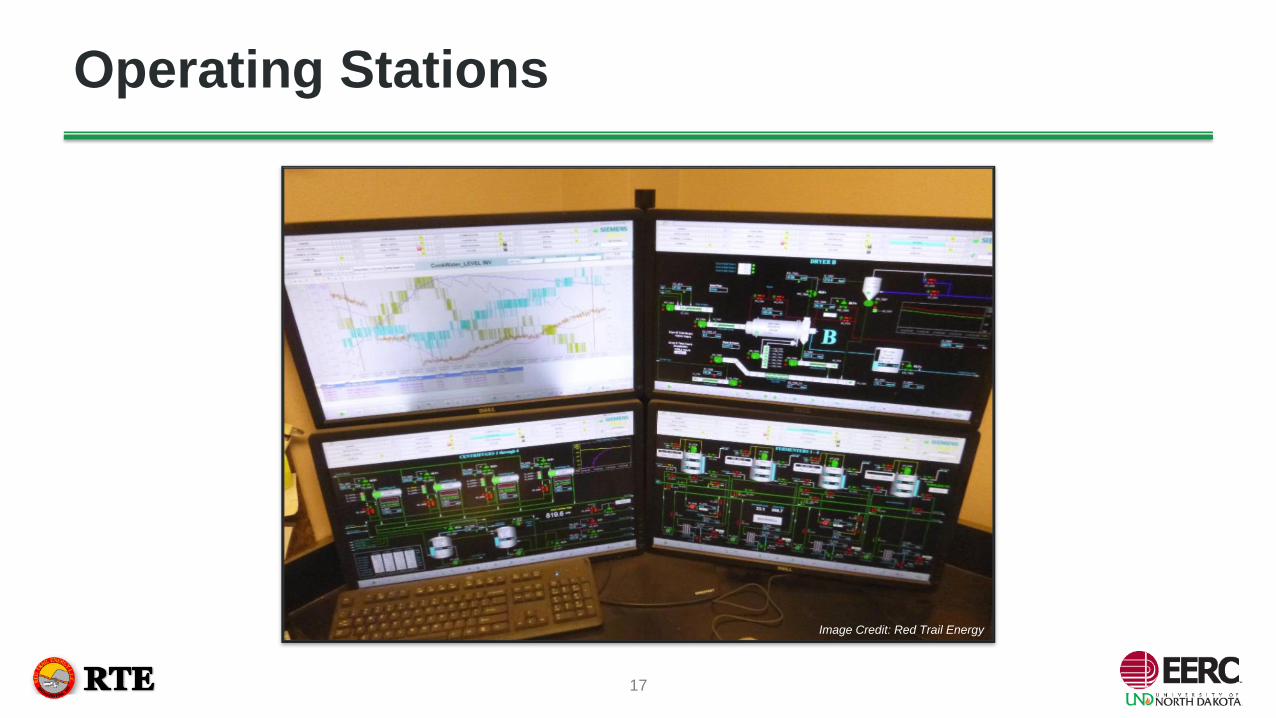
Operating Stations
Image Credit: Red Trail Energy
17
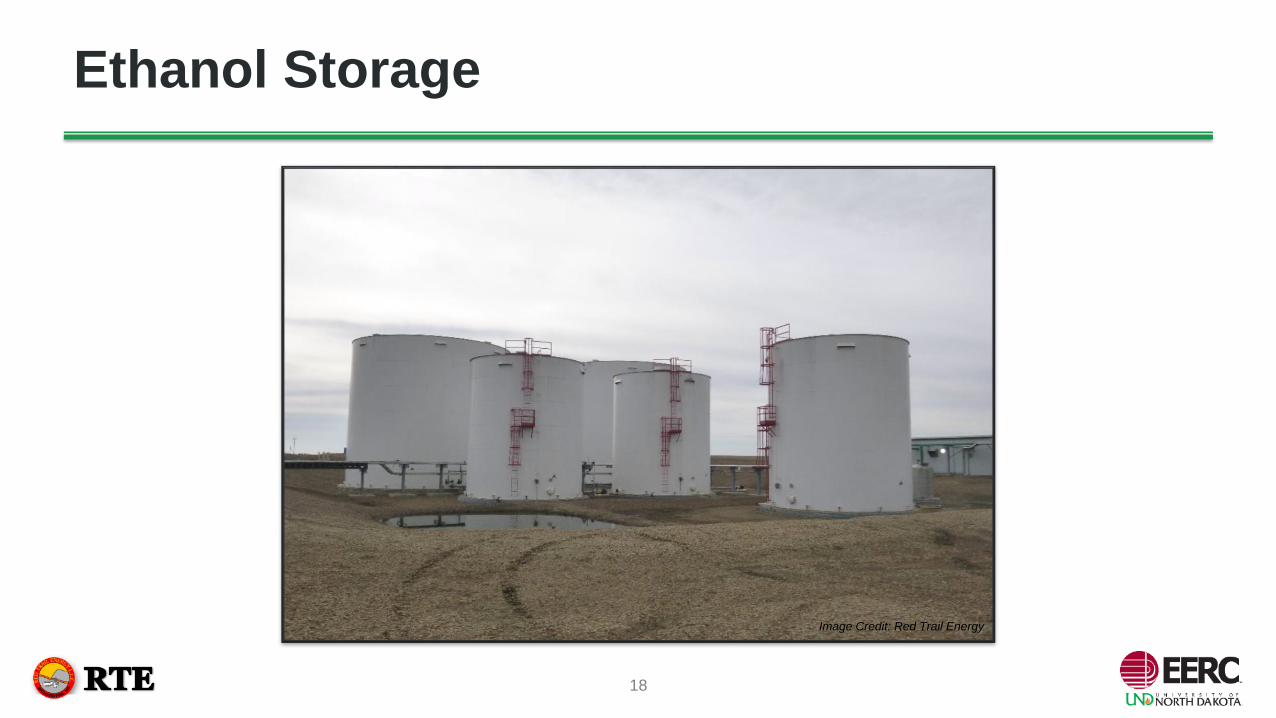
Ethanol Storage
Image Credit: Red Trail Energy
18
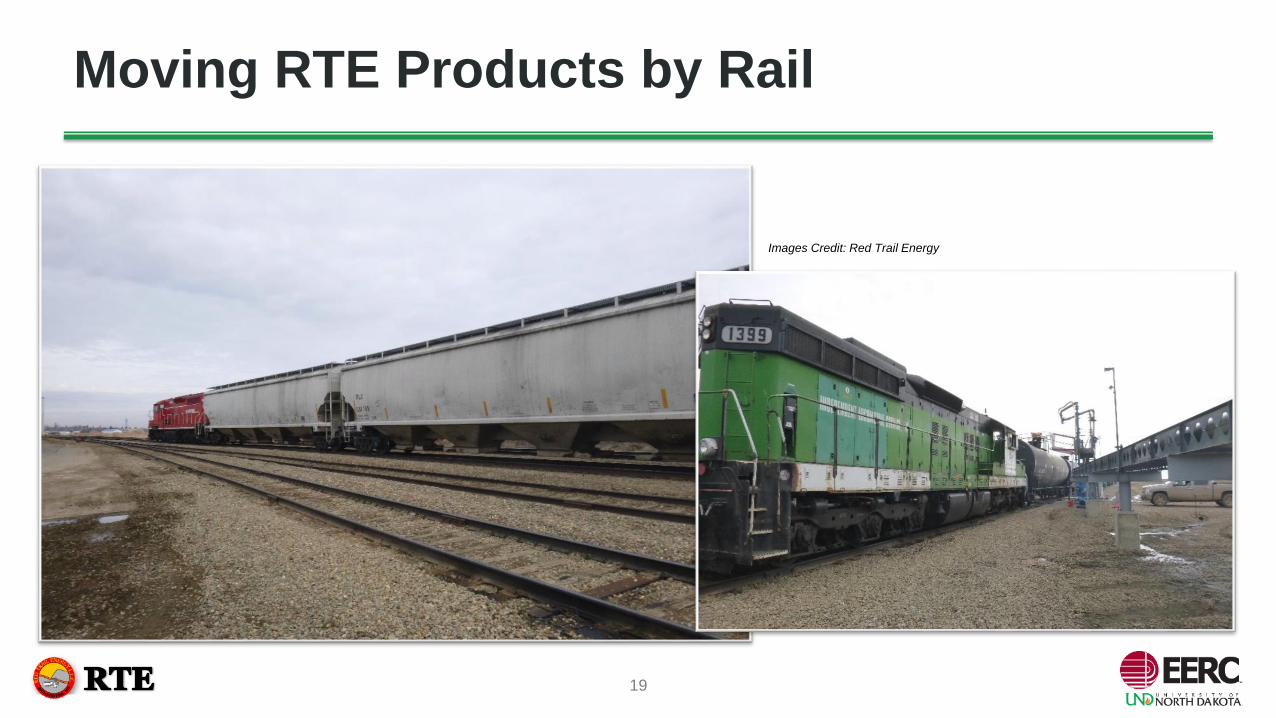
Moving RTE Products by Rail
Images Credit: Red Trail Energy
19

Source: Renewable Fuels Association, 2017
• 90% plants use dry mill process
• 200 US plants, 28 states = 16 billion gallons
ND is Top 10 producer
• US generates 60% global market
– Exported 1 billion gallons in 2016
– Canada and Brazil are half market
– Other leading markets: China, India,
Philippines, Peru and South Korea
Fuel Ethanol Stats
Image Credit: Red Trail Energy
20
RTE CCS Drivers
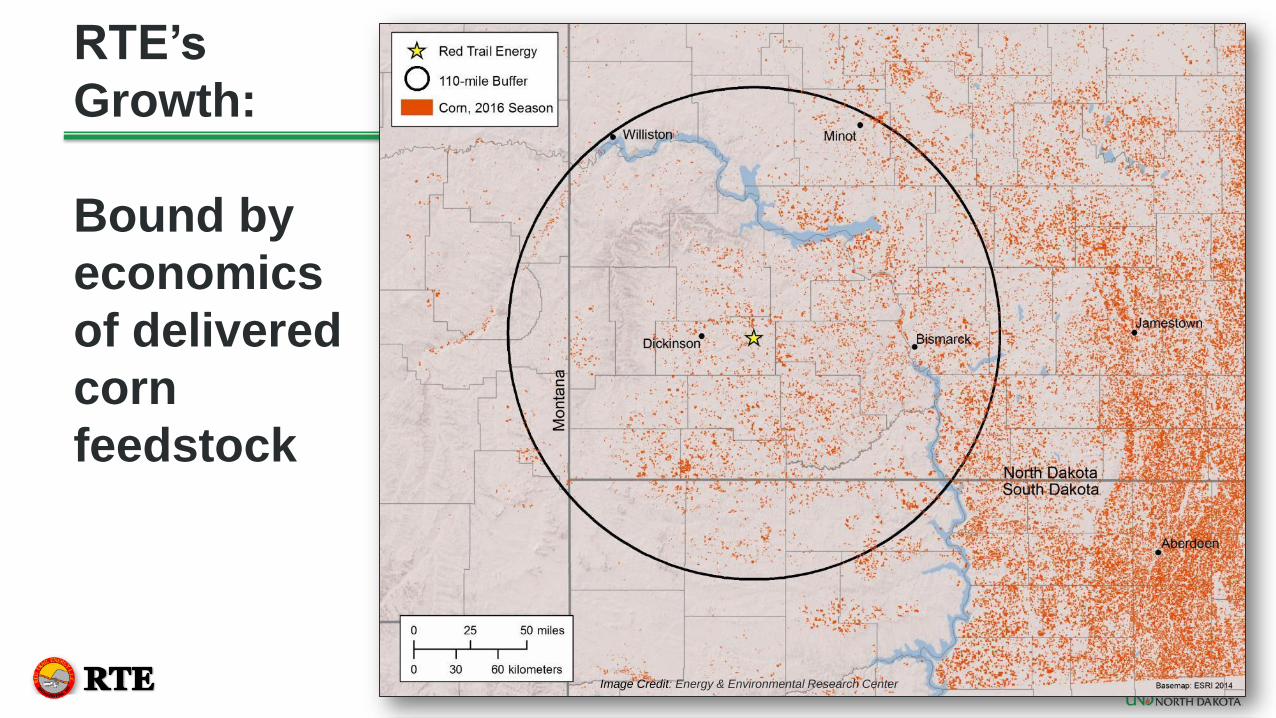
RTE’s
Growth:
Bound by
economics
of delivered
corn
feedstock
Image Credit: Energy & Environmental Research Center
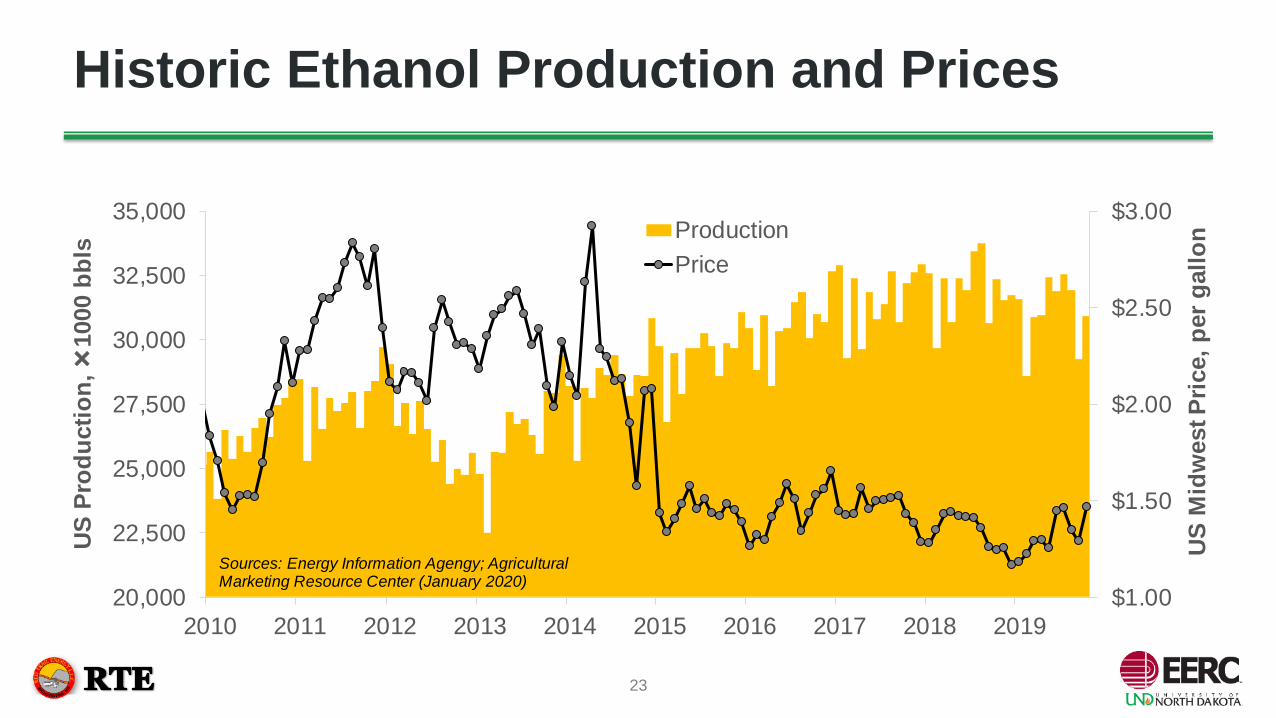
Historic Ethanol Production and Prices
$1.00
$1.50
$2.00
$2.50
$3.00
20,000
22,500
25,000
27,500
30,000
32,500
35,000
2010 2011 2012 2013 2014 2015 2016 2017 2018 2019
US
Mid
west P
rice,
per
gall
on
US
Pro
du
cti
on
,
1000 b
bls
Production
Price
Sources: Energy Information Agengy; Agricultural Marketing Resource Center (January 2020)
23
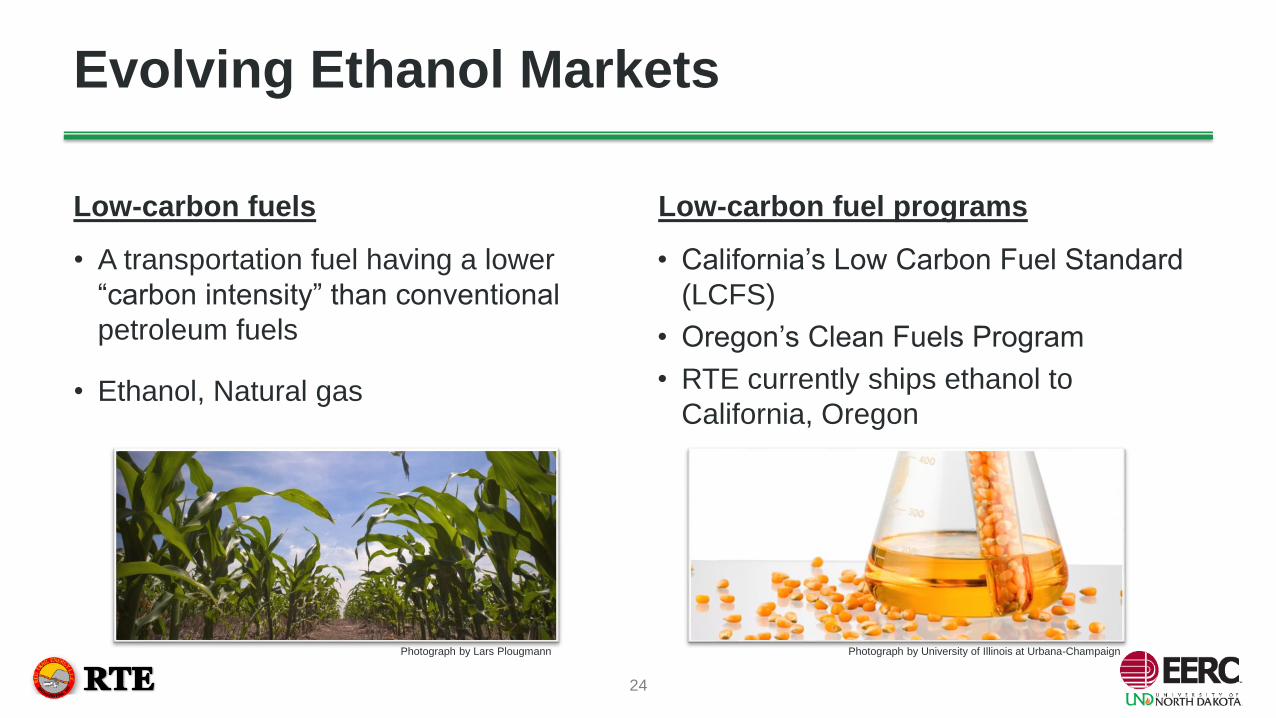
Low-carbon fuels Low-carbon fuel programs
• A transportation fuel having a lower
“carbon intensity” than conventional
petroleum fuels
• Ethanol, Natural gas
• California’s Low Carbon Fuel Standard
(LCFS)
• Oregon’s Clean Fuels Program
• RTE currently ships ethanol to
California, Oregon
Evolving Ethanol Markets
Photograph by Lars Plougmann Photograph by University of Illinois at Urbana-Champaign
24
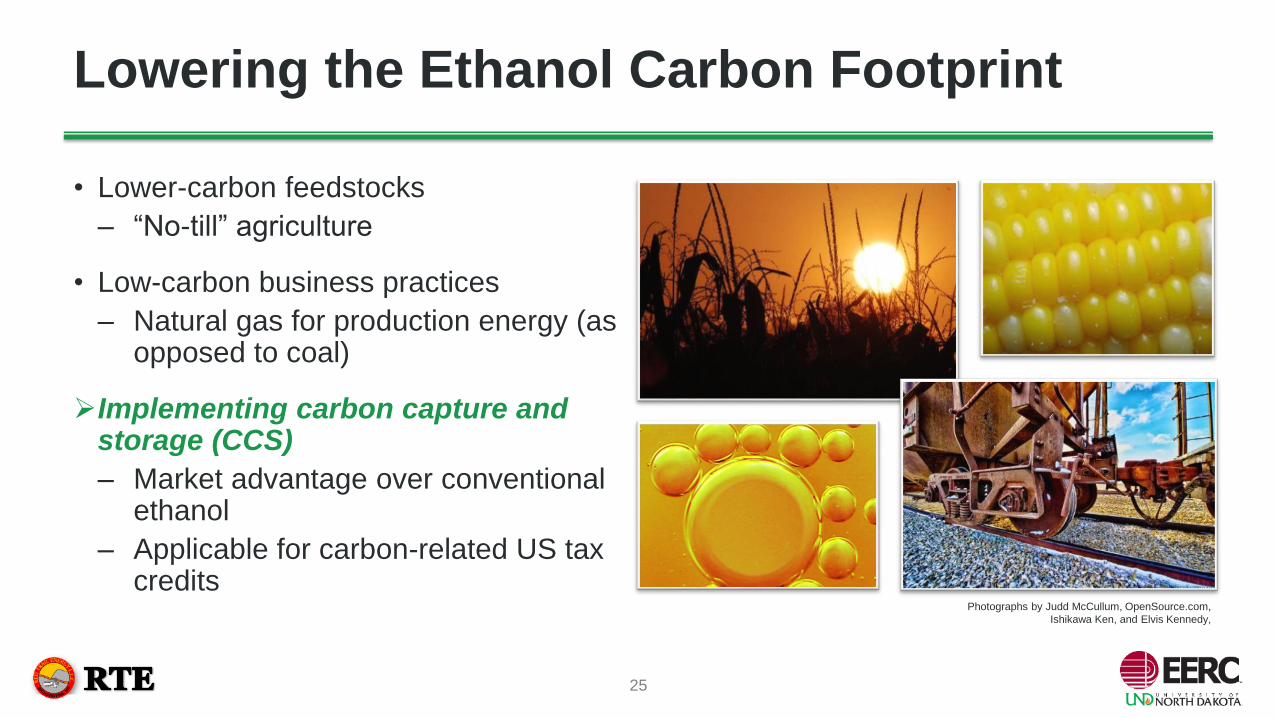
• Lower-carbon feedstocks
– “No-till” agriculture
• Low-carbon business practices
– Natural gas for production energy (as opposed to coal)
Implementing carbon capture and storage (CCS)
– Market advantage over conventional ethanol
– Applicable for carbon-related US tax credits
Lowering the Ethanol Carbon Footprint
Photographs by Judd McCullum, OpenSource.com,
Ishikawa Ken, and Elvis Kennedy,
25

USA IRS Tax Incentive
Up to $50/tonne CO2 for
dedicated storage
Construction before 2024
Credits allowable for 12 years.
The CCS Advantage
0 20 40 60 80 100
CI, gCO2e/MJ
Source: California Air Resources Board (July 2016)
LCFS Gasoline 2020 Goal
Midwest Ethanol Producers 2016
RTE 2016
RTE Goal w/CCS
California LCFS Program: Carbon Intensity (CI)
by Fuel Type
26
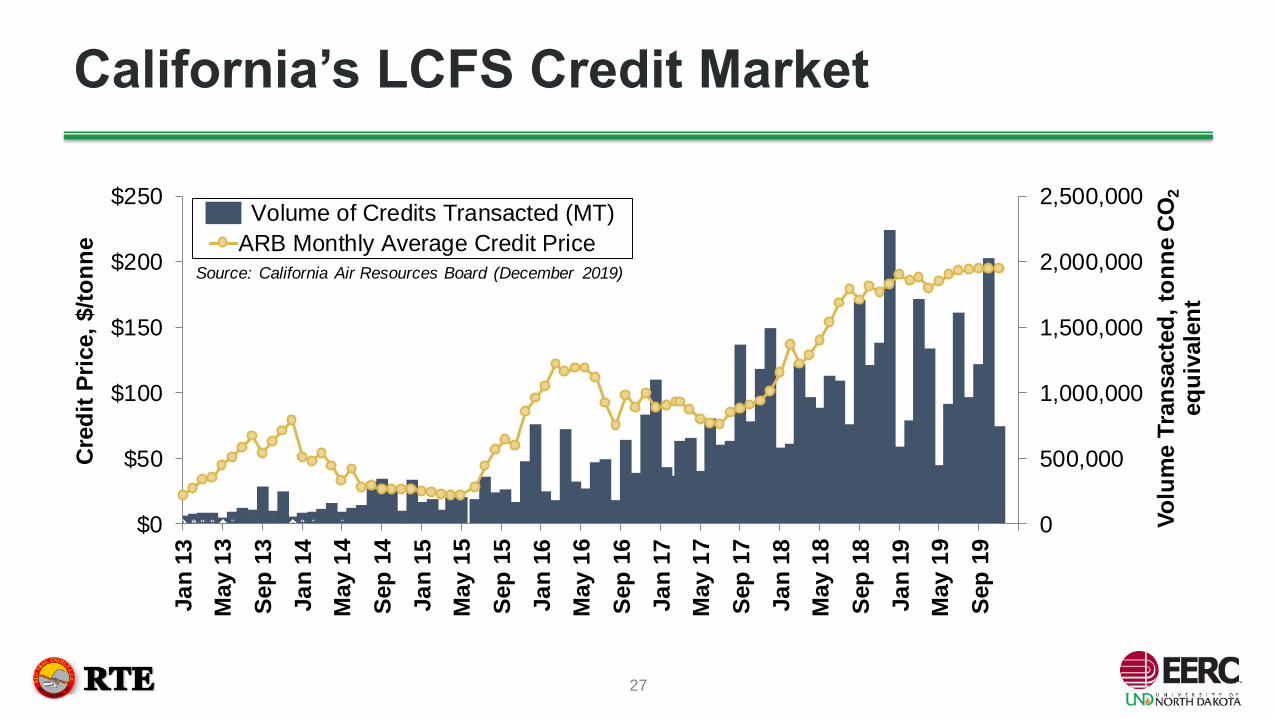
California’s LCFS Credit Market
0
500,000
1,000,000
1,500,000
2,000,000
2,500,000
$0
$50
$100
$150
$200
$250Ja
n 1
3
May
13
Sep
13
Ja
n 1
4
May
14
Sep
14
Ja
n 1
5
May
15
Sep
15
Ja
n 1
6
May
16
Sep
16
Ja
n 1
7
May
17
Sep
17
Ja
n 1
8
May
18
Sep
18
Ja
n 1
9
May
19
Sep
19
Vo
lum
e T
ran
sacte
d,
ton
ne C
O2
eq
uiv
ale
nt
Cre
dit
Pri
ce,
$/t
on
ne
Volume of Credits Transacted (MT)
ARB Monthly Average Credit Price
Source: California Air Resources Board (December 2019)
27
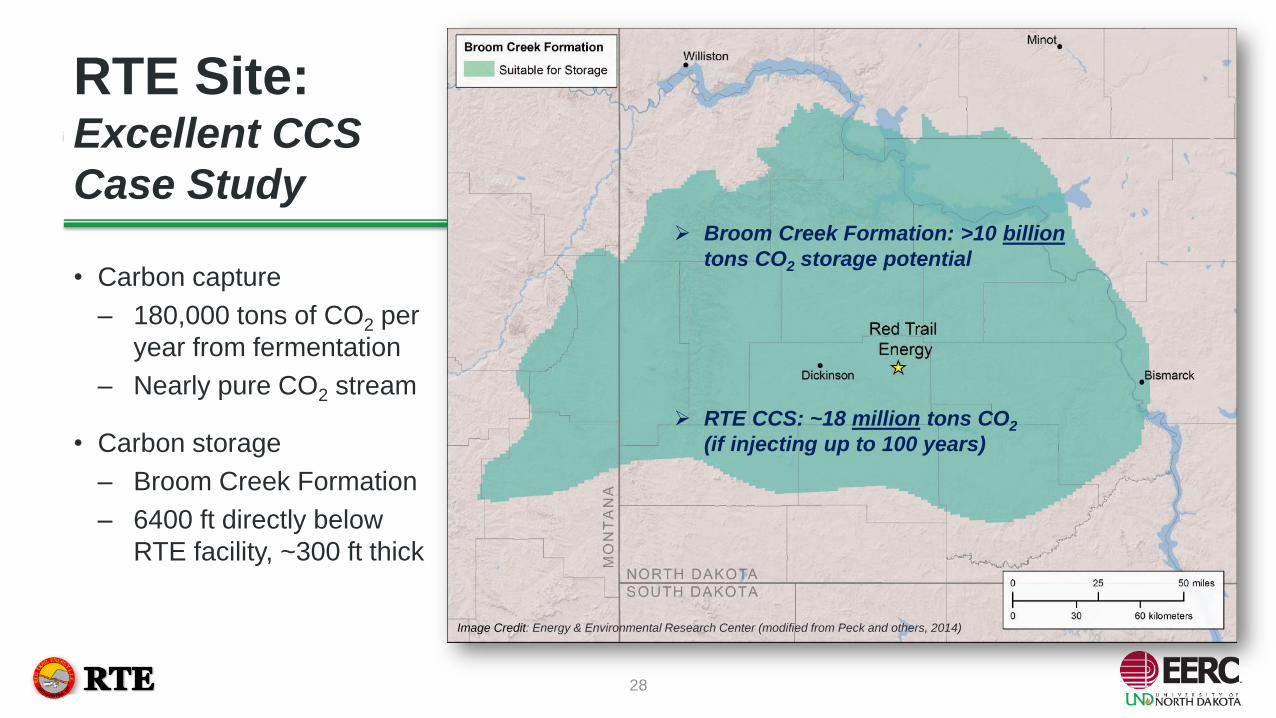
RTE Site: Excellent CCS
Case Study
• Carbon capture
– 180,000 tons of CO2 per
year from fermentation
– Nearly pure CO2 stream
• Carbon storage
– Broom Creek Formation
– 6400 ft directly below
RTE facility, ~300 ft thick
28
Image Credit: Energy & Environmental Research Center (modified from Peck and others, 2014)
Broom Creek Formation: >10 billion
tons CO2 storage potential
RTE CCS: ~18 million tons CO2
(if injecting up to 100 years)

RTE CCS Project
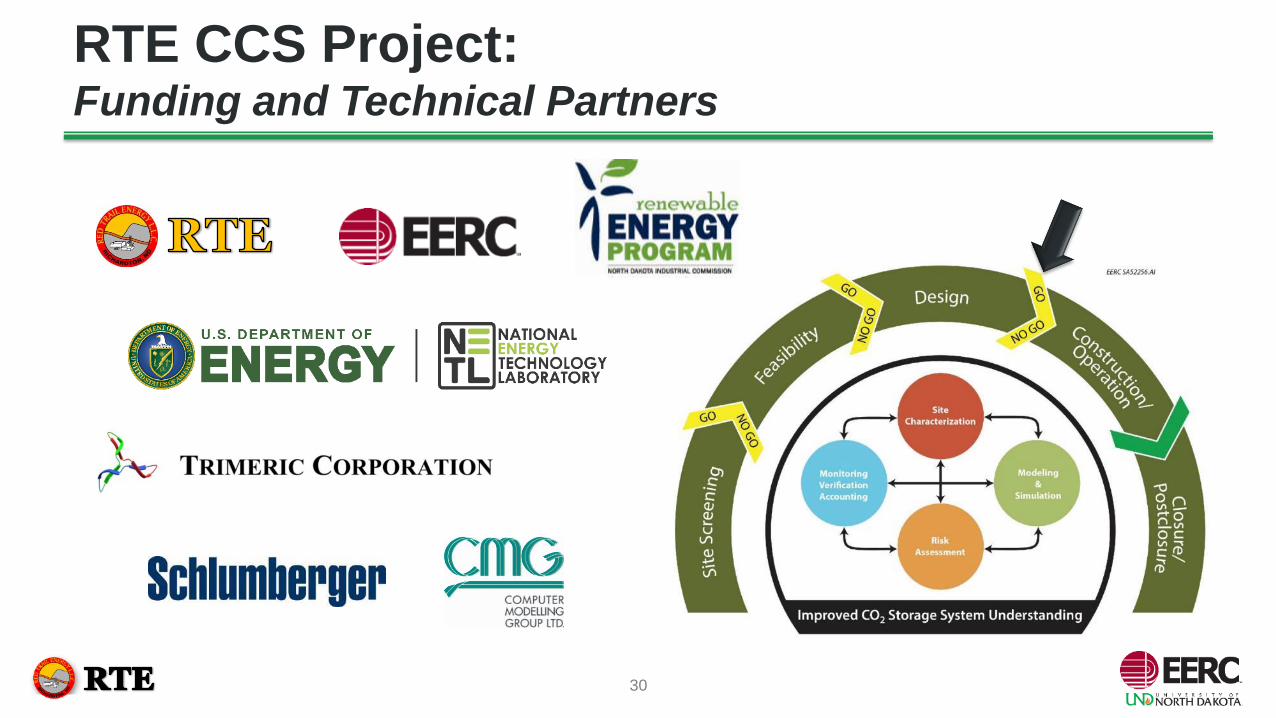
RTE CCS Project:Funding and Technical Partners
30
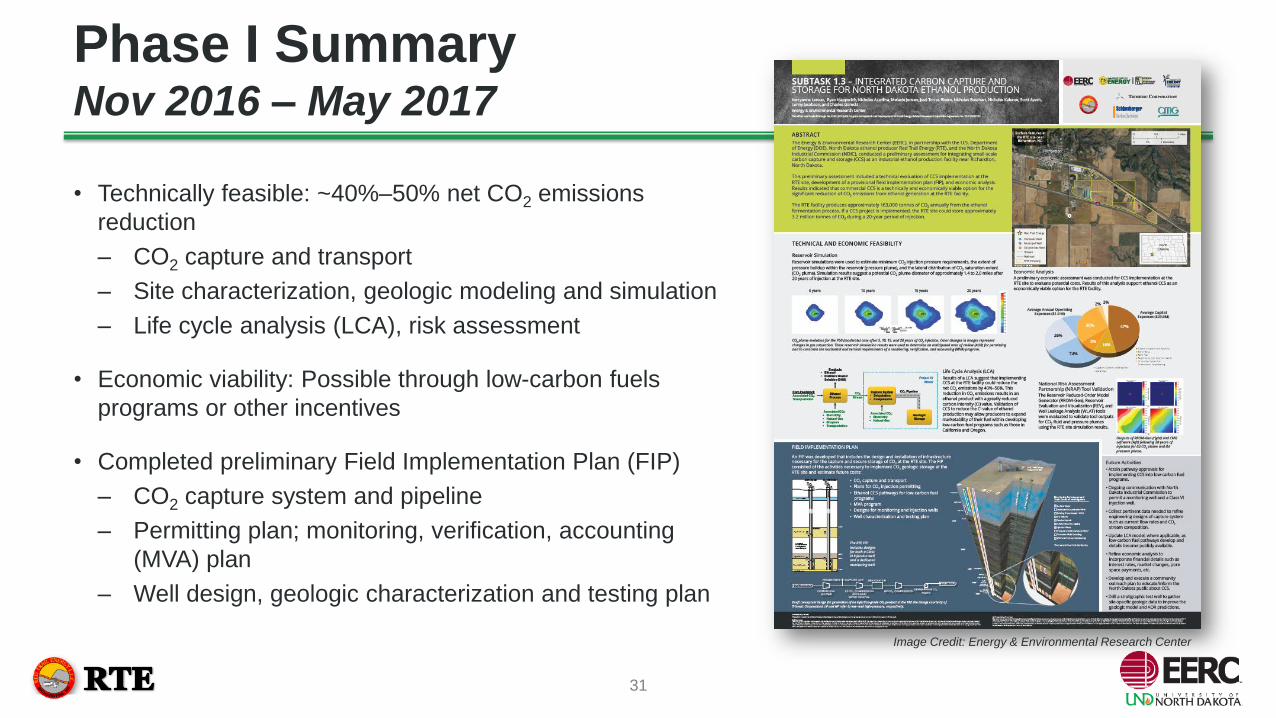
• Technically feasible: ~40%–50% net CO2 emissions
reduction
– CO2 capture and transport
– Site characterization, geologic modeling and simulation
– Life cycle analysis (LCA), risk assessment
• Economic viability: Possible through low-carbon fuels
programs or other incentives
• Completed preliminary Field Implementation Plan (FIP)
– CO2 capture system and pipeline
– Permitting plan; monitoring, verification, accounting
(MVA) plan
– Well design, geologic characterization and testing plan
Phase I SummaryNov 2016 – May 2017
Image Credit: Energy & Environmental Research Center
31
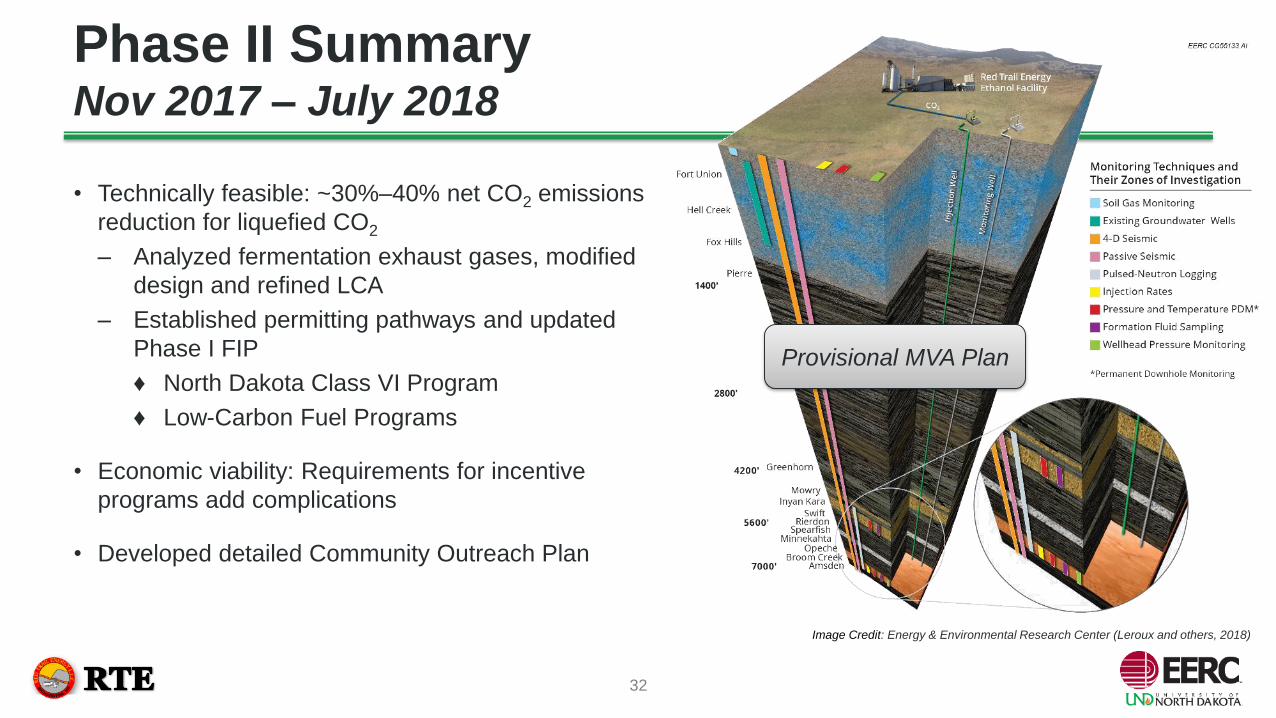
• Technically feasible: ~30%–40% net CO2 emissions
reduction for liquefied CO2
– Analyzed fermentation exhaust gases, modified
design and refined LCA
– Established permitting pathways and updated
Phase I FIP
♦ North Dakota Class VI Program
♦ Low-Carbon Fuel Programs
• Economic viability: Requirements for incentive
programs add complications
• Developed detailed Community Outreach Plan
Phase II SummaryNov 2017 – July 2018
32
Provisional MVA Plan
Image Credit: Energy & Environmental Research Center (Leroux and others, 2018)
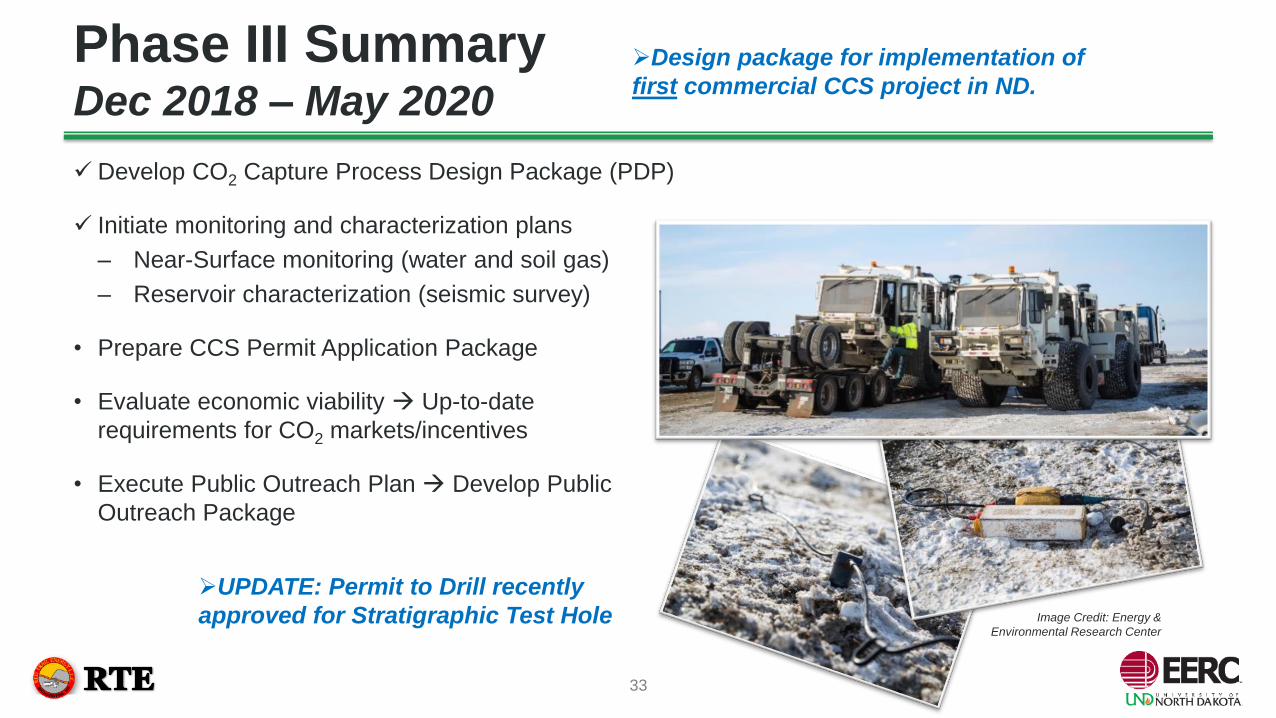
Develop CO2 Capture Process Design Package (PDP)
Initiate monitoring and characterization plans
– Near-Surface monitoring (water and soil gas)
– Reservoir characterization (seismic survey)
• Prepare CCS Permit Application Package
• Evaluate economic viability Up-to-date
requirements for CO2 markets/incentives
• Execute Public Outreach Plan Develop Public
Outreach Package
Phase III SummaryDec 2018 – May 2020
33
Image Credit: Energy &
Environmental Research Center
Design package for implementation of
first commercial CCS project in ND.
UPDATE: Permit to Drill recently
approved for Stratigraphic Test Hole
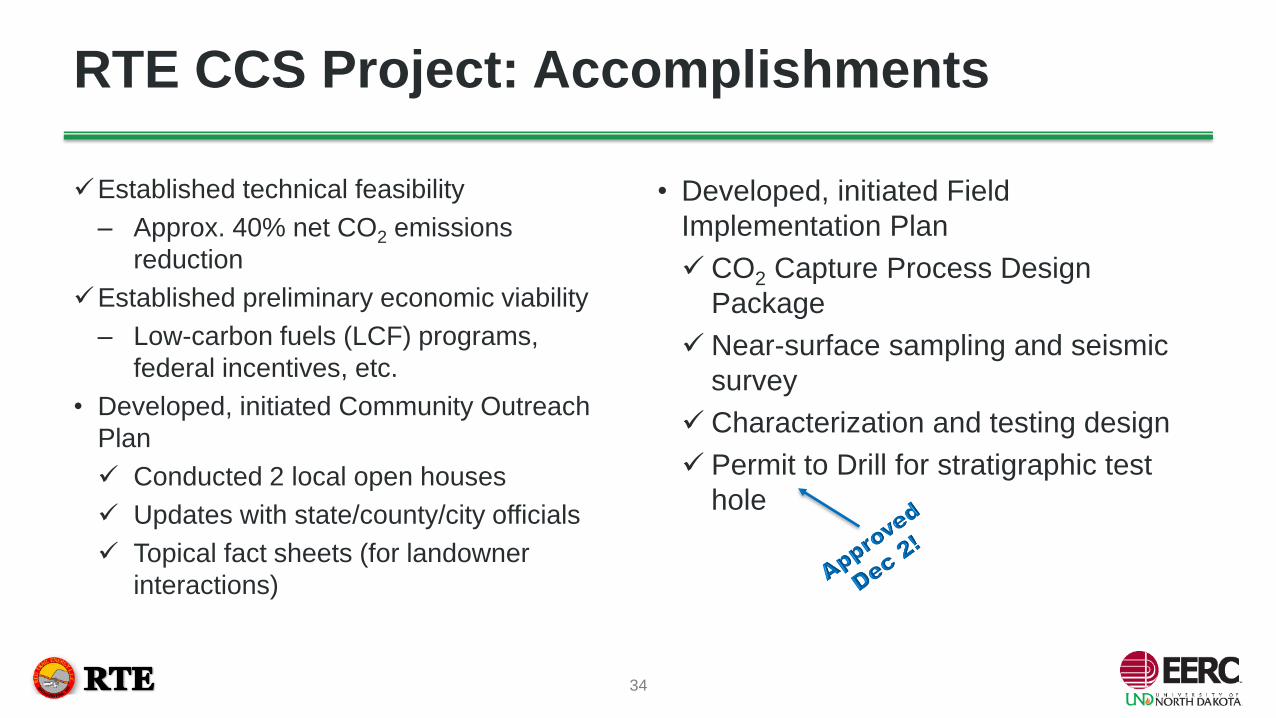
Established technical feasibility
– Approx. 40% net CO2 emissions
reduction
Established preliminary economic viability
– Low-carbon fuels (LCF) programs,
federal incentives, etc.
• Developed, initiated Community Outreach
Plan
Conducted 2 local open houses
Updates with state/county/city officials
Topical fact sheets (for landowner
interactions)
• Developed, initiated Field
Implementation Plan
CO2 Capture Process Design
Package
Near-surface sampling and seismic
survey
Characterization and testing design
Permit to Drill for stratigraphic test
hole
RTE CCS Project: Accomplishments
34
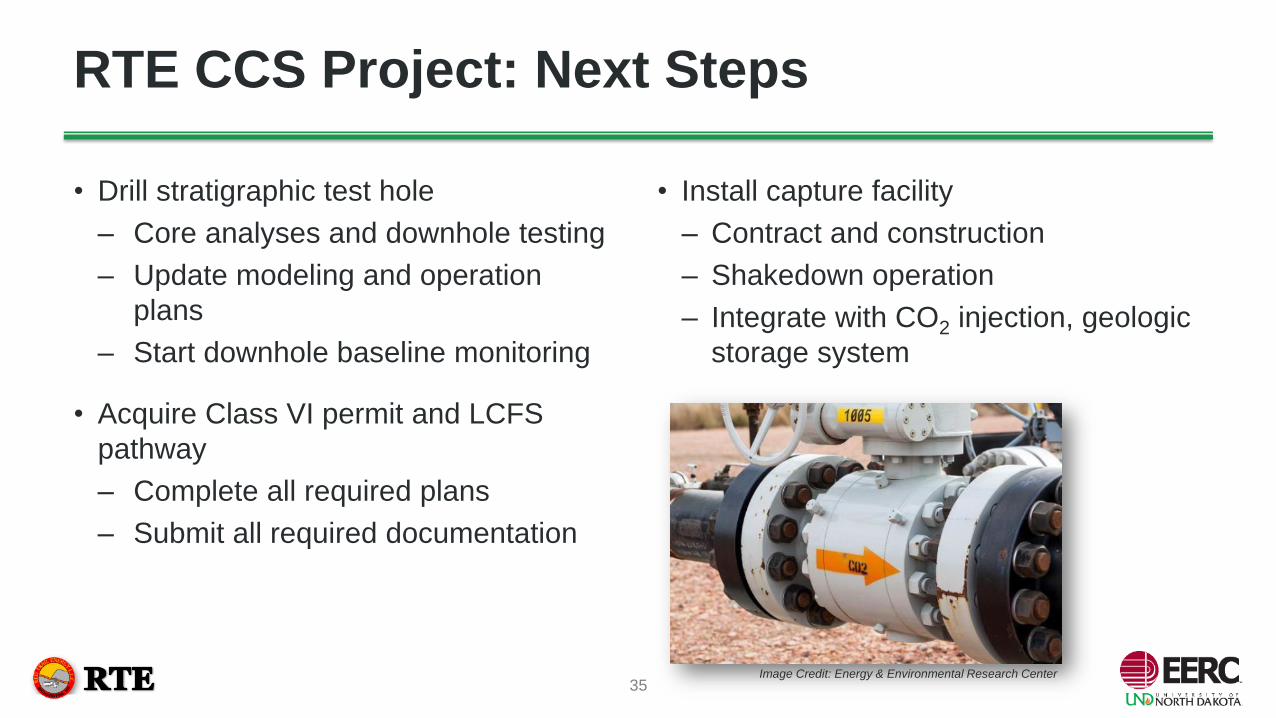
• Drill stratigraphic test hole
– Core analyses and downhole testing
– Update modeling and operation
plans
– Start downhole baseline monitoring
• Acquire Class VI permit and LCFS
pathway
– Complete all required plans
– Submit all required documentation
• Install capture facility
– Contract and construction
– Shakedown operation
– Integrate with CO2 injection, geologic
storage system
RTE CCS Project: Next Steps
Image Credit: Energy & Environmental Research Center35
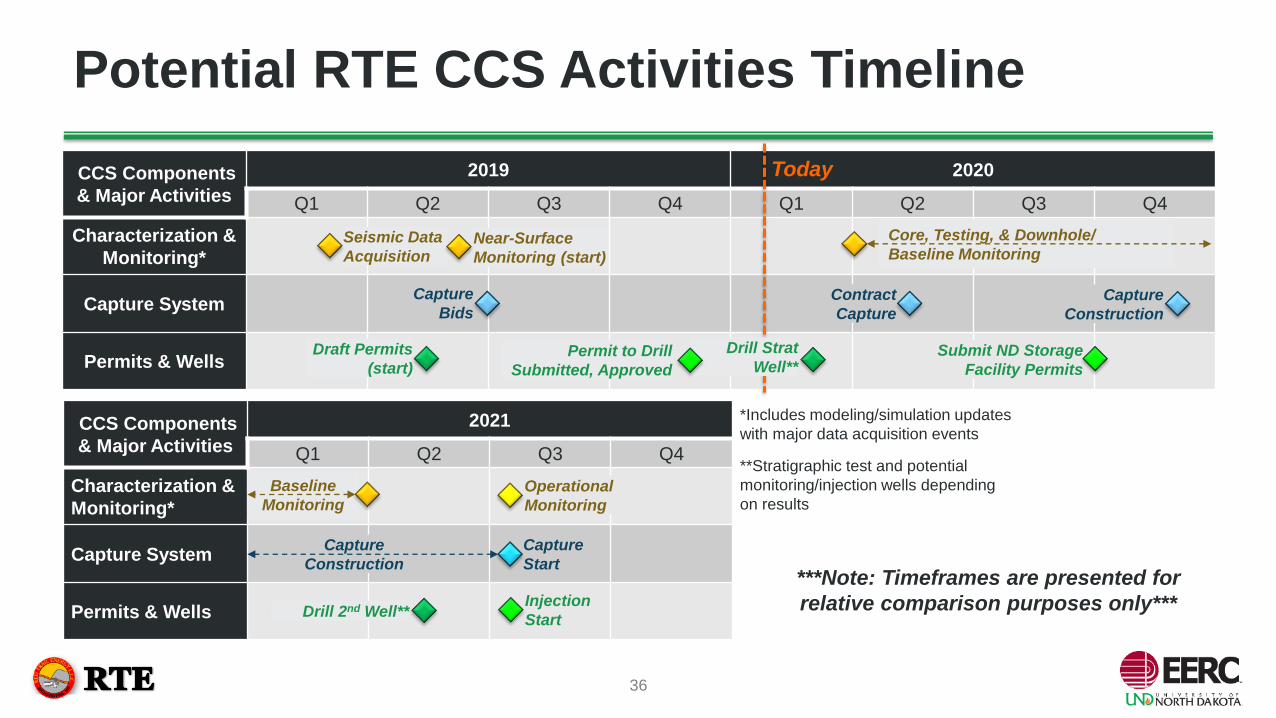
Potential RTE CCS Activities Timeline
CCS Components
& Major Activities
2019 2020
Q1 Q2 Q3 Q4 Q1 Q2 Q3 Q4
Characterization &
Monitoring*
Capture System
Permits & Wells
Today
Capture
BidsContract
Capture
Seismic Data
AcquisitionNear-Surface
Monitoring (start)
Drill Strat
Well**Draft Permits
(start)
*Includes modeling/simulation updates
with major data acquisition events
**Stratigraphic test and potential
monitoring/injection wells depending
on results
CCS Components
& Major Activities
2021
Q1 Q2 Q3 Q4
Characterization &
Monitoring*
Capture System
Permits & Wells
Submit ND Storage
Facility Permits
Capture
Start
Injection
Start
Operational
Monitoring
Baseline
Monitoring
Capture
Construction
Capture
Construction
Core, Testing, & Downhole/
Baseline Monitoring
***Note: Timeframes are presented for
relative comparison purposes only***Drill 2nd Well**
Permit to Drill
Submitted, Approved
36
Questions?
Image Credit: Energy & Environmental Research Center
37
Contact Information
Energy & Environmental Research CenterUniversity of North Dakota15 North 23rd Street, Stop 9018Grand Forks, North Dakota 58202-9018
701.777.5181 (fax)
www.undeerc.org
Project Advisor
John Hamling
Assistant Director for Integrated Projects
701.777. 5472
Project Manager
Kerryanne Leroux
Principal Engineer, CCUS Systems Lead
701.777.5013
Red Trail Energy, LLC
3682 Hwy 8 South
PO Box 11
Richardton, North Dakota 58652
701.974.3309 (fax)
www.redtrailenergyllc.com
Gerald Bachmeier
Chief Executive Officer
701.974.3308
Dustin Willett
Chief Operating Officer
701.974.3308 ext. 111
THANK YOU!
Image Credit: Energy & Environmental Research Center