Recycling of Used Electronics in Singapore · reviewed to understand the generation, the disposal,...
128
i
Transcript of Recycling of Used Electronics in Singapore · reviewed to understand the generation, the disposal,...

i

University of Southern Queensland
Faculty of Engineering and Surveying
Recycling of Used Electronics in Singapore
A dissertation submitted by
Tan Heng Tsin Stanley
in fulfilment of the requirements of
Courses ENG4111 and 4112 Research Project
towards the degree of
Bachelor of Engineering (Electrical and Electronics)
Submitted: November, 2007
ii

Abstract
Electronic waste is easily generated as people increasingly use electronic and
electrical equipment in the daily life. Technology advances rapidly and this caused
the life span of electronic products to become increasingly shorter. As a result,
electronic wastes are rapidly generated in our industry and society. Electronic waste
buried in landfills will cause toxins to leach into the environment. If they are
incinerated, they produce noxious gases. In both ways, they pollute the environment
and pose serious health threats to humans and also harm the wildlife. It will only be
sustainable if electronic wastes are recycled.
This research project was carried out to assess the problem of recycling of used
electronics in Singapore and the related environmental concerns. The harmful
effects of electronic wastes as well as the relating problems in other countries are
observed. An understanding is also made on the benefits of recycling of electronic
wastes as well. Related authorities’ and recycling company’s information are
reviewed to understand the generation, the disposal, the collection and the recycling
of used electronics in the country. In an attempt to identify better solutions which
could be effective to address the used electronics problems in Singapore,
information is researched on global recycling of electronic waste.
Case studies were conducted to understand the management used in handling of
used electronics in the companies. This provided a chance to observe the practices
and subsequently identification of problems in a company. A survey of consumers
was carried out to understand their attitudes and behaviours. This helped to identify
the problems faced in the community to which used electronics were not actively
recycled.
iii

University of Southern Queensland
Faculty of Engineering and Surveying
ENG4111 Research Project Part 1 & ENG4112 Research Project Part 2
Limitations of Use
The Council of the University of Southern Queensland, its Faculty of Engineering and Surveying, and the staff of the University of Southern Queensland, do not accept any responsibility for the truth, accuracy or completeness of material contained within or associated with this dissertation. Persons using all or any part of this material do so at their own risk, and not at the risk of the Council of the University of Southern Queensland, its Faculty of Engineering and Surveying or the staff of the University of Southern Queensland. This dissertation reports an educational exercise and has no purpose or validity beyond this exercise. The sole purpose of the course “Project and Dissertation” is to contribute to the overall education within the student’s chosen degree program. This document, the associated hardware, software, drawings, and other material set out in the associated appendices should not be used for any other purpose: if they are so used, it is entirely at the risk of the user. Professor Frank Bullen Dean Faculty of Engineering and Surveying
iv
Certification
I certify that the ideas, designs and experimental work, results, analyses and
conclusions set out in this dissertation are entirely my own effort, except where
otherwise indicated and acknowledged.
I further certify that the work is original and has not been previously submitted for
assessment in any other courses or institution, except where specifically stated.
Tan Heng Tsin Stanley Student Number: 0050003071 __________________________________ Signature __________________________________
Date
v
Acknowledgements
This project was developed with the guidance, encouragement and support of many
people.
I would like to thank Mr. David Parsons, my project supervisor, for his guidance
and invaluable advice throughout the course of study. I appreciate his enthusiasm
and encouragement.
Special thanks to Assoc Prof Ron Ayers for his guidance and advice on the survey
and to those who participated in answering the questionnaire as well as friends who
helped out in the data collection for the case studies.
I would also like to thank my family and my girlfriend for their support and
encouragement throughout my graduate study.
Tan Heng Tsin Stanley 2007
vi

Table of Contents Abstract.................................................................................... iii
Certification...............................................................................v
Acknowledgements ................................................................. vi
List of Figures............................................................................x
List of Tables .......................................................................... xii
Chapter 1: Introduction.......................................................1
1.1 Project Background ....................................................................................... 1
1.2 Outline of the Report..................................................................................... 2
Chapter 2: Literature Review .............................................3
2.1 Introduction ................................................................................................... 3
2.2 Background of Recycling of Used Electronics ............................................. 3
2.3 Electronic Waste in Other Countries............................................................. 6
2.4 The Benefits of Recycling........................................................................... 10
2.5 Summary ..................................................................................................... 13
Chapter 3: Methodology ....................................................14
3.1 Introduction ................................................................................................. 14
3.2 Goal Definition............................................................................................ 14
3.3 Scope Definition.......................................................................................... 14
3.4 Assumptions Used in Case Studies ............................................................. 16
Chapter 4: Singapore’s Recycling.....................................17
4.1 Introduction ................................................................................................. 17
4.2 Singapore’s Situation .................................................................................. 17
4.3 Factors Leading to Used Electronics Generation........................................ 19
vii

4.4 Waste Management ..................................................................................... 24
4.5 Conclusions ................................................................................................. 30
Chapter 5: The Process of Recycling in Singapore..........31
5.1 Introduction ................................................................................................. 31
5.2 The Collection of Used Electronics ............................................................ 31
5.3 Electronic Waste Recycling Companies in Singapore................................ 36
5.4 Conclusions and Recommendations............................................................ 41
Chapter 6: Management of Electronic Waste in Other
Countries ...........................................................................43
6.1 Introduction ................................................................................................. 43
6.2 Management in the United States (US)....................................................... 43
6.3 Management in Australia, Europe and Japan.............................................. 47
6.4 Conclusions and Recommendations............................................................ 50
Chapter 7: Case Studies on Companies in the Local
Industry ...........................................................................52
7.1 Introduction ................................................................................................. 52
7.2 Methodology ............................................................................................... 52
7.3 Case Study Number 1.................................................................................. 54
7.4 Case Study Number 2.................................................................................. 60
7.5 Evaluation of Results .................................................................................. 67
7.6 Conclusions ................................................................................................. 69
Chapter 8: Survey of Consumers ......................................70
8.1 Introduction ................................................................................................. 70
8.2 Methodology ............................................................................................... 70
8.3 Results and Observations of the Survey...................................................... 71
8.4 Key Findings and Recommendations.......................................................... 82
8.5 Conclusions ................................................................................................. 84
viii

Chapter 9: Conclusions ......................................................85
9.1 Introduction ................................................................................................. 85
9.2 Summary of Achievements ......................................................................... 85
9.3 Recommendations for Future Work............................................................ 86
9.4 Final Conclusions........................................................................................ 87
List of References....................................................................88
Bibliography ............................................................................93
Appendix A – Project Specification....................................94
Appendix B – List of Computers of Manufacturing
Company #2 ......................................................................96
Appendix C – Survey questionnaire................................114
ix

List of Figures
Figure 2.1: Young et al. Manufacturing and the Environment (1997, Vol 13, No.7,
p.488).......................................................................................................................... 6
Figure 2.2: An investigator taking a soil sample along a riverside in Guiyu, China. 8
Figure 2.3: Copper laminate (left) and IC lead frames (right) collected for recycling.
.................................................................................................................................. 10
Figure 2.4: Operational flow chart of recycling (CH E-Recycling Pte Ltd, 2007). . 11
Figure 2.5: PGMs recovery and refining (Cimelia Resource Recovery Pte Ltd,
2007)......................................................................................................................... 12
Figure 2.6: Copper sand (left) and bricks (right) (CH E-Recycling Pte Ltd, 2007). 12
Figure 4.1: Singapore’s manmade offshore landfill - Semakau Landfill. ................ 18
Figure 4.2: Domestic market composition by market segment, 2003 – 2006 (IDA).
.................................................................................................................................. 19
Figure 4.3: Export market composition by market segment, 2003 – 2006 (IDA). .. 20
Figure 4.4: Home computer penetration in Singapore (IDA). ................................. 21
Figure 4.5: Number of computers at home (IDA).................................................... 22
Figure 4.6: Percentage of computer users (IDA). .................................................... 23
Figure 4.7: NEA’s representation of recycling rates by waste streams in 2005. ..... 28
Figure 5.1: Recycling bin for paper, plastic bottles and metal cans......................... 35
Figure 5.2: Recycling process of Centillion Environment & Recycling Limited,
2007.......................................................................................................................... 37
Figure 5.3: Chemical process of Centillion Environment & Recycling Limited,
2007.......................................................................................................................... 38
Figure 5.4: CRT recycling of Centillion Environment & Recycling Limited, 2007.
.................................................................................................................................. 39
Figure 5.5: Incinerator of Centillion Environment & Recycling Limited, 2007...... 40
Figure 8.1: The percentage of the different age groups of the respondents. ............ 72
Figure 8.2: The different job types of the respondents. ........................................... 73
Figure 8.3: The percentage of the presence of environmental policy in the
workplace. ................................................................................................................ 73
Figure 8.4: Percentage of policy that addressed electronic waste............................ 74
Figure 8.5: Source of awareness of electronic waste recycling. .............................. 75
x

Figure 8.6: Ways of dealing with unwanted electronic products. ............................ 76
Figure 8.7: Attitude of respondents towards buying of electronic products. ........... 77
Figure 8.8: Reasons for not recycling unwanted electronics. .................................. 78
Figure 8.9: Perception of recycling. ......................................................................... 79
Figure 8.10: Responsibility for the management of electronic waste. ..................... 80
Figure 8.11: The amount consumers are willing to pay to recycle an electronic
product...................................................................................................................... 81
Figure 8.12: Consumers’ willingness to be involved in recycling in the future. ..... 82
xi

List of Tables
Table 4.1: Singapore’s annual statistics, 2007. ........................................................ 18
Table 4.2: NEA’s solid waste management data for 2004, 2005 and 2006. ............ 26
Table 4.3: NEA’s representation of waste stream data for the year 2006................ 29
Table 7.1: The computers and printers used in the Production Department of
Manufacturing Company #1..................................................................................... 54
Table 7.2: The CRT and LCD monitors in the Production Department of
Manufacturing Company #1..................................................................................... 55
Table 7.3: The parts that were not in operation in the Production Department of
Manufacturing Company #1..................................................................................... 56
Table 7.4: The parts that were sent for recycling or dumped in the Production
Department of Manufacturing Company #1. ........................................................... 57
Table 7.5: The weight of different computer parts and printers............................... 58
Table 7.6: The computers and printers used in the Production Department of
Manufacturing Company #2..................................................................................... 61
Table 7.7: The parts that were not in operation in the Production Department of
Manufacturing Company #2..................................................................................... 62
Table 7.8: The parts that were sent for recycling or dumped in the Production
Department of Manufacturing Company #2. ........................................................... 63
Table 7.9: Employment Statistics for 2006.............................................................. 68
xii

Chapter 1: Introduction
1.1 Project Background
Electronics have become very much an integral part of our daily life. We are
increasingly engaged in using electronic products as technology advances rapidly.
We can expect the pace of innovations to get even faster. This in turn leads to a
shorter life span of electronic products as they become obsolete. As such, more
electronic wastes are generated in our industry and society. These wastes will only
add to the load on the incineration plants and landfills.
Unlike other rubbish, dumping electronic wastes in landfills poses a serious
environmental threat. Electronic products like computers and cell phones contain
toxins that can leak into the groundwater when buried. These harmful chemicals can
poison wildlife and pose a health threat to humans as well. It is therefore not a
viable solution. The best way to deal with all these concerns is to recycle electronic
wastes. Besides, there are many benefits about recycling of electronic wastes.
This research project aimed to understand the problem of recycling of used
electronics in Singapore and the related environmental concerns. In understanding
the local recycling of used electronics, available government data and recycling
companies’ information are reviewed. Analyses are done to critically assess current
Singaporean practice and actions are recommended for the future handling of the
issue. In an attempt to better understand the situation, observations are made on the
effectiveness and benefits of recycling electronic waste.
Specific problems areas, particularly the problems of collection, are identified and
subsequent opportunities for improvement are suggested. This included an attempt
to evaluate what proportion of used electronics is currently recycled. Going into a
wider scope in understanding the problem, information are researched on global
recycling of used electronics through reviewing published materials. This aimed to
1

find good systems that are used to address electronic wastes and relating them to the
local situation.
Case studies are done on manufacturing companies to understand the practices used
to manage used electronics. This included finding out the possible rate and
magnitude that could be generated in the company and in turn in the industries as a
whole. A survey of consumers is done to understand the attitudes and behaviours of
the consumers and to find out the barriers in the community in recycling of used
electronics. This included determining the extent to which they are involved now in
recycling or would be willing to be involved in the future.
1.2 Outline of the Report
This dissertation begins with a brief presentation of the project background in
Chapter 1. Chapter 2 reviews in detail the literature on the recycling of used
electronics. The growing problem and the harmful effects of electronic waste are
discussed. This included an understanding on the benefits of recycling of electronic
wastes as well. In Chapter 3, the goal and scope definition of the project is covered.
Chapter 4 understands the local situation, in particular the waste management and
the factors leading to used electronics generation. Subsequently, the collection of
used electronics and electronic waste recycling companies in Singapore are
observed and discussed in Chapter 5. Chapter 6 covers the management used in
dealing with electronic waste in other countries. This included relating good
systems to local situation.
In Chapter 7, the case studies are presented and discussed. This provides an
understanding of the practices made in the companies in handling used electronics
and the rate and magnitude of these wastes that could be generated in the company
and the industries. In Chapter 8, the results for the survey of consumers are
presented. Observations and discussions are made. This included recommendations
for improvements as well. Chapter 9 concludes the research project. Summary of
achievements are presented and recommendations for future work are made.
2

Chapter 2: Literature Review
2.1 Introduction
This chapter introduces the background of recycling of used electronics. The related
problems of electronic wastes are observed. This included an understanding of the
various difficulties faced in recycling of electronic wastes. This is followed by
observations made in other countries.
Subsequently, the various benefits of recycling of electronic waste are observed and
discussed. And finally, the key points are summarised.
2.2 Background of Recycling of Used Electronics
Discarded used electronics or electronic waste (commonly termed in short as e-
waste), are usually obsolete or irreparable electronic products. In the European
Commission, Directive 2002/96/EC Waste Electrical and Electronic Equipment
(WEEE), electrical and electronic equipment is considered as “equipment which is
dependent on electric current or electromagnetic fields in order to work properly,
and equipment for the generation, transfer and measurement of such currents and
fields” [WEEE Art.3 (a)].
They are data processing, telecommunications or entertainment products which are
used in private households or in businesses. These include cathode ray tube (CRT)
monitors and televisions, personal computers (PCs), cell phones, laptop computers,
printers, scanners, personal digital assistants (PDAs), digital cameras, MPEG-1
Audio Layer 3 (MP3) players, gaming consoles, etc. They contain toxic metals such
as lead, mercury, cadmium, chromium, zinc, nickel and beryllium, as well as
hazardous chemicals such as brominated flame retardant. Polluting polyvinyl
chloride (PVC) plastics are also commonly used to make these products.
3

Electronic products like desktop computers are commonly used in both companies
and at homes and they contain large amount of hazardous substances. The Straits
Times – Digital Life, Singapore (April 10, 2007) reported that a CRT monitor can
contain as much as 2 kg of lead. It was noted that high levels of lead exposure can
damage the vital organs, leading to coma or death from lead poisoning. Keyboards
which also have Printed Circuit Boards (PCBs) hence contain selenium, a bio-
accumulative toxin which can cause chemical pneumonia and tachycardia, a rapid
beating of the heart.
As for the Central Processing Unit (CPU), besides the large amount of PCBs in it,
parts like the switches and housing of the CPU, contains neurotoxin mercury which
attacks the central nervous systems and cause mental disturbances and
neuromuscular changes such as twitching and muscle weakness. In addition,
cadmium is also used in semi-conductors which affect the lungs and kidneys.
Electronic products like computers contain so much hazardous materials that even a
mouse’s plastic casing contains poly-brominated flame retardants which are a
persistent organic pollutant that can disrupt thyroid function.
As observed, electronic products of all kinds do contain a lot of hazardous
substances and chemicals. It was noted that these substances and chemicals can be
very harmful to humans, likewise to the wildlife, if the toxins escape into the
environment. It is therefore important that electronic products are properly managed
and safe disposals are carried out when products reached its end of life.
Electronic waste consists of large amount of plastics and metals which are non-
biodegradable. If buried in landfills, the toxins will leach into the environment.
Similarly, if they are sent to the incineration plants, they produce noxious gases
when burnt. It was observed that in both situations, they pollute the environment
and pose serious health threats to humans and also harm the wildlife. In December
2006, the UOB Kay Hian Research Pte Ltd estimated 70 % of the heavy metals
found in landfills come from electronic waste.
These further emphasised the need to dispose electronic products in a safe way and
the only method to do it is to recycle. In Singapore, The Waste Minimisation Unit,
4

now known as the Waste Minimisation Section under National Environment
Agency (NEA), was set up in February 1992 to promote recycling and lead waste
minimisation. NEA’s Waste Minimisation Section encourages the public to follow
waste management practice by the 3Rs, Reduce, Reuse and Recycle.
As observed, recycling is especially important for electronic waste and therefore
more efforts will be needed to ensure that these wastes are properly collected and
safely processed. In recent years, Singapore saw a rise in the number of electronic
waste recycling companies. For instance, local company CH E-Recycling (CHE)
Pte Ltd (www.che.com.sg), established in March 2005 has grown and even acquired
International Organization for Standardization (ISO) certifications, namely ISO
9001 and ISO 14001. They collect unwanted electronics from both consumers and
companies.
Although recycling services are available in quite a number of avenues, not many
among the consumers are aware and collection of used electronics proved to be
difficult. Recycling company CHE reported in The Straits Times – Digital Life,
Singapore (April 10, 2007) that most of the materials collected comes from
electronics manufacturers. In the same article, it was reported that consumers in
Singapore are found to be unaware of the various green disposal avenues available
to them. As observed, this would certainly be the main barrier to achieve high
recycling outcome for electronic waste.
Campaign is a good way to raise awareness and to collect used electronics for
recycling. In 2007, Hewlett Packard (HP) (www.hp.com) organised a campaign in
Singapore to mark Earth Day and gave vouchers in exchange for selected models
brought in for recycling. The campaign not only promotes electronic waste
recycling but also helps aware the public that electronics harm the environment if
they are not safely disposed. However, it was noted that the general response from
consumers to recycle electronic waste remains weak. As the lifespan of these
products get shorter, more electronic waste would be generated in the society and
industry. As observed, the environmental effects of electronic waste cannot be
ignored and the only solution to the problem is to recycle them. The various
5

problem areas should be identified and subsequently addressed so as to achieve a
high recycling outcome for electronic waste.
As observed, electronic wastes have a link with the government, the manufacturers
and the consumers such that each group has responsibilities and a role to play to
cope with the related problems. Efforts from the recycling companies are certainly
crucial to achieve high environmental outcome for electronic waste. Figure 2.1
shows the model used by Young et al. (cited in Askiner and Surendra 1998) to
illustrate the interactions among the different groups who are responsible for
environmental concerns. From the model, it was observed of how one group can
affect the other and this understanding is important in order to achieve good
cooperation to effectively deal with electronic waste problems.
Figure 2.1: Young et al. Manufacturing and the Environment (1997, Vol 13, No.7, p.488).
2.3 Electronic Waste in Other Countries
Electronic waste is a growing problem and this is not only happening in Singapore
but in other countries as well. In the United States (US), electronic wastes are the
fastest growing portion of the waste stream due to the growing sales and rapid 6

obsolescence of electronic products. In the year 2004 to 2005, it had grown by
almost 8 % even when the overall municipal waste stream volume is declining,
according to the Environmental Protection Agency (EPA), US. The EPA also
estimates that 2.63 million tons of electronic wastes are generated in the US in the
year 2005. Of this quantity, only 12.5 % was collected for recycling and the
remaining 87.5 % went to landfills and incinerators. It was noted that these figures
have yet to include the millions of stockpiled televisions, PCs, monitors, etc, which
are stored in basements, garages and closets awaiting decisions by the owners.
In fact, technology company Hewlett-Packard (HP) carried out a research in 2005
and found that nearly three out of four American consumers have used or unwanted
electronics in their homes which they do not know how to dispose of. On the other
hand, environmental organisation, Earth 911 (earth911.org), estimates that United
States (US) will need to dispose, in 2007, 500 million obsolete computers that are
stored over the years. It was noted that collecting of used electronics can be very
difficult when there is little awareness among the consumers.
In Australia, electronic waste is also growing fast and it is more than three times
faster than general municipal waste according to the Australian Bureau of Statistics
(ABS), 2006. This is due to the fact that Australians are some of the highest users of
new technology internationally. Over 2.4 million PCs and more than 1 million
televisions are bought annually. ABS reported in the same year, in 2006, that
Australia is one of the top ten countries using information and communication
technology. It was ranked tenth in the world for spending per capital and fifth in the
world for spending as a percentage of gross domestic product. As observed, it is
therefore inevitable that electronic waste in high technology countries, like United
States (US) and Australia, is one of the fastest growing waste types.
As electronic waste grows, it is important that they are well managed and safely
processed. In United States (US), the Computer TakeBack Campaign (CTBC), US,
estimates that the 12 % of electronic wastes that are recycled in US are handled by
most firms which do not operate under strict controls and they acted irresponsibly.
Only valuable metals are removed from the wastes and the remaining scraps are
sent to incinerators and landfills. It was of concern to know that workers
7

dismantling these wastes are inadequately protected from harmful chemical
compounds which posed very negative health effects.
It has been reported that many recyclers are exploiting cheap labour by sending
electronic waste to developing countries like China, India and Pakistan for
disassembly and processing. The Basel Action Network and Silicon Valley Toxics
Coalition (cited by Marta and David 2006) estimated in a report in 2002 that as
much as 50 % to 80 % of the electronic waste collected for recycling in the west of
the United States was shipped to China. These wastes are being handled under
horrific conditions that harmed the workers, the people and the environment. In
Guiyu, China, the unwanted parts are thrown into former irrigation ditches, massive
amounts are dumped along river ways and scraps are burned in open fires. Figure
2.2 shows an investigator of Basel Action Network taking a soil sample along a
riverside in Guiyu, China, where loads of electronic wastes are dumped.
Figure 2.2: An investigator taking a soil sample along a riverside in Guiyu, China.
As can be seen, shipping electronic wastes overseas will not be a solution if the
wastes are not properly processed in an environmentally sound manner. It is
certainly incorrect to pass the problem onto another country and in most cases the
poorer countries were at a disadvantage. It is also a serious concern that the workers
are harmed as improper protection was provided.
8

CTBC also list the prison systems of the US as one of the problems of improper
handling of electronic wastes. The prisons are involved in electronics recycling
operations and there were inmate labourers who worked without much health and
safety protections. In recent years, complaints had brought these hidden sweatshops
into public view. As there were no proper recycling procedures, captive labourers
and staff supervisors were at a high risk of injuries. In 2005, Bureau of Prisons
(BOP) admitted in a report that prisoners and staffs in at least three recycling
factories were exposed to toxics.
As observed, there are indications of improper handling of electronic wastes in
different parts of the world. The improper processing harmed the workers and
subsequently the environment and the people. It is both important that safe
processing and safe disposal are carried out when dealing with electronic waste.
This applies the same to Singapore.
Electronic waste is difficult to manage due to its large volume and the cost of
managing it is always a concern for the governments, manufacturers and consumers.
CTBC noted that in the United States (US), public policy has failed to effectively
address the problems of electronic waste and many brand owners and manufacturers
in US are dodging responsibilities to manage their products after useful life. As a
result, the costs are passed onto taxpayers who are paying greatly to clean up the
wastes.
As observed, the cost of managing electronic waste should be properly addressed,
not only to avoid incurring a higher amount for cleaning up but more importantly to
effectively solve the problem. On the whole, it was observed that electronic waste
can be problematic and damaging. It is an important issue and should be properly
managed in all countries, including Singapore. This meant to collect and safely
recycle electronics to protect the environment.
9

2.4 The Benefits of Recycling
There are a few green ways to handle used electronics. They could be to upgrade,
refurbish, reuse and donate. If all options are not viable, it should be sent to recycle.
In fact, electronic wastes should be properly collected from different sources and
sent for recycling. Recycling of electronic waste is beneficial to the environment as
it helps to protect the environment from the toxins of the wastes as well as it saves
resources from depleting.
The recovery process is so good that precious metals like platinum, gold and silver
can be recovered! The Straits Times – Digital Life, Singapore (April 10, 2007),
reported that Nokia found that more than 90 % of a cell phone can be recycled. In
the course of the process, precious metals such as gold and platinum group of
metals (PGMs) can be extracted from the cell phone as well. This great benefit is
another encouraging reason to recycle electronic wastes. In fact, it has also helped
recycling companies to profit in the process.
The electronic wastes collected in the factories of recycling companies include
Integrated Circuit (IC) lead frames, copper laminates, Printed Circuit Boards
(PCBs), PCB trimmings, electronic components, computers, printers, laptops, cell
phones, televisions, etc. These consist of both consumers’ waste and electronic
waste generated by electronics companies in the course of their manufacturing
process. Figure 2.3 shows the copper laminates and IC lead frames that are
collected for recycling. The wide arrays of wastes collected are subsequently sent
for processing.
Figure 2.3: Copper laminate (left) and IC lead frames (right) collected for recycling.
10

Figure 2.4 shows a typical operational flow chart of an electronic waste recycling
company. At the factory, electronic products like computers and monitors are first
tested for their functionality. Options for repairing and refurbishing for reuse are
considered as they can be redistributed or donated to charitable organisations. If
they are beyond repair, they will be sent accordingly for dismantling, de-soldering
and segregation into different categories of products or materials for processing. It
was noted that as a usual practice, proprietary technological products are sent for
direct destruction.
Figure 2.4: Operational flow chart of recycling (CH E-Recycling Pte Ltd, 2007).
Electronic waste recycling uses filtration systems and chemical processes. Precious
metals, platinum group of metals (PGMs) and base metals can be recovered in the
process and they are separated accordingly. Precious metals that can be recovered
include platinum, palladium, gold, silver, copper, aluminium as well as other rare
metals. Processed metals are further refined and subsequently sent to smelting 11

plants. PGMs requires further refining to be converted into by-products, such as
gold potassium cyanide, platinum and palladium targets and salts, which are sold
for reuse by the electronics industry. Figure 2.5 shows PGMs recovery and refining
at Cimelia Resource Recovery Pte Ltd.
Figure 2.5: PGMs recovery and refining (Cimelia Resource Recovery Pte Ltd, 2007).
As part of the recycling process, plastics from the cases of hardware are fed into
plastic recyclers. These plastics are shredded into pellets and sent to plastic
moulders. In general, electronic waste recycling includes cathode ray tubes,
assorted plastics, copper recovery, ferrous and non-ferrous metals. As CRTs in
monitors and television are leaded glass, a hazardous material, it needs to be
processed differently with special equipment. Recycling companies are able to
optimise granulated fibre and construction materials like bricks can be produced.
Figure 2.6 shows copper sand and bricks which are some of the materials produced.
Figure 2.6: Copper sand (left) and bricks (right) (CH E-Recycling Pte Ltd, 2007).
These days, electronic waste recycling companies engage technologies and
automations to carry out the recycling processes. Besides being efficient and
12

effective, this has helped to minimise workers’ exposure to hazardous substances.
Nevertheless, care should be taken at all times and personal protection is necessary
while handling these materials.
As observed, there are many benefits about electronic waste recycling. It protects
the environment, saves resources in which precious materials can also be recovered
and useful products can be produced. In fact, LEADOUT (cited in Marta and David
2006) reported that by using recycled materials it can saves as much as 60 % to 80
% of the energy used to produce the same virgin materials. It was also estimated
that recycling of electronic waste would make it possible to save approximately 2.8
million tons of oil equivalent per year.
2.5 Summary
Electronic waste is easily generated as people increasingly use electronic and
electrical equipment. Land filling them is not viable as they contain toxins that will
leach into the environment when buried. Incinerating them will produce poisonous
gases that pollute the air. Therefore, it is critical that these wastes are recycled.
There are various indications of electronic waste problems around the world and
they can be very damaging. Electronic waste is growing and therefore good waste
management is important to address the related concerns. This would require the
cooperation of the government, the manufacturers, the consumers and the recyclers
to effectively deal with the problems.
Electronic wastes are very hazardous and have to be handled with care even during
the course of recycling. Recycling electronic waste helps to protect the environment
as well as saves large amount of resources. On the whole, recycling of electronic
waste is certainly beneficial to all if carried out properly.
13

Chapter 3: Methodology
3.1 Introduction
In understanding the various problems of recycling of used electronics in Singapore,
research was done by reviewing available government and related companies
information. In an attempt to further understand the problem, case studies and a
survey were done. This helped to understand the industries’ workplace
environmental policies and also the consumers which in turn were useful to assess
the current practice and subsequent recommendations for improvements.
3.2 Goal Definition
The goal definition of this particular project is to identify specific problem areas of
recycling of used electronics in Singapore and understand the related environmental
concerns. The results of the case studies and survey are to be used for identifying
opportunities for improving current Singaporean practice at a community level for
future handling of the issue. This included recommending good systems found in
other countries as well.
3.3 Scope Definition
The method of research done to gain an understanding of the local situation was
through reviewing of available government information and statistical data.
Statistical data represents better and is useful for analysis. Area of research included
the related Singapore’s authorities and the major ones that were used in this
dissertation included the Ministry of the Environment and Water Resources, The
National Environmental Agency (NEA), Infocomm Development Authority of
Singapore (IDA), Statistics Singapore and Ministry of Manpower of Singapore
(MOM). Although, specific data on electronic wastes were not available by the 14

government, these few authorities have helped to establish an understanding of the
related concerns.
Research was also done on local recycling companies through reviewing
information available on the companies’ website and also from published articles on
the local newspapers. Major research done was on local electronic waste recycling
company Centillion Environment & Recycling Limited. Similarly, information
available by the recycling companies in Singapore was limited and there were no
specific data of the amount of electronic waste that were collected and processed or
incinerated. This proved difficult to accurately assess the situation to evaluate the
proportion of used electronics that are currently recycled.
In addition to studying the situation in Singapore, the area of research was extended
globally to the United States, Australia, Europe and Japan. This aimed to find good
systems that are used in other countries to deal with electronic waste problems and
to relate these systems to local situation.
The case studies were done to understand how companies in the local industry
managed their used electronic products. 2 manufacturing companies in the
electronics sector were studied. Although the understanding was aimed at electronic
products in general but in these 2 case studies only computers and printers were
considered. The scope was shrunk due to time and accessibility reasons. On the
other hand, instead of the whole company, only a department was studied in each
case. This was because the two companies are generally large and access to
information was difficult and time consuming.
In an attempt to better understand the problem of electronic waste recycling, a
survey of consumers was conducted in Singapore. This was to find out their
attitudes and behaviour and also included an understanding of workplace
environmental policies in Singapore. As surveying of industry people proved time
consuming and difficult, the scope was focused mainly on consumers in the
community. The work involved preparing a well structured set of questions to ask
for the various targeted area of understanding. The survey also aimed to determine
the extent to which consumers are involved now in recycling and would be willing
15

to be involved in the future. The initial target was to achieve about 100 responses
but was later lowered due to time constraint and 75 responses were successfully
received for analysis.
3.4 Assumptions Used in Case Studies
In the case studies, various assumptions were used mainly because specified data
were not available to analyse the company as a whole. Data collection was based
only on a department and only computers and printers were considered. The
different stages of obsolesce of electronic products in the companies also posed a
difficulty in understanding the situation as data for a limited period of time was
collected.
16

Chapter 4: Singapore’s Recycling
4.1 Introduction This chapter introduces and understands the situation in Singapore and the related
issues that stress the importance of recycling in the country. The consumption of
electronic products in the domestic and export market are observed. Other related
factors leading to the generation of used electronics in the country are also
discussed. Finally, studies are made on the waste management data and the related
recycling rates.
As there is little amount of government information available, particularly on
electronic products and wastes, some broad data are used to understand the situation
and identify the problems and subsequent areas of improvement.
4.2 Singapore’s Situation Singapore is a city state with limited land space. The total land area is only 704.0
square kilometres and the total population in 2007 is 4.6806 million. This makes
Singapore the second most densely populated country in the world after Monaco.
Singapore’s population density per square kilometres is 6,369. As a land scarce
country with such a high population, management of land use is very crucial to stay
sustainable in the long term. Hence, land allocation for landfills is also very costly
to the country and its people.
The last landfill on the mainland at Lorong Halus is closed in April 1999. Semakau
Landfill, shown in figure 4.1, was developed to meet Singapore's need. It is a
manmade offshore landfill which cost S$610 million. The ground covers an area of
350 hectares and has a capacity of 63 million cubic metres. It was projected in 2006
by the National Environment Agency of Singapore (NEA) to have a remaining
lifespan of 35 to 40 years. This was not surprising considering the high population
and the volume of waste that will be generated increasingly over the years.
17

Figure 4.1: Singapore’s manmade offshore landfill - Semakau Landfill.
Taking into account that the current annual population growth which is at 4.4 % and
the high literacy rate of the population, it was expected that more people will be
engaged in using electronic products in their daily life. This would certainly lead to
the increase in the volume of used electronics. As the world gets more
interconnected, there will be an increasing need to engage in telecommunication
services. This will inevitably brought about the generation of used
telecommunication devices. One such major contributor to used electronics is the
cell phone. The number of mobile phone subscribers per 1,000 population in
Singapore is an amazing 1,034. If this relates to the same number of cell phones, it
will be a disturbing sign as the life span of cell phone is relatively short compared to
other electronic products. It can be seen how the various factors add to the
importance of waste management in Singapore. The mentioned statistics are
summarised in table 4.1.
Statistics 2007 Total population (‘000) 4,680.6 Annual population growth (%) 4.4 Land area (sq km) (For year 2006)
704.0
Population Density per sq km (For year 2006)
6,369
Literacy rate (%) (among residents aged 15 yrs & over)
95.4
Mobile phone subscribers per 1,000 population 1,034 (Source: Statistics Singapore, 2007)
Table 4.1: Singapore’s annual statistics, 2007.
18

4.3 Factors Leading to Used Electronics Generation Singapore’s manufacturing sector accounts for 20 % to 25 % of the country’s
economy. The manufacturing sector consists of Electronics, Chemicals, Precision
Engineering, Transport Engineering, General Manufacturing and Biomedical
Manufacturing. Among these industries, Electronics contributes the single largest
portion to the total industrial output. In 2005, it was a huge 35.8 %.
The following figure 4.2 is a chart by the Infocomm Development Authority of
Singapore (IDA). It shows the domestic revenue and the different market segments
from 2003 to 2006. IDA’s goal is to “cultivate a vibrant and competitive infocomm
industry in Singapore” and it oversees the infocomm technology development,
deployment and usage. IDA’s hardware segment products include computers,
printers, cell phones, modems, digital entertainment products, personal
communication accessories, mobile enhancement products, wireless networking
products, etc.
(Annual Survey on Infocomm Industry for 2006, IDA 2007, p.6)
Figure 4.2: Domestic market composition by market segment, 2003 – 2006 (IDA).
In 2006, the overall domestic market grew by 3.9 % but the hardware segment
contribution saw a fall of 4 %. The revenue of the hardware segment is S$4.59
19

billion for 2005 and S$4.11 billion for 2006. This actual decrement in revenue
could mean that less hardware were sold in 2006. The difficulty here in
understanding the amount of products that were being consumed domestically is
that a fall in revenue does not necessarily corresponds to a fall in quantity and a fall
in quantity does not necessarily corresponds to a fall in mass. This is due to
different profit margins, costs and physical attributes of electronic products.
However, the overall growth of the domestic market indicates the activeness in the
industry. This might lead to more purchases of hardware for new setups or for
renewal purposes.
Assuming the short lifespan of these products to be 2 years, estimation could be
made that a large portion of the 29 % of the hardware segment sold in 2005 will see
a need to be disposed in 2007. On the other hand, it meant that in 2007, there might
be a rise in demand in the hardware segment. This has lead to a pattern of rise and
fall in demand being seen in the hardware segment, in figure 4.2, that a rise occurs
in alternate years, in 2003 and 2005, and therefore a fall occurs in 2004 and 2006.
(Annual Survey on Infocomm Industry for 2006, IDA 2007, p.6)
Figure 4.3: Export market composition by market segment, 2003 – 2006 (IDA).
In the above figure 4.3, the total export revenue of the infocomm industry is studied.
This is intended to gain some understanding of the relative potential amount of
industrial electronic waste that could be generated during the manufacturing process. 20

The export revenue has increased by 31.4 % in 2006 to reach S$28.98 billion from
S$22.06 billion in 2005. This growth was largely driven by the hardware segment,
which is observed to be the biggest contributor to the annual infocomm export
revenue since 2003. This expanding export in the hardware segment signifies the
potential increase in electronic wastes in the industry. Proper waste management
should be in place to take care of the wastes generated by the manufacturers in the
factories.
In the next portion of this section, the number of computers was gauged in the
households and the percentage of computer users for different age groups were
observed. This is to better understand the usage behaviour and the extent of usage
of computers among the resident population in Singapore. This information could
then be used as a guide to estimate the amount of used computers that will be
generated as a result. These used computers will eventually add onto the bulk of
electronic wastes. Annual surveys were done by IDA in Singapore. In 2006, the
data collection was done via face-to-face interviews conducted from October to
November. A total of 2,500 households and 2,810 individuals were interviewed.
(2006 Annual Survey on Infocomm Usage in Households and by Individuals, IDA 2007, p.2)
Figure 4.4: Home computer penetration in Singapore (IDA).
Figure 4.4 above shows the home computer penetration in Singapore. From the
survey, an estimated 78 % of the total households in Singapore had at least one
21

computer (desktop/laptop) at home in 2006. This is a 4 % increase from 2005 after
staying stagnant at 74 % for 3 years since 2003. Looking at the results over the
years, it is definite that the penetration rate will continue to rise, therefore indicating
an increased engagement in technological products.
The following figure 4.5 shows the results of the survey for the number of
computers in the households in Singapore. The chart shows a representation of 3
different categories, ‘no computers’, ‘1 computer’ and ‘2 or more computers’. As
for households with 2 or more computers, there was an increase by 10 percentage
points from 28 % in 2005 to 38 % in 2006. It is noted that the percentage of
households with 2 or more computers were increasing since year 2000 and the
largest annual increment was in 2006.
(2006 Annual Survey on Infocomm Usage in Households and by Individuals, IDA 2007, p.3)
Figure 4.5: Number of computers at home (IDA).
These days, a computer acts as a ‘main brain’ for almost all personal electronic
products ranging from MP3 players to sophisticated pocket PCs. Once an electronic
device is linked up, a computer can be used for data storing, viewing, downloading,
transferring, printing and editing. From this understanding, it is expected that an
increase in computers in the households will most likely indicate an increase in
other electronic products and computer peripherals that will eventually see more
used electronics originating from the domestic over the years.
22

Next, the percentages of computer users for different age group were identified in
figure 4.6. There were 4 different age groups used in 2006. They were ‘10 to 14
years’, ‘15 to 59 years’, ‘60 years and above’ and lastly ‘15 years and above’ which
were represented in all other years as well. It is deduced from the survey that
computer usage is more common among the young. 85 % of the population aged 10
to 14 years is computer users, compared to 68 % for the 15 to 59 years age group
and 28% for the 60 years and above age group. This is because computers are used
in schools in modern education for students starting at a young age. On the whole,
the proportion of computer users aged 15 years and above remained at 65 % in 2006.
This figure will bound to increase as the years passed by based on the high
percentage of young computer users.
(2006 Annual Survey on Infocomm Usage in Households and by Individuals, IDA 2007, p.5)
Figure 4.6: Percentage of computer users (IDA).
A point of concern here is that elderly computer users might face a difficulty in
recycling when their computers have reached its end-of-life and needed to be
disposed. Various possible barriers to recycling could be the physical ability of the
elderly to move the heavy parts, the accessibility and the cost of recycling services.
If recycling proves difficult, the unwanted computers were usually left unattended
or stored at home. As seen, a rather significant 28 % among the elderly population,
60 years and above, are computer users. To achieve satisfactory waste management,
concerns for the elderly should be addressed in all areas.
23

4.4 Waste Management The total amount of waste being disposed in Singapore had increased at an alarming
rate over the past 30 years. NEA categorised waste disposed as the sum of the total
waste incinerated and the total waste land-filled. Back in 1970, it was 1,300 tons a
day but by the year 2000, it had already gone up to 7,600 tons a day (Ministry of the
Environment and Water Resources). Finally, successful results of waste
management were seen in 2004 when the amount being disposed in a day fell to
6,795 tons (Ministry of the Environment and Water Resources). Even at this rate,
NEA estimates that a new incineration plant would be needed in every 5 to 7 years.
In addition, a 350 hectare landfill would be required in every 25 to 30 years.
Some calculations were made to understand the rate and comparisons were made to
the population growth. Due to limited available data, the amount being disposed in
a day in 2000 to 2003 is assumed to be constant at 7,600 tons, 0 % increment.
The overall increase in the amount being disposed in a day (1970 to 2003):
62.4841001300
13007600=×⎟
⎠⎞
⎜⎝⎛ − % increase over 33 years
From Statistics Singapore, the population in 1970 is 2.0745 million and the
population in 2003 is 4.1861 million.
The overall increase in population (1970 to 2003):
79.1011000745.2
0745.21861.4=×⎟
⎠⎞
⎜⎝⎛ − % increase over 33 years
15.21001100
10079.10133 =×⎟⎟
⎠
⎞⎜⎜⎝
⎛−
+ % increment in a year
By comparison, it is observed that from 1970 to 2003, the overall increase in
percentage in the amount being disposed in a day, 484.62 %, were far much higher
than the overall increase in percentage in the population, 101.79 %. This indicates
that there is a high possibility that the overall amount of waste disposed can be
24

reduced further, much more than the amount achieved in 2004. It is also noted that
the annual average percentage increase in population is much lower than the current
growth rate from 2006 to 2007, which is 4.4 %. This is a worrying prospect for the
country if waste management is unable to effectively reduce the amount of waste
disposed at a higher rate of population growth.
Table 4.2 shows NEA’s solid waste management over the past 3 years from 2004 to
2006. Firstly, the total waste generated is understood to be the sum of the total
waste recycled, total waste incinerated and total waste land-filled (as defined in
point 1 of table 4.2). Secondly, as in the earlier portion of this section, waste
disposed is categorised as the sum of the total waste incinerated and the total waste
land-filled. Some calculations were made to understand these 2 terms.
Total waste generated in 2006:
2.66 (total waste recycled) + 2.33 (total waste incinerated)
+ 0.23 (total waste land-filled) = 5.22 million tons
Total waste disposed in 2004:
1.41 (total domestic waste disposed)
+ 1.07 (total non-domestic waste disposed) = 2.48 million tons
is equal to:
2.26 (total waste incinerated)
+ 0.22 (total waste land-filled) = 2.48 million tons
Total waste disposed in 2004 in a day:
6795365
1048.2 6
=× tons (as stated in the earlier portion of this section)
From table 4.2, it is observed that the total non-domestic waste disposed had
increased from 1.07 million tons in 2004 to 1.13 million tons in 2005. However, this
figure dropped in 2006 to 1.10 million tons. Looking at the total domestic waste
disposed, the figure had stayed constant at 1.41 million tons in 2005 but rose to 1.46
million tons in 2006. The total waste disposed for both domestic and non-domestic
had actually increased over the 3 years from 2.48 million tons in 2004 to 2.54
25

million tons in 2005 (2.42 % increase) and finally to 2.56 million tons in 2006 (0.79
% increase). This is a relatively small increase comparing with the total amount of
waste generated. However, it is discouraging as it is not long after some results
were seen in 2004 before the amount starts increasing again. This is not a good
indication of the waste management and it meant more should be done to lessen the
amount of waste incinerated and land-filled.
(Key Environmental Statistics 2007, Ministry of the Environment and Water Resources 2007, p.6)
Table 4.2: NEA’s solid waste management data for 2004, 2005 and 2006.
A more appropriate way to analyse waste management here is to use percentage
base on the overall waste generated for comparisons over the years. The actual
weight is useful in understanding the volume that goes to the incineration plants and 26

landfill such that concerns like the sustainability of these facilities could be
analysed. In 2005, the total waste incinerated has dropped from 47 % in 2004 to 45
%. In contrast, the actual physical weight of the total waste incinerated has actually
grown from 2.26 million tons in 2004 to 2.27 million tons in 2005. This is due to
the total waste generated that saw a rise over the years. The percentage of total
waste incinerated stood stagnant at 45 % in 2006. Again, the actual physical weight
is noted to have increased to 2.33 million tons.
The total waste generated has increased from 4.79 million tons in 2004 to 5.01
million tons in 2005, a 4.6 % increase. In 2006, the figure has gone up by 4.2 % to
5.22 million tons. These percentage increases are very much in line with the 4.4 %
population growth which indicates a rather acceptable amount of waste generation.
Another factor to be concerned with is the total waste land-filled. The total waste
land-filled has increased from 0.22 million tons in 2004 to 0.27 million tons in 2005.
A positive result is seen in 2006 when the figure fell to 0.23 million tons. This
meant that the projected life span of the landfill could be prolonged if wastes are
properly managed. Wastes that are land-filled consist of construction and
demolition waste, used slag and treated sludge but exclude incineration ash
generated from waste disposed through incineration (as defined in point 2 of table
4.2).
The ultimate focus of waste management is the total amount of waste recycled. The
amount of waste recycled will in turn affect the amount of waste incinerated and
land-filled. The essential process of recycling that forms the overall recycling rate
differentiates good waste management from bad ones. In 2004, the overall recycling
rate was 48 %. It has increased by 3 percentage points to 51 % in 2006. This is a
positive outcome. Although results were seen, it was felt that the situation is still not
considered comfortable. New estimates by NEA in 2007 still reflect the need for
additional incineration plants, only to be reduced from one in every 5 to 7 years to
one in every 7 to 10 years. If the total waste land-filled continues to fall at the rate
14.8 %, seen in 2005 to 2006, the projected life span of Semakau Landfill will be
increased from 25 - 30 years to 35 - 40 years, an approximated extension of 10
years.
27

In figure 4.7, the different waste streams and the amount recycled in 2005 are
shown on a chart. It is noted that an individual category for electronic waste is not
available here. As observed in the earlier chapters, the compositions of electronic
wastes are mainly metal, plastic and glass. Therefore, attention was placed on these
3 types of material so as to achieve an assumption of what amount of electronic
waste was recycled.
(The Singapore Green Plan 2012, Ministry of the Environment and Water Resources 2006, p.43)
Figure 4.7: NEA’s representation of recycling rates by waste streams in 2005.
As observed from figure 4.7, there are 2 categories of metal that are represented on
the chart. They are ferrous metal and non-ferrous metal. The overall amount of
ferrous metal that was recycled in 2005 is very high. This is the same case for non-
ferrous metal. However, the overall amount of plastic and glass that were recycled
in the same year is significantly small.
In another representation by NEA, for 2006, the recycling rates by waste streams
were put up on a table in table 4.3. The recycling rates for the different waste
streams were placed in descending order. These different waste streams make up
28
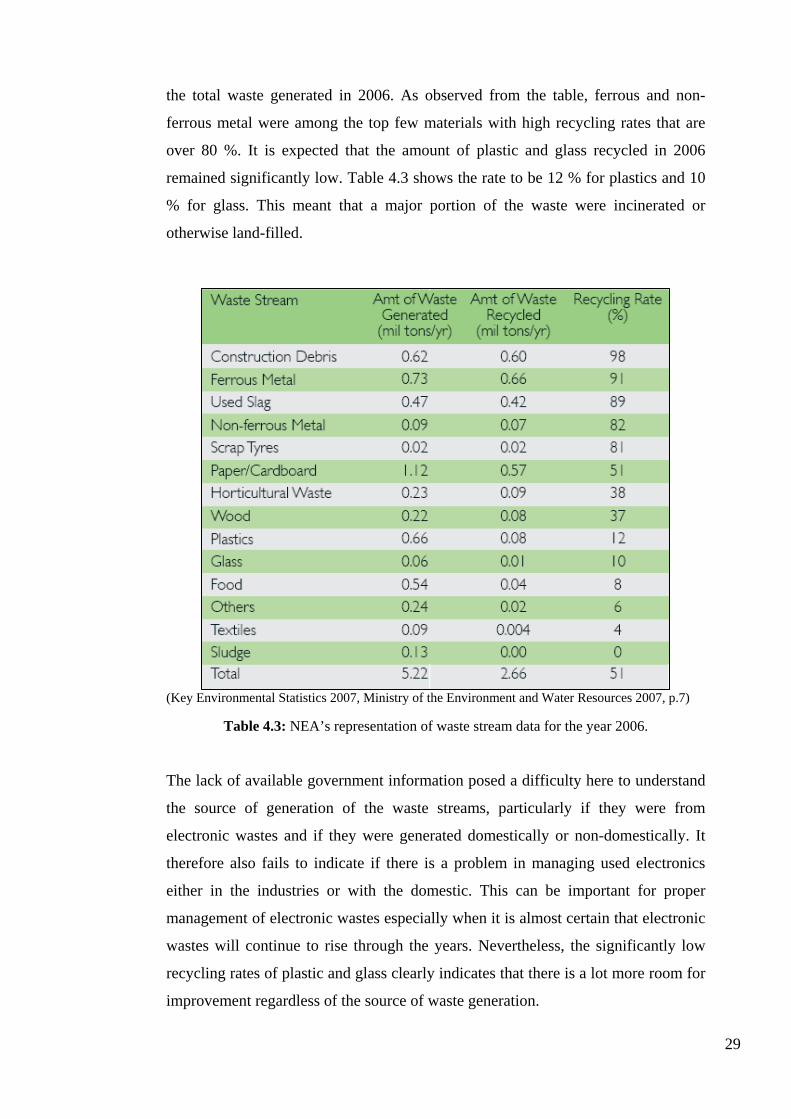
the total waste generated in 2006. As observed from the table, ferrous and non-
ferrous metal were among the top few materials with high recycling rates that are
over 80 %. It is expected that the amount of plastic and glass recycled in 2006
remained significantly low. Table 4.3 shows the rate to be 12 % for plastics and 10
% for glass. This meant that a major portion of the waste were incinerated or
otherwise land-filled.
(Key Environmental Statistics 2007, Ministry of the Environment and Water Resources 2007, p.7)
Table 4.3: NEA’s representation of waste stream data for the year 2006.
The lack of available government information posed a difficulty here to understand
the source of generation of the waste streams, particularly if they were from
electronic wastes and if they were generated domestically or non-domestically. It
therefore also fails to indicate if there is a problem in managing used electronics
either in the industries or with the domestic. This can be important for proper
management of electronic wastes especially when it is almost certain that electronic
wastes will continue to rise through the years. Nevertheless, the significantly low
recycling rates of plastic and glass clearly indicates that there is a lot more room for
improvement regardless of the source of waste generation.
29

Another concern regarding good waste management is the controlling of the
possibility of exportation of used electronics. In 2003, Singapore’s neighbour,
Indonesia banned the import of used electrical and electronic products to protect
their local industry and their environment. This has caused a fall in businesses in
Singapore for the used electronic goods dealers as shipping to a further poor
country in the region might not be as profitable. Although business opportunities
through exportation are limited, it does not mean that export of used electronic
products is forbidden in Singapore.
4.5 Conclusions
Various factors are pointing to the inevitable increase in electronic wastes in the
industry and society as Singapore progresses with the world. Singapore’s constraint
of a densely populated, highly urbanised city with limited land space makes proper
waste management an imperative. More importantly, electronic wastes are harmful
and they require proper disposal.
Although there is a good representation of recycling rates for different waste
streams but there is not any tabulated figure for electronic wastes with the
government. This might meant a lack of emphasis in NEA and likewise for the
community. In a world that the importance of recycling of electronic wastes is
gaining awareness, a separate set of data for electronic wastes should be available
with NEA for monitoring the management in Singapore. This would be useful to
effectively deal with concerns of electronic wastes ranging from possible
exportation to assisting the elderly properly dispose their unwanted electronic
products.
30

Chapter 5: The Process of Recycling in Singapore
5.1 Introduction
This chapter understands the collection of used electronics in the country and the
related problems are identified and discussed. This included an understanding on
the current extent of involvement by the government, the manufacturers and the
recycling companies.
Electronic waste recycling companies and their recycling processes are observed
and discussed. This generally provides an understanding on the technologies used
and the effectiveness of the processes. And finally, conclusions are made of the
current situation and subsequent recommendations for improvements are also
suggested.
5.2 The Collection of Used Electronics
The generation of electronic wastes can be from all sources in the country. This
meant that not only companies in the electronics sector but all other companies
including those in the industrial areas, in the business districts and even those in the
neighbourhoods are possible generators of electronic wastes. It was noted that
internet cafes which are increasingly common in neighbourhoods are capable of
generating large amount of waste computers.
Besides generation from companies, electronic waste also comes from organisations
like hospitals, institutions, as well as charities. These basically include medical
equipment, computers and non-working electronic products that were donated to the
charities. In addition, households are a large source of electronic wastes as a wide
range of electrical and electronic equipment is use by the residents. It is therefore
important that all sources of electronic wastes are properly disposed and collected
for recycling.
31

Companies that require disposal of electronic products can either send them to the
recycling companies or request for collections. There is a list of electronic waste
recycling companies available on National Environment Agency’s (NEA) website
and these companies accept a wide range of electronic products. Among the 8
companies listed, 3 indicated that they provide collection services and 1 stated that
their company does it on contractual basis. It was observed that the number of
recycling companies in Singapore is not a lot and only half of these companies
provide collection services. Moreover, those that do collect electronic waste only
provide their services for commercial and industrial areas and fees are charged
accordingly. On the whole, based on the circumstances, it was observed that the
responsibility in ensuring proper disposals of electronic waste lies mainly on the
companies and the various organisations.
On the other hand, residents as consumers can contact the Town Council for
removal services of bulky electrical and electronic items from their households.
There is also a list available on NEA’s website that the residents may contact for
their unwanted electronic products to be collected for reuse or recycling through
various companies. There are a total of 19 companies listed. It was noted that these
are not recycling companies but rather service providers as collectors and traders of
used electrical and electronic equipment. These service providers do not charge a
fee to collect. Moreover, reimbursements are done according to items and there are
also companies who do not set a minimum quantity to provide collection services. It
was observed that, on overall, the assistance and services provided for the residents
to dispose electronic waste for recycling or reuse are much better than those
provided for companies and they are generally adequate.
However, it was noted to be a problem that information is only available on the
internet and there were little publicity about collection of electronic waste from the
households. It was thought and expected that most residents would not search for
recycling avenues on the internet prior to disposing of their electronic wastes. And
one would probably do when he or she is an environmentally conscious consumer
who is committed to protect the environment. This lead to the understanding of
consumers’ awareness, on the harmful effects of electronic waste and also the
benefits of recycling of these wastes, could be the key to achieve high recycling
32

outcome. Conversely, it meant that in this case, where much reliance is on the
residents to source for green avenues for disposals, would most likely result in
residents’ unawareness or feeling it to be a hassle which would eventually, create
large amount of improper disposals of unwanted electronics.
In Singapore, there are also rag-and-bone men, junk dealers, who go around the
neighbourhoods to do collections from door to door of old items and offering little
amount of money in return. The items that they collect include used electrical and
electronic equipment but only functional ones are accepted. These collections are
subsequently sold to second hand dealers. Generally, used electronic goods dealers
place their products to be sold in the local second hand market. There are some who
does dismantling of used electronics as well and subsequently selling the parts to
recycling companies.
The practices of the rag-and-bone men was considered to be not beneficial to the
situation as only functional electronics would be collected. In fact, most consumers
who have unwanted electronics, which are still useful, would normally sell them
directly to second hand dealers like Cash Converters or advertise them on the
internet to sell to other users which in these ways will fetch them a better price.
Usually, only the older functional electronics get sold to the rag-and-bone men by
the residents. It can be seen that the presence of the rag-and-bone men does
practically no help to deal with electronic wastes generated by residents.
Residents and companies can also donate to charitable organisations used electronic
products. One of these organisations is The Salvation Army (SA). SA accepts all
kinds of electronics including spare parts as donations. Donors can drop their
unwanted items at SA’s donation bins and there will usually be a large amount of
non-functional electrical and electronic items that are collected. SA subsequently
sorts out the non-functional devices and sends them for recycling. Useful items
which are in functional conditions are resold at inexpensive costs at Red Shield
Industries (RSI) Family Thrift Stores and the proceeds are used to support SA’s
social and community activities. It can be seen that charities are capable of
generating large volumes of electronic wastes and it is important that they have
good waste management to dispose hazardous wastes in a proper way. It was also
33

observed that electronics recycling companies’ source of materials can be from
charities as well and these materials are largely contributed by residents and
companies.
Manufacturers who are generators of electronic products are seen as a group who
are responsible for the management of electronic waste. In Singapore, various
technology companies are playing their role to clean up their own e-waste by
accepting return of used products from their customers. In an effort to improve the
situation of the rapid increase in the number of used cell phones, Nokia has a ‘take
back’ programme here which allows customers to return old cell phones of all
brands free of charge, including accessories like batteries, to send them for
recycling or safe disposal.
PC manufacturer Dell is offering in Singapore free pick-up service of their
unwanted Dell-branded computers and peripherals for recycling so as to help
control the problem of obsolete PCs from stacking up. Hewlett Packard (HP) has its
own recycling program in Singapore to provide its customers an avenue for disposal
in an environmentally responsible way. Although HP’s recycling program accepts
end-of-life HP and non-HP computers and printers, the program requires signing up
and is only available to HP customers. In addition, minimum pick up volume is
stated as part of its conditions in providing collections.
As observed, most of the ‘take back’ programs available are by reputable
companies and there are not a lot of manufacturers who provide these recycling
programs in Singapore. These programs are sometimes unsatisfactory and certainly
insufficient to deal with the related waste electronic products.
There are several recycling programs by NEA which cover areas in the housing
estates, in the condominiums, private apartment estates, industrial areas as well as
schools. Recycling bins like the one shown in figure 5.1 are placed in these areas.
However, these bins are generally meant for recycling of paper, plastic bottles and
metal cans. Even at the industrial areas, only wood waste and glass are the
additional collections. No efforts were observed to collect electronic wastes in a
similar manner. NEA is also coordinating with recycling companies to collect
34

fortnightly, door to door, materials from the residents to recycle. Similarly,
electronic wastes are not included. From the various observations, it can be seen of
the little emphasis that NEA has placed on electronic waste recycling.
Figure 5.1: Recycling bin for paper, plastic bottles and metal cans.
On the whole, the collection of electronic waste for recycling in Singapore was
observed to be incomplete and unsatisfactory. Discouraging factors were observed
in various areas relating to systems of collections from both companies and
consumers. Cost of collections and consumers’ awareness are also deterring factors.
It was observed that a major responsibility lies on consumers to search and arrange
for recycling of their electronic waste. Much self-reliant actions were thought to be
needed of the consumers and it may not be the way to achieve high recycling
outcome of electronic waste.
Efforts were considered to be generally poor by the government, the manufacturers
and recycling companies to provide effective collections of electronic waste from
all the different sources. The extent of coverage by the recycling companies to
collect electronic waste in the country is rather limited. If a system like those for
collecting general waste could be in place to readily collect used electronics, for
recycling or reuse, but on a less frequent basis, the problems of electronic waste
would be addressed and high environmental outcome would be achieved. However,
such a system would not be easy to implement and would generally take a long time.
35

5.3 Electronic Waste Recycling Companies in Singapore
In this section, the practices and processes of recycling of used electronics of a
company in Singapore, Centillion, are observed and discussed. This provides an
understanding on the situation and also the effectiveness of recycling of used
electronics. A few other electronic waste recycling companies in Singapore are also
featured here for comparisons and discussions.
Centillion Environment & Recycling Limited, formerly known as Citiraya
Industries Limited, is listed on the Singapore Exchange (SGX). Centillion recycles
electronic waste and sells the extracted materials in the open market. It has joint
venture with recycling giant Veolia Environmental Services Asia Pte Ltd, a unit of
Veolia Environment of France. It has operations not only in Singapore but also in
Wuxi, China and Wales, United Kingdom (UK). The company has a CRT recycling
plant in UK and is also constructing a recycling plant in China for electronic waste
recycling and precious metal recovery. Centillion, one of the most successful
electronic waste recycling company in Singapore, made revenue of S$15.099
million and a profit (before income tax) of S$14.098 million in 2006 for all its
operations (Centillion Environment & Recycling Limited Annual Report, 2006,
p.11).
As observed from this electronic waste recycling company, it was determined that
recycling of electronic wastes can be very profitable. This was based on the revenue
and profit (before income tax) that the company made in 2006. The total expenses,
before income tax, of the company were only an approximated S$1 million over
S$15.099 million revenue made. This is a very positive outcome. It is very
encouraging that a well managed electronic waste recycling company not only helps
to protect the environment but also make profits in the process. Centillion is
certainly a good model for other recycling companies as it has shown that it is able
to achieve both its environmental and financial objectives.
Centillion’s recycling plant in Singapore has the facilities to perform the entire
recycling process of electronic waste from collection to the recovery of the precious
metals. Materials that are collected were dismantled and subsequently segregation
36
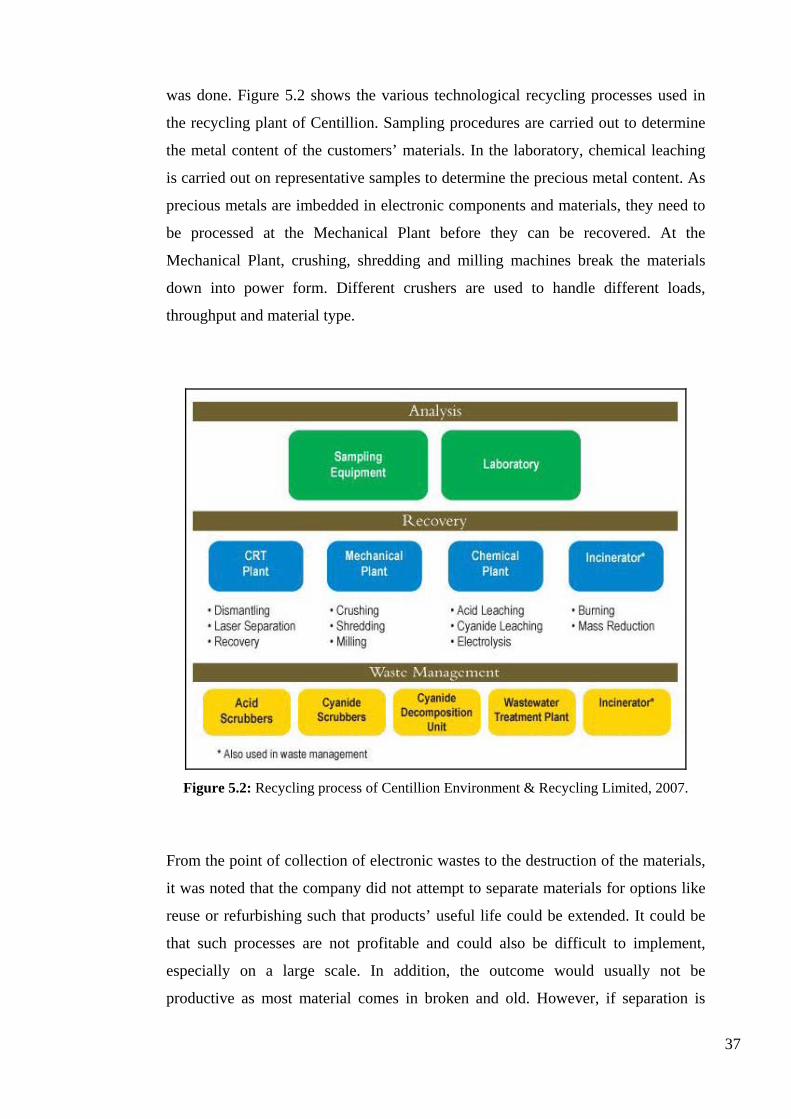
was done. Figure 5.2 shows the various technological recycling processes used in
the recycling plant of Centillion. Sampling procedures are carried out to determine
the metal content of the customers’ materials. In the laboratory, chemical leaching
is carried out on representative samples to determine the precious metal content. As
precious metals are imbedded in electronic components and materials, they need to
be processed at the Mechanical Plant before they can be recovered. At the
Mechanical Plant, crushing, shredding and milling machines break the materials
down into power form. Different crushers are used to handle different loads,
throughput and material type.
Figure 5.2: Recycling process of Centillion Environment & Recycling Limited, 2007.
From the point of collection of electronic wastes to the destruction of the materials,
it was noted that the company did not attempt to separate materials for options like
reuse or refurbishing such that products’ useful life could be extended. It could be
that such processes are not profitable and could also be difficult to implement,
especially on a large scale. In addition, the outcome would usually not be
productive as most material comes in broken and old. However, if separation is
37

done at the point of collection, it would then be easier for such options to be carried
out. In fact, a smaller electronic waste recycling company in Singapore, CH E-
Recycling Pte Ltd, does it as part of its recycling process.
Some precious metals which cannot be liberated by physical means have to undergo
chemical processes to be recovered from the electronic materials. At the Chemical
Plant, acid leaching is first performed. Materials are fed into a tank, as shown in
figure 5.3, where they are dissolved and subsequently precious metals are extracted
by selective precipitation. Secondly, cyanide leaching is done to remove gold from
the materials and gold saturated solution is produced as a result. Lastly, electrolysis
is processed to recover gold from gold saturated solutions.
Figure 5.3: Chemical process of Centillion Environment & Recycling Limited, 2007.
Although not much information was provided on Centillion’s website, it was
observed that the chemical processes to recover precious metals are in fact very
complex and highly confidential. Another electronic waste recycling company in
Singapore, R2 Japan, which provides recovery and refining services of precious
metals has its technologies developed in their Research and Development facility in
Japan. They claim that their technologies are constantly being improved to be cost
effective and environmentally friendly. 38

It is great that recycling companies are improving their processes to achieve
optimum output and at the same time doing it in an environmentally safe way. The
recovery process of precious metals could be the most critical process in recycling
of electronic wastes as it might determine how effective the overall recycling is.
However, the highly confidential nature of the processes might meant that some
other recycling companies could be lagging behind and processing in a less green
manner and recovering less useful materials from their recycling processes.
Figure 5.4: CRT recycling of Centillion Environment & Recycling Limited, 2007.
Centillion has its CRT Plant situated in Hirwaun, South Wales of UK and does it
CRT recycling there. Figure 5.4 shows the CRT recycling in process. It is able to
achieve 100 % clean separation and recovery of CRT’s panel and funnel glass with
zero contamination. It was observed that effective results can be achieved in CRT
recycling. More than 92 % of glass mass is recovered and more than 98 % of total
mass sent for recycling are recovered in Centillion’s CRT Plant (Centillion
Environment & Recycling Limited, CRT Plant, 2007). The plant’s cutting processes
are fully automated and thus reduce exposures to the workers and safely remove
toxics. This is certainly a good outcome as one of the most harmful electronic parts,
the CRT, can also be safely processed with the use of technology and highly
effective results are achieved at the same time.
39

Figure 5.5 shows the incinerator used in the company. Incineration is used for mass
reduction and it is sometimes necessary prior to liberation of precious metals as
some materials like filters, rags and wipes, cannot be effectively crushed or
chemically stripped. It was noted that among other processes, incineration is also
used for the company’s in-house waste management. From these observations, it
was felt that improvements should be made in their processes such that incineration
would not be required at all, therefore making the recycling greener.
Figure 5.5: Incinerator of Centillion Environment & Recycling Limited, 2007.
As part of Centillion’s waste management, acid scrubber system is used to oxidise
and neutralise fumes from the chemical processes. Similarly, cyanide scrubber
system treats the fumes that are released by cyanide leaching and electrolysis
processes. At the cyanide decomposition unit, cyanide in solutions is reduced by
Ultra-violet Oxidation Unit to an appropriate level. Finally, the Wastewater
Treatment Plant, which collects wastewater from all the laboratories and chemical
processes, removes heavy metals present in the wastewater by pH adjustment,
coagulation and flocculation. It was observed that proper waste management is in
place in the recycling company to capture and treat all hazardous substances to
prevent them from escaping to the environment. These systems are certainly
necessary for safety and environmental concerns.
40

From the study made on the electronic waste recycling company, Centillion
Environment & Recycling Limited, a better understanding was achieved of
electronic waste recycling. Comparisons were also made with other recycling
companies which gave a better understanding of the situation. Technologies and
automations are used to achieve optimum results and proper waste management
makes the whole process safer. As noted, it can be profitable, safe and effective.
In fact, the recovery can be very effective as seen in other recycling companies in
Singapore as well. Enviro-Hub Holdings are able to recover about 3.5 kg of
precious metals from 1 ton of copper scrap. In addition, they are also able to refine
copper cathodes to at least 99.95 % purity (UOB Kay Hian Research, 2006). On the
other hand, Cimelia Resource Recovery Pte Ltd is able to recover about 1 kg of
gold from 5 tons of electronic waste (UOB Kay Hian Research, 2006).
5.4 Conclusions and Recommendations
In the previous sections, the collection of electronic waste in Singapore for
recycling were seen and discussed. This was followed by a study on the processes
of recycling and also recycling of used electronics in general. On the whole, it was
observed that the electronic waste recycling companies in the country have good
technologies and good standards to carry out effective and safe recycling. Moreover,
the profitable nature was definitely one important reason that would encourage
more developments and establishments in electronic waste recycling. The main
problem lies on the systems of collections and it is therefore important that
improvements are made so that more electronic waste can be recycled.
As observed, the current practice in collection of electronic waste was
unsatisfactory. There was no proper control in the system of collections by the
government to effectively collect used electronics for either reuse or recycling. This
could be worsening as there are quite a lot of collectors and traders of used
electronics around. 19 such companies are listed on NEA’s website. As these
companies are not recycling companies, their primary objective could be to profit
through reselling of the collected used electronics rather than selling their materials
41

to recycling companies which would probably earn them a lower profit. This could
create problems if non-useful parts are mishandled and not send for proper disposal
by recycling. Therefore, their actions are important and the government should
control and award licenses accordingly. It will also be good if they can be
representatives of recycling firms such that used electronics are effectively collected
for reuse, refurbishing or recycling.
There are deterring factors like cost and minimum quantity for collections that
might result in companies putting aside arrangements for recycling. There should be
more coordination between the government and the electronic waste recycling
companies such that better system for collections can be implemented in the country.
This would mean absorbing the cost of collections and providing more efficient
collection services. In a place like Singapore, which is a small city state with good
infrastructure, collection should not be the barrier to achieve high recycling
outcome for electronic waste.
It was observed that ‘take back’ programs by manufactures are few in the country
and they are generally not effective. More publicity and participation is required.
There should be more cooperation between manufacturers and recycling companies
so as to make ‘take back’ programs a more common way of collection hence
achieving better outcome.
42

Chapter 6: Management of Electronic Waste in
Other Countries
6.1 Introduction
This chapter understands the various methods that are used globally to deal with the
electronic waste problem. This aimed to provide a wider understanding of the extent
electronic wastes are managed in other countries. Observations are made in the
United States (US), Australia, Europe and Japan. This included comparisons with
Singapore and relating of good systems to the local situation.
Finally, conclusions are made of the local situation and subsequent
recommendations for improvements are also suggested.
6.2 Management in the United States (US)
In this section, the different methods that are used to deal with the electronic waste
problem in the US are observed and discussed. Comparisons are also made with
Singapore and subsequently relating good systems to the local situation.
In the US, the State and Federal environmental agencies has regulated that selected
electronic products must be treated as hazardous waste if intended for disposal.
Toxicity Characteristic Leaching Procedure (TCLP) is one of the test techniques
that are used in the country to determine if the products are hazardous or non-
hazardous. CRT monitors which usually contain about 1.8 to 3.6 kg of lead fail
TCLP tests for toxicity (www.ewaste.com). Other electronic materials like PCBs
that are found in computers and cell phones were noted to frequently fail TCLP
tests.
43

The New York State (NYS) Department of Environmental Conservation (DEC)
Regulation requires that these hazardous products should be disposed of in an
environmentally sound manner. The regulation also requires that recycling facility
must be on file with the DEC. It was observed that even donated equipment must be
functional and for continued use and penalties may apply for non-compliance of the
regulation.
Donating used electronics is a way to extend the products’ life span but Regional
Computer Recycling and Recovery (RCR & R) in US reported that in many cases,
the equipment is not in working condition or lacks certain upgrades. In fact, many
schools, churches and non-profit organisations end up engaging recycling
companies to collect donated equipment.
As observed, there is regulation in the US to prevent improper disposal of certain
electronic wastes and tests are used to identify hazardous electronic products.
Conversely, regulation and test like these could not be found in Singapore to
particularly address electronic wastes. Regulation could be a good way to deal with
the problem. This meant that it is an offence to even dispose small amounts of
electronic waste in general waste collections. However, there is no guarantee that
regulation would work. It would only put a pressure on those who are aware,
especially the companies. It was thought that educating could still be the best way
to deal with the problem in the long term.
Charities usually receive large amount of non-functional electronic equipment and
this is observed in Singapore as well. This could be the result that the public do not
know what to do with their used electronics and thought that it might be useful to
the charities. As seen in US, regulation is implemented to stop the problem. This
could be considered strict but would be good as it saves large amount of time spent
on checking and sorting. It would probably be more appropriate that charities
inform their donors of the items that they would like to receive.
The Extended Producer Responsibility (EPR) is a waste management strategy in
which manufacturers take responsibility of their products to manage them in an
environmentally sound manner when they become obsolete and unwanted.
44

Manufacturers are in fact held accountable for meeting goals in source reduction,
electronic products recovery, reuse and recycle. The end of life cost of electronic
products will be internalised in the manufacturing process and can be reflected in
product prices. This was noted in the US, a fee ranging from US$6 to US$10,
depending on the product size, are charged at the point of purchase for certain
electronic devices for recycling.
In the US, the expense of collecting, managing and disposing hazardous e-waste
and waste sites clean up is borne by the taxpayer-funded government programs. The
Computer TakeBack Campaign (CTBC), US, observed that EPR helps push
manufacturers to assume responsibilities of these costs, thus aiming to relief the
financial liability of the government and the taxpayers. CTBC believed that
manufacturers will be more concerned about designing products that will last longer,
be more useful and upgradeable. This also included concerns like easy to
disassemble and recycle so as to keep waste costs to a minimum.
As observed, EPR is a positive policy that would probably create a better recycling
system and improve the situation of electronic waste. EPR would probably help to
address most of the problems of an electronic product right from the start at the
designing or manufacturing stage and therefore bring about manufacturing of
greener electronics. This will certainly be an effective way to deal with electronic
waste problem. In fact in 2006, the Ministry of the Environment and Water
Resources of Singapore noted that there are various ways of implementing EPR as
seen in other countries like Australia, New Zealand and Germany that range from
fully voluntary, fully mandatory, to a mix of both. However, none were
implemented. Singapore’s government should consider and try ways of
implementing such policy so as to hold the manufacturers responsible for their
products and would generally help to improve the situation. At the same time, costs
issues, to a certain extent, would be addressed.
In US, in the year 2005, about 10 % of shareholders supported As You Sow (AYS),
proposal that eventually brought Apple Computer to announce that it was
revamping its ‘take back’ and recycling program. AYS is a non-profit promoting
corporate social responsibility that represents shareholders. It was observed that
45

there is not much activity from non-profit organisations in Singapore to actively
promote awareness in electronic waste recycling. Shareholders generally play a
major role in large companies. This was observed to be important in manufacturing
companies as they can support the study of ways to improve or to set up ‘take back’
and recycling programs of used electronics, as seen in the case of Apple Computer.
It is therefore essential that awareness is raised in all areas including this group who
has direct connection with the manufacturers.
Another situation in the US worth learning is that The University of California (UC)
adopts guidelines for purchasing greener electronic products and recycling them.
The university encourages manufacturers to provide ‘take back’ services and to
recycle their electronic wastes. As a large university and the first in US to adopt
such guidelines, environmental groups like CTBC observed that it could be setting
an impact on how electronic products are manufactured and recycled.
It is good effort by the university to adopt guidelines for purchasing greener
electronic products and recycling them. The universities in Singapore could work in
a similar way to set a standard here for the manufacturers. This would certainly be
beneficial as not only does it help to protect the environment, it also helps to raise
awareness among the students. It would be better if other institutions and schools
throughout the country follow such guidelines for purchases and disposals.
The Electronic Product Environmental Assessment Tool (EPEAT), initiated by the
Environmental Protection Agency (EPA), US, was developed and launched in July
2006. EPEAT is a tool to assist consumers evaluates and selects electronic products
according to a list of preferred environmental attributes. The manufacturers can
register their products with EPEAT which has mandatory and optional criteria for
different status of bronze, silver and gold.
EPEAT is a good development that will help consumers to better understand their
electronic products. As there is currently no such tool in Singapore, it would be
useful to the environmentally conscious consumers if a similar one could be
implemented. This would also create competition among the manufacturers to
achieve better environmental standards for their products. However, for such a
46

system to be effective, it would have to cover a majority of electronic products
which is most likely difficult and time consuming for the manufacturers.
On the whole, it was concluded that there were much more Singapore could do to
address electronic waste problems and also to achieve a high outcome of electronic
waste recycling. This could also mean that Singapore could be lagging behind other
countries in its efforts to deal with electronic waste. The comparisons showed that
there is a lack of regulation, policy, non-profit environmental groups’ activity,
academic activity and environmental assessment tool in the country. As observed,
there are quite a few methods in US which will be useful and the possible ways of
implementations should be studied by the government to improve the situation in
Singapore.
6.3 Management in Australia, Europe and Japan
In this section, the situations in other countries are observed and discussed. This
provides a wider understanding of the various methods that are used globally to deal
with the electronic waste problem. Similarly, this includes comparisons with
Singapore and relating of good systems to the local situation.
In Australia, household products that are corrosive, toxic, ignitable or contain
reactive ingredients are categorised as Household Hazardous Waste (HHW). Such
products are advised by the government to be handled with care and to be disposed
in a safe manner. These include electronic products like batteries, cell phones,
televisions and computers. In Singapore, waste electronic products are not
categorised as hazardous waste nor are the harmful effects warned by the National
Environment Agency (NEA) on their website or through pamphlets. This inevitably
would make the public feel safe with these products and in turn would cause them
to be unconcerned about disposing them safely. This should not be the situation.
NEA should in fact ensure residents’ awareness on electronic waste and some level
of categorisation is seen as necessary.
47

In an attempt to raise awareness about electronic waste recycling in Australia, a
computer collection pilot program, Recycle IT!, was conducted in western Sydney
from November 2002 to April 2003 by the Australian Information Industry
Association (AIIA) and the Sustainability Programs Division of the New South
Wales (NSW) Department of Environment and Conservation. The campaign was
successful and about 57,000 kg of electronic products were collected.
It was observed that there is no major campaign in Singapore to promote awareness
on electronic waste recycling. The most recent campaign conducted to collect
unwanted computers and peripherals was by Hewlett Packard (HP). The campaign
was to mark Earth Day which falls on April 22, however it was only for a short
period of 5 days. There should be more participation by manufacturers in Singapore
and large scale campaigns should be conducted to set an impact that would
effectively raise awareness among the consumers.
In Australia, the NSW Government introduced the Extended Producer
Responsibility (EPR) policy in 2001 through the Waste Avoidance and Resource
Recovery Act 2001. The policy is to ensure that producers take physical or financial
responsibility for the environmental impacts of their products. Subsequently, the
EPR Priority Statement 2004 was developed. There were 16 listed ‘wastes of
concern’ and 9 of them were of priority focus. Computers, televisions and nickel
cadmium (NiCad) batteries were among the nine priority focus. EPR Priority
Statement 2005-06 was later introduced and it replaces EPR Priority Statement
2004. Electronic products are still included under the new priorities and they are
computers, mobile phones and televisions.
As observed, the priority list could be useful to address hazardous waste products
and to put the industries aware of it. It was noted that in this case, electronic
products are always among the priorities and this indicates the importance of proper
disposal of electronic products. In Singapore, EPR is not practiced but if a priority
list of hazardous wastes is available, it would serve as a good guide for the
industries.
48

The Australian Mobile Telecommunications Association (AMTA) runs a successful
mobile phones and batteries recycling program in Australia. The life span of a
mobile phone is very short, an average of 18 months according to the AMTA. In
2005, the AMTA estimated that about 1.5 million mobile phones have been
collected and recycled through its Mobile Phone Industry Recycling Program
(MPIRP). The recycling program has help to reduce electronic waste in the country
and also to protect the environment.
There should be some large scale mobile phones recycling going on in Singapore as
well. The fast replacement rate further emphasised the importance of doing so.
However, the mobile phones recycling programs in Singapore have low publicity
and the responses were poor. The Straits Times reported in April 2007 that Nokia
noted only 2 per cent of used mobile phones are recycled through their ‘take-back’
program in Singapore. The company research later also found out that almost half
of all used mobile phones are still being kept at home. More efforts should be put in
to make recycling programs productive.
In Australia, a relatively new, industry-led organisation with a focus on managing
environmental issues in the consumer electronics sector is the Product Stewardship
Australia Ltd (PSA) (www.productstewardship.asn.au). It is a non-profit
organisation. It works with the companies to facilitate establishments of product
stewardship schemes so as to collect and recycle used electrical and electronic
equipment and ultimately control the problem of electronic waste. The product
stewardship generally offers a collaborative approach and sharing of responsibilities
among the related parties.
The product stewardship is an alternative method that could be used in Singapore to
control the problem of electronic wastes. The approach is fair and all related parties
might see the benefits of establishing such schemes. If establishments are made, the
problems of the related electronic products would be well taken care of and on the
other hand, high recycling outcome would be achieved.
In Europe, the WEEE Directive (Waste Electrical and Electronic Equipment) was
passed in 2003 and it covers all countries in the European Union (EU). The key
49

components include producers financing reuse, recycling and disposal of all
electronic waste equipment that they put on the market after 2005. The
manufacturers must also meet a certain collection rate and recycling rates are
specified and will increase over time. Products must be designed for dismantling
and recovery as well. The WEEE Directive was accompanied by a second law, the
Restriction on Hazardous Substances (RoHS) Directive which says that the use of
substances like lead, cadmium and mercury must be phased out by July 1, 2006.
In Japan, the Law for Promotion of Effective Utilisation of Resources was passed in
2001. This covers consumers owned computers, monitors and some other products
as well. It mandated business in certain sectors to take on recycling initiatives and
incorporate 3Rs, Reuse, Reduce and Recycle, into their business model. It also
included a ‘take back’ fee for purchase of new equipment after 2003, in which the
fee is paid to the manufacturers.
As can be seen, the situation for both Europe and Japan are rather stringent. EU
countries have laws that mandate manufacturers to achieve high environmental
standards of their products through green manufacturing and good designs.
Recycling goals are even set for the manufacturers to achieve as well. In both
Europe and Japan, the end of life management of electronic products are mandated
to be taken care of by the manufacturers as their systems to deal with electronic
waste and to protect the environment. Singapore is definitely way far behind these
countries in setting environmental laws to address electronic waste.
6.4 Conclusions and Recommendations
By observing some of the systems in other countries, in this case in the US,
Australia, European Union and Japan, an understanding was achieved. This also
provided a chance to compare with the situation in Singapore. It was concluded that
Singapore’s controls and efforts on electronic wastes are generally poor.
In the observations, various methods were found to be good in other countries and
could be effective for dealing electronic waste in Singapore. The first step to begin
50

with could be to categorise electronic waste with some level of importance. This
could be followed by setting a policy regarding the management of electronic waste
that would be useful as a guide and also as an important notice to both companies
and consumers. It was also noted that Extended Producer Responsibility (EPR) is
widely used in other countries and this could mean that it is the most effective way
of addressing the problems of electronic waste. Ways of implementation should be
considered by the authorities and it could also be a solution to the problem of
collection of electronic waste in the country.
There are quite a number of non-profit organisations in other countries which help
to push for better environmental standards. Singapore needs to raise the level of
awareness and encouragement so as to see similar activities happening locally. This
could probably also start from schools and universities. National Environment
Agency (NEA) should also work with more manufacturers so that more campaigns
and ‘take back’ programs can be conducted in the country, probably on a longer
period. This would not only help to collect electronics for recycling but also an
effective way of promoting awareness. On the whole, there are much more that can
be done in Singapore to effectively address electronic waste and methods to do it
should be explored on a wider basis.
51

Chapter 7: Case Studies on Companies in the
Local Industry
7.1 Introduction In this chapter, case studies were conducted on two companies in the local industry
to gain an understanding on the system of management used in dealing used
electronic products. The data collected from these companies were focused on only
computers and printers.
This included a study on the amount of computers and printers that were used,
stored, disposed and recycled over time. Assumptions were made to widen the scale
of understanding. The results obtained from the 2 case studies were subsequently
used to relate to the manufacturing industry and all other sectors as well. This was
intended to understand the possible magnitude of electronic wastes, like computers
and printers, that were disposed in the industries of Singapore.
7.2 Methodology The task was to collect information for studies on how companies in the local
industry managed their used electronics. In the case studies, two manufacturing
companies in the electronics sector were studied. As the wide range of electronic
products in these two companies was considered too huge for the case studies, it
was shrunk to focus only on computers and printers. This was considered as a good
way to build the understanding of how these two companies on overall handled
their used electronic products, since computers and printers are usually present in
large numbers in a typical company and they are electronic products with
significant mass.
As the two companies are generally large and access to various information were
difficult and too time consuming, data was collected only for a department in each
52

company and they are both the Production Department. The Production Department
is usually one of the biggest departments in a company that have big space area and
large number of employees. Hence, it is usually in this area of a company where the
largest amount of electronic products is equipped.
Nevertheless, investigations with only the management of computers and printers,
in these two cases, were seen as constructive and meaningful as it was thought that
by being able to properly manage these common electronic products would meant
that more expensive and sophisticated ones were much more well taken care of. On
the other hand, if a big department had been able to manage its electronic products
properly, it would also mean that other smaller ones are of better standards of
management. Therefore, the analysis of data for the computers and printers in the
production department was taken to be an important step to understand the company
as a whole, in the situation that information on a smaller scale was being collected.
Subsequently, the understanding of how the two companies dealt with used
computers and printers was further used to relate to the possible generation of used
computers and printers in the industries in Singapore. Specific points for the data
collection which ceased in mid October 2007 for these two companies were as
follows.
• Total number of computers and printers which were in operation.
• Total number of computers and printers that were stored which were meant
for reuse or to be disposed.
• Total number of computers and printers that were sent for recycling over a
specified period of time.
• Total number of computers and printers that were not recycled and were
thrown into general waste collections.
The two manufacturing companies are both reputable multi-national companies
which have offices and factories over the world. For each company, a set of data
was collected in one of the factories situated in Singapore. Representatives of the
respective companies were approached for the above mentioned information.
Background information of the respective companies which were useful in
53

supporting the case studies was also obtained. The results of the two companies
were combined and then averaged out to obtain a mean which was ultimately used
to gauge the possible amount of disposal of computers and printers in the local
industries.
7.3 Case Study Number 1 The factory of the manufacturing company that this first case study was conducted
was a relatively new 8 years setup. It was ISO 14001 certified for its environmental,
health and safety standards. There were about a total of 450 employees in this
company in Singapore. The management of the physical computers and printers
were carried out by the respective departments. New purchases were based on the
department’s budget and end of life products were sent for recycling biannually.
These requests were however approved by both the Finance and Information
Technology (IT) Department. The networking and software setup and maintenance
of the terminals were normally performed by the IT Department.
Production Department Computers & Printers
LOCATION CPU Monitor Keyboard Mouse Network
Laser Printer
Ink Jet Printer
Label / Barcode Printer
1 Kitting 1 1 1 1 1 2 Assembly XY (PDC) 1 1 1 1 1 3 Assembly MI 1 1 1 1 4 Test Station 1a PU (PDC) 1 1 1 1 1 5 Test Station 1b 2 2 2 2 6 Test Station 3a CAL 1 1 1 1 7 Test Station 3b 2 2 2 2 8 Test Station 5a MHS (PDC) 1 1 1 1 9 Test Station 5b 2 2 2 2
10 Test Station 8a TM (PDC) 1 1 1 1 1 11 Test Station 8b 2 2 2 2 12 Test Station 10 BOND (PDC) 1 1 1 1 13 Test Station 11 CUST (PDC) 1 1 1 1 14 Test Station 12 PBD (PDC) 1 1 1 1 1 1 15 Scope Room Shear 2 2 2 2 16 Scope Room Pull 2 2 2 2 17 Scope Room Ball Measure 4 4 4 4 1 18 Scope Room View 2 2 2 2 19 Offices 11 11 11 11 2 1
Total number in operation 39 39 39 39 6 2 2
Table 7.1: The computers and printers used in the Production Department of Manufacturing Company #1. 54

The number of computers and printers that were used in the Production Department
of this manufacturing company were collected as shown in table 7.1. It was a
collection of the computers and printers at different locations in the department and
the total figure was tabulated as the total number in operation. There were 39
computers which were desktops and a total of 10 different printers. It was noted that
none of the computers and printers in the production line were in non-working
condition.
The Production Department of this company functioned 24 hours a day on three
shifts and there were a total of about 180 staffs in this department. This was a large
number comparing with the total number of computers in operation. It was also
noted that these terminals were turned on 24 hours a day to run the production and
only turned off when the staffs rest on Sundays or on public holidays. This certainly
affects the life span of the computers and printers which will likely result in a
higher rate of replacement. A high replacement rate of electronic products in the
factory further emphasised the importance of proper electronic waste management
of the company.
CRT and LCD Monitors
LOCATION CRT Monitor
LCD Monitor
1 Kitting 1 2 Assembly XY (PDC) 1 3 Assembly MI 1 4 Test Station 1a PU (PDC) 1 5 Test Station 1b 2 6 Test Station 3a CAL 1 7 Test Station 3b 2 8 Test Station 5a MHS (PDC) 1 9 Test Station 5b 2
10 Test Station 8a TM (PDC) 1 11 Test Station 8b 2 12 Test Station 10 BOND (PDC) 1 13 Test Station 11 CUST (PDC) 1 14 Test Station 12 PBD (PDC) 1 15 Scope Room Shear 2 16 Scope Room Pull 2 17 Scope Room Ball Measure 4 18 Scope Room View 1 1 19 Offices 4 7
Total in Operation 28 11
Table 7.2: The CRT and LCD monitors in the Production Department of Manufacturing Company #1.
55
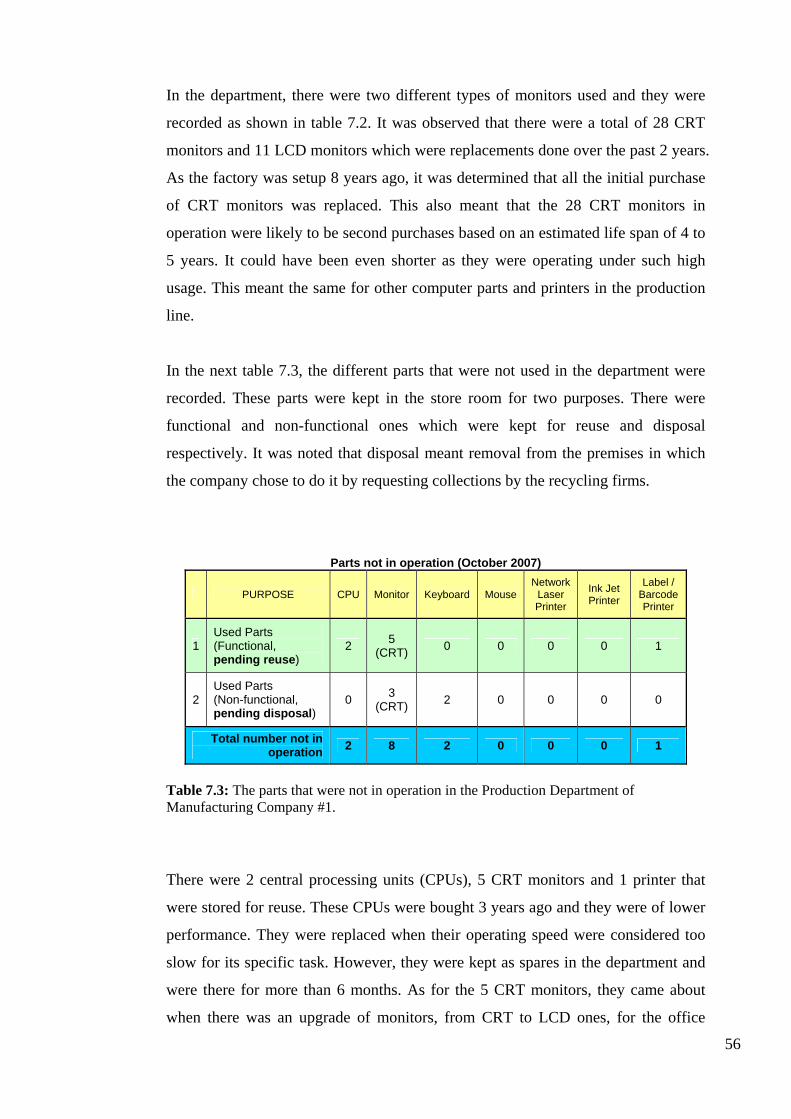
In the department, there were two different types of monitors used and they were
recorded as shown in table 7.2. It was observed that there were a total of 28 CRT
monitors and 11 LCD monitors which were replacements done over the past 2 years.
As the factory was setup 8 years ago, it was determined that all the initial purchase
of CRT monitors was replaced. This also meant that the 28 CRT monitors in
operation were likely to be second purchases based on an estimated life span of 4 to
5 years. It could have been even shorter as they were operating under such high
usage. This meant the same for other computer parts and printers in the production
line.
In the next table 7.3, the different parts that were not used in the department were
recorded. These parts were kept in the store room for two purposes. There were
functional and non-functional ones which were kept for reuse and disposal
respectively. It was noted that disposal meant removal from the premises in which
the company chose to do it by requesting collections by the recycling firms.
Parts not in operation (October 2007)
PURPOSE CPU Monitor Keyboard Mouse Network
Laser Printer
Ink Jet Printer
Label / Barcode Printer
1 Used Parts (Functional, pending reuse)
2 5 (CRT) 0 0 0 0 1
2 Used Parts (Non-functional, pending disposal)
0 3 (CRT) 2 0 0 0 0
Total number not in operation 2 8 2 0 0 0 1
Table 7.3: The parts that were not in operation in the Production Department of Manufacturing Company #1.
There were 2 central processing units (CPUs), 5 CRT monitors and 1 printer that
were stored for reuse. These CPUs were bought 3 years ago and they were of lower
performance. They were replaced when their operating speed were considered too
slow for its specific task. However, they were kept as spares in the department and
were there for more than 6 months. As for the 5 CRT monitors, they came about
when there was an upgrade of monitors, from CRT to LCD ones, for the office
56

computers of senior staffs and supervisors about a year ago. The label/barcode
printer that was out of warranty was removed from the line 2 years ago as it was not
functioning properly. A calculation showed that about 5 % of CPUs, 13 % of
monitors and 10 % of printers of the total number in operation were stored for reuse.
These amounts could have been lesser if efforts were made by the various
departments to co-ordinate the possible allocations of these electronic parts.
There were also 3 CRT monitors and 2 keyboards which were required to be
disposed. These parts were about 4 years old and they were consolidated in the store
room for the next recycling collection at the end of the year. This is a positive effort
of the department and the company where unwanted electronic parts were
systematically organised for proper disposal at fixed periods.
Parts disposed from Jan 2007 to Jun 2007
PURPOSE CPU Monitor Keyboard Mouse Network
Laser Printer
Ink Jet Printer
Label / Barcode Printer
1 Sent for recycling in July 3 4 (CRT) 3 0 0 1 0
2 Thrown with general waste (Not recycled)
0 0 0 6 0 0 0
Total disposal 3 4 3 6 0 1 0
Estimated years old of disposed parts 4 4 4 3 NA 3 NA
Table 7.4: The parts that were sent for recycling or dumped in the Production Department of Manufacturing Company #1.
On table 7.4, the parts disposed over a 6 months period from January 2007 to June
2007 were listed. They were either part sent for recycling or part thrown into
general waste collections. These parts had a short life span of 3 to 4 years. Of the
total disposal, 6 computer parts, the mice, were thrown into general waste bin and
therefore not recycled. It was told that these parts were small and hence not
considered for recycling by the department. On the other hand, other parts were
considered too bulky to be thrown into general waste bins and hence requested
collections by the recycling companies which were also the appropriate way of
disposal. It was noted that dumping of all kinds of wastes is illegal in Singapore.
57

The following table 7.5 shows the weight of typical computer parts and printers.
These data were collected from the specifications of the products in the various
brand companies’ websites. As the weight of keyboard and mouse were not
available, the weight of a standard keyboard and mouse were literally taken and
recorded. From these data, a calculation was made to understand what percentage
by weight of the total parts disposed that were not being recycled
Parts Model Weight Computer (Desktop) Fujitsu ESPRIMO P5100 8.3 kg
Computer (Laptop) Fujitsu LifeBook C1410 2.8 kg
Monitor (CRT) ViewSonic E70B 17” CRT Monitor 15.0 kg
Monitor (LCD) Samsung 720N 17” LCD Monitor 4.4 kg
Keyboard Logitech Deluxe 104 Keyboard 1.05 kg
Mouse Logitech Optical Mouse 0.15 kg
Printer (Ink Jet) Canon Photo Printer Pixma iP1800 3.31 kg
Printer (Laser Jet) HP LaserJet P2015dn Printer 11.02 kg
Table 7.5: The weight of different computer parts and printers.
Total weight of parts disposed (in half a year):
( ) ( ) ( ) ( ) ( ) =×+×+×+×+× 15.0631.3105.131543.83 92.26 kg
Total weight of parts disposed that were not recycled (in half a year):
=× 15.06 0.9 kg
Percentage by weight of parts disposed that were not recycled:
98.010026.929.0
=× %
As calculated, the approximated percentage of parts disposed that were not recycled
was 0.98 %. This amount was small as it was only contributed by the 6 mice. Other
unwanted computer parts and printers might be considered too big to be easily
58

disposed in general waste bins in this case. However, there were other small sized
electronic products in the company ranging from multimeters to electronic gauges
and if every department practiced such disposal in the company, numerous amounts
of small sized electronic products will not be recycled. A calculation indicated that
it could be an approximated 4.5 kg of mouse that will not be recycled in a year in
the company.
Estimated weight of parts disposed that will not be recycled (in the company in a
year):
=×× 2450180
9.0 4.5 kg
Estimation was made to see the amount of waste contribution of computers and
printers that will be disposed in the company in a year based on the rate that 180
employees had produced 92.26 kg of electronic waste consisting of computers and
printers in half a year. This meant that 1.03 kg of computers and printers will be
disposed by an employee in a year.
Estimated weight of computers and printers disposed by an employee (in a year):
03.12180
26.92=× kg
Estimated weight of computers and printers disposed by 450 employees in the
company (in a year):
5.46345003.1 =× kg
It was calculated to be a total of 463.5 kg that would be disposed in the company in
a year. This was a considerable amount. Although the assumption was based on a
high usage rate of the Production Department, it was however only consisting of
computers and printers. It can be seen from this assumption of the magnitude that
computers and printers are capable of generating and which is why they have
always been considered as one of the major contributors of electronic waste.
59

On the whole, the management of computers and printers during the products’ life
span and after its end of life was generally very good. It was observed that controls
were in placed from purchasing to disposal of these products. This had brought
about a high recycling rate seen in this rather restricted scale of case study.
However, the company seems to lack the effort of educating its employees on the
benefits of recycling even though it was ISO 14001 certified. Their employees were
obviously unsure of the value and importance of recycling of electronic wastes.
This should not be the situation. After all, the company is a manufacturer in the
electronics sector hence has the responsibility to play a part in dealing with
electronic wastes and therefore set a good example.
7.4 Case Study Number 2 In the second case study, a similar way was used to understand the practices of the
company in dealing computers and printers, particularly with the end of life
management. The factory under study was 23 years old and there were various
changes in the production lines over the years. As such, the Production Department
had a mixture of computers and printers ranging from close to end of life ones to
newly purchased ones.
The company was also an ISO 14001 certified company and there were a total of
1400 employees in Singapore. The management of computers and printers was
department based. A specific staff administered the management in the department
and liaised with the Finance Department. New purchases were requested through
written documents justifying the requirements and approvals were given by the
Finance Department. The company engaged a contractor to collect their used
materials which included electronic wastes, waste chemicals, metal scraps, plastics
packaging and carton boxes. The service provider would subsequently sort out the
wastes and sent them to respective recyclers.
The Production Department of this company had two production lines and the
computers and printers used in the department were recorded on table 7.6. There
were a total of 44 computers and 36 different printers. It was noted that the
60

proportion of printers to computers were much higher compared to the company in
the first case study. This was because there were a significant number of staffs who
had personal desk jet printers. This probably meant that the printers were running
on a lower efficiency during its useful life span compared to a network printer
which had shared access.
Production Department Computers & Printers
LOCATION CPU Monitor Keyboard Mouse DeskJet
Printer
Network Laser Printer
Label / Artwork Printer
Production Line #1 1 PCBA Test Station #1 1 1 1 1 2 PCBA Test Station #2 1 1 1 1 3 PCBA Test Station #3 1 1 1 1 4 LCD Testing Station 1 1 1 1 5 Upper Module Assy Station 1 1 1 1 6 Lower Module Assy Station 1 1 1 1 7 Pre-Burn-In Station 1 1 1 1 8 Post Burn-In Station 1 1 1 1 9 Final Test Station 1 1 1 1 1
10 Label Printing Station 1 1 1 1 3 11 Cal Cert Printing Station 1 1 1 1 1 12 CD Writing Station 1 1 1 1 13 CD Artwork Printing Station 1 1 1 1 1 14 Order Integration Station 1 1 1 1 15 Debug station #1 1 1 1 1 1 16 Debug station #2 1 1 1 1 1 17 Debug station #3 1 1 1 1 1 18 RMA Station 1 1 1 1 19 Line leader's table 1 1 1 1 1
Production Line #2 1 Front-End Board Pre-test 1 1 1 1 2 Backend Board Pre-test 3 Unit Assembly 1 1 1 1 4 Cal Test Station 1 1 1 1 1 5 Final Test Station 1 1 1 1 6 Box Content List Printing 1 1 1 1 1 7 Label Printing Station 2 8 CD Verification Station 1 1 1 1 9 Order Integration Station 1 1 1 1 1
10 Line leader's table 1 1 1 1 11 Offices #1 7 7 7 7 7 2 12 Offices #2 10 10 10 10 10 2
Total in operation 44 44 44 44 23 7 6
Table 7.6: The computers and printers used in the Production Department of Manufacturing Company #2.
There were a total of 42 staffs in the department which consisted of 23 operators
and 19 other staffs of different positions. This number was small as the company
61

had a major portion of its employees in its design services for its operations in
Singapore. Production operated 12 hours a day and the computers and printers were
usually left turned on overnights. Although the department used both CRT and LCD
monitors, there were no specific records on the number of different types of monitor
used.
From the following table 7.7, there were 6 sets of computers that were not in
operation. Of which, 3 sets were kept for reuse and another 3 were pending disposal.
The contractor was normally asked to collect the computers and printers meant for
disposal when there was a considerable amount accumulated. As the contractor
visited the company to collect all kinds of used materials on a frequent basis,
disposal of computers and printers were generally convenient. It was learned that
disposal of computers were usually done in sets by the company. This was because
it was easier for accounting especially for upgrade purposes and also because
purchases for computers in sets were offered at a better price.
Parts not in operation (Start of Aug 2007 to end of Sep 2007)
PURPOSE CPU Monitor Keyboard Mouse DeskJet
Printer
Network Laser Printer
Label / Artwork Printer
1 Used Parts (Functional, pending reuse)
3 3 3 3 0 0 0
2 Used Parts (Non-functional, pending disposal)
3 3 3 3 0 0 0
Total number not in operation 6 6 6 6 0 0 0
Table 7.7: The parts that were not in operation in the Production Department of Manufacturing Company #2.
The number of computers stored for reuse was 3 sets which were about 7 % of the
ones in operation. Options for reuse in other departments were not practiced. One
reason told was that these used computers were probably not welcomed as they
were usually considered obsolete. In the 2 months, from the start of August to the
end of September, after the last collection of disposal by the contractor, 3 sets of
computer were replaced in the production lines and awaiting disposal. This was a
62

fast rate of replacement as upgrading of terminals was in progress. The computers
were about 4 years old. Two had performances which were undesirable and not
upgradeable. One was not functioning properly and was replaced as it was
considered irreparable by their technical staffs. It was however noted that spares
were not easily available in the market for these old computers.
In the next table 7.8, the amount of parts disposed was observed for a period of 7
months, from January 2007 to July 2007. A total of 9 computer sets were disposed
and all were sent to recycling via the contractor. None of the parts disposed were
thrown into general waste collections and these parts were estimated to be 4 years
old. This was a 20.5 % disposal of computers over the operating ones in a 7 months
period. A calculation was made to find out the total weight of computers that were
disposed based on the data on table 7.5.
Parts disposed from Jan 2007 to Jul 2007
PURPOSE CPU Monitor Keyboard Mouse DeskJet
Printer
Network Laser Printer
Label / Artwork Printer
1 Sent for recycling 9 9 9 9 0 0 0
2 Thrown with general waste (Not recycled) 0 0 0 0 0 0 0
Total disposal 9 9 9 9 0 0 0
Estimated years old of disposed parts 4 4 4 4 NA NA NA
Table 7.8: The parts that were sent for recycling or dumped in the Production Department of Manufacturing Company #2.
Weight of one set of computer (desktop with CRT monitor):
=+++ 15.005.1153.8 24.5 kg
Total weight of computers that were disposed in the department (in 7 months):
=×95.24 220.5 kg
63
Possible weight of computers and printers disposed in the department (in a year):
378127
5.220=× kg
As expected, the calculated amount of weight that was disposed in the 7 months
period was a significant 220.5 kg and it will be a likely 378 kg in a year. This could
be even more considering that in a 2 months period, from the start of August to the
end of September, 3 computers were already awaiting disposal. This rate was 1.5
computers a month compared to 9 sets in 7 months which was 1.29 computers in a
month.
The estimated amount of disposal of computers and printers per employee in the
department was calculated to be 9 kg in a year. This was a big difference from the
company in the first case study which was 1.03 kg per employee per year. If this
rate was used to calculate the amount of disposal in the company, it would be an
enormous 12,600 kg of computers and printers disposed in a year. Again, in this
case, only computers and printers were considered and would be an even greater
amount when all kinds of used electronics were included.
Estimated weight of computers and printers disposed by an employee (in a year):
942
378= kg
Estimated weight of computers and printers disposed by 1400 employees in the
company (in a year):
600,1214009 =× kg
It was revealed by the Finance Department that S$800,000 of computers in the
company, excluding printers, valued at purchased price was scrapped in the year
2006. They were similarly collected by the contractor for recycling and these
computers were removed from the company’s account. These were computers used
by employees of the company in Singapore alone. In fact, all of these parts were out
of warranty. Most had passed their useful life and were of zero depreciated value. If
64

the average purchased price of a computer were taken to be S$3000, it meant that a
vast 266 number of computers were disposed.
An approximated weight of 266 computers:
517,62665.24 =× kg
This approximated total weight of disposal of computers in 2006 was however
lower than the approximation, 12,600 kg, based on the Production Department
replacement rate from January 2007 to July 2007. A list, updated in mid September
2007, of computers of the company for its operations in Singapore was provided by
the Finance Department as shown in Appendix B. Unfortunately, a list for printers
could not be obtained. There were a total of 634 computers. A count of the type of
computers showed that 165 were laptops and the rest 469 were desktops computers.
Laptops were 26 % of the total computers used. Laptops are increasingly popular
with business users and consumers because of their portability and these days,
laptops are capable of high performance as well.
Estimated percentage of replacement of computers in year 2006:
96.41100634266
=× %
A calculation showed that 41.96 % of computers were being replaced in the past
year, assuming that the total number of computers were the same as those in
September 2007. This indicated that upgrading of computers was not happening
only in the Production Department but also in most other departments of the
company. An observation made from the list of computers showed that there were
computer models with processor as old as Pentium or Pentium II which indicated
that they were at least 9 years old. Intel Pentium Processors and Pentium II
Processors were manufactured in 1993 and 1997 respectively. These could be
unused computers left unattended on the desk or in some corners of other
departments which do not see a need for replacement or a consideration for
recycling.
65

The different departments seemed to have a double standard of management of
these products. On the other hand, there were also new models with good
specifications. All these suggested that the company could be dealing with a big
mass of obsolete computers and resolving the problem that would likely take two
and a half years period based on the percentage of replacement seen in 2006.
Estimated weight of computers disposed by an employee (in year 2006):
655.41400
517,6= kg
Estimated average weight of computers disposed by an employee (from Jan 2006 to
Jul 2007):
83.62
9655.4=
+ kg
The calculation above shows the average weight of computers disposed by an
employee in a year was 6.83 kg. This figure was arrived at based on various
assumptions and the intention was to gain a fairer understanding at the constraint of
information provided. It was observed that this figure was more than 6 times of that
seen in the first case study. However, it was also noted from the studies that this
company was carrying out major upgrading of computers.
On the whole, the management of the computers and printers in the company was
generally very good. Purchasing of computers and printers seems rather strict in this
company based on the procedure observed. As for end of life management, they had
a contractor to take care of the used materials in the company which had all disposal
carried out in an intended safe manner. The engagement of a contractor proved
helpful for such a big company and especially so when there was a major
replacement of computers going on in the company. However, it was not clear what
additional processes were done by the contractor, besides sorting, before sending
the wastes to the respective recyclers.
One such service provider in Singapore which was found in the internet was Starpal
Pte Ltd but there was not much information mentioned on their website. In ensuring
66

safe disposals were carried out, it was hoped that the company did check out their
contractor prior to engaging them. Otherwise, the consequences would be damaging
if the large amount of hazardous wastes were not properly handled and not fully
sent for processing in a safe way.
7.5 Evaluation of Results
From the 2 case studies, an understanding was achieved of the various happenings
that were going on in the companies. Both companies had measures in place to take
care of unwanted computers and printers in their premises. They had appropriate
ways of disposal of these electronic wastes. The law had probably put a pressure on
them as well because they could not simply dump these wastes. These companies
focused were big, reputable and ISO 14001 certified ones. This could mean that
many other smaller companies in the industry do not have such standards of
electronic waste management. To achieve good waste management in the company,
it was observed from the case studies that it should be done with the right intention
and understanding.
From the case studies, some of the results obtained were used to relate to the overall
manufacturing sector to investigate the possible amount of electronic waste
contribution by computers and printers. A step was taken to further understand a
possible magnitude of generation of these electronic wastes in Singapore’s
industries as a whole. These were especially meaningful with the absence of official
data on electronic wastes from the government.
Table 7.9 shows the employment statistics for different sectors in Singapore with a
total of about 2.5 million in employment. Manufacturing industry’s employment
was a significant 20.7 % of the whole. These figures were useful in achieving the
results through the calculations shown.
67

Employment Statistics 2006 Employment as at Year-end (‘000) 2,495.90
Employment by Sector as at Year-end (%) 100
Manufacturing 20.7
Construction 10.2
Services 68.4
Others 0.7
(Source: Ministry of Manpower of Singapore, 2007)
Table 7.9: Employment Statistics for 2006.
Mean weight of computers and printers disposed by an employee (based on the 2
case studies):
93.32
83.603.1=
+ kg in a year
Estimated weight of computers and printers disposed in the manufacturing industry:
44.030,293.31090.495,2100
7.20 3 =×⎟⎠⎞
⎜⎝⎛ ×× tons in a year
Estimated weight of computers and printers disposed in all different industries in
Singapore:
( ) 89.808,993.31090.495,2 3 =×× tons in a year
The results from the 2 case studies were used to obtain an average amount of
computers and printers disposed by an employee in a year. In fact, with the different
stages of obsolesce in the two companies and a resulting different volumes of
replacements and waste generation, an average of the two would mean a more
balanced rate was achieved. As calculated, it was 3.93 kg in a year. The estimated
electronic waste contribution by computers and printers alone, in the manufacturing
industry, was a huge 2,030.44 tons in a year.
68

If all other industry sectors had the same rate of generation, there would be an
approximated 9,808.89 tons of waste computers and printers generated in a year in
the country. This was calculated to be 0.19 % of the 5.22 million tons of total waste
generated in 2006 (Ministry of the Environment and Water Resources of Singapore,
2007). It should be noted that this amount was a contribution by only computers and
printers and had yet to include those generation from the domestic.
It was expected that this amount would add up to be enormous when electronic
products of all kinds were considered. These products ranged from small MP3
players purchased by consumers to huge computer servers used in businesses.
Waste electronics like IC lead frames and PCBs generated in the course of
manufacturing were certainly a concern as well. The actual total volume of
electronic wastes generated in Singapore could well be 10 times this amount. This
would mean 2 % of the total wastes generated by the population in a year were
electronic wastes. It is therefore important that proper measures were in placed to
dispose electronic wastes in an environmentally sound manner.
7.6 Conclusions The case studies done were helpful in achieving some data for consideration and
understanding. Two different styles of waste management in a company were
observed and they were generally very good. Although limited information was
acquired from the companies and smaller scopes of studies were done, the results
achieved provided an opportunity to relate to Singapore as a whole and to obtain
various estimates as well.
The generation of electronic wastes is an ongoing process as long as the world
engages in technology. It was observed how the magnitude of these wastes would
add up in a company and in turn in the industries. It is therefore crucial that
regardless of the size and weight of the electronic wastes generated, proper disposal
should be carried out for all of these hazardous wastes.
69

Chapter 8: Survey of Consumers
8.1 Introduction
A survey was conducted aimed at understanding the behaviour and attitude of the
consumers towards electronic waste recycling. This included a study of the
workplace environmental policies of the consumers. Efforts were also made to
determine the extent of consumers’ current involvement in recycling and their
willingness to be involved in the future.
This chapter introduces the methodology of the survey and presents the results.
Problems are identified and discussed. And finally, conclusions are made about the
overall results and key findings of the survey are specified.
8.2 Methodology
The survey was conducted to understand the behaviour and attitude of the
consumers towards recycling of electronic waste in Singapore. Although the main
scope of study was on consumers, efforts were also made to understand the
environmental policies in the workplaces of the respondents. This allowed an
opportunity to find out what was the standard of environmental management
systems that were in place, in the industries, in particular if electronic wastes were
addressed.
The questionnaire created also included an attempt to find out the awareness of the
respondents on electronic waste recycling. The survey provided an understanding of
their perception of recycling in general as well. The structuring of the questions of
the survey was especially important to achieve an effective questionnaire that would
yield accurate and useful information from the respondents. This was done with
care and professional advice was sought for improvement.
70

The questionnaire was as shown in Appendix C and there were a total of 12
questions. A space was also included for other comments. This was especially
useful for respondents who had strong views regarding the topic. Tick boxes were
chosen for the answers as it was considered a helpful method for the respondents in
answering. In addition, it was a convenient and quicker way of responding. It was
noted that long surveys and written response questionnaires would normally result
in rejections when approached.
The consumers for the survey that were approached consist of family, relatives,
friends and colleagues. There were also strangers like shoppers who were
approached as well. This was intended to achieve a wider range of diverse opinions
from people of different backgrounds and age. The survey was conducted from 10
September 2007 to 7 October 2007 in Singapore. More responses were actually
intended to establish a better understanding but time was a constraint. Nevertheless,
75 responses were successfully received and constructive discussions are made in
the following sections. Majority of the data collection was conducted face to face
while only a few were done via emails. This was because it was felt that there was a
need for elaboration of the questions that will be helpful to the respondents in
providing the correct responses, therefore making the survey as productive and as
accurate as it can be.
8.3 Results and Observations of the Survey In this section, individual questions and results of the survey are discussed. The
answers of the 75 respondents are represented on charts. This provides a better
understanding which aided discussions and comparisons on the whole.
First of all, an understanding was established on what percentages of the different
age groups of the respondents were comprised of. Figure 8.1, shows that the
majority were from the younger age groups with 38 % from age group ‘21-30’ and
37 % from age group ‘31-40’. This was good as this majority were groups that are
possibly the most active in engagement in electronic products and their attitudes and
actions are important to achieve a high environmental outcome for electronic waste.
71

Age group of respondents
38%
37%
15%7% 3%
21-30 31-40 41-50 51-60 above 60
Figure 8.1: The percentage of the different age groups of the respondents.
One of the questions was to understand the job type of the respondents they were in.
The representation is shown in figure 8.2. This allowed an understanding on the
percentages of the different job types of the respondents were comprised of. This
was subsequently useful in analysing the results, understanding that a majority 64 %
worked in the manufacturing sector. There were 2 unemployed who formed 3 %
under ‘other’. They were noted to be the elderly who were also in the age group
‘above 60’.
It was thought that the job type would affect one’s attitude and actions towards
recycling of electronic waste. Similarly, in this survey, the overall results in each
targeted point of understanding could have a connection to the manufacturing sector
since it was the largest area that the respondents were employed in. Electronic
products like computers and printers are present in great numbers in businesses of
all nature, hence all workplace environmental policies and employees’ behaviour
are important to protect the environment as a whole. While virtually everyone is an
electrical and electronic product user, a good understanding of the value of
recycling of electronic waste should be spread throughout the industries and the
resident population.
72

Job type of respondents
64%5%
15%
9% 4% 3%
Manufacturing ConstructionFinancial / Business Services Transport and CommunicationsWholesale and Retail Trade Other
Figure 8.2: The different job types of the respondents.
The 73 respondents who were employed provided a chance to observe the standard
of the environmental management in the industries in general. 68 % of them
indicated that there was an environmental policy in their workplace. This was a
positive indication. The representation of the results is as shown in figure 8.3.
Environmental policy in the workplace?
Yes 68%
No5%
Not Sure27%
Figure 8.3: The percentage of the presence of environmental policy in the workplace.
A substantial 27 % were not sure if their company had such a policy. This should
not be the case. If a company have such a policy, it was of importance to spread the
policy to the employees at all levels hence making sure that everyone was aware of
73

it and acted accordingly. Conversely, it meant that the 27 % was more unlikely to
have an environmental policy in their workplace. While the remaining 5 %
confirmed with a ‘No’, an assumption could be made here to suggest negatively that
about 30 % had no environmental policy in their workplace.
Does this policy address electronic waste?
Yes43%
No0%
Not Sure57%
Figure 8.4: Percentage of policy that addressed electronic waste.
In figure 8.4, the percentage of policy that addressed electronic waste in the
workplace is shown. This chart representation was based on the 49 people, the 68 %,
who responded having an environmental policy in their workplace. However, only
43% among them were able to specify that their workplace environmental policy
did address electronic waste. None of them responded ‘No’.
It was discouraging to know that the majority, 57 %, were not sure about the
environmental policy in their workplace. Various methods could be used to ensure
employees’ awareness of the company’s environmental policy like through specific
training, signage and during orientation. These are some commonly used procedures
in companies to disseminate important information and they can be applied to
effectively spread environmental policy as well.
Figure 8.5 shows the respondents’ awareness about electronic waste recycling that
came about through the various sources. 75 responded and it was of concern that 16,
or rather 21 %, were not aware at all. Awareness can generally come from all
74

sources ranging from media to academic and more should be raised to ensure
consumers awareness of electronic waste recycling. None indicated it was the
manufacturer. It can be seen from this point that more efforts should come from the
manufacturer. After all, they are generators of electronic products and should be
responsible in doing its part by educating when their products were released in the
market.
26
10
0
14
9
16
0 5 10 15 20 25 30
Media / Campaigns
Academically
Manufacturers
Word of mouth
Workplace policy
Not aware at all
Awareness about electronic waste recycling came about through...
Figure 8.5: Source of awareness of electronic waste recycling.
A large number of them, 26 consumers, which were also 34.7 % of the total
indicated ‘Media / Campaigns’. This could perhaps be the best way as people from
all walks of life will be able to receive the related information. Another channel
could be to educate academically such that more in the society will be informed
through formal education. In this case, a relatively low 10 people indicated
‘Academically’. It was also discouraging that a few engineering graduates when
asked if their awareness came academically rejected and mentioned that their
courses did not cover such issues. ‘Workplace policy’ had a low 9 indications and
the remaining 14 came from word of mouth which probably was spread from those
who were more concerned about protecting the environment.
75

In the next figure 8.6, the various ways that the consumers chose to deal with
unwanted electronic products were represented on a pie chart. The responses
received were intended to be reflective of the most usual way that an individual
chose when there was an unwanted electronic product in the household. Among the
75 respondents, a large 37 % indicated ‘Dispose’ and most said they discarded
bulky items like computers by placing them next to general waste bins. This was
not beneficial as it meant that the electronic items will most likely not be recycled.
Ways of dealing with unwanted electronic products
37%
23%4%
16%
5%15%
Dispose Recycle Reuse Store it Donate Other
Figure 8.6: Ways of dealing with unwanted electronic products.
There was a considerable 16 % that indicated ‘Store it’. Some reasons given of why
they did not consider sending them for recycling were either that they were unaware
of the avenues and had left them unattended or that they simply kept them just in
case these items might come handy one day. 15 % that indicated ‘Other’ said that
their electronic items were usually replaced and sold before they were obsolete or
otherwise sold cheaply if there was not much demand for it. It was noted that
Singapore’s consumers have a high demand for new technological products which
resulted in a fast replacement rate and also a wide market for second hand products.
The remaining responses were positive indications which included ‘Recycle’,
‘Reuse’ and ‘Donate’. However, the total percentage of these 3 categories only
made up to be a small 32 %. This suggested a poor contribution by the consumers in
dealing with electronic wastes. It was noted that the respondents comprised of a
76

majority who were in the manufacturing sector, a 64 % among the 73 who were
employed. However, the results do not reflect that they knew the general
importance of handling hazardous wastes.
Efforts were also made to understand the attitude of the consumers towards buying
of electronic products. Figure 8.7 shows the results. 34 of them felt that the
reliability was the main concern. In environmental point of view, a reliable
electronic product will not breakdown easily thus helped in generating less harmful
wastes on overall. 19 chose ‘Energy saving accredited’ which respondents felt was
important as a cost cutting measure in electricity usage in their households. 2 said
that upgradeable features were important as it helped to prolong their electronic
products’ life span. This was helpful to the environment as longer life spans will
result in lesser quantity of products being used over the years therefore generating
less electronic wastes.
2
19
0
34
0
20
0 5 10 15 20 25 30 35
Upgradable features
Energy saving accredited
Made from recycled materials
Reliable
Can be recycled
Others
How does an electronic product affect your buying?
Figure 8.7: Attitude of respondents towards buying of electronic products.
There were also 20 who gave reasons under ‘Others’. Of the twenty, 12 said that the
design of the products was their main concern, 5 responded that they bought their
77

devices based on their functions and capabilities while 3 others chose their
purchases based on price. It was observed that none felt that electronic products that
can be easily recycled or made from recycled materials were of priority to them. It
was understandable since the range of ‘green’ electronic products is quite limited.
But as more are manufactured in the future, it was hoped that the responses will be
good so that less damage will be caused to the environment.
Figure 8.8 shows the bar chart of the results of the reasons that the consumers gave
for a past occasion which they did not recycle unwanted electronics. A large
number of them, 31, were not aware of the avenues. In fact, National Environment
Agency (NEA) had advised the residents to contact the Town Council for removal
services and there is also a list of companies on the internet that the residents may
contact.
0
31
30
0
11
3
0 5 10 15 20 25 30 35
Costly
Not aware of the avenues
Time consuming
Not worth the effort
Difficult to access
Not appplicable - recycle all the time
Do not recycle unwanted electronics mainly because it is...
Figure 8.8: Reasons for not recycling unwanted electronics.
There were 30 who felt that it was time consuming and 11 indicated that recycling
services were hard to access. Only 3 thought that they recycle all the time.
Fortunately, none felt it was not worth the effort and none indicated that it was
costly. It was noted that most recycling services were provided free of charge to the
78
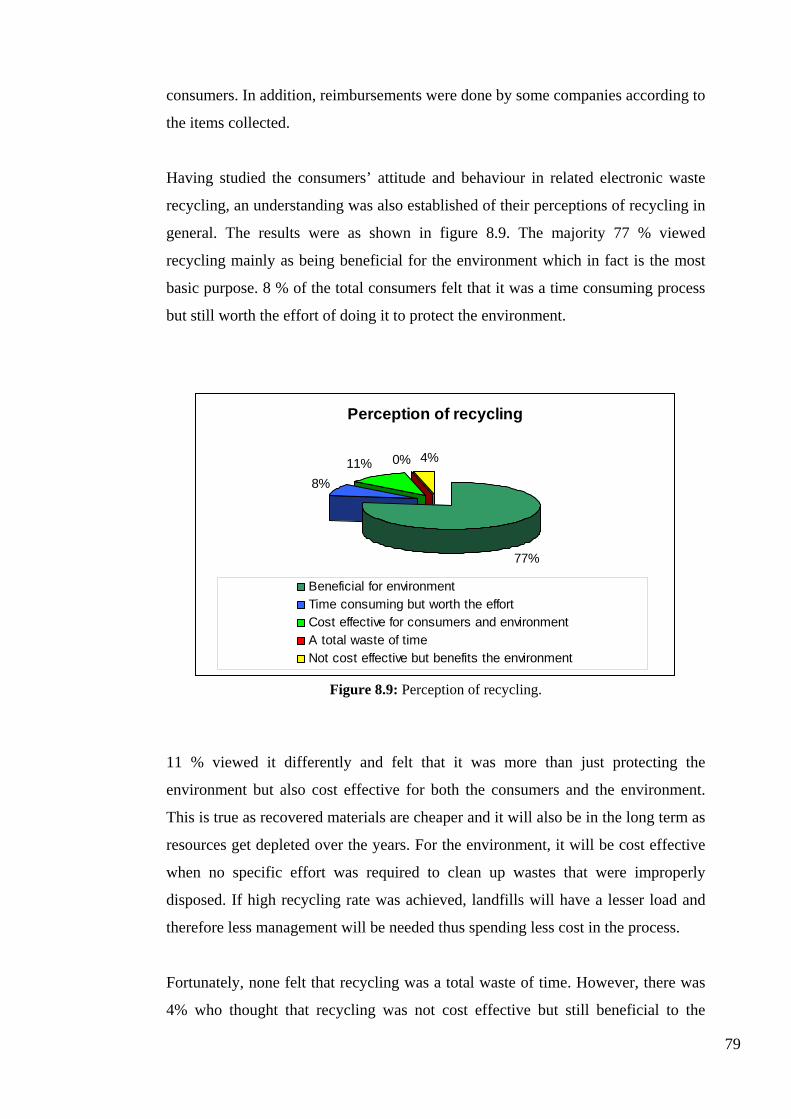
consumers. In addition, reimbursements were done by some companies according to
the items collected.
Having studied the consumers’ attitude and behaviour in related electronic waste
recycling, an understanding was also established of their perceptions of recycling in
general. The results were as shown in figure 8.9. The majority 77 % viewed
recycling mainly as being beneficial for the environment which in fact is the most
basic purpose. 8 % of the total consumers felt that it was a time consuming process
but still worth the effort of doing it to protect the environment.
Perception of recycling
77%
8%11% 0% 4%
Beneficial for environmentTime consuming but worth the effortCost effective for consumers and environmentA total waste of timeNot cost effective but benefits the environment
Figure 8.9: Perception of recycling.
11 % viewed it differently and felt that it was more than just protecting the
environment but also cost effective for both the consumers and the environment.
This is true as recovered materials are cheaper and it will also be in the long term as
resources get depleted over the years. For the environment, it will be cost effective
when no specific effort was required to clean up wastes that were improperly
disposed. If high recycling rate was achieved, landfills will have a lesser load and
therefore less management will be needed thus spending less cost in the process.
Fortunately, none felt that recycling was a total waste of time. However, there was
4% who thought that recycling was not cost effective but still beneficial to the
79

environment. It was noted that this is not true as even the recycling companies are
profiting in the process. It will be beneficial to the public if more information on
cost of recycling was reported through the media. In Section 5.3, electronic waste
recycling company Centillion’s profitable recycling business was observed.
In the next pie chart in figure 8.10, the views of the respondents regarding the
responsibility of the management of electronic waste were represented. It was
observed that a large 62 % of the consumers believed that the government has the
main responsibility. It was noted from this that the public had a strong dependence
on the government to deal with electronic waste. However, there was a 27 % who
assured that it is everyone’s responsibility and everyone has a part to play to deal
with electronic waste. It was observed that electronic waste has an association with
everyone: the government, the manufacturers and the consumers. Therefore, to
attain high environmental outcome for electronic waste, everyone is responsible and
has an own role to play and contribute.
Who should be responsible for managing electronic waste?
62%7%
27%
4%
Government Consumers Manufacturers Everyone
Figure 8.10: Responsibility for the management of electronic waste.
Only 7 % felt that the manufacturer who is the generator should be responsible
while 4 % responsibly put it on themselves to dispose end of life products in an
environmentally sound manner. It was noted that there was little pressure from the
consumers, the public, to put the responsibility on the manufacturers. This could
80
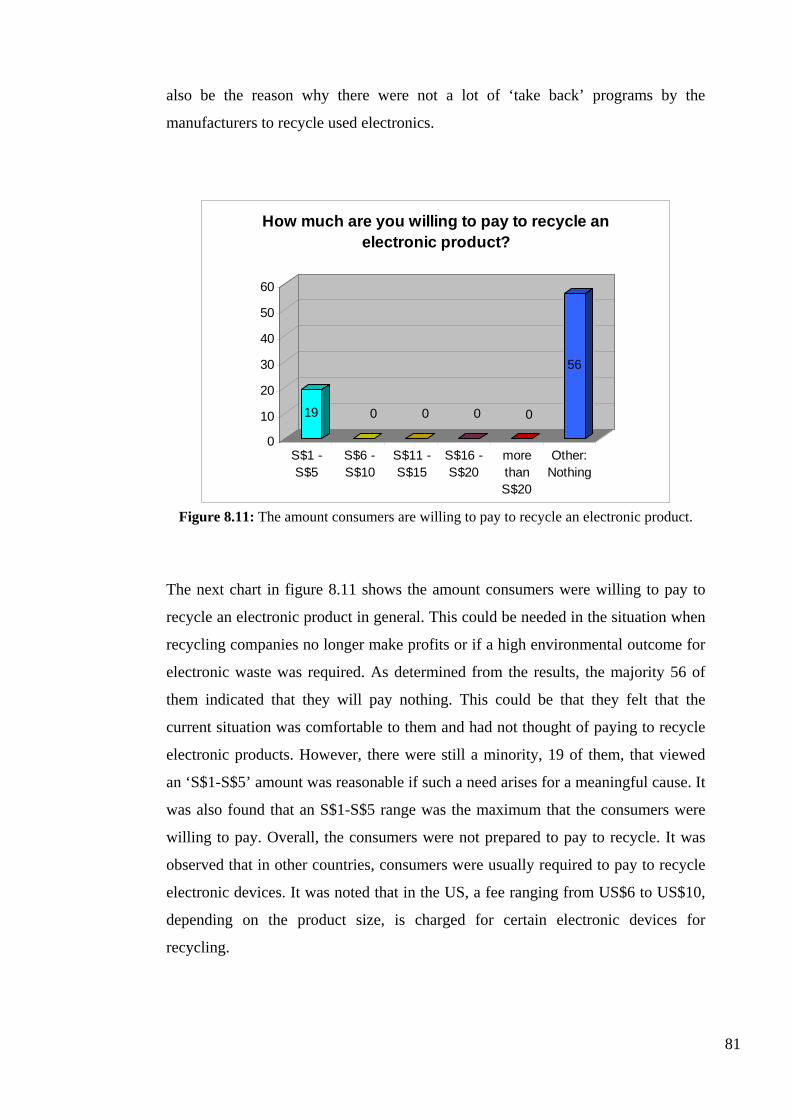
also be the reason why there were not a lot of ‘take back’ programs by the
manufacturers to recycle used electronics.
19 0 0 0 0
56
0
10
20
30
40
50
60
S$1 -S$5
S$6 -S$10
S$11 -S$15
S$16 -S$20
morethanS$20
Other:Nothing
How much are you willing to pay to recycle an electronic product?
Figure 8.11: The amount consumers are willing to pay to recycle an electronic product.
The next chart in figure 8.11 shows the amount consumers were willing to pay to
recycle an electronic product in general. This could be needed in the situation when
recycling companies no longer make profits or if a high environmental outcome for
electronic waste was required. As determined from the results, the majority 56 of
them indicated that they will pay nothing. This could be that they felt that the
current situation was comfortable to them and had not thought of paying to recycle
electronic products. However, there were still a minority, 19 of them, that viewed
an ‘S$1-S$5’ amount was reasonable if such a need arises for a meaningful cause. It
was also found that an S$1-S$5 range was the maximum that the consumers were
willing to pay. Overall, the consumers were not prepared to pay to recycle. It was
observed that in other countries, consumers were usually required to pay to recycle
electronic devices. It was noted that in the US, a fee ranging from US$6 to US$10,
depending on the product size, is charged for certain electronic devices for
recycling.
81

Finally, to round up the survey, an understanding of consumers’ willingness to be
more involved in recycling of electronic products in the future was achieved and
results were as shown in figure 8.12. Among the 75 respondents, 21 were certain
that they would be more involved in the next 5 years. The majority 51 were not very
sure but still though positively that they will probably be more involved. There were
also a small number, 3 of them, that indicated they do not know. On the whole,
consumers’ attitude towards recycling in the future was positive.
0
0
3
51
21
0 10 20 30 40 50 60
Definitely not
Probably not
Don't know
Probably yes
Definitely yes
Do you think you are likely to be more involved in recycling electronic products in
the next 5 years?
Figure 8.12: Consumers’ willingness to be involved in recycling in the future.
8.4 Key Findings and Recommendations
In the previous section, the questionnaire and the results that reflected the attitudes
and behaviours of the consumers were seen. From the consumers, information
relating to environmental policy in the workplace was also studied. The results were
represented on charts and subsequently discussed. From the results of the survey,
problems were identified and it was concluded that the various aspects relating to
recycling of electronic waste were generally unsatisfactory.
82

It was found that there were indications that workplaces lacked the presence of
environmental policy and also environmental policy that did not address electronic
waste. This was worsening by the fact that employers failed to ensure employees’
awareness of the presence of these policies which resulted in a considerable number
who were unsure of their workplace policies. Another area that lacked awareness
was regarding avenues to recycling services. This had probably caused the
consumers to dispose their electronic products with general waste and storing of
used equipment as well.
Although information on collectors of electronic waste was listed on NEA’s website,
these would probably be unavailable to the elderly as a majority of the elderly are
not computer users. More assistance should be provided to them to discard their
electronic products especially bulky items. This could probably start off by
distributing pamphlets in different languages to them and ensure their awareness on
electronic waste recycling. It was noted that there is a considerable number of the
senior residents who do not understand English.
Recycling of electronic products were reflected to be time consuming and difficult
to access by the consumers. This generally suggested that recycling was
inconvenient. It could be that collection points were far of access and could also be
that procedures were long and a hassle. It was pointed out by a few respondents that
there were no collection bins in the neighbourhood, like those for plastics, metal
and paper, where one could conveniently place their unwanted electronic products
in it. This could also be helpful to achieve a high recycling outcome of electronic
waste.
The overall consumers’ perception of recycling were very good which certainly is a
good starting point to do more by educating the consumers on the benefits of
recycling of electronic waste. It is important that the consumers understand the
harmful effects of electronic waste as well. This could also bring about less reliance
on the government to manage these wastes. Similarly, an aware consumer would
choose to purchase ‘greener’ electronic products or from companies who are active
in organising ‘take back’ programs for recycling. This will create a competition
among the manufacturers to achieve better environmental managements.
83

An overall good waste management will incur less cost hence the possibility of a
cost contribution from the consumers will be lessened. The outlook for the future in
managing electronic waste appeared to be good with a large majority of consumers
that indicated positively. This was encouraging and constant improvements in waste
managements were equally essential to achieve an overall high environmental
outcome.
8.5 Conclusions
The survey conducted had certainly provided a lot of information regarding the
attitudes and behaviours of the consumers, even though there were only 75
respondents. This would probably not be the accurate representation of the
population in Singapore. However, it definitely gave a chance to identify where
most of the problems are in electronic waste recycling.
The survey had also allowed an understanding on the workplace environmental
policies. It was meaningful to conduct the survey face to face which provided a
chance to interact with the consumers and to receive valuable opinions of the
current situation. On the whole, when everyone is equipped with a better
understanding on electronic waste recycling, it will be beneficial in attaining better
cooperation and coordination, between the government, the manufacturers and the
consumers and ultimately to achieve high recycling outcome for electronic waste.
84

Chapter 9: Conclusions
9.1 Introduction This chapter introduces the summary of the various achievements of the research
project done. Following that, recommendations are made for future work which
would be constructive as a follow up to the topic. And finally, the overall
conclusions are drawn for the research project.
9.2 Summary of Achievements
A literature review was done to understand the background of recycling of used
electronics. This included observations of the harmful effects of electronic wastes,
the growing problem of it which also noted the situations and problems happening
in other countries. An understanding was established on the benefits of recycling of
electronic wastes as well.
The information research was done thoroughly on Singapore’s authorities to find
specific data on electronic wastes and recycling of it but was in vain. There was no
available data on it. As such, broad data was used to understand the generation, the
disposal, the collection and the recycling of used electronics in the country.
Similarly, little data was available by the recycling companies therefore it did not
provide an adequate understanding on the collection, the processes which included
the resources used and effectiveness, the disposals and the various related costs.
The situations and systems were studied in other countries as well. This certainly
provided a wider understanding of the problems and managements. This was useful
in identifying better solutions which could be effective to address the used
electronics problems in Singapore. In fact, a thorough review of information in this
area should be made so as to achieve a better understanding, not only on the well
85

designed systems but also on the consequences and results of these systems in the
short and long term. However, time was the limiting factor in this case.
Case studies were conducted to understand the management used in handling of
used electronics in the companies. This had helped to observe the practices made
and the identification of problems in a company. The results of the case studies
were used to understand the rate and magnitude of used electronics that could be
generated in a company and in turn in the industries as a whole.
A survey of consumers was carried out which mainly focused in understanding the
attitudes and behaviours of the consumers. This had helped to identify the problems
faced in the community to which used electronics were not actively recycled. The
survey also touched on the workplace environmental policies which gave an
understanding of the possible standard of waste managements in the industries.
9.3 Recommendations for Future Work
As various limiting factors were encountered during the course of this research
project, the following recommendations for future work can be carried out.
From the observations made in the process of recycling of electronic waste in the
companies, there are indications that the material recovery processes, that is the
chemical processes, could probably be energy intensive and usage of toxic
chemicals are definitely included. The processes are complex and it would be
constructive if an environmental impact assessment were done on the recycling
processes to investigate if it is energy and resource exhaustive and ultimately
whether it is worthwhile to recover materials with such processes.
The case studies made only covered a very small range of electronic products, that
is computers and printers, and it did not cover electronics materials that were
generated in the course of manufacturing by electronics manufacturers. A study
could be made particularly on these materials as they can amount in very large
quantities in the factories. This would also include an attempt to find out the
86

practices carried out by manufacturing companies in handling them and also the
related environmental concerns.
9.4 Final Conclusions
On the overall, the research project was able to meet most of the objectives set. It
was able to identify the various problem areas of recycling of used electronics in
Singapore and understand the related environmental concerns.
Literature researches conducted have broadened the understanding and were useful
in analysing and improving the situation. Understanding the various recycling
processes of electronic waste had made the study more complete. Through checking
local practices has helped to identify the related problem areas and understand the
need for improvements.
Case studies done were although limited had helped to establish an understanding of
the practices of the manufacturers in Singapore. The survey of consumers was
meaningful as it gave an insight understanding of the related problems faced in the
community. The various observations made in this research project had enabled
constructive suggestions for improvement for the community in future handling of
the issue.
87

List of References
Computer TakeBack Campaign 2007, ‘The Problem’, viewed 25 October 2007, <http://www.computertakeback.com/the_problem/index.cfm> Telefonica, Marta and David 2006, Mountains of Electronic Waste, October 2006, p.4-5, viewed 25 October 2007, <http://www.telefonica.es/corporateresponsibility/pdfs/residuoselectronicos_eng.pdf> Young P et al. 1997, Manufacturing and the Environment, The International Journal of Advanced Manufacturing Technology, July 1997, Volume 13, Number 7, pp. 488-493, <http://www.springerlink.com/content/h365175rl1624781/?p=58639d2b4e4e48168dacb9b484dc157a&o=0> Earth 911, 2007, ‘Computers and the Environment’, Computers, viewed 25 October 2007, <http://earth911.org/blog/2007/04/12/computers-the-environment/> Palo Alto 2005, Hewlett-Packard (HP), ‘HP helps consumers dispose of e-waste with 50 percent off hardware recycling’, New release, viewed 25 October 2007, <http://www.hp.com/hpinfo/newsroom/press/2005/050421b.html?jumpid=reg_R1002_USEN> Australian Bureau of Statistics 2006, Australia’s Environment Issues and Trends 2006, 10 November 2006, pp. 28-29, p.60, viewed 27 October 2007, <http://www.ausstats.abs.gov.au/ausstats/subscriber.nsf/0/5BC32E8955FEF5E3CA2572210019AF02/$File/46130_2006.pdf> Askiner and Surendra, 1998, Issues in environmentally conscious manufacturing and product recovery, 15 September 1998, p.6, viewed 25 October 2007, <http://www1.coe.neu.edu/~smgupta/CAIESURV.pdf> The Basel Action Network and Silicon Valley Toxics Coalition, 2002, Exporting Harm, The High-Tech Trashing of Asia, February 2002. LEADOUT Newsletter 2005, Collective Research Project in the 6th Outline Research Programme of the European Union, 2005, No.2. Statistics Singapore 2007, ‘Key Annual Indicators’, Statistics, viewed 30 September 2007, < http://www.singstat.gov.sg/stats/keyind.html#popnarea> Ministry of Trade and Industry of Singapore 2006, Economic Survey of Singapore Second Quarter 2006, August 2006, pp. 30-31, viewed 12 April 2007, <http://app.mti.gov.sg/data/article/4201/doc/ESS_2006Q2_Full%20Report.pdf>
88

Infocomm Development Authority of Singapore 2007, Annual Survey on Infocomm Industry for 2006, August 2007, pp. 1-6, viewed 10 September 2007, <http://www.ida.gov.sg/doc/Publications/Publications_Level2/20061205092557/ASInfocommIndustry06.pdf> Infocomm Development Authority of Singapore 2007, 2006 Annual Survey on Infocomm Usage in Households and by Individuals – Key Findings, March 2007, pp. 1-5, viewed 10 September 2007, <http://www.ida.gov.sg/doc/Publications/Publications_Level2/2006_hh_exec%20summary.pdf> Ministry of the Environment and Water Resources, Singapore, 2007, Key Environmental Statistics 2007, pp. 6-7, viewed 10 September 2007, <http://app.mewr.gov.sg/data/images/M1_KES_2007.pdf> Ministry of the Environment and Water Resources, Singapore, 2006, The Singapore Green Plan 2012 (2006 Edition), February 2006, pp. 40-49, viewed 23 April 2007, <http://www.mewr.gov.sg/sgp2012/index_2006.htm> Teh Joo Lin, 2007, ‘Ban on Import of Used Goods’, The Straits Times, Singapore, 19 April 2007, p. 6. Infocomm Development Authority of Singapore, 5 October 2007, ‘Overview of IDA’, About Us, Home, viewed 6 October 2007, <http://www.ida.gov.sg/About%20us/20060406102431.aspx> National Environment Agency 2007, ‘Collectors / Traders for Recyclables’, Waste Minimisation, Environment Information, viewed 21 October 2007, <http://app.nea.gov.sg/cms/htdocs/article.asp?pid=1467> National Environment Agency 2007, ‘Disposal of Bulky Items, Garden Wastes and Dead Pets’, Special Waste Disposal, Environment Information, viewed 21 October 2007, <http://app.nea.gov.sg/cms/htdocs/category_sub.asp?cid=76> National Environment Agency 2007, ‘Recycling Programmes’, Waste Minimisation, Environment Information, viewed 24 October 2007, <http://app.nea.gov.sg/cms/htdocs/article.asp?pid=2306> Hewlett Packard (HP) 2007, ‘Hardware Recycling’, Return and Recycling, Singapore, viewed 24 October 2007, <http://h50055.www5.hp.com/ipg/supplies/recycling/hardware/sg/index.asp?jumpid=reg_R1002_SGEN> Centillion Environment & Recycling Limited 2007, Corporate Fact Sheet, Background, 2007, p.1, viewed 24 October 2007, <http://www.centillion-er.com/i/Centillion_Factsheet.pdf> Centillion Environment & Recycling Limited 2007, ‘Technology’, viewed 24 October 2007, <http://www.centillion-er.com/technology.htm>
89

Centillion Environment & Recycling Limited 2007, Annual Report 2006, 2007, p.11, viewed 24 October 2007, <http://www.centillion-er.com/news/fin_rpt_centillion2006.pdf > R2 Japan 2007, ‘Technology’, Solution, viewed 25 October 2007, <http://www.r2japan.com/sol_technology.html> CH E-Recycling Pte Ltd, 2007, ‘Operational Flow Chart’, Services, viewed 25 October 2007, <http://www.che.com.sg/services_chart.htm> UOB Kay Hian Research 2006, Enviro-Hub Holdings: The Alchemy of E-Waste, UOB Kay Hian Research Pte Ltd, Singapore, 5 December 2006, pp.1-4. Regional Computer Recycling & Recovery 2007, ‘Government Regulations’, Recycling, viewed 27 October 2007, <http://www.ewaste.com/regulations.php> Ministry of the Environment and Water Resources, Singapore, 2006, The Singapore Green Plan 2012 (2006 Edition), February 2006, pp. 40-49, viewed 23 April 2007, <http://www.mewr.gov.sg/sgp2012/index_2006.htm> Australian Bureau of Statistics 2006, Australia’s Environment Issues and Trends 2006, 10 November 2006, pp. 28-29, viewed 27 October 2007, <http://www.ausstats.abs.gov.au/ausstats/subscriber.nsf/0/5BC32E8955FEF5E3CA2572210019AF02/$File/46130_2006.pdf> Environment Victoria 2005, Environmental Report Card on Computers 2005, June 2005, p.5, p.32, viewed 27 October 2007, <http://www.envict.org.au/file/Computer_waste_finalversion.pdf> Department of Environment and Conservation (NSW) 2005, Report on the implementation of the NSW Extended Producer Responsibility Priority Statement 2004, September 2005, p.5, p.34-35, viewed 25 April 2007. Department of Environment and Conservation (NSW) 2006, NSW Extended Producer Responsibility Priority Statement 2005-06, March 2006, pp. 5-7, viewed 27 October 2007, <http://www.environment.nsw.gov.au/resources/2005624_prioritystatement2005_06.pdf> Computer TakeBack Campaign 2007, ‘Producer Responsibility as a Policy Solution’, Producer Responsibility, viewed 27 October 2007, <http://www.e-takeback.org/docs%20open/Toolkit_Legislators/EPR/EPR_main.htm> Product Stewardship Australia 2007, ‘A first for electronics stewardship in Australia’, Home, viewed 27 October 2007, <http://www.productstewardship.asn.au/> Product Stewardship Australia and CESA, 2006, Inquiry into Waste Generation and Resource Efficiency, 8 February 2006, p.2, viewed 15 May 2007.
90

Fujitsu, 2007, ‘LifeBook C1410 – Detailed Specs’, C1410, Personal Computers, Computing Products, viewed 16 October 2007, <http://www.fujitsu.com/sg/services/computing/pc/notebooks/cseries/c1410/specs.html> Fujitsu, 2007, ‘ESPRIMO P5100 – Detailed Specs’, P5100, Personal Computers, Computing Products, viewed 16 October 2007, <http://www.fujitsu.com/sg/services/computing/pc/desktops/p5100/specs.html> Canon, 2007, ‘PIXMA iP1800’, Photo Inkjet Printers, Printers, Consumer Products Home, viewed 16 October 2007, <http://www.usa.canon.com/consumer/controller?act=ModelInfoAct&fcategoryid=184&modelid=14991> HP, 2007, ‘HP LaserJet P2015dn Printer’, LaserJet Printers, viewed 16 October 2007, <http://www.shopping.hp.com/webapp/shopping/product_detail.do?storeName=storefronts&landing=printers&category=laserjets&subcat1=&catLevel=1&product_code=CB368A%23ABA&tab=detailed_specs#defaultAnchor> Samsung, 2007, ‘720N specifications’, LCD monitor, monitor, computer and peripherals, viewed 16 October 2007, <http://www.samsung.com/sg/consumer/detail/spec.do?group=computerperipherals&type=monitor&subtype=lcdmonitor&model_cd=LS17MJVKB/XSS> ViewSonic, 2007, ‘E70B CRT Monitor Specifications’, CRT Monitors, Products, viewed 16 October 2007, <http://www.viewsonic.com/products/crtmonitors/e2series/E70B/#specs> Ministry of Manpower of Singapore, 2007, ‘Employment’, Statistics, Manpower Research and Statistics, Home, viewed 19 October 2007, <http://www.mom.gov.sg/publish/momportal/en/communities/others/mrsd/statistics/Employment.html> Starpal Pte Ltd, 2007, ‘Used materials collections’, Services, viewed 19 October 2007, <http://www.starpal.com.sg/01813318p2.htm> Intel Corporation, 2007, ‘Microprocessor Hall of Fame’, Online Exhibits, Intel Museum, viewed 19 October 2007, <http://www.intel.com/museum/online/hist_micro/hof/index.htm> National Environment Agency 2007, ‘Collectors / Traders for Recyclables’, Waste Minimisation, Environment Information, viewed 21 October 2007, <http://app.nea.gov.sg/cms/htdocs/article.asp?pid=1467> National Environment Agency 2007, ‘Disposal of Bulky Items, Garden Wastes and Dead Pets’, Special Waste Disposal, Environment Information, viewed 21 October 2007, <http://app.nea.gov.sg/cms/htdocs/category_sub.asp?cid=76>
91

Lenovo 2007, ‘Product recycling programs’, United States, viewed 22 October 2007, <http://www.pc.ibm.com/ww/lenovo/about/environment/ptb_us.html> Planning Division 2006, Key Environmental Statistics 2006, Ministry of the Environment and Water Resources, Singapore, February 2006, pp. 8-10. Lim Yee Hung, 2007, ‘Go green when junking gadgets’, The Straits Times – Digital Life, Singapore, 10 April 2007, pp.12-13. Radio Singapore International, 3 November 2004, ‘Semakau Landfill – Waste Disposal in Singapore’, Assignment, View, viewed 23 April 2007, <http://www.rsi.sg/english/assignment/view/20041103175327/1/.html>. Catherine Day, May 2005, Frequently Asked Questions on Directive 2002/95/EC on the Restriction of the Use of certain Hazardous Substances in Electrical and Electronic Equipment (RoHS) and Directive 2002/96/EC on Waste Electrical and Electronic Equipment (WEEE), Directorate-General Environment, European Commission, February 2006, pp.6-8. UOB Kay Hian Research 2006, Enviro-Hub Holdings: The Alchemy of E-Waste, UOB Kay Hian Research Pte Ltd, Singapore, 5 December 2006, pp.1-12. Palo Alto, 21 April 2005, ‘HP Helps Consumers Dispose of "e-Waste" with 50 Percent Off Hardware Recycling’, HP Newsroom, News Releases, viewed 3 May 2007,<http://www.hp.com/hpinfo/newsroom/press/2005/050421b.html?jumpid=reg_R1002_USEN> Daphne Lee, 2007, ‘Waste recycler chips in to save the earth’, The Straits Times – Special, Singapore, 28 March 2007, p.12. The Salvation Army, 2007, ‘Red Shield Industries’, Singapore, Thrift Stores, viewed 3 May 2007, <http://www1.salvationarmy.org/smm/www_smm_singapore.nsf/vw-dynamic-index/8B3A444B55F54D0A8025712A000D8BA3?openDocument> Earth 911, 2007, ‘Computers and the Environment’, Computer Recycling and Reuse, Electronics Recycling, viewed 6 May 2007, <http://www.earth911.org/master.asp?s=lib&a=electronics/comp_environment.asp> CH E-Recycling Pte Ltd, 2007, ‘Operational Flow Chart’, Services, viewed 6 May 2007, <http://www.che.com.sg/services_chart.htm> National Environment Agency, 2007, ‘Frequently Asked Questions’, Waste Minimisation, Environment Information, viewed 10 May 2007, <http://app.nea.gov.sg/cms/htdocs/article.asp?pid=1470> Cimelia Resource Recovery Pte Ltd, 2005, ‘Our Services’, Home, viewed 10 May 2007, <http://www.cimeliaglobal.com/index2.php>
92

Bibliography
Environmental Product Declarations 2007, Certified Environmental Product declaration – LG.Philips LCD, October 2004, pp.1-5, viewed 12 October 2007, <http://www.environdec.com/reg/e_epd95.pdf> Kyocera, 2006, Business e-Waste Survey Results, June 2006, pp. 2-11, viewed 21 October 2007, <http://kyoceramita.com.au/files/1/Kyocera%20e-waste%20report%202006%20FINAL.pdf> Ipsos, 2005, Household Electrical & Electronic Waste Survey 2005, September 2005, pp. 45-62, viewed 21 October 2007, <http://www.environment.nsw.gov.au/resources/spd060220_ewaste_ipsosreport.pdf>
93

Appendix A – Project Specification
94

University of Southern Queensland Faculty of Engineering and Surveying
ENG4111 / 4112 Research Project PROJECT SPECIFICATION
FOR: TAN Heng Tsin Stanley TOPIC: Recycling of Used Electronics in Singapore SUPERVISOR: David Parsons SPONSORSHIP: Own PROJECT AIM: The project aims to understand the problem of recycling of
used electronics in Singapore and the related environmental concerns.
PROGRAMME: Issue B, 18 Oct 2007 1. Understand the local recycling of used electronics through recycling
companies and the National Environment Agency. 2. Identify specific problem areas and subsequent opportunities for improvement.
This will include an attempt to evaluate what proportion of used electronics is currently recycled.
3. Investigate the effectiveness of recycling processes of used electronics and in
particular the problems of collection. 4. Conduct a survey of consumers and, if possible, industry people, to determine
the extent to which they are involved now in recycling or would be willing to be involved in the future.
5. Research information on global recycling of used electronics through reviewing
published materials and relating good systems to local situation. 6. Conduct case studies on companies to illustrate the management used in
handling used electronics and relating the various problems to Singapore as a whole.
7. Critically assess current Singaporean practice and recommend actions for the
future handling of the issue. 8. Write and submit a dissertation. As time permits: 9. Research information on ISO14000 management standards for organisations, in
particular the handling of electronic waste. AGREED: __________________ (Student) __________________ (Supervisor) _____ / _____ / _____ _____ / _____ / _____ Co-examiner: __________________
95

Appendix B – List of Computers of Manufacturing Company #2
96
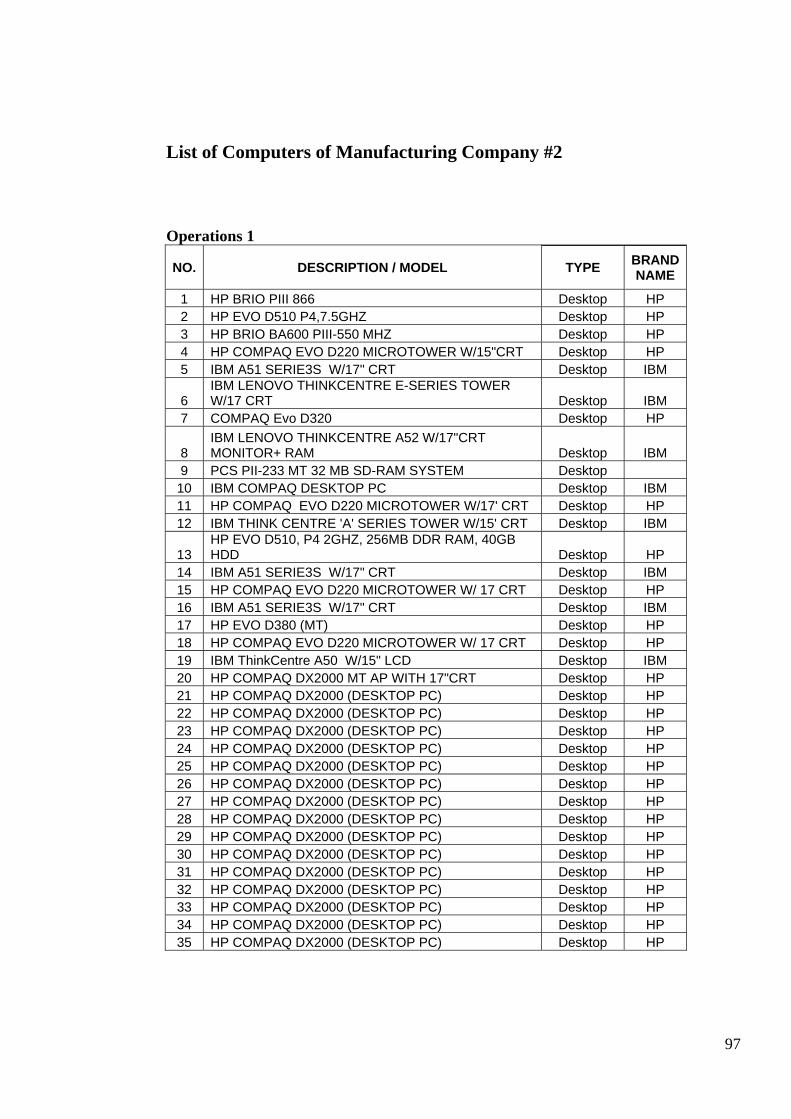
List of Computers of Manufacturing Company #2
Operations 1
NO. DESCRIPTION / MODEL TYPE BRAND NAME
1 HP BRIO PIII 866 Desktop HP 2 HP EVO D510 P4,7.5GHZ Desktop HP 3 HP BRIO BA600 PIII-550 MHZ Desktop HP 4 HP COMPAQ EVO D220 MICROTOWER W/15"CRT Desktop HP 5 IBM A51 SERIE3S W/17" CRT Desktop IBM
6 IBM LENOVO THINKCENTRE E-SERIES TOWER W/17 CRT Desktop IBM
7 COMPAQ Evo D320 Desktop HP
8 IBM LENOVO THINKCENTRE A52 W/17"CRT MONITOR+ RAM Desktop IBM
9 PCS PII-233 MT 32 MB SD-RAM SYSTEM Desktop 10 IBM COMPAQ DESKTOP PC Desktop IBM 11 HP COMPAQ EVO D220 MICROTOWER W/17' CRT Desktop HP 12 IBM THINK CENTRE 'A' SERIES TOWER W/15' CRT Desktop IBM
13 HP EVO D510, P4 2GHZ, 256MB DDR RAM, 40GB HDD Desktop HP
14 IBM A51 SERIE3S W/17" CRT Desktop IBM 15 HP COMPAQ EVO D220 MICROTOWER W/ 17 CRT Desktop HP 16 IBM A51 SERIE3S W/17" CRT Desktop IBM 17 HP EVO D380 (MT) Desktop HP 18 HP COMPAQ EVO D220 MICROTOWER W/ 17 CRT Desktop HP 19 IBM ThinkCentre A50 W/15" LCD Desktop IBM 20 HP COMPAQ DX2000 MT AP WITH 17"CRT Desktop HP 21 HP COMPAQ DX2000 (DESKTOP PC) Desktop HP 22 HP COMPAQ DX2000 (DESKTOP PC) Desktop HP 23 HP COMPAQ DX2000 (DESKTOP PC) Desktop HP 24 HP COMPAQ DX2000 (DESKTOP PC) Desktop HP 25 HP COMPAQ DX2000 (DESKTOP PC) Desktop HP 26 HP COMPAQ DX2000 (DESKTOP PC) Desktop HP 27 HP COMPAQ DX2000 (DESKTOP PC) Desktop HP 28 HP COMPAQ DX2000 (DESKTOP PC) Desktop HP 29 HP COMPAQ DX2000 (DESKTOP PC) Desktop HP 30 HP COMPAQ DX2000 (DESKTOP PC) Desktop HP 31 HP COMPAQ DX2000 (DESKTOP PC) Desktop HP 32 HP COMPAQ DX2000 (DESKTOP PC) Desktop HP 33 HP COMPAQ DX2000 (DESKTOP PC) Desktop HP 34 HP COMPAQ DX2000 (DESKTOP PC) Desktop HP 35 HP COMPAQ DX2000 (DESKTOP PC) Desktop HP
97

Operations 1 (continue) 36 HP COMPAQ DX2000 (DESKTOP PC) Desktop HP 37 HP COMPAQ DX2000 (DESKTOP PC) Desktop HP 38 HP COMPAQ DX2000 (DESKTOP PC) Desktop HP 39 HP COMPAQ DX2000 (DESKTOP PC) Desktop HP 40 HP COMPAQ DX2000 (DESKTOP PC) Desktop HP 41 HP COMPAQ EVO D220 MICROTOWER W/ 17 CRT Desktop HP 42 HP COMPAQ EVO D220 MICROTOWER W/ 17 CRT Desktop HP 43 COMPRO P5-200MMX CPU/PRNTR Desktop 44 VISION VRIO PII -300A CELERON Desktop 45 INTEL PENTIUM NOTEBK WITH MODEM Laptop 46 LAPTOP - HP OMNIBOOK XE2-PIII-500MHZ Laptop HP 47 LAPTOP - HP OMNIBOOK XE2-PIII-500MHZ Laptop HP 48 IBM THINKPAD T42 Laptop IBM 49 IBM Thinkpad R-Series 128MB Flask Disk Laptop IBM 50 HP BRIO INTEL PIII-700MHZ Desktop HP 51 IBM THINKCENTRE A51 SERIES TOWER W/17'" CRT Desktop IBM 52 IBM THINKPAD Laptop IBM 53 HP COMPAQ NX8220 Laptop HP 54 HP COMPAQ EVO D220 MICROTOWER W/17' CRT Desktop HP 55 WILLS PRO P111 450/64 Desktop 56 IBM ThinkCentre "A" Series Tower w/15"TFT Desktop IBM 57 LAPTOP -COMPAQ PRESARIO 1508 Laptop HP 58 HP COMPAQ EVO D220 MICROTOWER Desktop HP 59 IBM THINKCENTRE "A" SERIES TOWER W/15' CRT Desktop IBM 60 IBM NETVISTA A40 DESKTOP C/W IBM 17" MONITOR Desktop IBM
61 DESKTOP PC - THINKCENTRE E50 TOWER W/17 CRT Desktop IBM
62 IBM THINKCENTRE "A" SERIES TOWER W/14' CRT Desktop IBM 63 IBM THINKPAD R52 Laptop IBM 64 IBM THINKCENTRE "A" SERIES TOWER W/17' CRT Desktop IBM 65 IBM THINKCENTRE A51 SERIES TOWER Desktop IBM 66 NOTEBOOK-IBM LENOVO THINKPAD T43, 2668-AY6 Laptop IBM 67 HP EVO D220 MICROTOWER WITH 17" CRT Desktop HP 68 HP BRIO BA600 PIII-550MHZ Desktop 69 COMPAQ EVO D220 MICRO TOWER Desktop HP 70 COMPAQ EVO D220 MICROTOWER Desktop HP 71 IBM THINKCENTRE A50 SERIES TOWER W/17' CRT Desktop IBM
72 DESKTOP-IBM LENOVO THINKCENTRE A52+17"CRT MONITOR Desktop IBM
73 COMPRO P90 SYSTEM (CEO1687) Desktop HP 74 HP VECTRA VL420 Desktop HP 75 IBM LENOVO THINKCENTRE A52,8297-A53 Desktop IBM 76 IBM LENOVO THINKCENTRE A52,8297-A53 Desktop IBM 77 IBM LENOVO THINKCENTRE A52,8297-A53 Desktop IBM 78 HP COMPAQ EVO D220 MICROTOWER W/ 17 CRT Desktop HP 79 HP VECTRA VL420 Desktop HP 80 HP COMPAQ EVO D220 MICROTOWER Desktop HP
98

Operations 1 (continue)
81 HP COMPAQ EVO D220 MICROTOWER Desktop HP 82 HP COMPAQ EVO D220 MICROTOWER Desktop HP 83 HP COMPAQ EVO D220 MICROTOWER Desktop HP 84 HP COMPAQ DX2000 MT W/LCD Desktop HP
85 IBM THINK CENTRE A30 MICROTOWER W/17 TFT MONITOR Desktop IBM
86 HP PCD220/MICRO-ATX TOWER MODEL Desktop HP 87 HP BRIO BA410 PIII-733MHZ Desktop HP 88 IBM THINKCENTRE A SERIES W/ 15" CRT Desktop IBM 89 HP COMPAQ DX2000 MT W/17'' TFT Desktop HP 90 HP COMPAQ NX5000 Desktop HP 91 IBM THINKCENTRE A30-MICRO TOWER Desktop HP 92 IBM A51 TOWER W/17" CRT MONITOR Desktop IBM 93 COMPRO 485 CPU(CEO1727) Desktop 94 P5-75MIT CPU(CEO1783) Desktop 95 EVO 380MX MICRO TOWER FACTOR COMPUTER Desktop HP
96 IBM LENOVO THINKCENTRE E-SERIES TOWER W/17 CRT Desktop IBM
97 IBM A51 SERIES TOWER W/17" TFT MONITOR Desktop IBM 98 DESKTOP-DX2100 MT MODEL (3YRS, NBD ONSITE) Desktop HP
99 IBM LENOVO THINKCENTRE A52 W/17"CRT MONITOR+ RAM Desktop IBM
100 IBM LENOVO THINKCENTRE A52 W/17"CRT MONITOR+ RAM Desktop IBM
101 IBM THINK CENTRE 'A' SERIES TOWER W/ 15' CRT Desktop IBM 102 HP COMPAQ EVO D220 MICROTOWER W/17' CRT Desktop HP 103 HP COMPAQ EVO D220 MICROTOWER W/17' CRT Desktop HP 104 EVO 380MX MICRO TOWER FACTOR COMPUTER Desktop HP 105 EVO 380MX MICRO TOWER FACTOR COMPUTER Desktop HP 106 EVO 380MX MICRO TOWER FACTOR COMPUTER Desktop HP 107 IBM THINKCENTRE A50 SERIES TOWER W/17' CRT Desktop IBM 108 EVO 380MX MICRO TOWER FACTOR COMPUTER Desktop HP 109 IBM THINKPAD T43 (NOTEBOOK) Laptop IBM 110 HP BRIO PIII866 Desktop HP 111 HP COMPAQ EVO D220 MICROTOWER Desktop HP 112 IBM THINKCENTRE A SERIES Desktop
113 IBM LENOVO THINKCENTRE E-SERIES TOWER W/17 CRT Desktop IBM
114 IBM A51 TOWER W/17" CRT MONITOR Desktop IBM 115 IBM A51 SERIE3S W/17" CRT Desktop IBM 116 HP BRIO BA410 PIII-733MHZ Desktop HP 117 HP COMPAQ EVO D220 MICROTOWER Desktop HP
118 IBM LENOVO THINKCENTRE E-SERIES TOWER W/17 CRT Desktop IBM
119 IBM LENOVO THINKCENTRE A52 W/17"CRT MONITOR+ RAM Desktop IBM
120 IBM ThinkPad T42 Laptop IBM 99

Operations 1 (continue) 121 HP COMPAQ EVO D220 MICROTOWER Desktop HP 122 EVO 380MX MICRO TOWER FACTOR COMPUTER Desktop HP 123 HP PII-300 MULTIMEDIA SYSTEM Desktop 124 HP EVO D220 COMPUTER(DESKTOP) Desktop HP 125 HP COMPAQ EVO D220 MICROTOWER(W/ 15" CRT) Desktop HP 126 HP COMPAQ EVO D220 MICROTOWER W/ 17 CRT Desktop HP 127 HP COMPAQ EVO D1220 MICROTOWER W/15 CRT Desktop HP 128 HP BRIO BA410 PIII-733MHZ Desktop HP
129 NOTEBOOK-IBM LENOVO X60 T2400+UPGRADE RAM,WARRANTY Laptop IBM
130 NOTEBOOK Laptop 131 HP COMPAQ EVO D220 MICROTOWER W/ 17" CRT Desktop HP 132 HP BRIO PIII 866 Desktop HP 133 HP BRIO PIII 866 Desktop HP 134 HP BRIO BA600 PIII-550MHZ Desktop HP 135 HP PC D220 P IV-2.4Ghz Desktop HP 136 HP COMPAQ EVO D220 MICROTOWER Desktop HP 137 HP COMPAQ EVO D220 MICROTOWER W/17' CRT Desktop HP 138 DESKTOP - IBM LENOVO THINKPAD R(52) SERIES Laptop IBM 139 DELL INSPIRON 7500 LAPTOP Laptop Dell 140 HP VECTRA VL420 - ROBERT TAY Desktop HP 141 IBM THINKPAD R SERIES Laptop IBM 142 COMPAQ N800V NOTEBOOK Laptop HP 143 HP COMPAQ EVO D220 MICROTOWER Desktop HP 144 IBM THINKCENTRE "A" SERIES TOWER W/15' CRT Desktop IBM
145 HP COMPAQ EVO D220 MICROTOWER(W/ 15 CRT MONITOR) Desktop HP
146 IBM LENOVO THINKCENTRE E50 TOWER 17" TFT MONITOR+ Desktop IBM
147 HP COMPAQ EVO D220 MICROTOWER W/17' CRT Desktop HP 148 IBM THINK CENTRE 'A' SERIES TOWER W/ 15' CRT Desktop IBM 149 HP COMPAQ EVO D220 MICROTOWER Desktop HP 150 WILLS PRO 7500/64 MODEL 4300 PIII SERIES Desktop 151 SNC PENTIUM III-500MHZ Desktop 152 SNC PENTIUM III-500MHZ Desktop 153 HP COMPAQ DX2000MT Desktop HP 154 HP EVO D510 (SMALL FORM FACTOR MODEL) Desktop HP 155 HP BRIO BA600 PIII-550 MHZ Desktop 156 HP/ COMPAQNEVO N1000V NOTEBOOK Desktop HP 157 IBM THINKCENTRE "A" SERIES TOWER W/14' CRT Desktop IBM 158 IBM Think Centre A Series Tower W/15" TFT Desktop IBM 159 IBM THINKCENTRE "A" SERIES TOWER W/17" LCD Desktop IBM 160 HP DX2000 MT MODEL (3 YEARS,NBD ONSITE) Desktop HP 161 HP BRIO PIII 866 Desktop HP 162 IBM THINK CENTRE "A" SERIES TOWER W/15" TFT Desktop IBM 163 HP COMPAQ EVO D220 MICROTOWER W/17' CRT Desktop HP 164 HP DX2000 MT MODEL (3YRS, NBD ONSITE) Desktop HP 165 IBM Think Centre A Series Tower W/15" CRT Desktop IBM
100

Operations 1 (continue) 166 LAPTOP - HP XEIII OMNIBOOK Laptop HP 167 HP VL420 CPU ONLY Desktop HP 168 IBM A51 SERIES TOWER W/17"CRT DESKTOP Desktop IBM 169 IBM THINKPAD R SERIES W/ 1 YEAR WARRANTY Laptop IBM 170 HP COMPAQ EVO D220 MICROTOWER(W/ 15" CRT) Desktop HP 171 HP BRIO BA410 PIII-733MHZ Desktop HP 172 IBM A51 SERIES TOWER W/17" CRT Desktop IBM 173 PCI-DIO-96 & PCI-GPIB AND NI-488.2M Desktop HP 174 IBM A51 SERIES TOWER W/17' CRT Desktop IBM 175 HP VECTRA PENTIUM IV PC @ B5004 -1ST FL Desktop HP 176 HP VECTRA VL420-INTEL PENTIUM 4 Desktop HP 177 HP BRIO BA410 PIII-733MHZ Desktop HP 178 DESKTOP PC Desktop 179 IBM A51 SERIES TOWER W/17" CRT Desktop 180 IBM A51 SERIES TOWER W/17" CRT Desktop 181 HP COMPAQ EVO D220 MICROTOWER W/17' CRT Desktop HP 182 COMPAQ DX2000 MT AP (SLV) Desktop HP 183 COMPAQ DX2000 MT AP (SLV) Desktop HP 184 COMPAQ DX2000 MT AP (SLV) Desktop HP 185 COMPAQ DX2000 MT AP (SLV) Desktop HP 186 COMPAQ DX2000 MT AP (SLV) Desktop HP 187 COMPAQ DX2000 MT AP (SLV) Desktop HP 188 COMPAQ DX2000 MT AP (SLV) Desktop HP 189 COMPAQ DX2000 MT AP (SLV) Desktop HP 190 COMPAQ DX2000 MT AP (SLV) Desktop HP 191 COMPAQ DX2000 MT AP (SLV) Desktop HP 192 COMPAQ DX2000 MT AP (SLV) Desktop HP 193 COMPAQ DX2000 MT AP (SLV) Desktop HP 194 COMPAQ DX2000 MT AP (SLV) Desktop HP 195 COMPAQ DX2000 MT AP (SLV) Desktop HP 196 COMPAQ DX2000 MT AP (SLV) Desktop HP 197 COMPAQ DX2000 MT AP (SLV) Desktop HP 198 COMPAQ DX2000 MT AP (SLV) Desktop HP 199 COMPAQ DX2000 MT AP (SLV) Desktop HP 200 COMPAQ DX2000 MT AP (SLV) Desktop HP 201 COMPAQ DX2000 MT AP (SLV) Desktop HP 202 HP COMPAQ EVO D220 MICROTOWER W/ 17 CRT Desktop HP 203 IBM THINK CENTRE"A" SERIES TOWER W/15' TFT Desktop IBM
Operations 2 NO. DESCRIPTION / MODEL TYPE BRAND
NAME 1 COMPAQ Evo D320 Desktop 2 COMPAQ Evo D320 Desktop 3 COMPAQ Evo D320 Desktop 4 COMPAQ PC EVO D220 ST Desktop 5 HP VECTRA VL400 DESKTOP PC Desktop HP
101

Operations 2 (continue) 6 HP EVO D510 (CMT) Desktop HP 7 COMPAQ Evo D320 Desktop 8 COMPAQ Evo D320 Desktop 9 COMPAQ Evo D320 Desktop
10 COMPAQ PC EVO D220 ST Desktop 11 COMPAQ PC EVO D220 ST Desktop 12 COMPAQ EVO D220 MICROTOWER Desktop 13 IBM ThinkCentre A Series W/17" CRT-256MB DDR RAM Desktop IBM 14 IBM ThinkCentre A Series W/17" CRT-256MB DDR RAM Desktop IBM 15 IBM ThinkCentre A Series W/17" CRT-256MB DDR RAM Desktop IBM 16 IBM ThinkCentre A Series W/17" CRT-256MB DDR RAM Desktop IBM 17 HP EVO D220 MICROTOWER WITH 17" CRT Desktop HP 18 HP EVO D220 MICROTOWER WITH 17" CRT Desktop HP 19 HP EVO D220 MICROTOWER WITH 17" CRT Desktop HP 20 HP COMPAQ EVO D220 MICROTOWER W/ 17" CRT Desktop HP 21 HP COMPAQ EVO D220 MICROTOWER W/ 17" CRT Desktop HP 22 HP COMPAQ EVO D220 MICROTOWER W/ 17" CRT Desktop HP 23 HP OMNIBOOK XE III (LAPTOP) Laptop HP 24 IBM Thinkpad T-Series with 60GB External Hard disk Laptop IBM
25 HP COMPAQ NC8230 NOTEBOOK PC 64MB BASE UNIT Laptop
26 LAPTOP - HP Omnibook 6050 Laptop HP 27 IBM Thinkpad T-Series with 60GB External Hard disk Laptop IBM 28 LAPTOP - HP EVO N1000V Laptop HP
29 IBM NETVISTA A40 DESKTOP- TRANSFER FR VENTECH Desktop IBM
30 HP COMPAQ EVO D220 MICROTOWER Desktop HP 31 HP COMPAQ EVO D220 MICROTOWER Desktop HP 32 HP PC DC7100 Desktop HP 33 HP PC DC7100 Desktop HP 34 HP PC DC7100 Desktop HP 35 IBM ThinkCentre A Series Tower w/17"CRT Normal Desktop IBM 36 IBM A51 TOWER + PHYSICAL DATA TRANSFER Desktop IBM 37 HP OMNIBOOK XE III (LAPTOP) Laptop HP 38 IBM THINKPAD (Re) SERIES Laptop IBM 39 IBM THINKPAD R-E SERIES Laptop IBM 40 NOTEBOOK - THINKPAD T43 Laptop IBM 41 NOTEBOOK - THINKPAD T43 Laptop IBM 42 HP OMNIBOOK XE III (LAPTOP) Laptop HP 43 HP COMPAQ NX9010 NOTEBOOK Laptop HP 44 IBM ThinkPad R-Series Laptop IBM 45 IBM ThinkPad R-Series Laptop IBM
46 HP NOTEBK NC4200(WIN XP PRO O/S)&UPGRADE HD TO 80GB Laptop HP
47 HP NOTEBK NC4200(WIN XP PRO O/S)&UPGRADE HD TO 80GB Laptop HP
48 LAPTOP - HP NC4200 NOTEBOOK (3YRS, NBD ONSITE) Laptop HP
49 IBM NETVISTA A20 DESKTOP Desktop IBM 50 HP COMPAQ EVO D220 MICROTOWER Desktop HP
102

Operations 2 (continue) 51 HP COMPAQ DX2100MT-MICROSOFT WIN XP PRO Desktop HP 52 HP COMPAQ DX2100MT-MICROSOFT WIN XP PRO Desktop HP 53 HP COMPAQ DX2100MT-MICROSOFT WIN XP PRO Desktop HP
54 DESKTOP-HP COMPAQ DX2100MT-MICROSOFT WIN XP PRO Desktop HP
55 DESKTOP-HP COMPAQ DX2100MT-MICROSOFT WIN XP PRO Desktop HP
56 HP Business Notebook NX5000 Laptop HP 57 DELL OPTIPLEX GX270 SMALL MINITOWER Desktop Dell 58 DELL OPTIPLEX GX270 SMALL MINITOWER Desktop Dell 59 HP Business Notebook NX5000 Laptop HP 60 DELL OPTIPLEX GX270 SMALL MINITOWER Desktop Dell 61 IBM THINKPAD PORTABLE T60 Laptop IBM 62 DELL OPTIPLEX GX270 SMALL MINITOWER Desktop Dell 63 FUJITSU NOTEBOOK S6130 Laptop Fujitsu 64 DELL OPTIPLEX GX270 SMALL MINITOWER Desktop Dell 65 FUJITSU NOTEBOOK E4010N Laptop Fujitsu 66 DELL OPTIPLEX GX270 SMALL MINITOWER Desktop Dell 67 INTEL PENTIUM III 550 MHZ PROCESSOR Desktop 68 PENTIUM II CPU Desktop HP 69 LAPTOP - HP OMNIBOOK PIII-XE3 Laptop HP 70 HP COMPAQ DC7100 CMT BASE UNIT Laptop HP 71 L1702 17" TFT MONITOR Desktop 72 FUJITSU NOTEBOOK E4010N Laptop Fujitsu 73 DELL OPTIPLEX GX270 SMALL MINITOWER Desktop Dell 74 FUJITSU NOTEBOOK E4010N Laptop Fujitsu 75 HP COMPAQ DC7100 CMT BASE UNIT Laptop HP 76 L1702 17" TFT MONITOR Desktop
77 IBM THINKPAD PORTABLE X60 & OFFICE 2003 SB W/SP2 Laptop IBM
78 FUJITSU NOTEBOOK E4010N Laptop Fujitsu Quality Assurance (QA) Department
NO. DESCRIPTION / MODEL TYPE BRAND NAME
1 HP PC P166 MHZ Desktop HP 2 HP PC P166 MHZ Desktop IBM 3 HP PC P166 MHZ Desktop HP 4 HP PC P166 MHZ Desktop HP 5 HP PC P166 MHZ Desktop HP 6 HP PC P166 MHZ Desktop HP 7 HP PC P166 MHZ Desktop HP 8 HP BIRO BA410 PIII-733MHZ Desktop HP 9 HP BRIO P3-1 GHZ Desktop HP
10 HP VECTRA VL400 DESKTOP PC Desktop HP 103

Quality Assurance (QA) Department (continue) 11 HP VECTRA VL400 DESKTOP PC Desktop HP 12 HP VECTRA VL420 Desktop HP 13 HP VECRA VL420 - (SEE LONG TEXT) Desktop HP 14 HP EVO D510 (CMT) P 4 Desktop HP 15 HP COMPAQ EVO D220 MICROTOWER W/ 17"CRT Desktop HP 16 HP COMPAQ EVO D220 MICROTOWER W/ 17 CRT Desktop HP
17 IBM THINKCENTRE A51, 160GB SERIAL ATA HARDDISK Desktop IBM
18 IBM THINKCENTRE A51, 160GB SERIAL ATA HARDDISK Desktop IBM
19 IBM THINKCENTRE A51, 160GB HARDDISK, CRRW DVD ROM Desktop IBM
20 LAPTOP - IBM THICKPAD R31 - laptop IBM 21 LAPTOP - HP COMPAQ EVO N1000V laptop HP 22 HP COMPAQ NOTEBOOK NX9010 laptop HP 23 IBM THINKPAD R SERIES laptop IBM
Reliability
NO. DESCRIPTION / MODEL TYPE BRAND NAME
1 HP P166 PC Desktop HP 2 HP P166 PC Desktop HP 3 HP P166 PC Desktop HP 4 HP P166 PC Desktop HP 5 HP PC P166 Desktop HP 6 HP PC P166 Desktop HP 7 SNC PIII-500C PU 64MB RAM Desktop HP 8 LAPTOP - HP OMNIBOOK PIII-XE3 Laptop HP 9 HP BRIO PIII Desktop HP
10 HP VECTRA VL800 DESKTOP INTEL PIV Desktop HP 11 HP VECTRA VL400 DESKTOP INTEL PIII Desktop HP 12 LAPTOP - HP OMNIBOOK 6050 Laptop HP 13 HP VECTRA VL 420 Desktop HP 14 HP VECTRA VL420 Desktop HP 15 HP VECTRA VL420 Desktop HP 16 HP VECTRA VL420 Desktop HP 17 HP EVO D510 ( CMT ) Desktop HP 18 HP EVO D510 ( CMT ) Desktop HP 19 HP EVO D 510 ( CMT ) Desktop HP 20 HP EVO D 510 ( CMT ) Desktop HP 21 DESKTOP P-3 550MHZ Desktop HP 22 DESKTOP P-3 550MHZ Desktop HP 23 DESKTOP P-3 550MHZ Desktop HP 24 DESKTOP P-3 550MHZ Desktop HP 25 DESKTOP P-3 550MHZ Desktop HP
104

Reliability (continue) 26 HP EVO D510 PENTIUM 4 1.7Ghz Desktop HP 27 HP EVO D510 ( CMT ) Desktop HP 28 HP EVO D510 ( CMT ) Desktop HP 29 HP EVO D510 ( CMT ) Desktop HP 30 COMPAQ EVO D510 SMALL FORM FACTOR Desktop HP 31 HP EVO D510 (CMT) P 4 Desktop HP
32 HP EVO D510(CMT) P4 2GHZ, INTEL 845G, 256MB DDRRAM Desktop HP
33 HP VECTRA VL-420 DT - P7295A Desktop HP 34 HP VECTRA VL-420 DT - P7295A Desktop HP 35 17" CRT MONITOR HP VECTRA VL-420 DT - P7295A Desktop HP 36 17" CRT MONITOR HP VECTRA VL-420 DT - P7295A Desktop HP 37 HP/COMPAQ EVO NOTEBOOK N800V Laptop HP 38 HP/COMPAQ EVO NOTEBOOK N800V Laptop HP 39 HP/COMPAQ EVO NOTEBOOK N800V Laptop HP 40 IBM THINKPAD R SERIES Laptop IBM
41 HP DX2000MT W/17" CRT+ ADOBE ACROBAT S/W Desktop HP 42 DX2000 MT MODEL (3 YRS,NBD ONSITE) Desktop HP 43 DX2000 MT MODEL (3 YRS,NBD ONSITE) Desktop HP
44 NOTEBOOK-IBM LENOVO THINKPAD R(e) SERIES Laptop IBM 45 HP EVO D510 ( CMT ) Desktop HP 46 LAPTOP - HP EVO 800V Laptop HP 47 LAPTOP - HP EVO 800V Laptop HP 48 HP EVO D510 ( CMT ) Desktop HP
Facility Department
NO. DESCRIPTION / MODEL TYPE BRAND NAME
1 HP BRIO BA410 PIII-733MHZ Desktop HP
2 HP COMPAQ DX2000MT MODEL (3YRS, NBD ONSITE) Desktop HP
3 IBM THINKPAD LAPTOP Laptop IBM 4 LAPTOP - HP OMNIBOK XEIII Laptop HP 5 LAPTOP - HP OMNIBOOK PIII-XE3 Laptop HP 6 LAPTOP -COMPAQ EVD 1000N Laptop HP
IQC Procurement
NO. DESCRIPTION / MODEL TYPE BRAND NAME
1 DATAMINI TURBO XT Desktop 2 DATAMINI TURBO XT Desktop 3 DATAMINI AT COMP COMPUTER Desktop
105

IQC Procurement (continue) 4 DCM 386/20 COMPUTER Desktop 5 DCM 386/20 COMPUTER Desktop 6 INTEL PII-333 MHz WITH UPGRADING Desktop 7 HP BRIO PIII 866 Desktop HP 8 HP BRIO PIII 866 Desktop HP 9 HP VECTRA VL 420 Desktop HP
10 COMPAQ EVO D220 MICROTOWER Desktop 11 COMPACT DATAMINI TURBO AT Desktop
Purchasing
NO. DESCRIPTION / MODEL TYPE BRAND NAME
1 HP BRIOBA600-650MHZ 64MB Desktop HP 2 HP BRIOBA600-650MHZ 64MB Desktop HP 3 HP BRIO BA410 PIII-733MHZ Desktop HP 4 HP BRIO BA410 PIII-733MHZ Desktop HP 5 HP BRIO PIII 866 Desktop HP
6 HP BRIO INTEL PIII-1GHZ, USB DATA TRANSFER CABLE, Desktop HP
7 HP OMNIBK XE2-PIII 500MHZ Laptop HP 8 LAPTOP - HP OMNIBOOK XE2 PIII-450MHZ Laptop HP 9 LAPTOP - IBM THINKPAD R Laptop IBM
10 LAPTOP - COMPAQ PRESARIO 1508 Laptop HP 11 IBM THINKPAD R52 WITH 15" XGA Laptop IBM 12 THINKPAD T43, 2668-AY6 Laptop IBM 13 HP BRIO BA600 PIII-550 MHZ Desktop HP 14 HP COMPAQ EVO D220 MICRTOTOWER Desktop HP 15 HP COMPAQ EVO D220 MICROTOWER(W/ 15" CRT) Desktop HP 16 TNN PENTIUM-133 CPU(CEO1942) Desktop HP 17 EDO P-200MMX CPU C/W PRINTER Desktop HP 18 HP BRIO PII-233 Desktop HP 19 HP BRIO BA600 PIII-550MHZ Desktop HP 20 HP BRIO BA410 PIII-733MHZ Desktop HP 21 HP VECTRA VL400 DESKTOP INTEL PIII Desktop HP 22 HP VECTRA VL 420 FOR NEW BUYER Desktop HP 23 HP COMPAQ D220 MICROTOWER W 15" CRT Desktop HP 24 IBM ThinkCentre A Series w/17" CRT Desktop IBM 25 IBM ThinkCentre A Series w/17" CRT Desktop IBM
26 IBM A51 TOWER W/17" CRT MONITOR, 256MB DDR RAM Desktop IBM
27 IBM A51 TOWER W/17" CRT MONITOR, 256MB DDR RAM Desktop IBM
28 IBM A51 TOWER W/17" CRT MONITOR, 256MB DDR RAM Desktop IBM
29 IBM A51 TOWER W/17" CRT MONITOR, 256MB DDR RAM, 80GB Desktop IBM
30 IBM A51 TOWER W/17" CRT MONITOR, 256MB DDR RAM, 80GB Desktop IBM
106

Purchasing (continue)
31 THINKCENTRE A52, 8297-A53 W/17" CRT THINKVISION Desktop IBM
32 EASTGATE 466 CEL Desktop HP 33 HP BRIO BA600 P3500 Desktop HP 34 HP BRIO BA600 P3500 Desktop HP 35 HP BRIO P350 Desktop HP 36 HP BRIO BA410 PIII-733MHZ Desktop HP 37 HP VECTRA VL400 DESKTOP INTEL PIII Desktop HP 38 TNN PENTIUM 166 CPU Desktop HP 39 VISION POWER P-166MMX Desktop HP 40 VISION POWER P-166MMX Desktop HP 41 VISION POWER P-166MMX Desktop HP 42 HP BRIO PIII-550E SYSTEM Desktop HP 43 HP BRIO BA600 PIII-550MHZ Desktop HP 44 HP BRIO BA600 PIII-600MHZ Desktop HP 45 HP BRIO PIII 866 Desktop HP 46 DATAMINI FESTIVA CEL333A Desktop HP 47 DATAMINI FESTIVA CEL 333A Desktop HP
Store / Logistic Department
NO. DESCRIPTION / MODEL TYPE BRAND NAME
1 VISION 1-NET SYSTEM (LE) Desktop 2 VISION I-NET SYSTEM AMD Desktop HP 3 VISION I-NET SYSTEM AMD Desktop HP 4 HP BRIO 800MHZ Desktop HP 5 HP BRIO 800MHZ Desktop HP 6 HP BRIO 800MHZ Desktop HP 7 HP BRIO 800MHZ Desktop HP 8 HP BRIO 800MHZ Desktop HP 9 HP BRIO 800MHZ Desktop HP
10 HP VECTRA VL420 Desktop HP IT Department
NO. DESCRIPTION / MODEL TYPE BRAND NAME
1 LAPTOP - HP OMNIBOOK XE2-PIII-450MHZ Laptop HP 2 LAPTOP - HP OMNIBOOK XE2-PIII-450MHZ Laptop HP 3 LAPTOP - HP OMNIBOOK XE2 Laptop HP 4 LAPTOP - HP OMNIBOOK PIII-XE3 Laptop HP 5 LAPTOP - HP OMNIBOOK PIII-XE3 Laptop HP 6 LAPTOP - HP OMNIBOOK PIII-XE3 Laptop HP 7 LAPTOP - HP OMNIBOOK PIII-XE3 Laptop HP 8 LAPTOP - HP OMNIBOOK PIII-XE3 Laptop HP 9 LAPTOP - HP OMNIBOOK XE3-700MHZ Laptop HP
10 LAPTOP - HP OMNIBOOK XE3-700MHZ Laptop HP
107

IT Department (continue) 11 LAPTOP - HP OMNIBOOK XE3-700MHZ Laptop HP 12 LAPTOP - HP OMNIBOOK XE3-700MHZ Laptop HP 13 HP OMNIBOOK XE3-700MHZ Laptop HP 14 LAPTOP - HP OMNIBOK XEIII Laptop HP 15 LAPTOP - HP XEIII OMNIBOOK Laptop HP 16 LAPTOP - HP XEIII OMNIBOOK Laptop HP 17 LAPTOP - HP OMNIBOOK XT6050 SERIES Laptop HP 18 LAPTOP - COMPAQ EVO N1000V Laptop HP 19 LAPTOP - HP COMPAQ EVO N800V Laptop HP 20 HP COMPAQ NX9010 LAPTOP Laptop HP 21 HP COMPAQ NX9010 LAPTOP Laptop HP 22 IBM THINKPAD R50 Laptop IBM 23 IBM THINKPAD R SERIES - LAPTOP Laptop IBM 24 IBM THINKPAD R SERIES - LAPTOP Laptop IBM 25 LAPTOP-IBM THINKPAD R-SERIES Laptop IBM 26 LAPTOP-IBM THINKPAD R-SERIES Laptop IBM 27 IBM ThinkPad R-Series Laptop IBM 28 IBM ThinkPad R-Series Laptop IBM 29 IBM ThinkPad R-Series Laptop IBM 30 IBM ThinkPad R-Series Laptop IBM 31 IBM Rack Mount Server w Oracle N Visual Studio'03 Laptop IBM 32 IBM ThinkPad R-Series Laptop IBM 33 IBM THINKPAD R SERIES Laptop IBM 34 IBM THINKPAD R SERIES Laptop IBM 35 HP NC6220 NOTEBOOK PC W/ DOCKING STATION Laptop HP
36 HP NC 8230-15.4" DISPLAY W/ CARRYING CASE (3YRS,NBD) Laptop HP
37 HP COMPAQ NC6230 NOTEBOOK Laptop HP
38 NOTEBOOK - HP COMPAQ NC4200 NOTEBOOK PC BASE UNIT Laptop HP
39 IBM LENOVO THINKPAD R SERIES Laptop IBM Human Resource (HR) Department
NO. DESCRIPTION / MODEL TYPE BRAND NAME
1 HP BRIO BA600 PIII-550 MHZ Desktop HP 2 HP BRIO BA600 PIII-550 MHZ Desktop HP 3 HP BRIO BA600 PIII-550 MHZ Desktop HP 4 HP BRIO INTEL PIII-700MHZ Desktop HP 5 HP BRIO BA410 PIII-733MHZ Desktop HP 6 HP BRIO BA410 PIII-733MHZ Desktop HP 7 HP BRIO 800MHZ Desktop HP 8 HP BRIO 800MHZ Desktop HP 9 HP BRIO 800MHZ Desktop HP
10 HP BRIO 800MHZ Desktop HP 11 HP EVO D510 PC Desktop HP 12 HP EVO D510 PC Desktop HP
108

Human Resource (HR) Department (continue) 13 HP EVO D510 PC Desktop HP 14 COMPAQ EVO D380 (MT) Desktop HP 15 HP EVO D320 MICRO TOWER Desktop HP
16 IBM LENOVO THINKCENTRE A52 W/17"CRT MONITOR Desktop IBM
17 IBM LENOVO THINKCENTRE A52 W/17"CRT MONITOR Desktop IBM
18 IBM LENOVO THINKCENTRE A52 W/17"CRT MONITOR Desktop IBM
19 IBM LENOVO THINKCENTRE A52 W/17"CRT MONITOR Desktop IBM
20 SNC POWERBOOK 466 CEL -PC Desktop HP 21 HP BRIO 800MHZ Desktop HP 22 OMNIBOOK XE2-PIII-500MHZ Laptop HP 23 LAPTOP - IBM THINKPAD R SERIES Laptop IBM 24 LAPTOP - HP EVO 510C WITH MOBILE EXPANSION Laptop HP 25 LAPTOP - THINKPAD T43, 2668-AY6 Laptop IBM 26 LAPTOP - THINKPAD T43, 2668-AY6 Laptop IBM 27 LAPTOP - HP OMNIBOOK PIII-XE3 Laptop HP
Marketing Department
NO. DESCRIPTION / MODEL TYPE BRAND NAME
1 LAPTOP - COMPAQ EVO N1000V ( 37-837 ) Laptop HP 2 HP NOTEBOOK EVO N1020V Laptop HP 3 HP NOTEBOOK EVO N1020V, INTEL P4 2.4GHZ Laptop HP 4 HP NOTEBOOK EVO N1020V, INTEL P4 2.4GHZ Laptop HP 5 HP COMPAQ BIZ NOTEBOOK NX7000 Laptop HP 6 NOTEBOOK-NX9420 GENERIC CONFIG Laptop 7 HP EVO D510 ( CMT) Desktop HP
Finance Department
NO. DESCRIPTION / MODEL TYPE BRAND NAME
1 IBM Think pad 390X Notebook Computer Laptop IBM 2 HP Omnibook XE2 PIII-450MHz Laptop HP 3 Laptop-Omnibook XE2 PIII 500MHz Laptop HP 4 Omnibook PIII XE3 Laptop HP 5 Omnibook XEIII Laptop HP 6 Compaq EVO N1000 Laptop HP 7 Compaq Notebook EVO N410C Laptop HP 8 IBM Think Pad R Series Laptop IBM 9 HP EVO N800 V P4.18 GHz & Sony USB Floppy Drive Laptop HP
10 HP EVO N800 V P4.18 GHz & Sony USB Floppy Drive Laptop HP
109
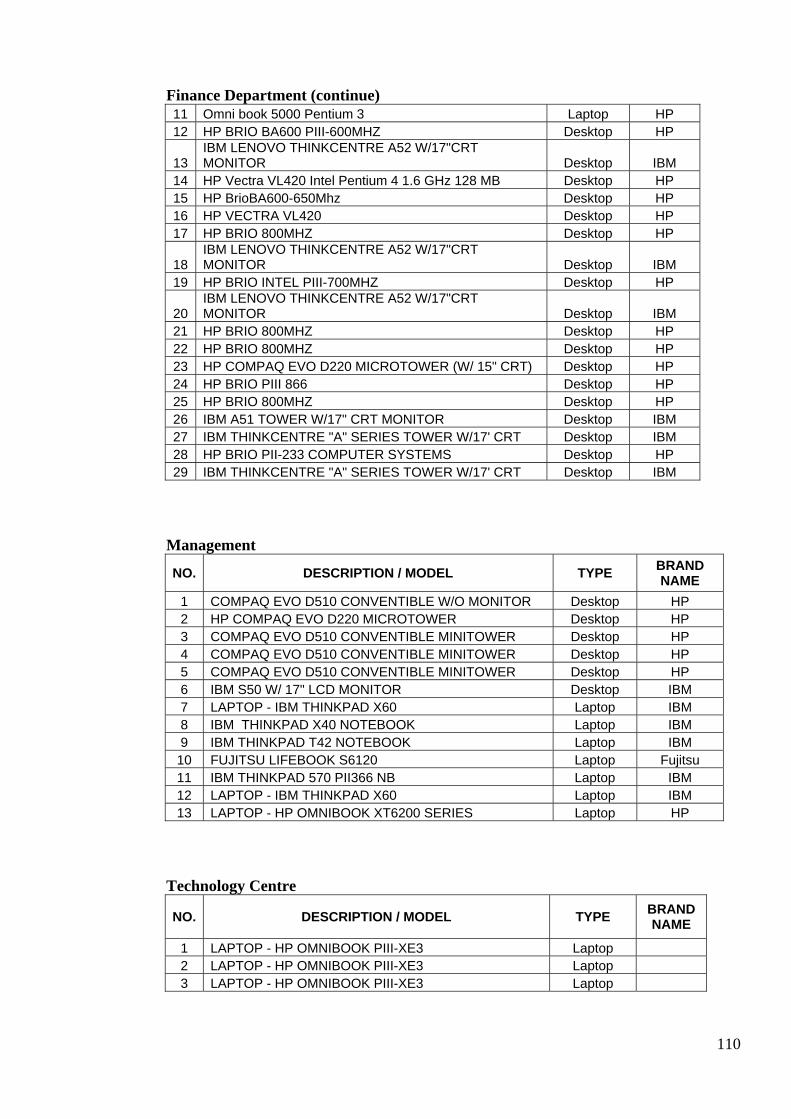
Finance Department (continue) 11 Omni book 5000 Pentium 3 Laptop HP 12 HP BRIO BA600 PIII-600MHZ Desktop HP
13 IBM LENOVO THINKCENTRE A52 W/17"CRT MONITOR Desktop IBM
14 HP Vectra VL420 Intel Pentium 4 1.6 GHz 128 MB Desktop HP 15 HP BrioBA600-650Mhz Desktop HP 16 HP VECTRA VL420 Desktop HP 17 HP BRIO 800MHZ Desktop HP
18 IBM LENOVO THINKCENTRE A52 W/17"CRT MONITOR Desktop IBM
19 HP BRIO INTEL PIII-700MHZ Desktop HP
20 IBM LENOVO THINKCENTRE A52 W/17"CRT MONITOR Desktop IBM
21 HP BRIO 800MHZ Desktop HP 22 HP BRIO 800MHZ Desktop HP 23 HP COMPAQ EVO D220 MICROTOWER (W/ 15" CRT) Desktop HP 24 HP BRIO PIII 866 Desktop HP 25 HP BRIO 800MHZ Desktop HP 26 IBM A51 TOWER W/17" CRT MONITOR Desktop IBM 27 IBM THINKCENTRE "A" SERIES TOWER W/17' CRT Desktop IBM 28 HP BRIO PII-233 COMPUTER SYSTEMS Desktop HP 29 IBM THINKCENTRE "A" SERIES TOWER W/17' CRT Desktop IBM
Management
NO. DESCRIPTION / MODEL TYPE BRAND NAME
1 COMPAQ EVO D510 CONVENTIBLE W/O MONITOR Desktop HP 2 HP COMPAQ EVO D220 MICROTOWER Desktop HP 3 COMPAQ EVO D510 CONVENTIBLE MINITOWER Desktop HP 4 COMPAQ EVO D510 CONVENTIBLE MINITOWER Desktop HP 5 COMPAQ EVO D510 CONVENTIBLE MINITOWER Desktop HP 6 IBM S50 W/ 17" LCD MONITOR Desktop IBM 7 LAPTOP - IBM THINKPAD X60 Laptop IBM 8 IBM THINKPAD X40 NOTEBOOK Laptop IBM 9 IBM THINKPAD T42 NOTEBOOK Laptop IBM
10 FUJITSU LIFEBOOK S6120 Laptop Fujitsu 11 IBM THINKPAD 570 PII366 NB Laptop IBM 12 LAPTOP - IBM THINKPAD X60 Laptop IBM 13 LAPTOP - HP OMNIBOOK XT6200 SERIES Laptop HP
Technology Centre
NO. DESCRIPTION / MODEL TYPE BRAND NAME
1 LAPTOP - HP OMNIBOOK PIII-XE3 Laptop 2 LAPTOP - HP OMNIBOOK PIII-XE3 Laptop 3 LAPTOP - HP OMNIBOOK PIII-XE3 Laptop
110

Technology Centre (continue) 4 LAPTOP - HP OMNIBOOK PIII-XE3 Laptop 5 HP OMNIBOOK PIII-XE3 Laptop 6 IBM THINKPAD R50 SERIES Laptop 7 HP OMNIBK XE2 PIII-450MHZ Laptop 8 LAPTOP - DATAMINI PEGASUS P220 NOTEBOOK Laptop 9 IBM THINKPAD R SERIES Laptop
10 LAPTOP - HP OMNIBOOK PIII-XE3 Laptop 11 LAPTOP - HP OMNIBOOK PIII-XE3 Laptop 12 LAPTOP COMPUTER IBM THINKPAD R52 Laptop 13 LAPTOP COMPUTER IBM THINKPAD R52 Laptop 14 LAPTOP - HP OMNIBOOK PIII-XE3 Laptop 15 LAPTOP - HP OMNIBOOK PIII-XE3 Laptop 16 WILLS PRO C466/32 MODEL 8400 Desktop 17 WILLS PRO C466/32 MODEL 8400 Desktop 18 WILLS PRO C466/32 MODEL 8400 Desktop 19 WILLS PRO C466/32 MODEL 8400 Desktop 20 WILLS PRO C466/32 MODEL 8400 Desktop 21 WILLS PRO C466/32 MODEL 8400 Desktop 22 WILLS PRO 7500/64 MODEL 4300 PIII SERIES Desktop 23 WILLS PRO 7500/64 MODEL 4300 PIII SERIES Desktop 24 HP BRIO BA410 PIII-733MHZ Desktop 25 HP BRIO INTEL PIII-700MHZ Desktop 26 HP BRIO INTEL PIII-700MHZ Desktop 27 HP BRIO BA410 PIII-733MHZ Desktop 28 COMPUTER PIII Desktop 29 HP COMPAQ DC 7100 CMT BASE UNIT Desktop
30 HP COMPAQ NC4200-12.1" DISPLAY WITH CARRY CASE Desktop
31 CYCLONE PII-233 Desktop 32 SNC PIII-500 128MB & WINDOWS 98SE Desktop
Supply Chain
NO. DESCRIPTION / MODEL TYPE BRAND NAME
1 HP/COMPAQ EVO NOTEBOOK N800V Laptop HP 2 HP COMPAQ NC4200 NOTEBOOK PC BASE UNIT Laptop HP 3 IBM THINKPAD R SERIES Laptop IBM
4 HP COMPAQ NC6400 IDS 128M BASE UNIT (LAPTOP) Laptop HP
5 HP EVO D510 ( CMT ) Desktop HP 6 COMPAQ EVO D220 MICROTOWER Desktop HP 7 HP VENTRA VL420 DESKTOP Desktop HP 8 HP VECTRA VL 420 Desktop HP
9 HP COMPAQ NC6400 IDS 128M BASE UNIT (LAPTOP) Laptop HP
10 HP EVO D510 (CMT) Desktop HP
111

Supply Chain (continue) 11 HP EVO D510 (CMT) Desktop HP 12 HP COMPAQ NC4200 NOTEBOOK PC BASE UNIT Laptop HP
13 HP LAPTOP NC4400-12.1" DISPLAY WITH CARRY CASE Laptop HP
14 HP COMPAQ NC6400 IDS 128M BASE UNIT (LAPTOP) Laptop HP
15 HP EVO D320 (MICRO TOWER MODEL) Desktop HP 16 COMPAQ EVO D220 MICROTOWER Desktop HP 17 HP VENTRA VL420 DESKTOP Desktop HP
Production Department
NO. DESCRIPTION / MODEL TYPE BRAND NAME
1 HP EVO D510, P4 2GHZ, 256MB DDR RAM, 40GB HDD Desktop HP
2 IBM A51 SERIES Desktop IBM 3 HP EVO D380 (MT) Desktop HP 4 HP COMPAQ EVO D220 MICROTOWER Desktop HP 5 IBM ThinkCentre A50 Desktop IBM 6 HP COMPAQ EVO D220 MICROTOWER Desktop HP 7 HP COMPAQ EVO D220 MICROTOWER Desktop HP 8 HP COMPAQ EVO D220 MICROTOWER Desktop HP 9 IBM THINKCENTRE "A" SERIES TOWER Desktop IBM
10 IBM THINKCENTRE A51 SERIES TOWER Desktop IBM 11 HP BRIO BA600 PIII-550MHZ Desktop HP 12 COMPAQ EVO D220 MICRO TOWER Desktop HP 13 COMPAQ EVO D220 MICROTOWER Desktop HP 14 IBM THINKCENTRE A50 SERIES TOWER W/17' CRT Desktop IBM
15 DESKTOP-IBM LENOVO THINKCENTRE Desktop IBM 16 COMPRO P90 SYSTEM Desktop HP 17 HP VECTRA VL420 Desktop HP 18 IBM LENOVO THINKCENTRE Desktop IBM 19 IBM LENOVO THINKCENTRE Desktop IBM 20 IBM LENOVO THINKCENTRE Desktop IBM 21 HP COMPAQ EVO D220 MICROTOWER Desktop HP 22 HP COMPAQ EVO D220 MICROTOWER Desktop HP 23 HP COMPAQ EVO D220 MICROTOWER Desktop HP 24 HP COMPAQ EVO D220 MICROTOWER Desktop HP 25 IBM THINKCENTRE A SERIES W/ 15" CRT Desktop IBM 26 HP COMPAQ DX2000 MT Desktop HP 27 IBM LENOVO THINKCENTRE A52 + RAM Desktop IBM 28 IBM THINK CENTRE 'A' SERIES TOWER Desktop IBM 29 HP COMPAQ EVO D220 MICROTOWER Desktop HP 30 HP COMPAQ EVO D220 MICROTOWER Desktop HP
112
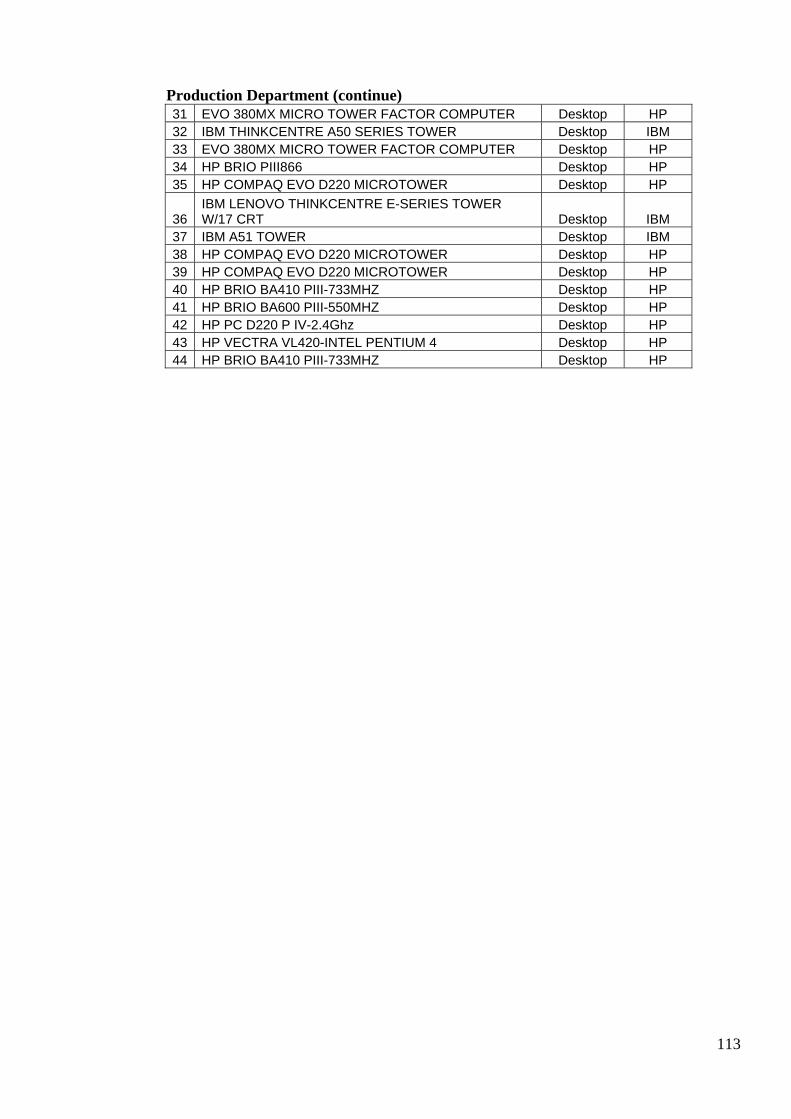
Production Department (continue) 31 EVO 380MX MICRO TOWER FACTOR COMPUTER Desktop HP 32 IBM THINKCENTRE A50 SERIES TOWER Desktop IBM 33 EVO 380MX MICRO TOWER FACTOR COMPUTER Desktop HP 34 HP BRIO PIII866 Desktop HP 35 HP COMPAQ EVO D220 MICROTOWER Desktop HP
36 IBM LENOVO THINKCENTRE E-SERIES TOWER W/17 CRT Desktop IBM
37 IBM A51 TOWER Desktop IBM 38 HP COMPAQ EVO D220 MICROTOWER Desktop HP 39 HP COMPAQ EVO D220 MICROTOWER Desktop HP 40 HP BRIO BA410 PIII-733MHZ Desktop HP 41 HP BRIO BA600 PIII-550MHZ Desktop HP 42 HP PC D220 P IV-2.4Ghz Desktop HP 43 HP VECTRA VL420-INTEL PENTIUM 4 Desktop HP 44 HP BRIO BA410 PIII-733MHZ Desktop HP
113

Appendix C – Survey questionnaire
114

115

116