Recycling of steel plant by-products by cold bonded...
170
FACULTY OF TECHNOLOGY Recycling of steel plant by-products by cold bonded briquetting Ahmed Abdelrahim Master’s Degree Programme (BCBU) Environmental Engineering April 2018
Transcript of Recycling of steel plant by-products by cold bonded...

FACULTY OF TECHNOLOGY
Recycling of steel plant by-products by cold bonded
briquetting
Ahmed Abdelrahim
Master’s Degree Programme (BCBU) Environmental Engineering
April 2018
II
TIIVISTELMÄOPINNÄYTETYÖSTÄ Oulun yliopisto Teknillinen tiedekuntaKoulutusohjelma Pääaineopintojen alaProsessi- ja ympäristötekniikka Ympäristötekniikka
Tekijä Työn ohjaaja yliopistollaAhmed Abdelrahim Fabritius T., Professor
Omran M., D.Sc. (Tech.)Työn nimiTerästehtaan sivuvirtojen kierrättäminen kylmä briketöinnillä.Opintosuunta Työn laji Aika SivumääräEnergy Systems and
Cleaner Production
Diplomityö 24-04-2018 137 s. 5 liitettä
Tiivistelmä
Ilmastonmuutos on tällä hetkellä yksi ihmiskunnan suurimmista haasteista.Ilmastonmuutoksen vuoksi teollisuuden, mukaan lukien rauta- ja terästeollisuuden, onvälttämätöntä vähentää CO2-päästöjä. Viime vuosien aikana sintraamoja on suljettuoikeus- ja ympäristönäkökulmista johtuen. Briketöintiä pidetään kiinnostavanakorvaavana vaihtoehtona sivutuotteiden kierrättämiseen. Käytettäessä brikettejämasuunin syötteessä, briketeillä täytyy olla sopiva kemiallinen koostumus jamekaaniset ominaisuudet, jotta ne eivät häiritse uunin toimintaa. Tässä työssä briketitvalmistettiin yhdestätoista erilaisesta SSAB:n Raahen tehtaan sivutuotemateriaalista.
Tutkimuksissa käytetyt sivutuotemateriaalit karakterisoitiin käyttämällä XRF-, XRD-,LECO- ja SEM-analyysejä. Partikkelikokojakauma määritettiin seulomalla ja laser-diffraktiolla. EMMA (Elkem Materials Mixture Analyser) ohjelmalla tutkittiin eribrikettireseptien pakkautumiskäyttäytymistä. Valmistettujen brikettien mekaanisiaominaisuuksien tutkimiseen käytettiin puristus-, pudotus- ja rumputestejä. Tutkimuksenensimmäisessä vaiheessa tutkittiin BF- ja BOF-liejujen käytön vaikutusta brikettienominaisuuksiin. Tulosten perusteella brikettien mekaaniset ominaisuudet säilyivättarkoituksenmukaisina, kun brikettireseptissä käytettiin maksimissan 8% BF- ja BOF-liejua. Reseptin sisältämä sinkin määrä syötettynä masuuniin kuitenkin ylittää masuuninesteettömän toiminnan vaatiman tason. Tutkimuksen toisessa vaiheessa tutkittiinligniinin käyttöä brikettireseptissä rapid-sementin korvikkeena. Tulokset osoittivat, ettäligniinin käyttö rapid-sementin korvikkeena briketeissä johtaa huomattavaan lujuudenlaskuun.
Avainsanat: briketit, karakterisointi, kierrätys, masuuni, sivutuotteet, terästehtaan
Muita tietoja

III
ABSTRACTFOR THESIS University of Oulu Faculty of TechnologyDepartment Degree programmeDepartment of Process and Environmental Engineering Master’s Degree Programme (BCBU) in Environmental
EngineeringAuthor Thesis Supervisor
Ahmed Abdelrahim Fabritius T., ProfessorOmran M., D.Sc. (Tech.)
Title of ThesisRecycling of steel plant by-products by cold bonded briquetting.
Study option Type of Thesis Submission Date Number of PagesEnergy Systems and
Cleaner Production
Master’s Thesis 24-04-2018 137 p. 5 appendices
Abstract
Global warming is one of the biggest challenges humankind currently faces. This madeit necessary to limit carbon emissions from many industries including iron andsteelmaking industry. Many sintering plants were shut down due to legal andenvironmental consideration. Briquetting process emerged as an attractive alternativefor the purpose of recycling by-products. When used as feed to blast furnace, briquettesmust have adequate chemical composition and mechanical properties so they would notdisturb the process inside the furnace. In this work, eleven by-products were receivedfrom SSAB plant in Raahe to be used as part of briquettes recipe.
The by-products materials were characterized using different techniques such as XRF,XRD, LECO and SEM. Particle size distribution was determined using sieving and laserdiffraction techniques. EMMA (Elkem Materials Mixture Analyser) software was usedto study the packing of different briquette recipes. Mechanical properties of producedbriquettes were measured using several tests such as compression, drop and tumblertests. The effect of incorporation of BF and BOF sludge to briquette recipe was studied.The results indicated that briquettes with up to 8% introduced sludge to the recipemaintained adequate mechanical properties. However, zinc input to the furnace utilizingthis recipe exceeded suitable level for smooth furnace operation. The effect ofincorporating lignin to briquette recipe to replace the rapid cement was studied. Theresults showed that using lignin as a substitute to rapid cement resulted in catastrophicreduction in briquettes strength.
Keywords: blast furnace, briquettes, characterization, steel plant by-products,recycling
Additional Information

IV
ACKNOWLEDGEMENT
The work reported in this thesis has been carried out at the process metallurgy research
unit at the University of Oulu as part of Renewable Energy Sources in Steel Plant
Processes (RENEPRO) project.
I would like to express my unconditional thanks and gratitude to my principal supervisor,
Professor Timo Fabritius for trusting me when choosing a student to carry out this
master’s thesis work. I would also like to thank my co-supervisor, officemate and friend,
Dr. Mamdouh Omran for guiding and supporting me throughout the thesis work. Special
thanks go to Dr. Hannu Suopajärvi for proposing the topic of this master’s thesis and also
for all his guidance and help which made everything clear for me right from the beginning
of the work.
I would like to thank my colleagues at the Process Metallurgy research unit for their
fruitful discussions and advice. I would like to especially thank Mr. Riku Mattila, Mr.
Tommi Kokkonen, Ms. Leena Palmu and Mr. Jarno Karvonen for their technical support
and help carrying out the experimental work. I would like to acknowledge SSAB Europe
for providing by-product samples necessary for this work.
I would also like to express my deep gratitude and love to my moms and dad for
everything they have done and still are doing for me. Thanks to all my friends and family
members.
Oulu, April 2018 Ahmed Abdelrahim

V
TABLE OF CONTENT
Acknowledgement ...................................................................................................... IVTable of content ........................................................................................................... V
Acronyms ................................................................................................................... XI1 Introduction ............................................................................................................... 1
2 Blast furnace .............................................................................................................. 32.1 Gas flow through the burden ............................................................................... 4
2.2 The Ferrous Burden and coke .............................................................................. 7 Generation of fines, reducibility, softening and melting .............................. 8
Sinter, pellets and lump ores ....................................................................... 8 Metallic charge and briquettes .................................................................... 9
Chemical control of the burden................................................................... 9 Coke ........................................................................................................ 10
2.3 Operational challenges ...................................................................................... 10 The burden ............................................................................................... 10
Alkali and zinc ......................................................................................... 11 Other operational challenges .................................................................... 12
3 Recycling of Iron and steelmaking reverts ................................................................ 133.1 Dust .................................................................................................................. 13
Recycling of dust and Zinc removal ......................................................... 143.2 Scale ................................................................................................................. 15
3.3 Sludge and Slurry .............................................................................................. 17 Recycling of sludge and Zinc removal ...................................................... 18
3.4 Slag and Slag Tailing ........................................................................................ 193.5 Coke by-products .............................................................................................. 21
3.6 Other reverts ..................................................................................................... 234 Agglomeration ......................................................................................................... 25
4.1 Agglomeration Theory ...................................................................................... 25 Binding mechanism .................................................................................. 26
4.2 Iron ore carbon composite ................................................................................. 304.3 Briquettes .......................................................................................................... 32
4.4 Particle size ....................................................................................................... 33 EMMA software ...................................................................................... 34
Distribution coefficient (q-value).............................................................. 34

VI
Andreassen model .................................................................................... 35
Modified Andreassen model ..................................................................... 354.5 Binders .............................................................................................................. 36
Rapid cement as a binder .......................................................................... 37 Granulated blast furnace slag .................................................................... 39
Lignin based binders ................................................................................ 394.6 Moisture content ............................................................................................... 40
4.7 Applied force .................................................................................................... 404.8 Curing ............................................................................................................... 41
4.9 Quality requirements and tests ........................................................................... 42 Tumble test .............................................................................................. 44
Cold compression test .............................................................................. 45 Drop test .................................................................................................. 46
Reducibility test ....................................................................................... 47 Test for reduction–disintegration .............................................................. 48
EXPERIMENTAL SECTION..................................................................................... 505 Material characterization .......................................................................................... 51
5.1 Main by-products and preliminary preparation .................................................. 51 Drying of the samples............................................................................... 52
5.2 Moisture content ............................................................................................... 535.3 XRF sample preparation and analysis ................................................................ 55
5.4 LECO samples preparation and analysis ............................................................ 565.5 XRD sample preparation and analysis ............................................................... 57
5.6 Scanning Electron Microscope (SEM) ............................................................... 585.7 Particle size analysis .......................................................................................... 62
Sieving ..................................................................................................... 62 Laser diffraction ....................................................................................... 62
5.8 Density Measurement ........................................................................................ 63 True density ............................................................................................. 63
Bulk density and voids ............................................................................. 656 Briquetting ............................................................................................................... 67
6.1 Emma software ................................................................................................. 676.2 Briquettes recipe and production ....................................................................... 69
First stage (Producing reference briquette) ............................................... 70 Second stage (Investigation of briquetting force increase) ........................ 71

VII
Third stage (Investigation of BF and BOF sludge introduction) ................ 71
Fourth stage (Investigation of lignin use as a binder) ................................ 72 Curing ...................................................................................................... 72
6.3 Testing of the briquettes .................................................................................... 73 Compression test ...................................................................................... 73
Drop tests ................................................................................................. 74 Tumbler test ............................................................................................. 75
7 Results and discussion.............................................................................................. 777.1 Material characterization ................................................................................... 77
Moisture content ...................................................................................... 77Modified recipe based on moisture content ....................................................... 77
Chemical composition .............................................................................. 79 Mineralogical composition ....................................................................... 85
Particle size analysis................................................................................. 97 Density and voids ................................................................................... 101
True density of the raw materials .................................................................... 101Bulk density and voids .................................................................................... 102
7.2 Briquettes ........................................................................................................ 102 Briquettes compaction with EMMA ....................................................... 102
Briquettes chemical composition ............................................................ 105 Briquettes influence on zinc and alkali input to BF ................................. 107
Influence of briquetting force on briquettes compression strength........... 109 Influence of sludge addition on briquettes strength ................................. 113
Influence of lignin use as binder substitute on briquette strength ............ 116 Briquettes drop tests ............................................................................... 118
Briquettes tumbling test .......................................................................... 1218 SUMMARY .......................................................................................................... 123
9 References ............................................................................................................. 125

VIII
List of figures
Figure 1 Stages of the thesis experimental work ............................................................ 2
Figure 2 Input and output of a blast furnace (Geerdes et al., 2015) ................................ 3
Figure 3 Temperature profile in a blast furnace (Geerdes et al., 2015) ........................... 3
Figure 4 Zones in blast furnace (Peacey and Davenport, 1979)...................................... 4
Figure 5 Schematic presentation of reduction of iron oxides and temperature. ............... 5
Figure 6 Burden materials (Meyer, 1980) ...................................................................... 7
Figure 7 Road map for reverts generation and utilization (example based on 7.29 × 10⁶ t
crude steel/year) (Cavaliere, 2016) .............................................................................. 24
Figure 8 Strength development in agglomerates (Pietsch, 2005) .................................. 25
Figure 9 Pictorial representation of the binding mechanisms of agglomeration (Pietsch,
2002) .......................................................................................................................... 27
Figure 10 Sketches explaining the mechanism of pressure agglomeration (Pietsch, 2005)
................................................................................................................................... 28
Figure 11 Density distribution in cylindrical compacts with increasing compacting forces.
(Pietsch, 2002) ............................................................................................................ 29
Figure 12 Diagram of equipment for high-pressure agglomeration. Ram press (upper left),
punch and die press (upper right), roller presses for compaction (lower left) and
briquetting (lower right) .............................................................................................. 30
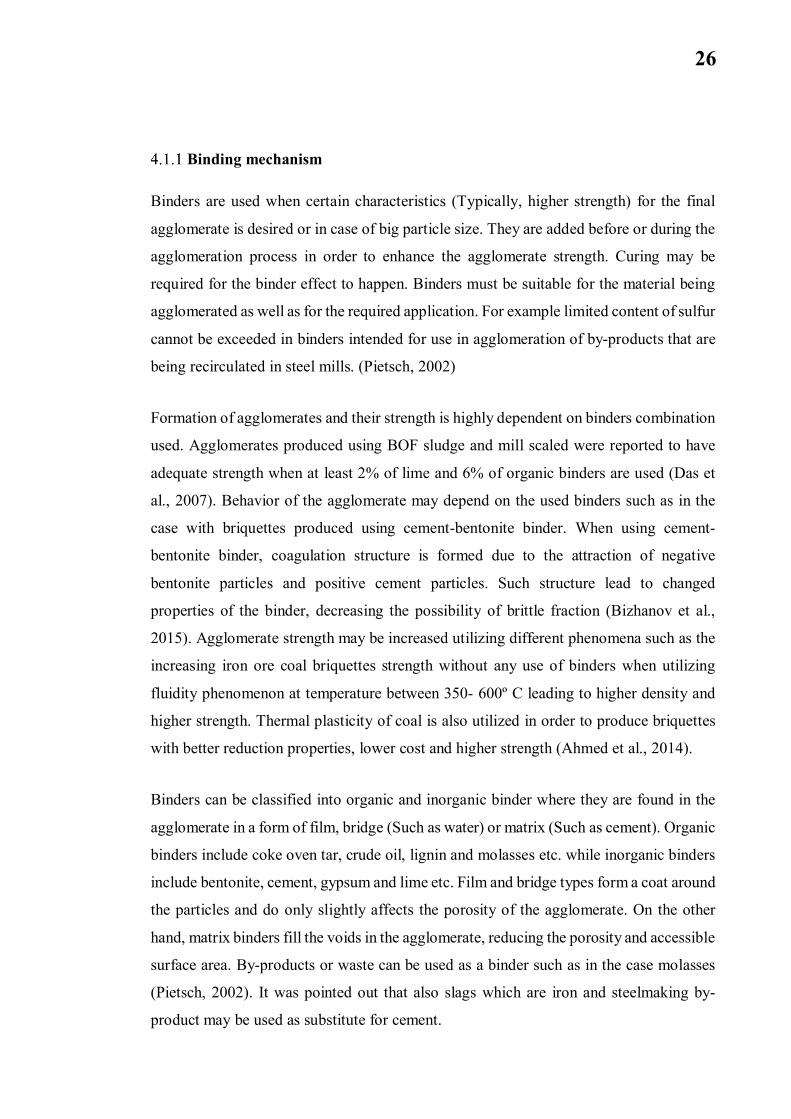
Figure 13 State of contact between carbonaceous material and iron (Kasai and Matsui,
2004) .......................................................................................................................... 32
Figure 14 Effect of pressing pressure on the compressive strength of briquettes pressed
at constant binding materials percent 3.5% pitch. (El-Hussiny and Shalabi, 2011) ....... 41
Figure 15 Principle of tumbler test (British Standards Institution, 2007a) .................... 45
Figure 16 Sketch of a drop test arrangement (Pietsch, 2002) ....................................... 46
Figure 17 Example of test apparatus (schematic diagram). (British Standards Institution,
2007b) ........................................................................................................................ 48
Figure 18 By-products after drying 1- Pellet fines 0-10 mm, 2-Pellet fines 0-5 mm, 3-BF
stock/cast house dust, 4-Coke dust, 5-Premix, 6-Briquette fines, 7-Desulfurization scrap,
8-Mill scale, 9-Steel scrap, 10-BOF sludge, 11-BF sludge........................................... 53
IX
Figure 19 Mixer Mill MM 400 used for XRF sample preparation ................................ 55
Figure 20 Agate mortar, pestle and Acetone used for cleaning .................................... 57
Figure 21 mounting sample on flat holder ................................................................... 58
Figure 22 V-Vial (Top-left), Resin, hardener (Top right) and final solution (Bottom) .. 59
Figure 23 Tabletop cut-off machine, Struers Secom-50 and vertically cut sample v-vial.
................................................................................................................................... 60
Figure 24 Vacuum impregnation unit (left), flipping sample over (middle) and tagging
specimen (Right) ......................................................................................................... 60
Figure 25 BF slag cement specimen polishing and final polishing product .................. 61
Figure 26 Carbon coating of specimen ........................................................................ 61
Figure 27 Vibratory sieve shaker ................................................................................. 62
Figure 28 Gas pycnometer AccuPyc II 1340 and helium gas tank................................ 65
Figure 29 Technique principle of gas, pycnometer AccuPyc II 1340. (“AccuPyc II 1340 |
Micromeritics,” n.d.) ................................................................................................... 65
Figure 30 Basic recipe input to EMMA software ......................................................... 68
Figure 31 Briquetting machine. ................................................................................... 69
Figure 32 Mixer .......................................................................................................... 69
Figure 33 Briquettes placed inside tightly closed box along with several water containers,
simulating humid curing conditions ............................................................................ 73
Figure 34 Compression test machine ........................................................................... 74
Figure 35 GERMATEC jar mill used for tumbling test................................................ 75
Figure 36 Main elements in by-products ..................................................................... 81
Figure 37 Minor elements in by-products .................................................................... 81
Figure 38 (A) SEM images showing wustite (W) and carbon (C), presence in cast house
dust, (B) EDX spectrum 10 for carbon, (C) and (D) EDX spectrum for wustite, and (E)
elements surrounding wustite ...................................................................................... 87
Figure 39 (A) Electron image of mill scale with EDX revealing the presence of (B)
metallic iron, (C) wustite and (D and E) magnetite ...................................................... 89
Figure 40 Magnetite (M) in BOF sludge sample .......................................................... 91
Figure 41 Spectrum 1 for BOF sludge sample ............................................................. 91
Figure 42 Spectrum 3 for BOF sludge sample ............................................................. 92
Figure 43 Metallic iron (Fe) in BOF sludge sample ..................................................... 92
Figure 44 Elements map for BOF sludge sample ......................................................... 93
Figure 45 SEM image for steel scrap ........................................................................... 95

X
Figure 46 EDX spectrum for (A), spherical magnetite particle, (B) elongated magnetite
particle, (C) Wüstite surrounding metallic iron and (D) metallic iron core ................... 95
Figure 47 SEM image of desulphurization scrap sample ............................................. 96
Figure 48 EDX spectrum reveals the likely presence of (A, C) Calcite phase, (B) Metallic
iron and (D) Portlandite phase ..................................................................................... 97
Figure 49 Particle size distribution analysis results for by-products ............................. 99
Figure 50 Basic briquette particle compaction (q=0.30)............................................. 103
Figure 51 Basic briquette particle compaction (q=0.30) utilizing Andreassen model . 103
Figure 52 Compaction of briquette with 8% introduced sludge (q=0.30) ................... 104
Figure 53 EMMA particle packing for 1% lignin briquette (q=0.30) ......................... 104
Figure 54 Main elements in different produced briquettes ......................................... 106
Figure 55 Harmful element content in briquettes ....................................................... 107
Figure 56 Harmful elements input to BF based on 8% share of briquettes in burden .. 109
Figure 57 Height difference between a briquette produced using 200 bar (left) and a
briquette produced using 100 bar (right) .................................................................... 110
Figure 58 Influence of briquetting force on briquettes compression strength ............. 111
Figure 59 Briquettes failure after compression test .................................................... 112
Figure 60 Influence of sludge introduction to briquette recipe ................................... 113
Figure 61 Influence of 8% sludge addition to briquette recipe ................................... 114
Figure 62 Failure behavior in sludge introduced briquettes after compression test ..... 115
Figure 63 Influence of lignin use as binder substitute ................................................ 116
Figure 64 Influence of cement/water ratio on strength of lignin briquette .................. 117
Figure 65 Failure behavior in briquettes specimen with 2% introduced lignin as binder
substitute with different water content ....................................................................... 118
Figure 66 Drop test for briquettes with two different recipes ..................................... 119
Figure 67 Briquettes weight loss during 2 days-drop test ........................................... 119
Figure 68 Briquettes weight loss during 7 days-drop test ........................................... 120
Figure 69 Tumble and abrasion indices for two briquette recipes .............................. 122

XI
ACRONYMS
AI Abrasion Index
ASTM American Society for Testing and Materials
BF Blast Furnace
BOF Basic Oxygen Furnace
CC Continuous Casting
CDQ Coke Dry Quench
CH Calcium Hydroxide
CPFT Cumulative Percent Finer Than
CRM Cold Rolling Mill
C-S-H Calcium Silicate Hydrate
CWQ Coke Water Quench
EDS Energy Dispersive Spectroscopy
EMMA Elkem Materials Mixture Analyser
ESP Electrostatic precipitator
GGBFS Ground Granulated Blast Furnace Slag
HBI Hot briquetted Iron

XII
PSD Particle Size Distribution
tHM Ton of hot metal
TI Tumbling Index
TSP Total Suspended Particulates
WDS Wavelength Dispersive Spectroscopy

1
1 INTRODUCTION
During the past 10 years, the crude steel production has increased globally from around
1,252 Mt in 2006 to become 1,630 Mt in 2016 with China share being the highest at
49.6% and the EU share at 9.9%. Finland crude steel production was 4.1 Mt in 2016 with
around 67.1% being produced through the Oxygen steel making route and 32.9% being
produced though electricity. (Holappa and Taskinen, 2017; Worldsteel association, 2017)
Metallurgical industry plays a significant role in Finland with 12% of exports value.
However, metallurgical industries are very energy intensive in nature and may have
significant environmental impact. In Finland, metallurgical industry accounts for 7% of
equivalent CO2 emissions and required primary energy sources such coal, oil and gas are
not available in Finland so they are imported as a result. This also made it a necessity for
innovation and research to focus on energy saving (Holappa and Taskinen, 2017).
SSAB Europe integrated Raahe steel works was originally found in the 60’s to utilize
Finnish iron ore, producing plates and sheets. As of 2011, the sinter plant was shut down
and currently, the blast furnace charge consists of iron burden (pellets, briquettes,
limestone, BOF slag, scrap) and coke. With the shutdown of the sintering plant, a 280,000
t /a briquetting plant came into operation by October, 2011. At that point, without the
briquetting plant, 250,000 t/a material would be moved to landfill. The shutdown of the
sintering plant has resulted in 8-11% and around 70% decrease in CO2 and SO2 emissions
respectively and a decrease of 7% in energy consumption (Holappa and Taskinen, 2017;
Lerssi, 2011; Mattila et al., 2013).
Currently, the sludge produced in the plant is not utilized in the produced briquettes due
to sludge high moisture content and very fine particles. Also, operational challenges rise
up as a result of recycling the sludge due to its Zinc content. Sludge recycling represents
a good opportunity to increase the recycling rate of internal by-products and reserving the
natural resources (less iron ore pellets). Even though almost all the relevant by-products
are recycled via briquetting today it is possible to use these by-products in BOF sludge
briquette, if it solves the BOF sludge recycling problem.

2
The objective of this work is to develop a self-reducing BF briquette from BOF sludge
and other by-products at SSAB Raahe steel plant. At the moment, BOF sludge is
landfilled due to its high moisture and harmful element contents. Biomass-based lignin is
studied as binder and carbon-bearing material in the briquettes (replaces cement). To
achieve the aim of the thesis, the following objectives were set:
1- Mineralogical and chemical compositions of the raw materials were studied using
different techniques.
2- Briquette recipes are developed based on the availability of steel plant by-products,
and their particle packing, chemical and physical properties.
3- Incorporation of blast furnace (BF) and basic oxygen furnace (BOF) sludge into the
briquette recipes was studied.
4- The possibility of replacement of rapid cement with lignin was studied.
5- Mechanical tests (compression test, drop test and tumble test) were carried out for
chosen briquettes.
6. Comparison between the different briquettes recipes on the basis of mechanical
properties.
Different stages of the thesis practical work are demonstrated in the schematic Fig. (1).
Figure 1 Stages of the thesis experimental work

3
2 BLAST FURNACE
Blast furnace (BF) is a tall vertical shaft furnace with refractory bricks used as lining.
Most of the ore used in the blast furnace is Magnetite (Fe3O4) and Hematite (Fe2O3).
Limestone and coke are also charged to the blast furnace. Blast furnace input takes the
form of alternating layer of coke and iron burden. Preheated air at temperature between
1000 to 1300º C is compressed and enters the furnace through tuyeres which are cooled
copper conical nozzles. The number of tuyeres usually ranges from 12 to 42 depending
on the size of the blast furnace. Sometimes, other carbon based materials are injected
through the tuyeres such as natural gas, coal and/or oil as mentioned. The input, output
and temperature profile of the blast furnace is shown in Figure 2 and Figure 3 below.
(Geerdes et al., 2015; Hosford, 2012; Peacey and Davenport, 1979)
Figure 2 Input and output of a blast furnace (Geerdes
et al., 2015)
Figure 3 Temperature profile in a blast furnace (Geerdes et al.,
2015)
The carbon based materials are gasified by the hot air and high temperature gas (1900-
2300º C) is produced as the oxygen in the blast is transformed into gaseous carbon
monoxide. The ascending hot gases then heat up the coke, melting the iron burden and
heating the material in the blast furnace shaft zone. The iron burden oxygen is removed
through chemical reactions. Slag and hot metal are produced as a result of iron burden
melting. The hot metal drips down through the coke into the hearth and is finally removed
through the taphole. In the dripping zone, more coke is consumed for further iron oxide
reduction and carbon dissolves in the hot metal in what is known as carburization. The

4
counter current process and different zones in the blast furnace are shown in Figure 4
below.
Figure 4 Zones in blast furnace (Peacey and Davenport, 1979)
Softening/melting zone is found at temperature between 1000-1350º C as shown in
Figure 3. Blast furnace contains layers of coke and ore at the top and as we move
downward. Cohesive zone or softening/melting zone is found where the ore starts to
soften and melt. Active coke zone is the zone where only coke and liquid iron exist. Dead
man area is the area where stable pile of coke is located. (Hosford, 2012)
2.1 Gas flow through the burden
The heated air enter the furnace through tuyeres and as a result, the reductant -which is
usually coke or can be tuyeres Injectants- is gasified in front of the tuyeres. This process
generates very hot flame and the oxygen in the air introduced is then transformed into
carbon monoxide (CO) and hydrogen (H2). In operational mode, there are around 45
layers of ores that separate the coke as shown in Figure 5. The coke is coarser than sinter
and pellets which means it is much more permeable. The size of the coke is usually around

5
45 to 55 mm, pellets are around 6 to 15 mm and sinter 10 to 20 mm. This means that the
main factor affecting how the gas flows is the burden layering with the coke layers acting
as gas distributors. (Geerdes et al., 2015)
There are two types of reductions that take place inside the furnace, direct and indirect
reductions. They take place at different zones of the furnace at different temperatures.
The softening takes place within temperatures 1000-1350º C. The remaining oxygen in
the burden at that point is removed in what known as direct reduction which results in the
formation of additional CO. Heat is then transferred from the gas to burden and the CO
available forms carbon dioxide (CO2) in what is known as indirect reduction. This is
similar to the hydrogen reaction where it removes oxygen from the burden resulting in
the formation of water. Moisture is removed from the burden before any reaction takes
place in the drying zone. The beginning of oxygen removal is around 500º C. Figure 5
below shows the stages of oxygen removal. (Geerdes et al., 2015; Peacey and Davenport,
1979)
Figure 5 Schematic presentation of reduction of iron oxides and temperature.
The direct reaction takes place as CO2 is converted into CO at high temperature when it
is in contact with coke. The reaction is as the following:
2 . + ⟶ 2 +
+ ⟶ 2

6
This leads to in total,
2 . + ⟶ 2 +
The indirect reduction takes places through the ascending gases as the following for
hematite, magnetite and wüstite respectively:
6 + 2 ⟶ 4 + 2
4 + 4 ⟶ 12 + 4
6 + 3 ⟶ 6 . + 3
As shown in the schematic, hematite (Fe2O3) is first reduced to magnetite (Fe3O4) which
generates energy and the magnetite (Fe3O4) is reduced to wustite (FeO), consuming
energy. The more oxygen is removed from the burden by the gas, the more efficient is the
process, so it is very important to optimize the contact between the gas and the burden
through the permeability of burden. The low permeability of the ore layers has been found
to cause issues in the blast furnace process. The permeability is largely dependent on the
quantity of the fines in the layer. Such fines usually originates from the sinters but they
can also be generated through low temperature reduction–disintegration (LTD) which
takes place during the reduction of hematite to magnetite. During the reaction, tension on
the crystal may be created resulting in its breakage into smaller particles. This means it is
important to control such reaction characteristics and also make sure that the burden is
sieved through 5-6 mm screens. Efficiency of the blast furnace process can be measured
through gas utilization formula which is shown below. This formula takes into
consideration the amount of reductants per ton of hot metal and indicates how much
carbon monoxide was used in the process of reducing the burden. The efficiency
indication is given accurately through the top gas analyzer. (Geerdes et al., 2015)
= ( + ) (7)

7
2.2 The Ferrous Burden and coke
Recently, it has become more favorable to have fewer but bigger blast furnaces. This has
also made it more attractive to have rich iron burden which means high iron content.
Creating such rich iron burden through physical process resulted in the generation of fine
particles which are not permeable enough for smooth operation of the blast furnace as
indicated earlier. Sintering and pelletizing were then necessary as means of agglomeration
of these fine particles. Sinter and pellets are used side by side with the iron burden.
(Geerdes et al., 2015)
With the lump ores becoming scarcer, having bad burden properties, only a portion of
around 10-15% depending on the quality can be used as a burden in the blast furnace.
Also with more restrictions being put on sintering plants, one option which is the focus
of this research is to use the recycled in-plant reverts to produce briquettes that can be
used as iron burden. This can boost the furnace productivity while contribute in the
reduction of greenhouse gases (Geerdes et al., 2015). Different burden materials can be
seen in Figure 6 below.
Figure 6 Burden materials (Meyer, 1980)
The burden descends in the furnace from top to bottom as voids are created. Voids are
created due to coke gasification in front of tuyeres, melting of the burden by the hot gases
and finally the coke consumption due to direct reduction and carburization. It descends
due to the difference between the downward forces (mostly resulting from the weight)

8
and the upward forces (Mostly resulting from pressure difference between blast and the
top). (Geerdes et al., 2015)
Generation of fines, reducibility, softening and melting
It is important for the burden to permeable enough in the shaft zone inside the furnace.
Fines are either charged into the furnace with the burden or get generated during the
process. Material smaller than 5 mm are defined as fines which, if found in big quantities
in the furnace, will hinder the reducing gas ability to flow upward through the burden.
For this reason, the burden is screened for less than 3% of fines. Fines are generated in
the reduction–disintegration when the hematite is reduced to magnetite. When magnetite
increase in the sinter, the particles release decrease. Higher basicity also contribute to the
reduction of particles generation while the presence of Al2O3 and MgO contribute in the
increase of particles release. Other factors that also affect the reduction–disintegration
include the amount of hydrogen and how fast the heating and reduction rate are in the
furnace. (Geerdes et al., 2015)
The burden material should have relatively high melting temperature and also the
softening and melting should have in narrow range of temperature. The reason is that the
permeability is reduced greatly by the melted burden. Acid pellets and lump ore starts
melting at around 1000º C while fluxed pellets and sinter melt at higher temperature.
(Geerdes et al., 2015)
Sinter, pellets and lump ores
Pellets are produced from concentrate or grained natural iron ores that are rolled with
addition of wetting liquid or additives to create green pellets that are then dried and
indurated in a second step. Their properties include uniform size distribution, uniform
mineralogical composition high porosity and high iron content and sufficient mechanical
strength. Sinters are the product of an agglomeration process where coarse grained ore
particles are used as feed to the sintering process and coke breeze acting as the main
source of energy. The mix is heated slightly above softening temperature. Spongy sinter
cake is obtained that is later crushed, grinded and screen to get the desired grain size
9
(Meyer, 1980). Lump ores are rich with iron. Although they have lower price than pellets,
they have poorer properties when it comes to fines generation, melting and reduction.
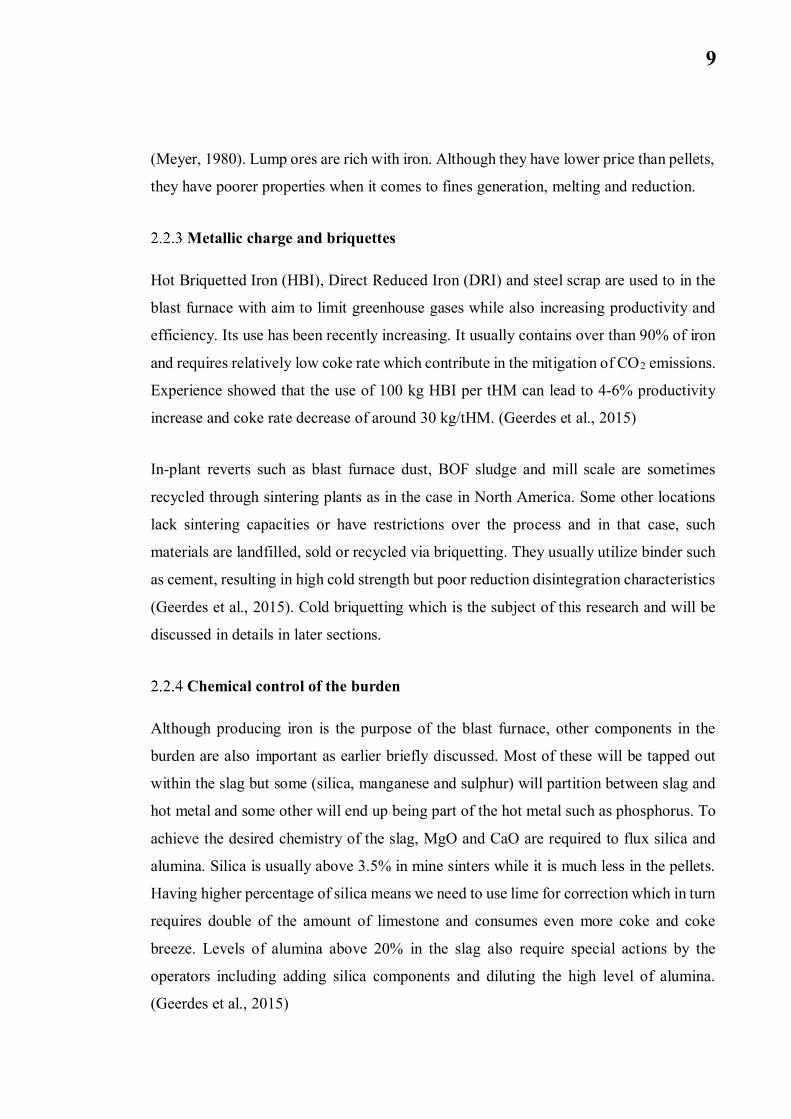
Metallic charge and briquettes
Hot Briquetted Iron (HBI), Direct Reduced Iron (DRI) and steel scrap are used to in the
blast furnace with aim to limit greenhouse gases while also increasing productivity and
efficiency. Its use has been recently increasing. It usually contains over than 90% of iron
and requires relatively low coke rate which contribute in the mitigation of CO2 emissions.
Experience showed that the use of 100 kg HBI per tHM can lead to 4-6% productivity
increase and coke rate decrease of around 30 kg/tHM. (Geerdes et al., 2015)
In-plant reverts such as blast furnace dust, BOF sludge and mill scale are sometimes
recycled through sintering plants as in the case in North America. Some other locations
lack sintering capacities or have restrictions over the process and in that case, such
materials are landfilled, sold or recycled via briquetting. They usually utilize binder such
as cement, resulting in high cold strength but poor reduction disintegration characteristics
(Geerdes et al., 2015). Cold briquetting which is the subject of this research and will be
discussed in details in later sections.
Chemical control of the burden
Although producing iron is the purpose of the blast furnace, other components in the
burden are also important as earlier briefly discussed. Most of these will be tapped out
within the slag but some (silica, manganese and sulphur) will partition between slag and
hot metal and some other will end up being part of the hot metal such as phosphorus. To
achieve the desired chemistry of the slag, MgO and CaO are required to flux silica and
alumina. Silica is usually above 3.5% in mine sinters while it is much less in the pellets.
Having higher percentage of silica means we need to use lime for correction which in turn
requires double of the amount of limestone and consumes even more coke and coke
breeze. Levels of alumina above 20% in the slag also require special actions by the
operators including adding silica components and diluting the high level of alumina.
(Geerdes et al., 2015)

10
Coke
Coke is a strong non-melting material. It has bigger particle size than that of the ore
burden. At temperatures of 1500º C or more, it still remains in the sold state. Being the
only solid beneath the melting zone, it works as a support for the content of the blast
furnace. It also provides the permeable structure through which the reducing gas ascend.
It generates the heat required for melting the burden and generates the reducing gases. It
also proves the carbon required for carburization and finally, acts as a filter for dust.
(Cavaliere, 2016; Geerdes et al., 2015)
In efforts to reduce the costs for blast furnace operations, natural gas and coal injection
have been partially used as a substitute for coke. Coal injection affects mechanical and
chemical conditions the coke is subjected to, including increased mechanical load and
residence time increase. (Geerdes et al., 2015)
2.3 Operational challenges
The burden
The operation challenges related to the burden include the fines present in the burden and
the fines generated in the process as discussed in section 2.2.1 above. Fines are generated
in the process of handling the bulk material such as the coke and ore burden which
requires that they are screened before being charged. Beside the impermeability related
problems arising as a result of the fines generation that affect the reduction and melting
of the ore, fines can also lower the efficiency of the furnace as they migrate to the cohesive
zone. This happens because the oxygen is then removed through direct reduction. Fines
problem can also be mitigated through charging arrangements as well as proper bin
management in stockhouse practices to eventually avoid breaking the material as they fall
longer distances. (Geerdes et al., 2015)
Moisture input can also be problematic as the process should start after the burden and
coke moisture is removed. The moisture removal take place at the top of the furnace and
in case of higher moisture content, the efficiency of the reduction will decrease as a

11
consequence of shorter chemical reserve zone. Moisture variation can cause the BF to
enter thermal cycle which also results in more fuel consumption. High moisture content
in the coke and burden can take place as a result of poor storage or transportation
conditions. (Geerdes et al., 2015)
Alkali and zinc
Potassium, sodium and zinc can have affect the refractory negatively as they form gaseous
compounds that condensate on the burden. Coke reactivity is hindered by Alkalis (sodium
and potassium) which means lowering the efficiency of the furnace. Ore that contains
high alkali content are relatively cheap but upon the utilization of such ores, there is no
possibility for high productivity. High alkalis lead to higher fuel use and less permeability
due to the increased degradation of the coke and burden. Burden descending is badly
affected as well since alkali presence leads to the formation of solids that adhere to the
wall in the stack of the furnace. Carbon based refractories are more vulnerable to the
presence of alkali which leads to shorter campaign length. Alkali leaves the furnace
mostly as part of the slag and some leaves through the top gas. (Geerdes et al., 2015)
Recycling of blast furnace top dust and sludge and the scrap type used are the main
contributors to the Zinc presence in the blast furnace. Zinc enters the furnaces in many
forms and is reduced at the lower part of the furnace. It has low melting and boiling
temperatures so it ascend with the gas and is then re-oxidized and condensate on burden
and coke; it is eliminated with the top gas. Zinc oxide has the following consequences.
(Geerdes et al., 2015)
1- Condensation on the walls of the furnace forming scaffolds which affects the
process inside the furnace.
2- It can hinder the gas reduction process as it deposits in the pores of ferrous
materials.
3- Carbon based refractories also become brittle and cracks take place as a result of
zinc deposits.
12
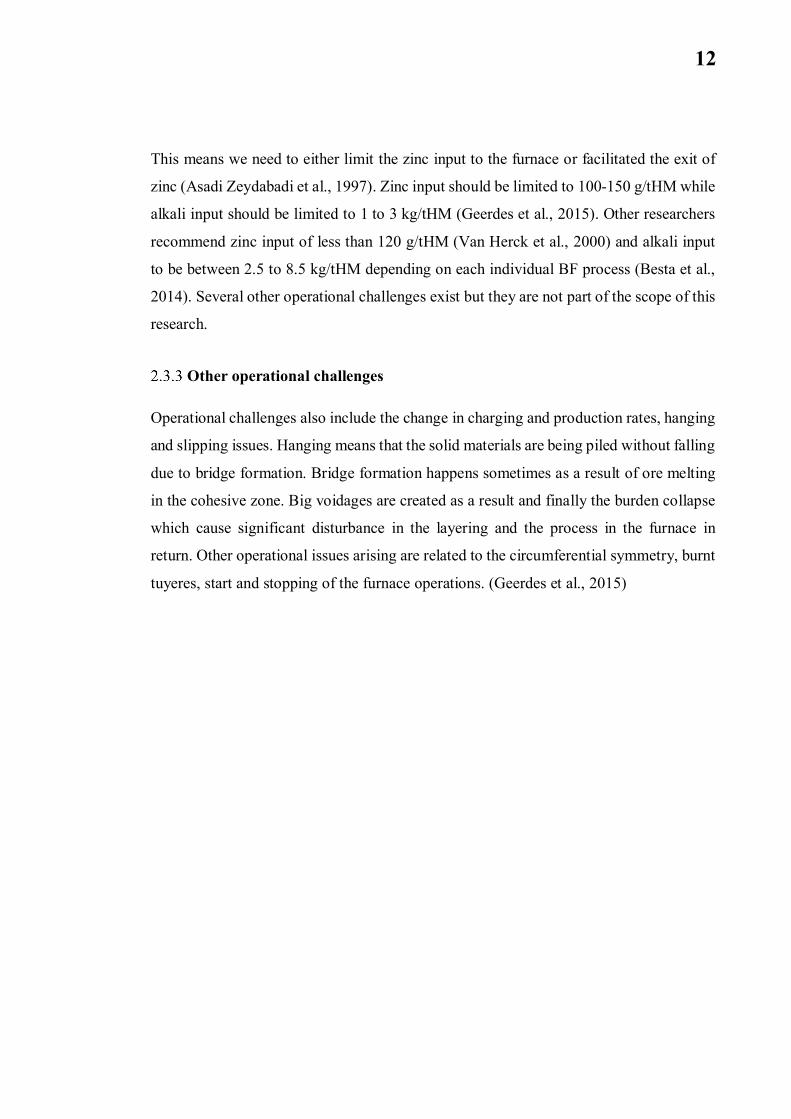
This means we need to either limit the zinc input to the furnace or facilitated the exit of
zinc (Asadi Zeydabadi et al., 1997). Zinc input should be limited to 100-150 g/tHM while
alkali input should be limited to 1 to 3 kg/tHM (Geerdes et al., 2015). Other researchers
recommend zinc input of less than 120 g/tHM (Van Herck et al., 2000) and alkali input
to be between 2.5 to 8.5 kg/tHM depending on each individual BF process (Besta et al.,
2014). Several other operational challenges exist but they are not part of the scope of this
research.
Other operational challenges
Operational challenges also include the change in charging and production rates, hanging
and slipping issues. Hanging means that the solid materials are being piled without falling
due to bridge formation. Bridge formation happens sometimes as a result of ore melting
in the cohesive zone. Big voidages are created as a result and finally the burden collapse
which cause significant disturbance in the layering and the process in the furnace in
return. Other operational issues arising are related to the circumferential symmetry, burnt
tuyeres, start and stopping of the furnace operations. (Geerdes et al., 2015)

13
3 RECYCLING OF IRON AND STEELMAKING REVERTS
During the process of iron and steelmaking, many by-products are generated such as dust,
sludge, slurry, slag and scales; approximately, 2-4 tons of wastes are being generated per
ton of produced steel. These by-products contain high iron and carbon content which
encourages the idea of recycling such products. However, certain compounds may form
a challenge to recycle such products. These compounds include PbO, ZnO, Na2O, K2O,
sulfates and chlorides. Many operational issues may arise as a result of the presence of
these compounds as discussed in section 2.3 above. Valuable materials that are usually
contained in such by-products (Calcium, Zinc and lead) can be recovered through
physical and chemical techniques which eventually contribute to conserving resources
and protecting the environment, especially when taking into consideration that disposal
of waste occupies plenty of land, is associated with high cost and introduces harmful
compounds such as As, Cd and Hg to the environment. (Das et al., 2007; Fosnacht, 1985)
3.1 Dust
Dry process for air pollution control such as electrostatic precipitator (ESP), cyclone and
bag filter catch the escaping dust from different processes such as BF and BOF processes.
Different dust bearing gases are treated differently based on their volume, dust particle
sizes, properties of the involved compounds. Certain compounds are harder to separate
with certain process such as in the case of alkali chlorides. Alkali chlorides have high
electric resistance which makes them hard to polarize and it is eventually difficult to
remove them through ESP. (Cavaliere, 2016; Das et al., 2007; Van Herck et al., 2000)
BF stock/Cast house dust is the dust carried by smoke with very high temperature is
generated when the hot metal is loaded into a hot metal ladle. It’s also generated at trough,
tapping hole, skimmer and slag spout. Modern steel plants cast house generate total
suspended particulates (TSP) of about 0.42–41.95 g/tHM and 0.26–25.92 g/tHM of PM10.
Dust particles can be coarse but may also have a size even smaller than 1 µm. BF
generates dust in rates of around 8-12 kg/tHM. Dust generated by blast furnace is usually
rich in carbon (a plant in Sweden produces dust with 43.6% carbon content). As dust is

14
dry, it is more convenient to recycle. It is recycled in form of briquettes, through sintering
plant or injected from the tuyeres. (Cavaliere, 2016; Das et al., 2007; Lanzerstorfer, 2017;
Van Herck et al., 2000)
It should be taken into consideration that the contained unwanted elements in BF dust
cause operational problems in BF as previously discussed (Zinc, lead and alkali metals).
It also contains toxic elements such as Cd, as and Cr that are considered hazardous. De-
alkalification can be performed on BF dust by acid leaching, scrubbing, washing and
leaching with CaCl2 and NH4Cl. Sodium and potassium can be removed up to 75 and 22%
respectively through particle size reduction. The very fine size of dusts makes it difficult
to handle and to transport and can make a serious clean-up problem as dry dust can easily
become airborne and form an emission problem. (Das et al., 2007; Fosnacht, 1985)
Recycling of dust and Zinc removal
Su et al. (2004) investigated the recycling of BF flue dust and BOF sludge as well as oily
mill scale through cold bonded pelletizing utilizing cement as a binder. The study used
experimental design and concluded that interaction between BF flue dust and BOF sludge
has negative effect on the cold strength of cold bonded pellets. Lanzerstorfer (2017)
reported that most of zinc is contained in the fine fraction of cast house dust and by
removing 10% of the finest fraction of the dust, it’s possible to remove up to 40% of zinc.
He also suggested air classification as method of separation.
Fosnacht (1985) reported that zinc is mostly contained in finer particles of BF dusts where
more than 62% of zinc was found in size fraction less than 149 µm. Asadi Zeydabadi et
al. (1997) has investigated the recovery of zinc from BF dust through leaching. The
research utilized sulfuric acid for leaching due to its high selectivity towards zinc.
Purification process that utilize precipitation and cementation techniques was then
applied to remove the impurities such as iron and aluminum from the leach liquor. The
Zinc was then extracted using liquid cationic exchanger and was finally stripped from the
organic extract by high acidity electrolyte. Using that technique can reach a level of 80%
recovery of zinc, and helps producing non-hazardous residue that is possible to be stored
or recycled in agglomeration units.

15
Other researchers have utilized forth flotation and wet cyclone methods in order to
remove zinc from BF and BOF dust. Efficiencies of 99.48% for zinc removal and 98.58%
for lead removal were reached. (Das et al., 2007). Mantovani and Takano (2000)
investigated zinc removal efficiency of self-reducing pellets produced from EAF dust,
coal fines and additives. The research concluded that it is possible to remove 99% of zinc
from EAF dust at temperature around 1200º utilizing self-reducing pellets, mainly
because of the released Co2 and H2O from cement and CaCo3.
3.2 Scale
Processes such continuous casting line (CC), hot strip mill, or bar and wire rod mills
produce mill scales. Through the continuous casting, de-scaling is done through water
guns. Mill scales are mostly Wüstite and contains more than 70% iron. During the
sintering process, mill scales are able to provide some heat as a result of Wüstite oxidation
to hematite resulting in fuel savings. Mill scale is recycled through briquetting or in
sintering plant. Due to oil use in different processes, mill scale sometimes become oily
which can later cause problems during the recovery process which may require de-oiling
(Cavaliere, 2016; Das et al., 2007; Kumar et al., 2017).
Mill scale was reported to account for one third of waste oxide material. Coarse mill
scales (some sources suggested 0.5 to 5 mm while others suggested 6.35 mm in size) were
directly charged into blast furnace while the finer material (less than 0.1 mm) were first
de-oiled through thermal incineration and were then utilized in the sinter plant as they
tend to adsorb high amount of oil (5-20%). The finer mill scale had bulk and theoretical
densities of 2,130 and 4,300 kg/m3 respectively. It was reported that mill scale generation
is about 35-40 kg/t of hot rolled product. Utilizing untreated mill scale with high oil
content may result increased emissions of volatile organic compounds and problems with
purification systems. (Fosnacht, 1985; Legodi and Dewaal, 2007)
Su et al. (2004) investigated recycling of BOF sludge and BF flue dust as well as oily mill
scale through cold bonded pelletizing and found that mill scale is dominant factor in
decreasing the pellets strength due to the large particle size, and suggested that the mill

16
scale sludge is rod-grinded prior to pelletizing. The chemical analysis of the by-products
used is shown in Table 1 below.
Table 1 Chemical composition of by-products used in BOF pellets. (Su et al., 2004)
Composition (%) BOF fine sludge BOF coarse sludge BF flue dust Oily mill sludge
FeO 57.4 46.7 20.6 58.2CaO 13.37 17.41 5.16 4.67SiO2 0.91 1.38 4.98 6.47MnO 0.93 0.67 0.62 0.84P2O5 0.13 0.14 0.07 0.13Al2O3 0.1 0.2 1.93 1.15MgO 3.1 3.71 1.06 0.21K2O 0.04 0.04 0.06 0.18TiO2 0.07 0.22 0.21 0.06Cr2O3 0.07 0.06 0.03 0C 1.47 1.33 54.3 4.59SiO2 0.07 0.07 0.38 0.11Zn 0.11 0.05 0.23 0.03
El-Hussiny and Shalabi (2011) also investigated the recycling of flue dust and mill scale
through briquetting process and reached different conclusion regarding the mill scale in
the mix; increasing the mill scale percentage in the briquette mixture lead to better
mechanical properties. The reason was believed to be that the hard mill scale formed a
skeleton like structure that held the briquette together. The increase in mill scale
percentage was also found to lower the reduction percentage. The investigation studied
different other factors including the pitch percentage in the mix, pressing force and
addition of coke breeze which were all found to have positive correlation with the
compressive strength.
Kumar et al. (2017) studied the production of briquettes made from cold rolling mill
(CRM) dust, BOF dust and mill scale. The aim of the study was to select suitable binder,
design the agglomerate mix and finally to optimize the process parameters. Molasses and
starch based briquettes were of adequate strength and plant trials utilizing molasses based
briquettes proved to have many operational advantages.
17
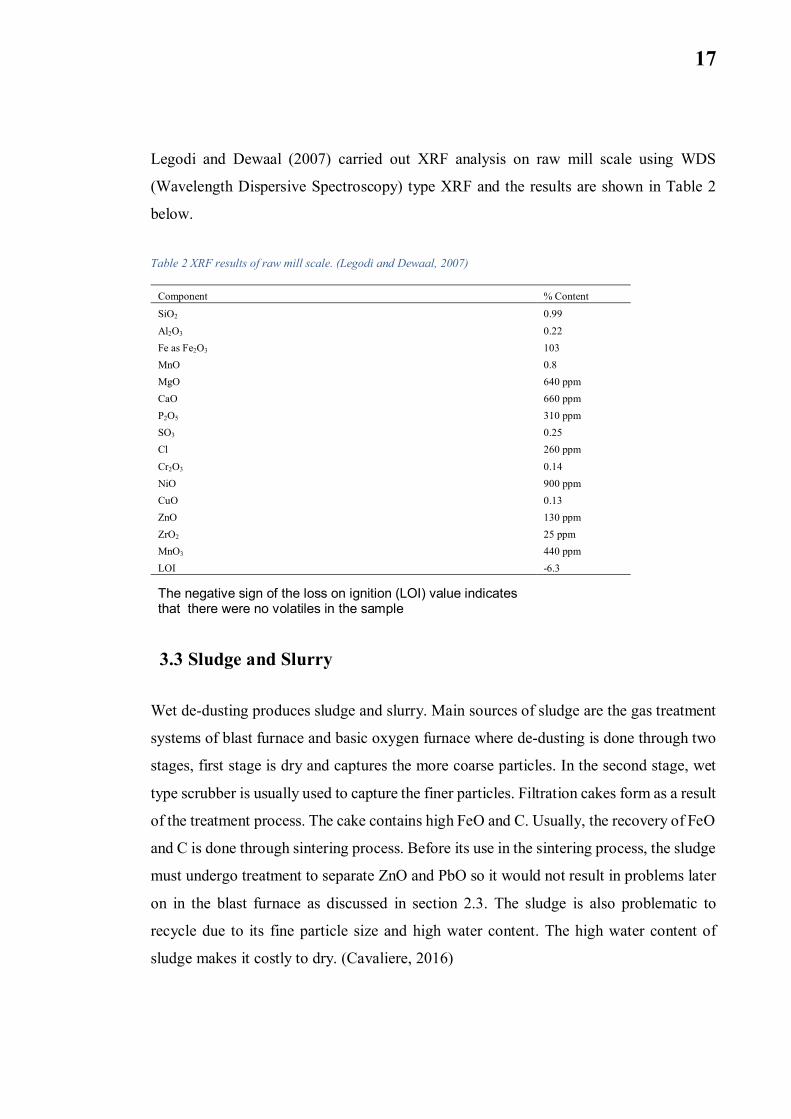
Legodi and Dewaal (2007) carried out XRF analysis on raw mill scale using WDS
(Wavelength Dispersive Spectroscopy) type XRF and the results are shown in Table 2
below.
Table 2 XRF results of raw mill scale. (Legodi and Dewaal, 2007)
Component % Content
SiO2 0.99Al2O3 0.22Fe as Fe2O3 103MnO 0.8MgO 640 ppmCaO 660 ppmP2O5 310 ppmSO3 0.25Cl 260 ppmCr2O3 0.14NiO 900 ppmCuO 0.13ZnO 130 ppmZrO2 25 ppmMnO3 440 ppmLOI -6.3
The negative sign of the loss on ignition (LOI) value indicatesthat there were no volatiles in the sample
3.3 Sludge and Slurry
Wet de-dusting produces sludge and slurry. Main sources of sludge are the gas treatment
systems of blast furnace and basic oxygen furnace where de-dusting is done through two
stages, first stage is dry and captures the more coarse particles. In the second stage, wet
type scrubber is usually used to capture the finer particles. Filtration cakes form as a result
of the treatment process. The cake contains high FeO and C. Usually, the recovery of FeO
and C is done through sintering process. Before its use in the sintering process, the sludge
must undergo treatment to separate ZnO and PbO so it would not result in problems later
on in the blast furnace as discussed in section 2.3. The sludge is also problematic to
recycle due to its fine particle size and high water content. The high water content of
sludge makes it costly to dry. (Cavaliere, 2016)

18
Recycling of sludge and Zinc removal
Omran et al., (2017) investigated BF sludge characteristics generated in SSAB Europe
Oy, Raahe, Finland and found it to have low zinc concentrations (< 2.5 g.kg−1). The
research came to the conclusion that the fraction with < 20 µm, is relatively rich with
hematite and zinc ferrite which is similar to results obtained by Fosnacht (1985) who
reported that zinc is concentrated in particle size fraction < 25 µm.. The research also
concluded that recovery of valuable minerals thorough physical separation is not possible
due to the very fine particle sizes (3–20 µm); hydrometallurgical methods are not suitable
due to low concentration of zinc which is also found in very stable zinc ferrite phase. The
research recommended agglomeration techniques such as briquetting and pelletizing as
potential utilizations methods.
Su et al. (2004) attempted recycling of BOF sludge and BF flue dust as well as oily mill
scale through cold bonded pelletizing utilizing cement as a binder. The aim was to re-
introduce the pellets to BOF converter. The study concluded that the fine sludge of BOF
has positive effect on the pellets strength. BOF fine sludge was also found to have the
most positive influence on reduction degree amongst the other factors. However, the
interaction between the BOF sludge and BF flue dust has the largest negative effect.
Van Herck et al., (2000) investigated hydrometallurgical process for BF sludge Zinc
removal. In the study, he used HCl for leaching under oxidizing conditions and found that
pH under 1.5 and a redox potential above 650 mV are optimum for leaching. The solids
were then separated and the leaching solution went through anion exchanger to remove
Zn and Pb. With 2 hours of reaction time, leaching efficiency of higher than 95% was
realized. However, it is worth mentioning that the zinc content in the investigated sludge
was relatively high (around 3.9%). Several researchers attempted the recycling of BF and
BOF sludge through briquetting and pelletizing; usually along with several other by-
products and reverts (Koros, 2003; Robinson, 2008; Singh et al., 2011; Singh, 2001).

19
3.4 Slag and Slag Tailing
For the blast furnace, 96% of the slag consists of SiO2, MgO, CaO and Al2O3. The rest is
S, MnO, TiO2, K2O, NiO and P. Slag mostly originates from gangue of the burden and
ash of the coke. Melting temperature of the slag is much higher than the iron. Liquidus
temperature is the temperature at which slag is completely molten. Below that
temperature, the slag is more viscous due to the presence of solid crystals. (Geerdes et al.,
2015)
Slag production is around 200-300 kg per tonne of hot metal while the slag produced in
steelmaking process can be around 100-120 kg per tonne of liquid steel. Slag composition
differs depending on the process where it originates but it contains the highest iron content
when it originates from desulfurization process at around 25% of iron compared to very
little amount of iron and high content of calcium oxide in BF slag. Slag powder can be
used as a cement replacement in some applications and is introduced today as Port land
blast furnace slag cement (PBFS) as 80% of blast furnace slag is cooled by high-pressure
water jet to finally get granulated slag, a product similar in composition to Portland
cement. BF slag can also be used in road making, preparation of ceramic glass, silica gel,
ceramic tiles and bricks (Cavaliere, 2016; Das et al., 2007; Geerdes et al., 2015). An
environmentally friendly substitute of concrete blocks has been developed utilizing
granulated blast furnace slag as a binder; BOF slag as aggregate; alkali stimulant to
increase hardening (Horii et al., 2013).
Slag produced in steelmaking undergoes 4 processes. (Horii et al., 2013):
1- Solidifying and cooling of molten slag: This is done through different techniques
such as air cooling in a yard; subjecting the slag to compressed air; subjecting to
water sprinklers after being poured to a steel box.
2- Crushing and magnetic separation: Slag containing 10-40% metal iron is being
generated in the different process of steelmaking such as converter, hot
metal/molten steel ladle, or tundish. Iron is separated after the slag is cooled and
crushed through means of magnetic separation (Horii et al., 2013). This
constitutes part of the by-products used in this research. (De-sulfurization scrap

20
and steel scrap). Slag handling scrap chemical composition is seen in Table 3
below.
3- Crushing and classification: This is required for commercial purpose as the
customer usually requires a certain grain size. Classification is done through
screening.
4- Aging treatment: This is done through either water from rainfall or utilizing
steam/hot water/high pressure aging treatment. The treatment involves the
hydration of free CaO and MgO. The hydration reaction causes them a significant
increase in size which is not suitable for road construction applications.
Table 3 Slag handling scrap and other by-products chemical composition. (Singh and Bjorkman, 2006)
Manganeseslag
slaghandling
scrap
Pelletfines
converterdust
Cutting(steelwork)
Cutting(rolling)
Millscale
Blastingdust Cement
wt.% wt.% wt.% wt.% wt.% wt.% wt.% wt.% wt.%
Fe 2.92 58.77 66.63 64.49 86.29 76.86 72.25 85.61 –Fe
(met) - 31.91 - 48.5 55.53 23.2 0.47 53 –
Fe2+ 0.86 14.59 2.14 8.83 22.68 34.83 57.9 25.9 –
Fe3+ 2.06 12.27 64.5 7.16 8.08 18.83 13.88 6.71 –
FexOy – – – – – – – – 2.67
MnO 49.25 1.57 0.07 1.14 0.75 1.22 1.15 1.14 0.04
CaO 11.72 14.9 0.39 15.66 0.3 0.16 0.22 0.04 64.04
MgO 4.07 3.35 1.45 2.42 0.05 0.1 0.04 0.04 3.34
Al2O3 8.13 1.17 0.39 0.27 0.12 0.06 0.16 0.08 4.36
SiO2 22.43 7.98 2.21 4.65 0.72 0.75 0.86 1.35 25.45
5O2P 0.05 0.21 0.03 0.11 0.04 0.02 0.02 0.04 0.03
K2O 1.93 0.02 0.03 0.02 0.01 0.01 0.01 0.01 1.09
Na2O 0.36 0.06 0.05 0.03 0.01 0.01 0.02 0.003 0.26
S 0.41 0.68 0.004 0.03 0.01 0.01 0.01 0.03 0.14
C – 2.03 – 0.82 0.1 0.12 0.06 0.58 0
Sum 102.83 102.47 100.09 96.68 98.49 97.58 97.63 99.36 101.66
Cao, MgO are found in BOF slag which also has high basicity and has high fluxing
capacity as a result. However, P and S should be removed from the slag prior to utilization
in BF to avoid operational problems. Phosphorus content is usually between 1-3% which
requires de-phosphorization to improve the slag utilization. Unlike BF slag, the slag from
BOF process is not suitable for cement making due to high iron oxide content. Therefore,
BOF slag should go under metal recovery process before it can be used in the steelmaking
industry. BOF slag is commercially utilized by cement industry in China. However, the

21
use of the slag in Portland slag cement (PSC) is restricted to 10% due to phosphorus
harmful effects. (Das et al., 2007; Pal et al., 2003)
3.5 Coke by-products
The coke used in the blast furnace must be within narrow size distribution to maintain
uniform permeability and gas flow. Size ranged between 40-60 mm is suggested in some
textbooks (Cavaliere, 2016) while even more narrow range of 45-55 mm is suggested in
others (Geerdes et al., 2015). This leads to the need of sieving to obtain the required size
for the furnace operation and the screening process produce smaller size coke usually
referred to as nut coke. Other coke by-products include coke dry quench (CDQ) dust,
coke water quench (CWQ) sludge (Cavaliere, 2016). CDQ dust chemical composition
along with some other by-products used in this research are found in Table 4 below. Many
attempts have been made to investigate the best route to recycle the nut coke within the
process and investigate how the use of nut coke may affect the process different aspects
such as permeability, productivity and efficiency.
It was found that mixing the nut with the ore in ratio up to 10-15% increases the
permeability in the furnace and has positive effect on the operation. Mixing improves the
reduction characteristics, reduces the rate of reduction agents, improves the cohesive layer
temperature properties and enhance softening and melting characteristics. (Kasai and
Matsui, 2004; Song, 2013)

22
Table 4 Typical chemical composition of reverts (%). (Cavaliere, 2016)
CDQ BF DW Oily mill BOF CRM IWI SinterITEM dust sludge sludge scale dust sludge ash EP dust
C-Fix 88.21 33.64 5.51 0.07 5.44 13.06 2.94 7.23
T.Fe 0.64 31.57 63.48 75.21 59.62 26.66 27.65 47.14
Fe2O3 0.91 41.92 34.54 11.39 70.71 21.47 35 62.76
FeO 0 2.72 50.18 87.5 9.76 10.78 0.98 2.78
M.Fe 0 0.16 0.8 0.07 2.67 3.37 2.42 1.11
T.Cr 0 0.02 0.48 0.07 0.04 0.04 0.4 0.05
Cr2O3 0 0.03 0.69 0.09 0.06 0.06 0.58 0.07
M Cr 0 0 0.01 0.01 0 0 0 0
T.Ni 0 0.01 0.22 0.03 0.02 0.02 0.18 0.01
NiO 0 0.01 0.27 0.03 0.03 0.03 0.2 0.01
M. Ni 0 0 0.01 0.01 0 0 0.02 0
Pb 0 0.31 0.01 0.01 0.15 0.01 0.02 0.01
PbO 0 0.33 0.01 0.01 0.16 0.01 0.02 0.01
Zn 0 1.54 0.1 0.01 0.49 0.66 1.95 0.05
ZnO 0 1.92 0.12 0.01 0.61 0.82 2.43 0.06
Na 0.02 0.04 0.02 0.01 0.02 0.17 0.25 0.18
Na2O 0.03 0.05 0.02 0.01 0.02 0.22 0.34 0.24
K 0.09 0.06 0 0 0.01 0.06 0.23 1.15
K2O 0.11 0.08 0 0 0.01 0.07 0.28 1.38
P 0 0.06 0.07 0.01 0.08 0.63 0.88 0.05
P2O5 0 0.13 0.17 0.02 0.17 1.44 2.01 0.12
S 0.32 0.55 0.11 0.01 0.09 0.31 1.25 0.36
SiO2 5.79 5.49 0.73 0.01 1.78 5.3 11.11 5.33
Al2O3 3.2 2.36 0.15 0.07 0.5 0.84 3.47 1.86
CaO 0 4.82 3.49 0.02 4.59 16.47 23.67 8.32
MgO 0 0.65 0.24 0.01 0.45 3.51 3.61 1.03
MnO 0 0.22 0.54 0.29 0.37 0.15 0.74 0.18
TiO2 0 0.12 0.01 0.01 0.07 0.05 0.25 0.1
Cl 0 0.05 0.01 0.01 0.03 0.45 0.97 1.46
F 0 0.06 0.1 0.01 0.15 0.03 0.43 0.19
Oil 0.2 0.19 1.68 0.22 0.17 5.77 0.18 0.23
Others 1.23 4.57 0.71 0.14 2.25 16.61 8.22 5.23
Total 100 100 100 100 100 100 100 100
El-Hussiny and Shalabi (2011) investigated mechanical properties of briquettes made
from flue dust and mill scale and found that increasing the coke breeze results in
increasing the compressive strength of the briquette to almost double of the value. The
reason for the increase was believed to be the increase of fine particles that fill up the
voids resulting in better compaction.

23
3.6 Other reverts
Other reverts are generated in the iron and steelmaking process such as lubricant oil and
grease. Pellets and briquettes fines are generated during the transportation and handling,
as the weak pellets break. In order to avoid introducing fines to the furnace, these fines
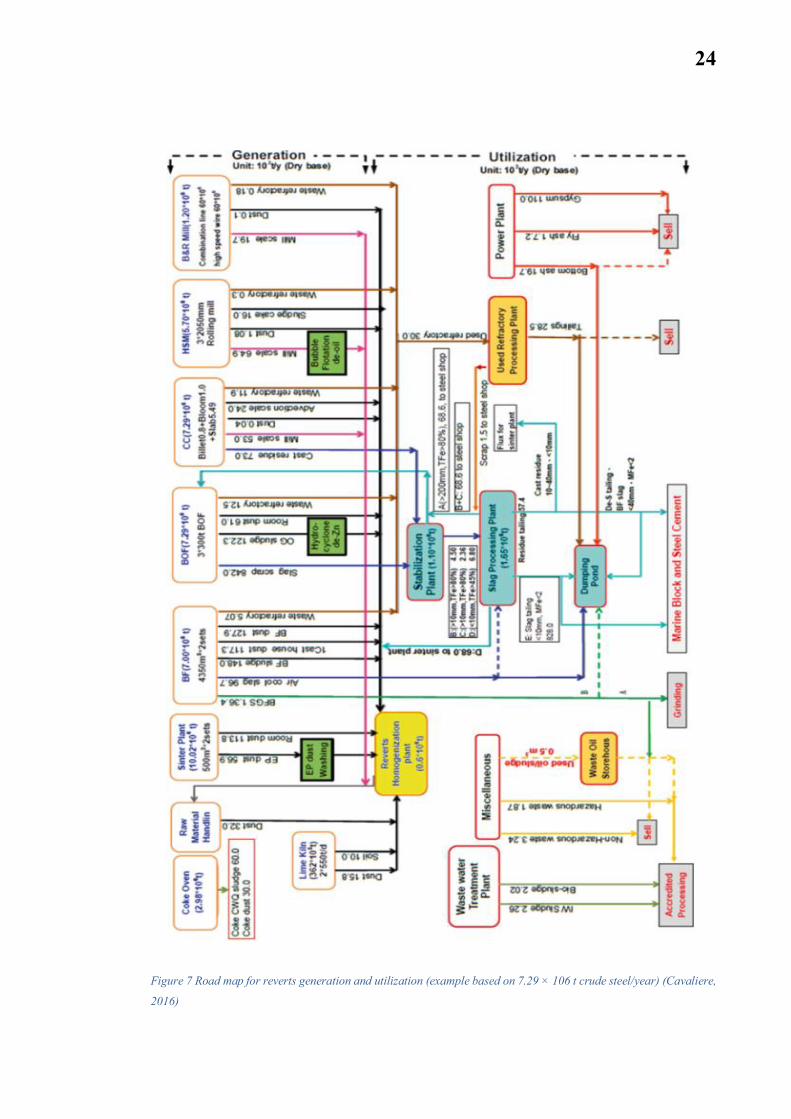
are screened out (Singh and Bjorkman, 2006). Figure 7 below shows an example for road
map for reverts generation and utilization based on 7.29 × 10⁶ t crude steel/year
(Cavaliere, 2016).
24
Figure 7 Road map for reverts generation and utilization (example based on 7.29 × 10⁶ t crude steel/year) (Cavaliere,
2016)

25
4 AGGLOMERATION
4.1 Agglomeration Theory
Agglomeration as a phenomenon was observed and used by humans since prehistory.
However, Particle technology as a separate science field was introduced in the year 1957.
Agglomeration –by definition- is sticking or balling or fine powder particles due to short
range physical forces, forming larger entities. Iron and steel, cement and fertilizers
industries are amongst the largest users of agglomeration technologies. Properties, size
and shape of the final products and system capacity are some of the factors that decide
the suitable agglomeration process. (Pietsch, 2005, 2002, 1991)
Figure 8 shows how the strength of agglomerates develop as a result of the pore space of
the agglomerate being filled by matrix binder such as in the case of concrete (a), the void
volume being filled by liquid which is usually water with different saturation levels (b
and c), and finally, through solid bridges actions between particle and surrounding very
near particles (d)
Figure 8 Strength development in agglomerates (Pietsch, 2005)
26
Binding mechanism
Binders are used when certain characteristics (Typically, higher strength) for the final
agglomerate is desired or in case of big particle size. They are added before or during the
agglomeration process in order to enhance the agglomerate strength. Curing may be
required for the binder effect to happen. Binders must be suitable for the material being
agglomerated as well as for the required application. For example limited content of sulfur
cannot be exceeded in binders intended for use in agglomeration of by-products that are
being recirculated in steel mills. (Pietsch, 2002)
Formation of agglomerates and their strength is highly dependent on binders combination
used. Agglomerates produced using BOF sludge and mill scaled were reported to have
adequate strength when at least 2% of lime and 6% of organic binders are used (Das et
al., 2007). Behavior of the agglomerate may depend on the used binders such as in the
case with briquettes produced using cement-bentonite binder. When using cement-
bentonite binder, coagulation structure is formed due to the attraction of negative
bentonite particles and positive cement particles. Such structure lead to changed
properties of the binder, decreasing the possibility of brittle fraction (Bizhanov et al.,
2015). Agglomerate strength may be increased utilizing different phenomena such as the
increasing iron ore coal briquettes strength without any use of binders when utilizing
fluidity phenomenon at temperature between 350- 600º C leading to higher density and
higher strength. Thermal plasticity of coal is also utilized in order to produce briquettes
with better reduction properties, lower cost and higher strength (Ahmed et al., 2014).
Binders can be classified into organic and inorganic binder where they are found in the
agglomerate in a form of film, bridge (Such as water) or matrix (Such as cement). Organic
binders include coke oven tar, crude oil, lignin and molasses etc. while inorganic binders
include bentonite, cement, gypsum and lime etc. Film and bridge types form a coat around
the particles and do only slightly affects the porosity of the agglomerate. On the other
hand, matrix binders fill the voids in the agglomerate, reducing the porosity and accessible
surface area. By-products or waste can be used as a binder such as in the case molasses
(Pietsch, 2002). It was pointed out that also slags which are iron and steelmaking by-
product may be used as substitute for cement.

27
There are 5 major binding mechanisms’ groups for agglomeration which can be seen in
Figure 9 below (Pietsch, 2005, 2002):
1. Solid bridges
2. Adhesion and cohesion forces
3. Surface tension and capillary pressure
4. Attraction forces between solids
5. Interlocking bonds
Figure 9 Pictorial representation of the binding mechanisms of agglomeration (Pietsch, 2002)
Agglomeration technologies for size enlargement include (Pietsch, 2005):
1. Tumble or growth agglomeration
2. Pressure agglomeration
3. Agglomeration by heat/sintering
During pressure agglomeration, the shape of the closed die used decides the shape of the
product. In the die, particulate solids are subjected to external forces and depending on
how high that force is (low, medium or high), one or several binding mechanisms seen in
Figure 9 are utilized during the different pressure agglomeration methods. In pressure

28
agglomeration, adhesion and frictional forces usually results in non-uniformity of the
compacted body. (Pietsch, 2005, 2002)
In low pressure agglomeration, plastic sticky masses are passed through screens; In
medium-pressure, higher densification is reached as a result of the feed characteristics
(plastic and binding); In high pressure agglomeration, plastic deformation and/or brittle
particles take place and porosity decrease to as low as 5%. Figure 10 below shows the
change that particles undergo in a die with respect to size and shape under pressure.
(Pietsch, 2002)
Figure 10 Sketches explaining the mechanism of pressure agglomeration (Pietsch, 2005)
In the beginning, only the arrangement of particles is changed then brittle particles breaks
and malleable particles deform usually simultaneously. The capacity of the agglomeration
equipment depends on the speed of compaction. The speed of compaction is limited by
two factors, compressed gas and elastic springback. Cracking or even total destruction of
the agglomerate also depend on these two factors as trapped gases escape and rebound
takes place after pressure is released and therefore, balance between the capacity and
quality of production should be thoroughly considered. Slow speed compacting can
ensure that the development of gas pockets in the agglomerate is limited as it has time to
escape. The effect of increasing the applied force on the agglomerate on the density is
demonstrated in Figure 11 below where identical feed is subjected to increasing forces;
the points within cross section with same mass content are connected. Die wall resistance

29
and punch movement are responsible for the high density in the upper part corners of the
cross section. (Pietsch, 2005)
Figure 11 Density distribution in cylindrical compacts with increasing compacting forces. (Pietsch, 2002)
The challenges due to the compressed gas and elastic springback become more severe
with the presence of finer particles. Finer particles have high bulk volume in the initial
state and the trapped gas takes longer time to escape as the pores between the particles
are small. Venting and force feeders are especially designed to help addressing these
issues when finer particles are involved in the agglomeration. Increasing the dwell time
(time of force application before release) may also help reducing these unwanted effects.
Increasing the dwell time is possible with certain pressure agglomeration equipment such
as Ram press and punch and die press (With a special drive system) while it is not possible
in roller presses which can be seen in Figure 12 below. Generally, density increase with
increasing pressure and increasing the compact height, and decreases with increasing
diameter. (Pietsch, 2005)

30
Figure 12 Diagram of equipment for high-pressure agglomeration. Ram press (upper left), punch and die press (upper
right), roller presses for compaction (lower left) and briquetting (lower right)
4.2 Iron ore carbon composite
Even though the blast furnace has gone under huge improvements over the years, more
improvements are needed in order to reach more productivity, better efficiency and
minimization of greenhouse gases (Cavaliere, 2016; Kasai and Matsui, 2004; Naito et al.,
2001; Peacey and Davenport, 1979). Increasing the carbon content in the iron bed and
also increasing the contact between the carbonaceous material and the iron bed leads to
lowering the thermal reserve zone temperature and result in improved utilization of CO
gas (Kasai and Matsui, 2004). Lowering the greenhouse gases makes it essential for the
blast furnace to adapt to the use of plant reverts and expansion in the use of alternative
reducing agents as well as effective utilization of top gases (Cavaliere, 2016; Geerdes et
al., 2015).
Agglomerates of mixtures of carbon and iron bearing materials are composite pellets,
carbon composite agglomerates (CCAs), carbon composite briquettes (CCBs) and self-
reducing agglomerates, usually utilizing a binder while carbonaceous material can be
charcoal, fine coal and fine coke. Fine iron ore include among others, hematite and
magnetite (Cavaliere, 2016; Dutta and Ghosh, 1994). Agglomerates can be used in

31
number of processes such as cupolas, rotary kiln and blast furnaces (Cavaliere, 2016;
Dutta and Ghosh, 1994). The advantages of such agglomerates include:
1- Good alternative for burden preparation that does not require high temperature
treatment such as sintering which is ultimately more energy efficient and also
2- Using other forms of reductants such as non-coking coal, plastics and bio-mass
which promote recycling.
3- Enhance productivity in ironmaking.
Kasai and Matsui (2004) investigated the carbonaceous material reactivity is enhanced
when mixing it with ore bed. They found that the starting temperature of the solution loss
reaction is decreased when increasing the amount of carbonaceous material in the ore bed.
The same effect of lowering the starting temperature of the reaction also exists when the
degree of contact is increased. This eventually leads to lowered temperature of the reserve
zone, improved CO gas utilization, and reduction of the rate of reducing agents. The
degree of contact between different carbonaceous material and iron ore is shown in Figure
13 below. It’s worth noting that the study utilized hot briquettes rather than cold ones.
Also Chu et al. (2004) confirmed the same advantages for the use of CCB through a
numerical study utilizing modified multi-fluid blast furnace model with charging CCB.
With 30% charged CCB, the temperature of the reserve zone was lowered 200º C, the
productivity increased 6.7%, coke rate was reduced by 26.8% and the reducing agents
rate was reduced by 3.4%.
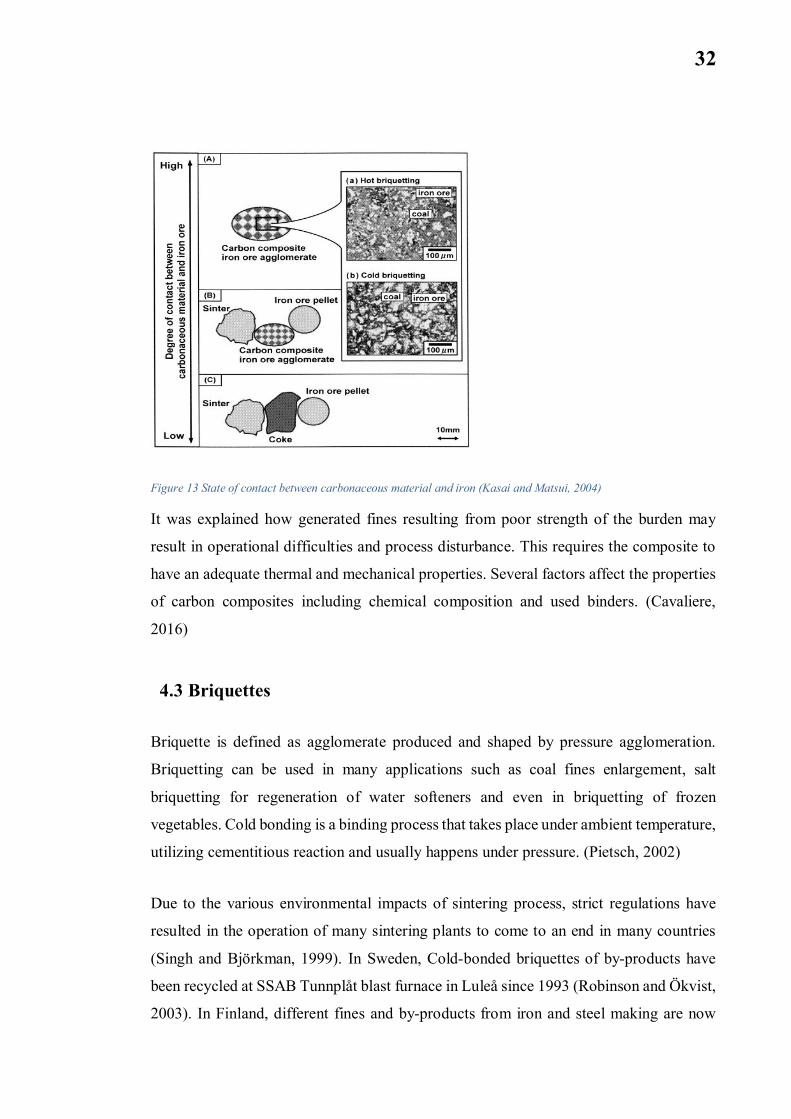
32
Figure 13 State of contact between carbonaceous material and iron (Kasai and Matsui, 2004)
It was explained how generated fines resulting from poor strength of the burden may
result in operational difficulties and process disturbance. This requires the composite to
have an adequate thermal and mechanical properties. Several factors affect the properties
of carbon composites including chemical composition and used binders. (Cavaliere,
2016)
4.3 Briquettes
Briquette is defined as agglomerate produced and shaped by pressure agglomeration.
Briquetting can be used in many applications such as coal fines enlargement, salt
briquetting for regeneration of water softeners and even in briquetting of frozen
vegetables. Cold bonding is a binding process that takes place under ambient temperature,
utilizing cementitious reaction and usually happens under pressure. (Pietsch, 2002)
Due to the various environmental impacts of sintering process, strict regulations have
resulted in the operation of many sintering plants to come to an end in many countries
(Singh and Björkman, 1999). In Sweden, Cold-bonded briquettes of by-products have
been recycled at SSAB Tunnplåt blast furnace in Luleå since 1993 (Robinson and Ökvist,
2003). In Finland, different fines and by-products from iron and steel making are now

33
recycled through cold-bond agglomeration process. As discussed, briquette quality
depends on several factors including particle size distribution, moisture content, applied
force, used binder, mixing, curing and chemical composition (Kumar et al., 2017; Singh,
2001).
SSAB Tunnplåt in Luleå, Sweden shut down its sintering plant in 1978 for environmental
consideration and later on in 1993, briquette plant was started considering the attractive
advantages of the briquetting technique both environmentally and economically. By
2003, it was reported that 5% of the charge to BF (around 60 kg/tHM) consisted of cold
bonded briquettes (Robinson and Ökvist, 2003; Su et al., 2004). The percentage of
briquettes contribution to the feed in Raahe steel plant was reported to be 8% in 2013
(Möttönen, 2013).
4.4 Particle size
It was discussed earlier how increasing porosity negatively affects the agglomerate
strength. With lower porosity, the apparent density increases and in turn, the agglomerate
strength increases (Pietsch, 2002). It’s important to define the particle size. Regular
shapes such as spheres and cubes are easy to define by their diameters and sides etc., but
it get more complicated when attempting to describe irregular shape; it is common to
describe the irregular shapes by diameter of an equivalent sieve size. Many properties of
material such as flow and compaction are influenced by particle size. (Sarkar, 2016)
In production of mill scale based briquettes, BOF and CRM dusts were found to be the
best option to be utilized in order fill the voids between the coarse mill scale particles due
to their finer size. Briquettes strength increased by increasing the fine particle fraction but
beyond a limit of 30%, increasing the fine particles fraction resulted in the strength
reduction or binder use increase (Kumar et al., 2017). Singh (2001) also reported that
utilizing finely ground material in briquettes lead to increase of compaction which has a
positive influence on briquette strength. Singh and Bjorkman (2006) reported that suitable
cold bonding feed should have 80% of the total feed being finer than 200-250 µm.

34
EMMA software
EMMA is an application that calculates and displays the particle size distribution of a
mixture of components which simplifies the task of optimizing and refining mix designs.
EMMA can predict the optimum blend for castables utilizing Particle Size Distribution
(PSD) provided by the user.
When compiling recipe in EMMA, different materials are added and their respective
quantities (as percentage of weight) are specified on dry basis; the added water quantity
is then specified. Depending on the used model, the q-value, max particle size and
minimum particle size are then specified as well. Two calculation models are available in
EMMA, Andreessen and modified Andreessen models. The graph window in EMMA
displays two lines, “target line” based on the calculation model used and a “recipe line”.
In order to improve the recipe, the recipe line should better fit the target model curve.
Minimum voids in the structure is achieved as a result of maximum packing density which
means better densification and strength. Highest packing cannot be achieved through
single size particles which is known by “monodispersion” where all the particles have the
same size. (“Elkem Materials Mixture Analyser – EMMA,” n.d.; Sarkar, 2016)
Two different packing models exist, discrete and continuous packing model. In the
discrete model which is based on monodispersion of specific size groups, three sizes are
used to reach the highest packing. In continuous packing model however, the particle
sizes are present in continuous manner which means a whole range of particles is present
in the system. Furnas model was based on the idea that best packing takes place when the
finer particles fill all the voids between larger particle; Furnas employed the two different
models and it was found that the discrete model results in higher density but less
workability while the continuous one lead to improved workability. Furnas model is
advocated for but is difficult to use. (Myhre and Hundere, 1996; Sarkar, 2016)
Distribution coefficient (q-value)
Slope of the model line will become “steeper” as the q-value increases. The mix will be
coarser and less workable as the slope gets steeper, and it will become more workable
with increased fines content as the q-value decreases. It is necessary for optimum particle

35
packing that q-value is less than 0.36 while q-value of 0.28 is appropriate for self-
compacting concrete.
Andreassen model
Andreassen model was based on empirical work. He proposed a simple model for
continuous particle size distribution. As per Andreassen model which was based on
similarity conditions, the variations in particle size and packing arrangements will be
exactly similar regardless of the magnifications in the distribution. The following
equation is proposed by Andreassen, describing linear relation between CPFT
(Cumulative Percent Finer Than) and particle size:
= × 100 (4)
Where:
D - Particle size, in diameter
DL - the largest particle size
q - The distribution coefficient
Andreassen proposed q-value between 0.33 and 0.5 to obtain the optimum packing
density. However, his mode does not have wide popularity as it does not recognize the
smallest particles effect with the produced straight lines going indefinitely which covers
particles of very small sizes that mostly do not exist in practical applications.(Sarkar,
2016)
Modified Andreassen model
To overcome the problem with infinitely small particles in Andreassen model, Dinger and
Funk came up with what is known as modified Andreassen model which combines both
Andreassen and Furnas models. The resultant model is much easier to use than Furnas

36
model. It was found that q-value of 0.37 or less would enable getting 100% packing
density (Myhre and Hundere, 1996; Sarkar, 2016). Modified Andreassen equation is as
follows:
100 =––
(5)
Where:
D - Particle size, in diameter
DL - Maximum particle size
DS - Minimum particle size
q - The distribution coefficient
4.5 Binders
Using appropriate binders in briquettes can contribute to lowering the operational
challenges faced as a result of low strength briquettes and generated fines (Ahmed et al.,
2014). Binders have both chemical and physical function sometimes and should meet
certain criteria including adequate mechanical properties of the agglomerate in green and
dry states; good chemical composition that does not badly affect the process which the
agglomerate is used at, with increased impurities or harmful elements such as P, S, As,
etc.; good metallurgical performance including reducibility, swelling and pressure drop
during reduction; simple processing behavior including preparation and drying; and
finally be economically feasible. Several organic and inorganic binders used in
agglomeration operations have been investigated by researchers (Qiu et al., 2003).
A common binder in iron ore palletization is bentonite but it has some disadvantage to its
use such as increased silica content (around 0.5%) which increases the energy
consumption as a result. Other disadvantages of bentonite is the recent increasing cost.

37
On the other side, an advantage of organic binders is that they would leave very small
amount of ash residue upon firing. New binders such as Funa have been developed
following the investigation of functions and molecular structures of ideal organic binders
for iron ore palletizations based on molecular design, interface chemistry and polymer
science. Organic binders are proposed to have a structure containing hydrophilic function
groups, polar functions groups and mechanically strong backbone. (Halt and Kawatra,
2013; Qiu et al., 2003)
Funa is prepared from lignite or weathered coal and with humates. The dry compressive
strength of Funa is low (287 N/P) compared to bentonite (up to 705 N/P) but fired pellets
have good compressive strength of about the same level. Other organic binders developed
included synthetic chemicals such as acrylamides, cellulose, starch, wastes such as wood
process liquors and heavy hydrocarbons. Organic binders would sometimes be
unsuccessful while others would be successful at the lab scale and would still fail on
industrial scale. Some other binders would be successful and were utilized by industry
such as carboxymethylcellulose, corn starch, and sodium acrylate-acrylamide
copolymers. Modified starch which could be extracted from potato, wheat or rice, was
used in the USA iron ore pellet plant to reduce the bentonite content. (Halt and Kawatra,
2013; Qiu et al., 2003).
Kumar et al. (2017) investigated the production of mill scale based briquettes utilizing
three different binders, sodium silicate, molasses and starch. It was found that molasses
and starch produced briquettes of adequate strength. For pilot scale trials, molasses based
briquettes were preferred (10% content) because of their lower cost and no heating
requirement.
Rapid cement as a binder
Portland cement is usually produced by heating limestone and clay resulting in clinker
which is then mixed with calcium sulfate and finely ground. 50-70% of clinker consists
of alite which is basically a modified tricalcium silicate (Ca3SiO5). The rest of clinker
consists of 15-30% belite, modified dicalcium silicate (Ca2SiO4), 5-10% aluminate,
tricalcium aluminate (Ca3Al2O6) and 5-15% ferrite, tetra-calcium aluminoferrite

38
(Ca2AlFeO5). It’s worth mentioning that common oxides are usually abbreviated to single
letters such as C for CaO and S for SiO2. Portland cement includes many types but the
most common is ordinary cement (type I and II according to ASTM). Other types of
cements are being produced in less amounts for special purposes. Rapid-hardening
cement is produced through many techniques. This includes changes in compositions and
fine grinding of clinker. Rapid cement is also referred to as type III cement according to
ASTM (Taylor, 1997).
Portland cement is considered the most frequently used binder in briquetting process of
inplant waste fines that are rich with iron due to its availability and low cost. Advantages
of the cement-bonded agglomerates include good strength characteristics which are
favorable in BF operation, prevention of toxic gases as it substitutes sintering process,
addition of carbonaceous material that improves the reduction kinetics and allow the
recycling of carbonaceous by-products and saving energy as the production of cold
bonded agglomerates does not require as much energy as in sintering process for example.
Kinetics reduction can also be improved because of the free lime presence as well as other
metal oxides that affects the reduction process. Disadvantages include low temperature
degradation, harmful effects of additional moisture and additional formation of slag.
(Hässler, 1974; Singh, 2001)
Rapid hardening cement was used to produce cold bonded briquettes in SSAB Tunnplåt
in Luleå. When replacing around 5.5% of pellet burden with briquettes which corresponds
to 60-80 kg/thm, no increase in flue dust in BF is noticed. However, slag generated in the
furnace increase by about 5-10 kg/thm. Briquettes constituted from flue dust, fine scrap,
coarse particles of BOF sludge, pellet fines and briquette fines. (Sundqvist Ökvist et al.,
1999). Singh (2001) reported slag increase of 15 kg/thm when using less than 10% cement
bonded material as iron burden with less than 10% cement content in the agglomerate.
This might be beneficial in case furnace is utilizing high quality iron ores/pellets as the
increase in slag would then lead to smoother movement of burden. Su et al. (2004)
investigated the recycling of BOF sludge and dust as well as oily mill scale through cold
bonded pelletizing using cement as a binder. Robinson (2008) reported that in pilot scale
studies utilizing cement cold bonded pellets in BOF, the limit of pellets charge was 2.2%
of the total charge as further increase in that portion is likely to expect increase in the

39
sulphur content as well as slag volume due to the presence of cement. During heating and
reduction, cement bonded briquettes exhibits reactions such as hydrated cement changing
into calcium silicate and calcium oxide. Recipe components are that hydrophobic such as
coke fines does not result in strong bond between the particles and cement matrix leading
to weaker briquettes (Singh, 2001).
Granulated blast furnace slag
80% of BF slag is made into granulated slag by rapidly cooling the slag from initial
temperature of around 1500º C by high pressure water jet. The remaining 20% is air
cooled along with moderate water sprinkling. The product is used in road construction as
it is similar in properties with crushed stones. An environmentally friendly substitute of
concrete blocks has been developed utilizing granulated blast furnace slag as a binder;
BOF slag as aggregate; alkali stimulant to increase hardening. (Horii et al., 2013)
Lignin based binders
Lignin is the second largest organic material source (Calvo-Flores et al., 2015). Lignin
constitute about 12-39% of wood; it provides bonding and structure in plant tissue and is
considered an important biopolymer. In the past, it was regarded as invaluable by-product
of pulp and paper industry. During the sulfite method in pulp production, SO3- is utilized
to make the lignin soluble and separated from cellulose. Lignin is then either burned for
heat or is sold to other industries as a binder after getting recovered. Lignosulfonate is a
complex polymer with its exact structure not yet known. It was tested as a binder and in
direct reduction pellets. One of its advantages to use as a binder is the relatively low cost
and being naturally hydrophilic positively contributed in agglomeration process, but a
drawback in its use in agglomerates is the increased amount of slag and potential SOx
emission as a result of the increased sulfur content being introduced to the process (Halt
and Kawatra, 2013).
In biofuel production process, lignin was also considered as a residual or low value by-
product where the lignin is used for power generation. However, with current goals to
replace 30% of fossil fuels with biofuels, huge quantities of lignin will be generated as
side stream when producing biofuels such as bioethanol. Thus, it is a necessity to develop

40
value added product based on lignin in order to achieve a more circular and sustainable
economy (Cotana et al., 2014).
Mousa et al. (2017) attempted using kraft lignin as substitute for cement in cold bonded
briquettes. Lignin was obtained from advanced LignoBoost technology for separation of
lignin from black liquor in pulp mill. It was possible to substitute up to 25% of used
cement in the recipe with lignin as binder while still achieving adequate mechanical
properties. 25% of cement is equivalent to 3% of the recipe sum. The use of lignin has
resulted in increase of carbon content which enhanced the self-reducing properties of the
briquette.
4.6 Moisture content
Too much or too low moisture content in the briquettes may lead to poor quality as the
moisture content plays a major role in deciding the briquettes strength (Kumar et al.,
2017). Increasing cement content in briquettes would usually mean an increase in water
content. Free moisture content usually escapes the blasé furnace through top part of shaft
while bound water is released at elevated temperatures (Singh, 2001).
4.7 Applied force
In mill scale briquettes production, Kumar et al. (2017) found that increasing the roll
pressure used in briquetting leads to an increase in the briquette strength. Increasing the
applied force was limited by the stability of the roll frame structure. El-Hussiny and
Shalabi (2011) also found that increasing the applied pressure on the briquettes (made
from mill scale and flue dust) leads to better strength and believed that the reason behind
the enhanced strength is the increase in the number of contact points between the particles
and increased Vander Waals force as macro particles are crushed. The influence of
increased pressing load can be seen in Figure 14 below. However, the same research
found that increasing the pressing load beyond a certain value (490.5 MPa) for some
recipes resulted in a decrease in the drop damage resistance. (Singh, 2001) also found that
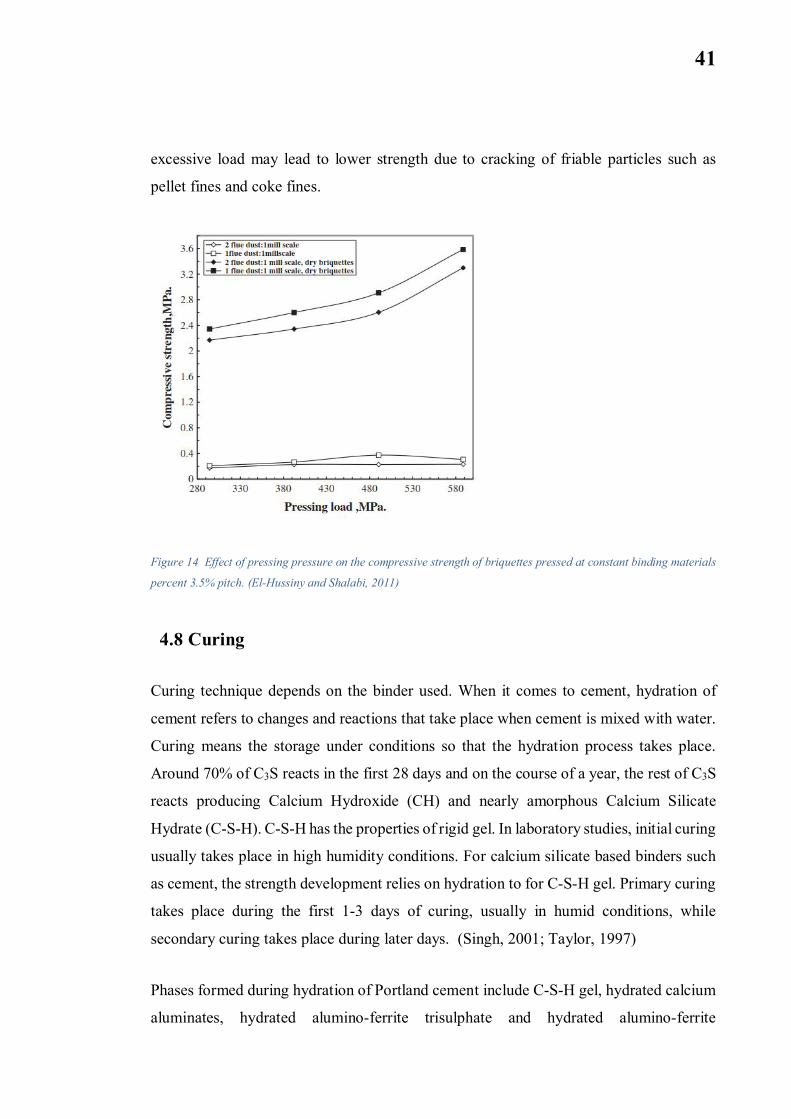
41
excessive load may lead to lower strength due to cracking of friable particles such as
pellet fines and coke fines.
Figure 14 Effect of pressing pressure on the compressive strength of briquettes pressed at constant binding materials
percent 3.5% pitch. (El-Hussiny and Shalabi, 2011)
4.8 Curing
Curing technique depends on the binder used. When it comes to cement, hydration of
cement refers to changes and reactions that take place when cement is mixed with water.
Curing means the storage under conditions so that the hydration process takes place.
Around 70% of C3S reacts in the first 28 days and on the course of a year, the rest of C3S
reacts producing Calcium Hydroxide (CH) and nearly amorphous Calcium Silicate
Hydrate (C-S-H). C-S-H has the properties of rigid gel. In laboratory studies, initial curing
usually takes place in high humidity conditions. For calcium silicate based binders such
as cement, the strength development relies on hydration to for C-S-H gel. Primary curing
takes place during the first 1-3 days of curing, usually in humid conditions, while
secondary curing takes place during later days. (Singh, 2001; Taylor, 1997)
Phases formed during hydration of Portland cement include C-S-H gel, hydrated calcium
aluminates, hydrated alumino-ferrite trisulphate and hydrated alumino-ferrite
42
monosulfate. Calcium silicates reacrs with water to form C-S-H gel. The structure of the
gel depends on factors such as hydration time, pH and presence of impurities. The
hydration reactions are (Lea and Hewlett, 2008; Singh, 2001; Taylor, 1997):
+ → ( ) + (3 − )
+ → ( ) + (2 − )
Ferrite phase reacts somehow similar to C3A which has less strength than silicates
hydrates as reacts follows:
2 + 21 → (ℎ ) + (ℎ )
+ → 2 ( ) + 9
In mill scale briquettes production, Kumar et al. (2017) accelerated the setting of the
briquettes by hot drying it in oven for 2 h at 200º C. The study found that the resulting
strength may be achieved by air drying the briquettes for 3 days. The later drying method
is preferred due to its cost efficiency. Robinson (2008) reported that an optimal fine and
coarse blend of converter sludge can contribute to enhanced bonding during hydration
and curing due to their CaO and/or Ca(OH)2 content.
4.9 Quality requirements and tests
The characterization of the burden material includes the determination of the chemical
composition, size distribution and the metallurgical properties such as cold strength,
reduction-disintegration, reducibility, softening and melting properties. Such properties
are important to determine in order to realize how the burden would degrade under
furnace conditions, if it would endure handling process prior to charging in the furnace
and to determine the final slag and iron compositions. (Geerdes et al., 2015)

43
The definition of agglomerate strength differ depending on the respective industry and
use. Strength may refer to the resistance to breakage, chipping or abrasion usually if the
agglomerate is the final product (Pietsch, 2002). Properties of the agglomerate is
determined based on factors such as particle size and shape, size and density of the
agglomerate. The strength of the agglomerate is mostly decided by the porosity of the
agglomerate; the lower the porosity, the higher the strength of the agglomerate. Porosity
is related to the true density which is the mass of unit volume of the material when free
from pores. The porosity of the agglomerate is decided through the equation below:
= 1 − (3)
Generally, testing of the burden is usually done under ISO standards with some tests being
specific to certain types of burden such as swelling test which is important to investigate
the volume increase during the reduction process and to make sure that that increase does
not exceed a certain limit. Testing for decrepitation is also important to make sure that
during the early heating stages, the lump would not fracture due to thermal
decomposition. Table 5below shows different tests and their optimum range for the
burden. (Geerdes et al., 2015)
Table 5 Characterization of burden (Geerdes et al., 2015)
Optimum Range
What is measured? Results Sinter Pellets Reference
Mean Size Size distribution Average size(mm) ISO 4701
% 6.3–16 mm > 95 %
% < 0.5 mm < 2 % < 2 %
Cold Strength Size distribution % > 6.3 mm > 70 % > 90 % ISO 3271
after tumbling % < 0.5 mm < 5 %
Compression daN/p > 150 ISO 4700
Strength after reduction LTD (LowTemp. Disintegration)
Size distribution after reductionand tumbling
% > 6.3 mm% < 3.15 mm% < 0.5 mm
< 20 %> 80 %
< 10 %ISO 4696
Reducibility Weight decreaseduring reduction %/min > 0.7 % > 0.5 % ISO 4695
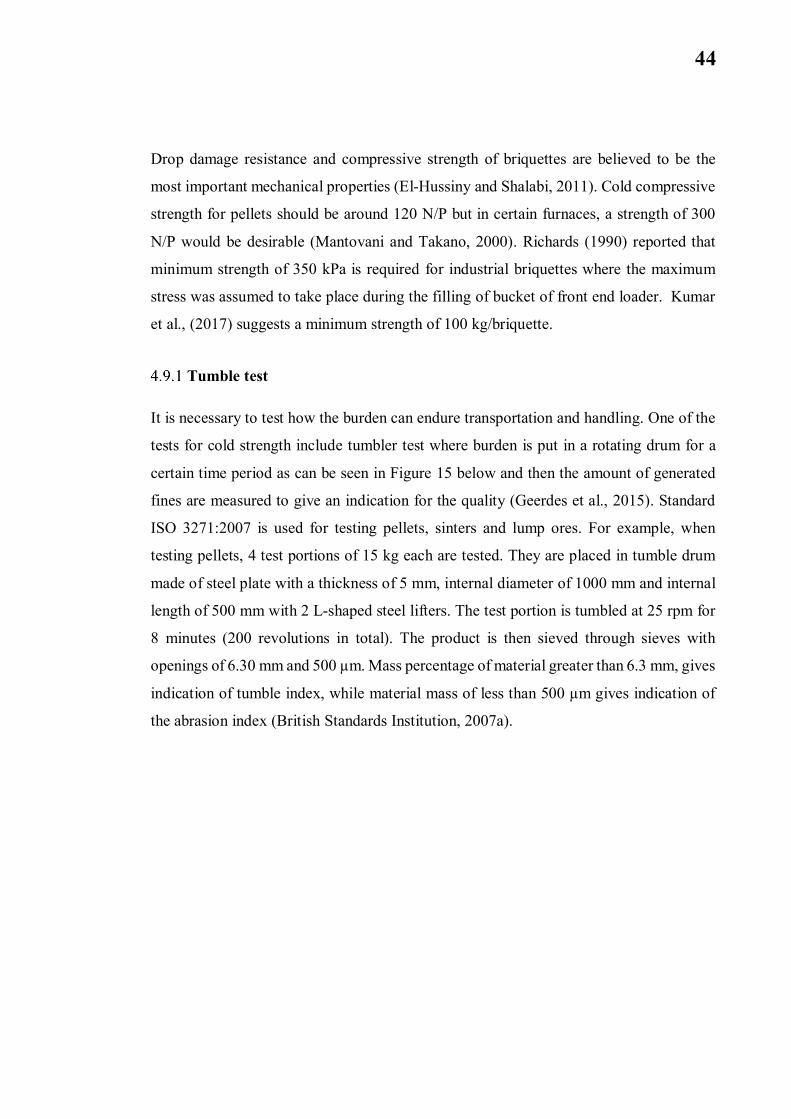
44
Drop damage resistance and compressive strength of briquettes are believed to be the
most important mechanical properties (El-Hussiny and Shalabi, 2011). Cold compressive
strength for pellets should be around 120 N/P but in certain furnaces, a strength of 300
N/P would be desirable (Mantovani and Takano, 2000). Richards (1990) reported that
minimum strength of 350 kPa is required for industrial briquettes where the maximum
stress was assumed to take place during the filling of bucket of front end loader. Kumar
et al., (2017) suggests a minimum strength of 100 kg/briquette.
Tumble test
It is necessary to test how the burden can endure transportation and handling. One of the
tests for cold strength include tumbler test where burden is put in a rotating drum for a
certain time period as can be seen in Figure 15 below and then the amount of generated
fines are measured to give an indication for the quality (Geerdes et al., 2015). Standard
ISO 3271:2007 is used for testing pellets, sinters and lump ores. For example, when
testing pellets, 4 test portions of 15 kg each are tested. They are placed in tumble drum
made of steel plate with a thickness of 5 mm, internal diameter of 1000 mm and internal
length of 500 mm with 2 L-shaped steel lifters. The test portion is tumbled at 25 rpm for
8 minutes (200 revolutions in total). The product is then sieved through sieves with
openings of 6.30 mm and 500 µm. Mass percentage of material greater than 6.3 mm, gives
indication of tumble index, while material mass of less than 500 µm gives indication of
the abrasion index (British Standards Institution, 2007a).

45
Figure 15 Principle of tumbler test (British Standards Institution, 2007a)
Cold compression test
In compression strength test, the briquette is subjected to load and compressed at constant
speed between two parallel flat platens. The load at which the specimen suddenly fails is
recorded and corresponds to the compression strength, usually in MPa. The procedure is
repeated for several specimen and the arithmetic means of all measurements is obtained.
BS ISO 4700:2007, a standard for determination of the crushing strength of Iron ore
pellets for blast furnace and direct reduction feedstocks gives criteria for test completion
for each specimen. The test is completed either when the load fails to less than 50% of
the maximum load recorded or when the gap between the platens becomes less than 50%
of the initial diameter of the test specimen. The standard suggested 60 pieces per test
(British Standards Institution, 2008)
In the literature, researchers used different methodologies to measure the compression
strength of briquettes. Singh and Bjorkman (2006) estimated the strength according to the
average value of three briquettes per test; El-Hussiny and Shalabi (2011) estimated the
compression strength according to the average value of ten briquettes. Bizhanov et al.
(2015) measured the compressive strength of briquettes according to DIN 51067. DIN
51067-1 is used in the determination of the compressive strength at room temperature of
refractories with a total porosity of up to 45%. However, it was superseded by DIN EN
993-5 which is based closely on ISO 10059-1:1992 (“DIN 51067-1,” n.d.).

46
Drop test
Drop test can be performed in different ways; but generally, single sample or batches are
dropped through a tube from a certain height to reach steel or concrete slap as illustrated
in Figure 16 below where (1) is a steel plate which is at least 20 mm thick, (2) collar to
contain the material and prevent its loss and (3) A tube.
Figure 16 Sketch of a drop test arrangement (Pietsch, 2002)
The height of the tube should correspond the conditions which the agglomerate will go
through in the intended application. The result is reported as the maximum height from
which the agglomerate may be dropped without breaking, and in some cases, depending
on the application, the result is based on the amount of fines generated as a result of the
impact. (Pietsch, 2002)
El-Hussiny and Shalabi (2011) measured the drop damage resistance of briquettes by
dropping 10 briquettes from 30 cm height on a steel plate. The number of times it took
each sample to break was recorded and eventually the arithmetic mean of the number of
repetition was taken as a representative for the drop damage resistance. Mousa et al.
(2017) conducted the drop test of briquettes by dropping them from a height of 1 meter
on a steel plate and the procedure was repeated until the 50% of the briquette was broken
or if the briquette survived the fall for 50 times. Han et al. (2013) conducted drop test on
briquettes of low-rank coal according to ASTM standard (D440-49) where the briquettes

47
were dropped only two times from a height of 1.8 m on a steel plate. The weight percent
of material retained on each screen was used to obtain the size stability. Kumar et al.,
(2017) suggest a minimum fracture index of 10 drops. According to Sah and Dutta (2010),
drop test involves dropping of briquettes from a height of 0.45 m on steel plate with 10
mm thickness. The procedure is repeated until briquettes break and the final value is then
taken as an average of four performed test results. Shatter test is performed in a similar
procedure where briquette is dropped from a height of 2 m on a steel plate and the shatter
index is decided as a function of generated fines passing through 100 mesh sieves.
Reducibility test
Standard ISO 4695:2007 is used to test reducibility (extent and ease of removing oxygen)
of iron ores, sinters and hot-bonded pellets utilizing test apparatus shown in Figure 17
below. During the test, a test portion is isothermally reduced at a temperature of around
950º utilizing CO and N2 as reducing gases. The test portion is first heated in nitrogen
atmosphere until the specified temperature is reached and then reducing gases which
consist of 40% CO and 60% N2 on volume basis, are introduced. Weight of the sample
is noted at specified time interval and test is concluded when the degree of reduction
reaches 65% or after 4 h have passed since the introduction of the reducing gases. Degree
of reduction is the calculated based on the following equation:
=0,111 0,430 +
−× 0,430 × 100 × 100
Where:
is the mass, in grams, of the test portion;
is the mass, in grams, of the test portion immediately before starting the reduction;
is the mass, in grams, of the test portion, after reduction time t;
is the iron(II) oxide content determined in accordance with ISO 9035- Titrimetric
method

48
is the total iron content, as a percentage by mass of the test portion prior to the test,
determined in accordance with ISO 2597-1 or ISO 9507.
Reduction curve of degree of reduction against time, is then plotted and reducibility index
is then obtained at the atomic ratio of O/Fe of 0.9 according to the following equation.
(British Standards Institution, 2007b)
(OFe = 0.9) =
33.6−
is the time, in minutes, to attain a degree of reduction of 60 %;
is the time, in minutes, to attain a degree of reduction of 30 %;
Figure 17 Example of test apparatus (schematic diagram).
(British Standards Institution, 2007b)
Test for reduction–disintegration
Test for reduction–disintegration is done through heating the sample and subjecting it for
a reducing gas (CO and sometimes H2) and later on subjecting the sample to tumbler test

49
after cooling. The percentage of particles less than 3.15 mm in size are then recorded.
Reducibility is also tested through heating of sample and continuously weighting it while
being subjected to a reducing gas. Weight will decrease due to the oxygen reduction and
after 180 minutes, the reduction degree is obtained. Some other tests use more advanced
simulations to characterize the burden under conditions at lower part of the furnace and
that includes the pressure drop over the burden, softening and melting (Geerdes et al.,
2015). Reduction Disintegration Index (RDI) tests have been carried out on briquettes
using ISO 4696-1 (Iron Ores–Static Test for Low-Temperature Reduction Disintegration)
(Lemos et al., 2015).

50
EXPERIMENTAL SECTION

51
5 MATERIAL CHARACTERIZATION
5.1 Main by-products and preliminary preparation
A total of eleven (11) by-product sampleswere received from SSAB Raahe plant, Finland.
Commercial binders, Rapid and Ground Granulated Blast Furnace Slag (GGBFS), were
obtained from Finnsementti Oy. The technical data sheets from the company website
contained the chemical compositions (finnsementti, n.d.). Lignin was obtained from ST1
biofuel plant in Kajaani, Finland. Lignin is an intermediate by-product of producing
biofuel with the feed to the plant being saw dust and wood chips.
The briquettes produced in SSAB are constituted from all by-products and the binders
with different shares except for BF and BOF sludge. The recipes of the briquettes in 2016
and 2017 and their current destination is provided by SSAB Raahe and can be found in
Table 6 below. BF sludge mix is not used in the briquettes in 2017 and was not part of
material received.
Table 6 Raw materials used in BF briquettes provided by SSAB
# Raw material Share %(2016)
Share %(2017) Current use
1 Pellet fines 0-10 mm 11 6 BFbriquettes
2 Pellet fines 0-5 mm 13 17 BFbriquettes
3 BF stock/cast house dust 4 4.1 BFbriquettes
4 Coke dust 4 4.1 BFbriquettes
5 Premix (40% BF top dust, 60% steelscrap) 20 19.5 BF
briquettes
6 Briquette fines 11 11.2 BFbriquettes
7 Desulfurization scrap 5 5.3 BFbriquettes
8 Mill scale 19 18.5 BFbriquettes
9 Steel scrap - 2.3 BFbriquettes
10 BF sludge mix 1 - BFbriquettes
11 BOF sludge - - Landfill
12 BF sludge - - Landfill
13 Rapid cement (Binder) 6 6 BFbriquettes
14 Slag cement (GGBFS Binder) 6 6 BFbriquettes

52
Getting representative sample of material is a hard task as particles may have different
sizes and flow characteristics which leads to segregation problem where fine particles
tend to accumulate in the center of heap while the coarser ones segregate around the heap
peripheral. Cone and quartering technique was used for the sampling closely based on
ISO standard. Special attention was paid so that the material does not get contaminated.
Each material was placed on the horizontal surface in a form of a pile and was thoroughly
mixed, flattened and divided. Half of the sample was then separated and kept as a
representative sample for the “wet” material while the second half was then dried.
Exceptions were made for BF and BOF sludge as there were two buckets available for
each material. The two buckets were assumed to be representative and therefore, one
bucket was dried while the other bucket was kept as representative wet sample (British
Standards Institution, 1999; Bumiller, 2012; Dapkunas et al., 2001)
Drying of the samples
Drying of the material took place in lab drying oven, thermostatically controlled to
maintain a temperature of 105º C based on the standard, BS EN 1097-5:2008.
Commercially available aluminum plates with a size of 2 liters were used as trays to hold
the samples inside the oven. The same plate was only used to dry the same type of sample
in order to avoid samples contamination. Adequate amount of the samples was spread in
the tray while trying to maintain more exposed surface area and constant thickness of
sample inside the plate. This was done in order to achieve better heat and mass transfer
process inside the oven, accelerating the drying process and obtaining consistent drying
along the material “thickness”. (British Standards Institution, 2008)
Each sample was left in the oven until it reached constant mass. Constant mass is reached
when the difference between two successive weight measurements is less than 0.1%. The
intervals between measurements are at least 1 hour (British Standards Institution, 2008).
The procedure was repeated until the samples were all dried. After drying, the samples
were kept in a tightly sealed bucket with a lid and stored in dry room. The total dry sample
of each material was then split according to coning and quartering sampling technique
explained earlier. Final representative dry samples obtained eventually varied in size from
to of the original dry sample. These samples are intended to be used in the

53
characterization of the material as well as the briquetting process itself. Different dried
by-products are shown in Figure 18 below.
Figure 18 By-products after drying 1- Pellet fines 0-10 mm, 2-Pellet fines 0-5 mm, 3-BF stock/cast house dust, 4-Coke
dust, 5-Premix, 6-Briquette fines, 7-Desulfurization scrap, 8-Mill scale, 9-Steel scrap, 10-BOF sludge, 11-BF sludge
5.2 Moisture content
The moisture content of several by-products were provided by SSAB Raahe. However,
not all the by-products moisture content was provided and some of the provided values
were within a considerable range e.g. Coarse pellet fines moisture content was between
0.2-5% and desulfurization scrap moisture content ranged from 7 to 16%. Information
received from SSAB regarding water content can be seen in Table 7 below. Moisture
content of pre-mix was not provided. However, according to SSAB, pre-mix constitutes
of 60% mill scale and 40% BF top dust. It was then decided to obtain the moisture content
of received by-products precisely. The drying process is done to obtain the water content
(from the particles surface or accessible pores) in the test portions (British Standards
Institution (BSI), 2008).

54
Table 7 Information about water content values of several by-products provided by SSAB
Material Water content(%) Note
Mill scale 4.5
Des. Scrap 11.4 Changes from 7 to 16%
Steel scrap 2.2
BF top dust ? BF top dust moisture content not known
Pellet fines (Coarse) 1.3 Changes from 0.2 to 5%
Pellet fines (Fine) 2
Briquette fines ? Not known, estimate 8%
Similar to procedures done to dry the by-products, moisture content was determined based
on standard, BS EN 1097-5:2008. Test portions ranged from 200 to 400 g. Lab ventilated
drying oven thermostatically controlled to maintain a temperature of 110º C this time was
used. Aluminum plates with a size of 1 liter were used to hold the samples. The weights
of empty clean plates ( ) was determined. Plates holding the samples were weighted
and mass of the moist test sample ( ) was obtained by subtracting the mass of the empty
clean plate ( ). The samples were then left to dry until constant mass was achieved as
explained earlier. The final weight of the plates and samples was determined and the mass
of dry test portion ( ) was then determined by subtracting the mass of the tray. Water
content was then determined according to the following equation:
=−
× 100 (8)
Where:
W is the water content
is the mass of moist test portion.
is the mass of dried test portion.

55
The moisture content test results are shown in results section.
5.3 XRF sample preparation and analysis
To perform XRF analysis, samples were first grinded to fine powder using Mixer Mill
MM 400 shown in Figure 19 below. The sample is grinded through friction and high
energy impact with the rounded end of the grinding jar.
Figure 19 Mixer Mill MM 400 used for XRF sample preparation
Around 12-15 g of material were grinded per each jar. Tungsten carbide jars and two
tungsten carbide grinding balls with a diameter of 12 mm were used for each jar. The
vibrational frequency was set to 30 Hz and the vibration duration was 10 minutes for most
of the samples. The final grinding output is particles of less than 1 µm in size. Grinding
BOF sludge was somehow problematic as the sludge adhered to the inner surface of the
jar and became very hard which required a lot of effort to remove. The jars and balls were
cleaned after grinding each sample. It’s worth noting that the binders (slag cement and
rapid cement) were not grinded.

56
Around 8 g of powder was then pressed into pellets utilizing around 2.6 g of Boreox as a
binder. Boreox is organic material that has excellent binding properties and is safe
substitute for boric acid (“Pressing technology,” n.d.). Some pellets were crushed when
using 8 g of powder and for that reason, 4 g of powder were used instead. Herzog pressing
machine was used to produce the pellets with pressing force of 10 t.
Calibrated Pananlycal, Axios Max wavelength-dispersive spectrometer equipped with
rhodium anode tube was used for the X-ray fluorescence analyses of the samples in
vacuum medium. Diffraction crystals used were LIF220, LIF 200, GE, PE and PX1.
5.4 LECO samples preparation and analysis
Carbon and sulfur content determination analysis was conducted for BF sludge, BOF
sludge, cast house dust and coke dust. The analysis was done using LECO CS-200. Blank
was then determined for the instrument. A blank is a signal obtained during an analysis
that cannot be attributed to the sample. Blank was determined after 4 replicates utilizing
ceramic crucible, accelerator and standard sample. Instrument was then calibrated against
a sample of known carbon and sulfur concentration (In this case, AR 309). The
accelerator used is iron chips which has a role of ensuring proper combustion of the
sample in the induction furnace.
The samples were first grinded before the analysis. For the samples. Adequate amount of
material is put into the ceramic crucible along with one scope of iron chips accelerator
and one scope of Lecocel (around 1 g each). Minimum measurement time was set to 40
seconds for each sample measured and a comparator level of 1.0% (Comparator level is
percentage of the maximum peak height below which, the analysis would stop). The
measurement is repeated 3 to 5 times for each sample type. The weight, measurement
time, carbon and sulfur content is recorded for each measurement. A calibration
measurement was performed at the end of the procedures to ensure it is within the
expected range.
57
5.5 XRD sample preparation and analysis
To perform XRD analysis, samples were first grinded using agate mortar and pestle seen
below in Figure 20. The desired outcome of the grinding process is spherical particles
with size of 10-50 µm. In the grinding process, it was attempted to keep contamination to
the minimum by keeping the equipment clean after every sample. Mechanical ball
grinding was not performed in order to avoid serious degradation in the crystallinity of
the material.
Figure 20 Agate mortar, pestle and Acetone used for cleaning
Appropriate amount of sample was mounted on flat glass holder as shown in Figure 21.

58
Figure 21 mounting sample on flat holder
The crystalline phases’ identification for the samples was done using Rigaku SmartLab 9
kW in the range 2θ of 4 to 90º with a step of 0.02˚. The samples were scanned at 40 kV
and 135 mA conditions. Phases were identified from the diffraction pattern with Rigaku
integrated X-ray powder diffraction software PDXL 2.6 using ICDD PDF-4 database.
5.6 Scanning Electron Microscope (SEM)
Around 6 g representative samples were taken from each of the 13 material. Next, Around
2/3 of V-vials were filled with the adequate amount of the sample. Commercially
available cold-setting embedding resin, Epofix was then added carefully to the powder
by a syringe as per the manufacturer instructions (Electron microscopy sciences, 2018) .
The powder and resin solution were then stirred trying to avoid air bubbles formation.
The V-vial and final solution obtained after stirring is shown in Figure 22 below. The
solution was then left to rest overnight in room temperature.
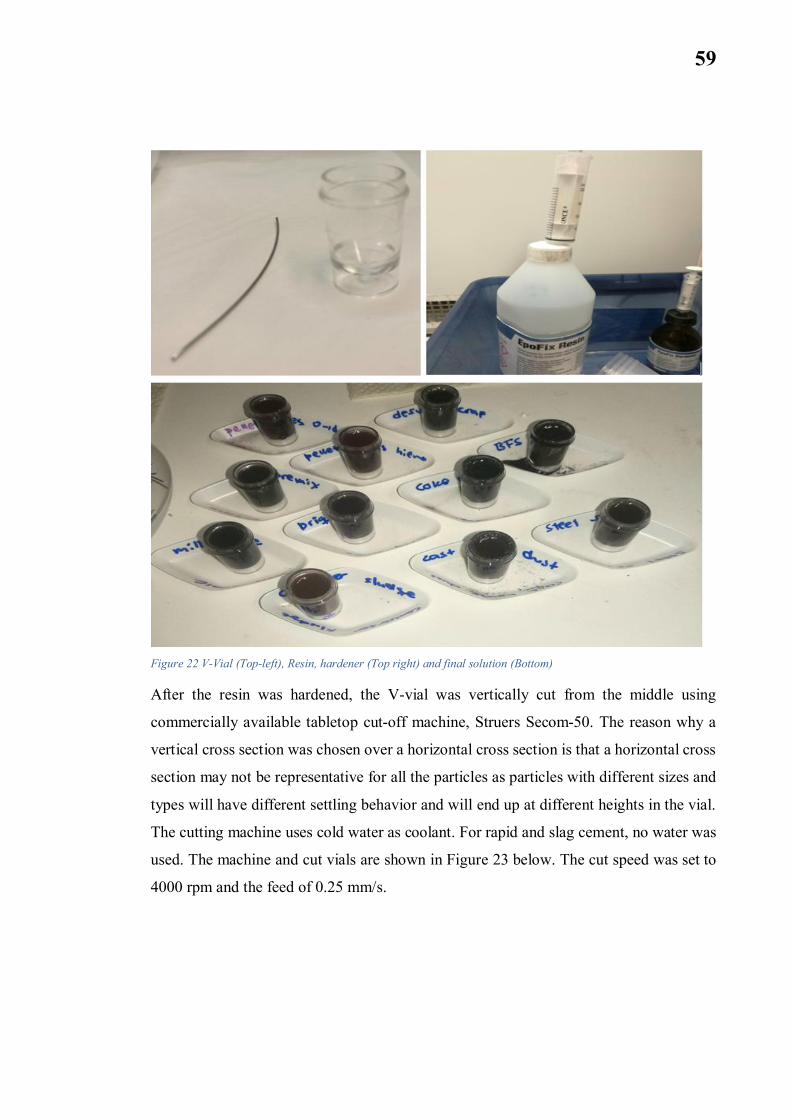
59
Figure 22 V-Vial (Top-left), Resin, hardener (Top right) and final solution (Bottom)
After the resin was hardened, the V-vial was vertically cut from the middle using
commercially available tabletop cut-off machine, Struers Secom-50. The reason why a
vertical cross section was chosen over a horizontal cross section is that a horizontal cross
section may not be representative for all the particles as particles with different sizes and
types will have different settling behavior and will end up at different heights in the vial.
The cutting machine uses cold water as coolant. For rapid and slag cement, no water was
used. The machine and cut vials are shown in Figure 23 below. The cut speed was set to
4000 rpm and the feed of 0.25 mm/s.

60
Figure 23 Tabletop cut-off machine, Struers Secom-50 and vertically cut sample v-vial.
Later, each cut vial was placed in the 2-pieces mold with the horizontal surface facing
upward. After the resin was prepared, it was then added to the mold under vacuum using
commercially available vacuum impregnation unit, Struers CitoVac. The impregnation
unit, mold and marking process are shown in Figure 24 below.
Figure 24 Vacuum impregnation unit (left), flipping sample over (middle) and tagging specimen (Right)
The molds were then left in oven at 40º C to harden over the weekend. Later, the samples
were taken out of the mold and the surface was polished using commercially available
grinding and polishing machine, Struer LaboPol-6 with a variable speed of between 120
- 1200 rpm was used with different disks to obtain polished surface adequate for testing.
The cooling fluid was water for all the specimens except for rapid and slag cement which
utilized ethanol instead as coolant.

61
Figure 25 BF slag cement specimen polishing and final polishing product
Samples were then coated with a thin layer of carbon using JEE-420 Vacuum Evaporator
seen in Figure 26 below. The coated specimen were then examined using Zeiss ULTRA
plus field-emission scanning electron microscope (FE-SEM), attached to an energy-
dispersive X-ray spectroscopy (EDS) unit for chemical analysis. Only BOF sludge, mill
scale, cast house dust, steel scrap and desulphurization scrap were examined.
Figure 26 Carbon coating of specimen

62
5.7 Particle size analysis
Particle size distribution (PSD) analysis was performed through two stages. First, sieving
was used to separate the coarse fraction (more than 2 mm) of each sample. Later, the
finer fraction (below 2 mm) was analyzed using laser diffraction particle size analyzer
Sieving
Dry samples sieve was done using vibratory sieve shaker analysette 3. Sieves with square
opening size of 10, 8, 4 and 2 mm were used to obtain the coarse fraction as can be seen
in Figure 27 below. The amplitude was set for 2 mm and the sieving duration was 15
minutes for each sample. Coke dust, BF sludge, BOF sludge and cement were not sieved.
An amount ranging from 100-300 g of each sample was introduced to the sieve. After
sieving is completed, weight of fraction retained at each sieve and weight of portion
passing through 2 mm sieve were recorded.
Figure 27 Vibratory sieve shaker
Laser diffraction
The particle size distribution of fine fraction less than 2 mm, was determined using
Beckman Coulter LS 13 320, Universal Liquid Module Laser Diffraction Particle Size
Analyzer. Around 0.3-0.4g of each sample was used. First, large clumps of sample were
broken using a spatula while taking care not to break individual particles. In dispersion,
attention was made so that amount of energy used in dispersion should be as equivalent
63
as possible to the application (British Standards Institution, 1986). Samples were
dispersed in around 100 ml of water utilizing ultrasonic instrument, Elmasonic P 30H at
37 kHz in pulse mode for 7 minutes. This was assumed to be equivalent to the dispersion
the by-products will go through in the briquetting process as material are mixed and
pressed. Mill scale, briquette fines, scrap and pellet fines were directly fed with spatula
to laser diffraction PSD analyzer without ultra-sonication treatment.
5.8 Density Measurement
True density
True density is defined as the ratio between the mass to the volume of the solid particles.
The volume occupied by solid particles excludes the pores and voids in between and
inside the solid particles. If voids are present inside the solid particles themselves, then
the ratio between the mass of the solid particles and their volume (excluding only the
volume between the particles) is defined as skeletal density. In this measurement, no voids
are assumed to be inside the solid particles (closed pores) and therefore, the true density
is assumed to be equal to the skeletal density.
For the true density measurement, commercially available gas pycnometer AccuPyc II
1340 was used with helium as displacement gas as shown in Figure 28 below. The
pycnometer sample chamber size was 10 cm3. The volume is measured accurately through
this technique. The operation principle is shown in Figure 29 below. It is based on (1)
using an inert gas such as nitrogen or helium (In this case, helium) to (2) pressurize a
compartment where the sample is located. Helium is able to penetrate through cracks and
pores as small as 1 angstrom in diameter, so only the solid particles will cause gas
displacement. Next, (3) the gas is expanded in another compartment of known volume
where the pressure is measured. With information about the cell volume, the reference
volume and pressure in both compartments, idea gas law is used to get the volume of the
solids as per the below relationship (British Standards Institution, 2014; Slotwinski et al.,
2014).
64
= − − . (6)
Where:
VS is the volume of the solid particles.
Vcell is the volume of the cell where the sample placed.
P1 is the pressure reading before the gas expansion.
P2 is the pressure reading after the gas expansion.
Vref is the volume of the cell where the gas is expanded.
Later, the density is determined based on the following standard formula.
= (7)
Where:
The skeleton density of the solid particle.
The mass of the solids provided by the user.
The volume of the solid particles calculated using ideal gas law.

65
Figure 28 Gas pycnometer AccuPyc II 1340 and helium
gas tank.
Figure 29 Technique principle of gas, pycnometer
AccuPyc II 1340. (“AccuPyc II 1340 | Micromeritics,”
n.d.)
The samples used for characterization were further dried in the oven over night. To ensure
that material were dry, they were weighted before and after they were put in the oven,
and the reduction in weight was mostly below 0.2%. The pycnometer was recently
calibrated. The analysis was performed according to the operator manual. Test conditions
were set as per the manual recommendation which can be seen in Table 8 below.
Table 8 Test settings to measure true measurement
Purge fill press. Number of cycles Cycle fill pressure Equilibration rate Use run precision
134.45 kPa 5 134.45 kPa 0.0345 kPa No
Appropriate amount of each sample (7-8 cm3) was weighted and introduced to the
pycnometer through the sample cell. For each sample, the complete analysis which
consists of 5 runs took around 12-18 minutes to be finished. The temperature, sample
weight, arithmetic mean of true density and standard deviation were recorded for each
sample. The results are shown in later sections.
Bulk density and voids
Bulk density is obtained when dry material fills a container that has certain volume
without compaction and the mass of the dry material is divided by the volume of that
container. An empty container with a capacity of 0.8 liter was used and filled with each
66
by-product. Container was then filled with material and a straight-edge, made of steel was
used to remove the excess material from top of the container. The empty mass of the
container was recorded as well as the mass after being filled with each by-product. Mass
of each by-product was then obtained and the procedure was repeated three times. The
arithmetic mean of the three measurement was obtained and bulk density was decided
(British Standards Institution, 1998). Bulk density and percentage of voids were
determined according to the following relations respectively.
=−
ℎ ,
ℎ ℎ ,
ℎ ℎ , ;
ℎ ℎ , .
=−
× 100
ℎ ;
ℎ , ;
ℎ ,

67
6 BRIQUETTING
6.1 Emma software
By-products particle density and size distribution are provided to EMMA as an input
either by typing the values related to each by-product individually or through copying-
pasting from an Excel sheet as in the form seen in Table 9 below which was the method
used.
Table 9 By-products particle size distribution and density as input to EMMA software
Size(µm)
Pelle
tsfin
es0-
5mm
Pelle
tsfin
es0-
10m
m
Cas
thou
sedu
st
Cok
edu
st
Prem
ix
Bri
quet
tefin
es
Des
ulph
uriz
atio
nsc
rap
Mill
scal
e
Stee
lscr
ap
BO
Fsl
udge
BFS
Rap
idce
men
t
Slag
cem
ent
Lig
nin
Particle density (g/cm3) 4.97 4.96 2.72 1.99 4.22 3.47 3.88 5.44 4.74 4.78 3.27 3.16 2.96 2.00
10000.00 100.00 100.00 100.00 100.00 100.00 100.00 100.00 100.00 100.00 100.00 100.00 100.00 100.00 100.00
8000.00 99.58 100.00 100.00 100.00 99.66 100.00 100.00 100.00 100.00 100.00 100.00 100.00 100.00 100.00
4000.00 96.11 79.62 99.95 100.00 92.58 89.93 91.66 95.02 92.36 100.00 100.00 100.00 100.00 100.00
2000.00 75.66 62.55 99.86 100.00 77.99 69.25 75.71 78.50 78.58 100.00 100.00 100.00 100.00 100.00
1000.00 63.86 39.66 97.66 95.20 54.59 43.77 60.50 51.10 50.53 100.00 100.00 100.00 100.00 73.30
500.00 43.05 25.33 94.67 75.00 36.50 21.95 45.96 27.71 23.50 100.00 99.97 100.00 100.00 45.00
250.00 35.11 21.20 70.70 46.50 21.76 12.53 32.25 14.21 12.18 100.00 92.90 100.00 100.00 27.40
125.00 30.87 18.70 32.65 24.70 11.15 6.64 22.49 6.20 8.09 100.00 74.60 99.80 99.80 16.00
63.00 26.48 15.82 13.48 14.20 6.63 4.04 16.05 2.78 6.16 99.96 57.60 97.40 95.80 7.51
45.00 23.30 13.82 9.25 10.80 5.34 3.28 13.40 2.03 5.46 99.20 50.50 94.90 91.80 5.26
20.00 14.30 8.38 4.74 5.24 3.34 2.02 8.78 1.08 4.10 98.90 34.40 70.40 69.30 2.91
In order to investigate the particle size packing for each briquette recipe, the by-products
of each briquette recipe used are set in EMMA as well as the share of each by-product in
recipe, maximum particle size, minimum particle size and distribution coefficient (q-

68
value). These values are provided as input through the software interface as in Figure 30
below.
Figure 30 Basic recipe input to EMMA software
The q-values, maximum particle size and minimum particle size were chosen to be
0.28/0.30, 8,000 µm and 0.70 µm respectively. Packing of basic recipe as well as for
briquettes utilizing sludge and lignin was checked using the same methodology with the
same parameters.

69
6.2 Briquettes recipe and production
In this study, a hydraulic press briquetting machine with a cylindrical briquetting mold
was used. Briquetting machine consists of vibration unit, hydraulic oil tank, electric motor
and a control unit. Vibration is done with two rotating eccentric weights electric motors
OLI MVE 60/3. The maximum lifting force is 2 x 66 Kg= 132Kg. Maximal vibration
frequency is 50 Hz and could be adjusted to lower values and max pump pressure of this
machine is 100 bar at 5 seconds., the maximum pressure is 214.14 (kg/cm2). One briquette
was made at a time. In order to obtain a uniform briquetting load, paste was fed to the
central mold. Diameter has a diameter of 49.5 mm (area of 19.244 cm2).
Figure 31 Briquetting machine. Figure 32 Mixer
Different recipes were used during the process with different briquetting parameters.
Lists the recipe content of different briquettes produced during the study.

70
Table 10 Recipes of different briquettes produced
Raw
mat
eria
l
Pelle
tfin
es0-
5m
m
Pelle
tfin
es0-
10m
m
BF
stoc
k/ca
stho
use
dust
Cok
edu
st
Prem
ix
Briq
uette
fines
Des
ulfu
rizat
ion
scra
p
Mill
scal
e
Stee
lscr
ap
BO
Fsl
udge
BF
slud
ge
Rap
idce
men
t
Slag
cem
ent
Lign
in
Basic briq 17.37 6.21 3.50 4.32 19.21 10.93 4.86 18.67 2.30 0.00 0.00 6.32 6.32 0.00
2% sludge 17.03 6.08 3.43 4.23 18.83 10.71 4.76 18.30 2.25 0.98 0.98 6.20 6.20 0.00
4% sludge 16.70 5.97 3.36 4.15 18.47 10.51 4.67 17.95 2.21 1.92 1.92 6.08 6.08 0.00
6% sludge 16.39 5.85 3.30 4.07 18.12 10.31 4.58 17.61 2.17 2.83 2.83 5.97 5.97 0.00
8% sludge 16.08 5.75 3.24 4.00 17.79 10.12 4.50 17.29 2.13 3.70 3.70 5.86 5.86 0.00
1% Lignin 17.37 6.21 3.50 4.32 19.21 10.93 4.86 18.67 2.30 0.00 0.00 5.32 6.32 1.00
2% Lignin 17.37 6.21 3.50 4.32 19.21 10.93 4.86 18.67 2.30 0.00 0.00 4.32 6.32 2.00
3% lignin 17.37 6.21 3.50 4.32 19.21 10.93 4.86 18.67 2.30 0.00 0.00 3.32 6.32 3.00
4% Lignin 17.37 6.21 3.50 4.32 19.21 10.93 4.86 18.67 2.30 0.00 0.00 2.32 6.32 4.00
Dry by-products were added together according to the recipe portions and were dry mixed
together for around 6-8 minutes using the mixer. Then, water was gradually added and
mixing continued for another 8-10 minutes until homogenous state of mixture is reached.
Mixing of by-products with binders result in increasing the agglomerate strength and
mechanical properties in general as contact bond points are increased (Singh, 2001). Each
produced briquette was then labelled. Details for each briquette including label, curing
period and test results are shown in appendix #5.
First stage (Producing reference briquette)
Load and vibration were chosen to be 100 bars and 50 Hz respectively similar to
briquetting conditions in SSAB Raahe. Water added was 9.5% on dry basis. Recipe
provided by SSAB Raahe was employed. However, SSAB recipe was based on material
portions with considerable moisture content. After the different by-products were dried,
the recipe had to be modified accordingly to be equivalent to SSAB basic recipe after
taking into account that by-products are dry.

71
In order to obtain similar briquettes, 300 g of wet mixture was then fed and pressed in the
briquetting machine to produce each briquette. The load application is stopped once the
set pressure is reached. This means there is no dwell time is maintained. A total of 9
briquettes were produced. Briquettes are labelled 1A11, 2A12, 3A13 …..9A19.
Second stage (Investigation of briquetting force increase)
According to literature, increasing briquetting force usually result in better briquette
strength (El-Hussiny and Shalabi, 2011; Singh and Bjorkman, 2006). It was therefore
decided to double the briquetting pressure to become 200 bar rather than 100 bar. Same
briquetting procedures were followed as in the first stage except that the applied force
was increased to 200 bar. Due to the material limitation, it was decided to only do a
preliminary compression test using only 1 briquette rather than 3 briquettes after a curing
period of 2, 7 and 28 days as well. Briquettes were labelled 10B11, 11B12 and 12B13.
Third stage (Investigation of BF and BOF sludge introduction)
In this stage, BF and BOF sludge were introduced to the briquette. 2, 4, 6, and 8% of
sludge were added to the recipe rather than replacing other by-products. This means, for
example, for every 100 g of basic recipe, 2, 4, 6 and 8 g of sludge was added to recipe.
BF and BOF sludge were added equally in ratio of 1:1. Same briquetting procedures were
followed as in the first stage, briquetting pressure was 100 bar and moisture content was
9.5%. One briquette of each recipe was tested for compression strength after curing period
of 2, 7 and 28 days. Briquettes produced were labelled with “C” letter i.e. 2% sludge
briquette was labelled 13C11.
The best performing briquette recipe was then tested again for compression test, drop test
tumbling test utilizing 3 briquettes for each test after different curing duration (2, 7 and
28 days) in order to obtain more reliable results. Briquettes produced were labelled with
“D” letter.

72
Fourth stage (Investigation of lignin use as a binder)
In this stage, lignin was introduced to the briquette recipe as a replacement for rapid
cement. Basic reference recipe produced in first stage was utilized with the exception that
1, 2, 3 and 4% of rapid cement was replaced by lignin. This means 4 different recipes are
now obtained. One briquette of each recipe was tested for compression strength after
different curing periods (2, 7 and 28 days). Moisture content of 9.5% and briquetting
pressure of 100 bar were used to produce lignin briquettes. Briquettes produced were
labelled with “E” letter.
However, producing briquettes with fixed moisture content of 9.5% while replacing rapid
cement with lignin meant that (cement/ water) ratio was decreased. In order to obtain the
same cement/water ratio as basic briquette, water addition to briquettes was reduced
proportionally. Three briquettes were produced using recipe with 2% lignin replacing
rapid cement with the exception that, instead of 9.5% water addition, only 8% water
addition was used. Assuming 100 g of recipe, cement/water ratio is obtained as the
following:
Rapid cement (g) + Slag cement (g)water added (g) =
6.32 + 6.329.5 =
4.32 + 6.328 = 1.33
One briquette was tested for compression strength after each curing period (2, 7 and 28
days). Briquettes were labelled with “F” letter.
Curing
Briquettes are placed inside a sealed box together with several water containers to
simulate humid conditions similar to SSAB Raahe curing chambers except that the boxes
was left at room temperature of around 20º C while the curing in SSAB takes place under
a temperature of around 35º C. After the primary curing of the first two days, the box
cover is removed and briquettes are exposed to air. Figure 33 shows the arrangement for
briquettes curing during the first 2 days following briquettes production.
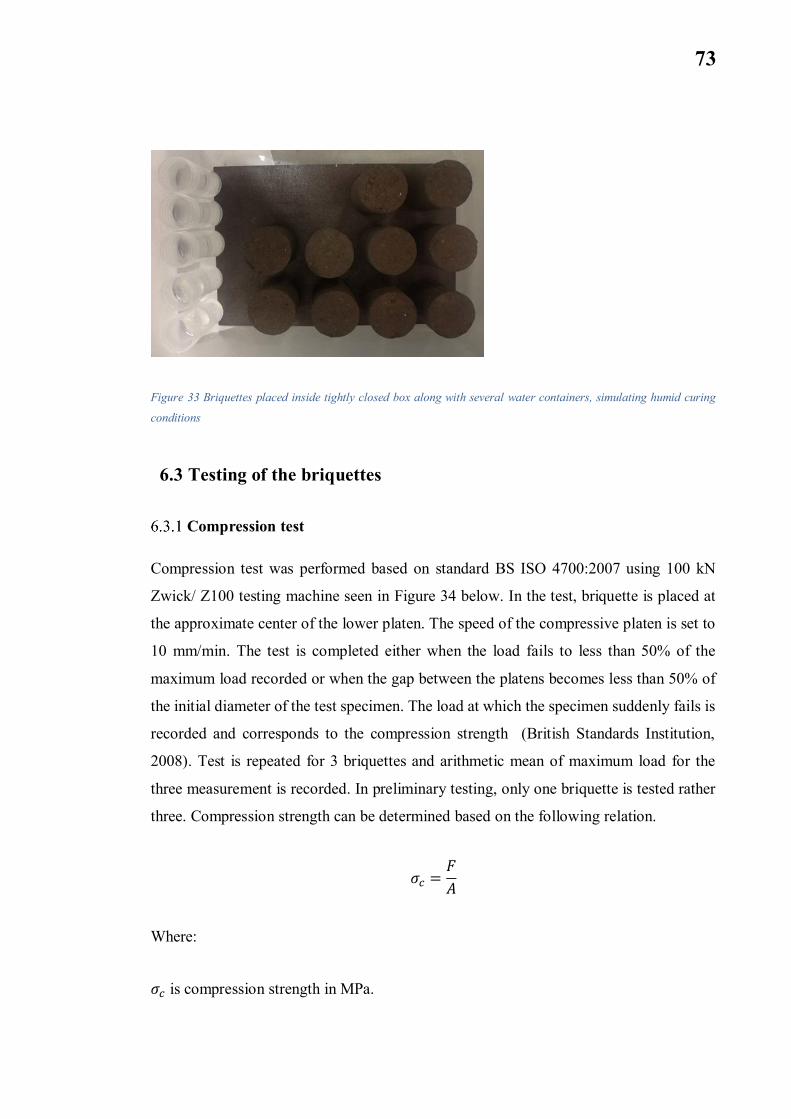
73
Figure 33 Briquettes placed inside tightly closed box along with several water containers, simulating humid curing
conditions
6.3 Testing of the briquettes
Compression test
Compression test was performed based on standard BS ISO 4700:2007 using 100 kN
Zwick/ Z100 testing machine seen in Figure 34 below. In the test, briquette is placed at
the approximate center of the lower platen. The speed of the compressive platen is set to
10 mm/min. The test is completed either when the load fails to less than 50% of the
maximum load recorded or when the gap between the platens becomes less than 50% of
the initial diameter of the test specimen. The load at which the specimen suddenly fails is
recorded and corresponds to the compression strength (British Standards Institution,
2008). Test is repeated for 3 briquettes and arithmetic mean of maximum load for the
three measurement is recorded. In preliminary testing, only one briquette is tested rather
three. Compression strength can be determined based on the following relation.
=
Where:
is compression strength in MPa.

74
F is the force at which the briquette suddenly fails in N.
A is the cross section area of tested briquette in mm2.
Figure 34 Compression test machine
Drop tests
In the drop test, briquettes were dropped from a height of 1 meter into a box made of
refractory steel to allow collection of fines generated as a result of the drop. The dropping
procedure was repeated for 50 times or until the tested briquette loses 50% of its total
mass as a result of dropping. The number of drops at which the briquettes loses 50% of
its total mass is recorded. If the briquette survives 50 drops without losing 50% of its
mass, then the drop damage resistance is recorded as 50. The test is repeated three times
for each briquette recipe and the arithmetic mean of test outcome is recorded. The drop
test was performed for two recipes only due to raw material limited quantity, the basic
recipe and 8% sludge recipe. The drop test was performed for after 2 and 7 days of curing.

75
Tumbler test
In the tumbling test, standard tumbling test drum was not used. Instead, GERMATEC jar
mill type TPR D 950 which is shown in Figure 35 was used to provide rotating motion
similar to that of a tumbling test machine. Two recipe briquettes were tested, basic
reference recipe and the recipe with 8% sludge addition.
Figure 35 GERMATEC jar mill used for tumbling test
In the test, 3 briquettes of each recipe (Cured for 28 days) were used due to the limitation
of material available to produce the standard amount of tested patch (Standard patch is
15 kg). Briquettes mass was recorded and then, they were placed inside rotating jar which
has a diameter and height of 32 and 30 cm respectively. The test duration was 8 minutes
similar to the standard. However, frequency was adjusted so that the jar rotated at 100
rpm (compared to 25 rpm according to the standard). The higher frequency was used to
compensate for the smaller size of the rotating jar and missing lifting flanges which are
found in the standard tumbling test machine. Using lower frequencies resulted in no fines
generation which did not allow comparing tumbling index between the two recipes.
After the test was completed, briquettes and generated fines were collected and sieved
using vibratory sieve shaker analysette 3 with square opening size of 6.30 mm and 500
µm. Tumbling index (TI) and abrasion index (AI) were then determined according to the
following equations (British Standards Institution, 2007a):

76
= × 100
=− ( + )
× 100
Where:
m0 is the mass, in kilograms, of the test portion as weighed out and placed in the tumble
drum;
m1 is the mass, in kilograms, of + 6,30 mm fraction of the tumbled test portion;
m2 is the mass, in kilograms, of − 6,30 mm + 500 µm fraction of the tumbled test portion.

77
7 RESULTS AND DISCUSSION
7.1 Material characterization
Moisture content
Mass of moist samples, dry samples, containers and final moisture content is shown in
Table 11 below.
Table 11 Moisture content test results
# Raw material Moist sample (g) Dried sample (g) Dry basis- Moisturecontent (%)
1 Pellet fines 0-10 mm 418.4 410.62 1.89
2 Pellet fines 0-5 mm 209.87 203.46 3.15
3 BF stock/cast house dust 213.94 173.1 23.59
4 Coke dust 215.56 215.43 0.06
5 Premix (40% BF top dust, 60% steel scrap) 219.77 205.43 6.98
6 Briquette fines 263.43 243.85 8.03
7 Desulfurization scrap 191.56 166.559 15.01
8 Mill scale 215.96 206.8 4.43
9 Steel scrap 278.27 263.97 5.42
The moisture content test results are generally in a good agreement with values provided
by SSAB except for steel scrap which has 5.42% water content compared to 2% provided
by SSAB.
Modified recipe based on moisture content
The recipe provided by SSAB is based on moist by-products weights. Since material has
been dried, modified recipe has to be identified in order to reflect SSAB original recipe.
Assuming 100 grams of material, the percentage of dried material in sample can be
calculated as following:
Moist BF stock/cast house dust portion of cast house dust in original SSAB recipe= 4.1 g

78
Moisture content of cast house dust in original SSAB recipe = 23.59%
0.2359 =4.1 −
=4.1
1.2359 = 3.31742
Similarly, we can obtain the dry portion for all the by-products in 100 g recipe following
the following relation
= 1 +
ℎ ( )
ℎ ( )
ℎ (%)
The portion of each dry material in a dry-basis recipe is obtained as
ℎ
= ℎ

79
Table 12 Modified SSAB recipe on dry-basis
# Raw material Modified dryrecipe (%)
1 Pellet fines 0-10 mm 6.21
2 Pellet fines 0-5 mm 17.37
3 BF stock/cast house dust 3.50
4 Coke dust 4.32
5 Premix (40% BF top dust, 60%steel scrap) 19.21
6 Briquette fines 10.93
7 Desulfurization scrap 4.86
8 Mill scale 18.67
9 Steel scrap 2.30
10 Rapid cement 6.32
11 Slag cement 6.32
Modified SSAB recipe will be used as the basic recipe in briquetting stages.
Chemical composition
XRF and LECO results are listed in Table 13 and Table 14 below. Figure 36 and Figure
37 show the main and minor elements distribution in the by-products.

80
Table 13 Chemical analysis results for main elements in by-products (%)
Pelle
tsfin
es0-
5m
m(%
)
Pelle
tsfin
es0-
10m
m(%
)
Cas
thou
sedu
st(%
)
Cok
edu
st(%
)
Prem
ix(%
)
Briq
uette
fines
(%)
Des
ulph
uriz
atio
nsc
rap
(%)
Mill
scal
e(%
)
Stee
lscr
ap(%
)
BO
Fsl
udge
(%)
BFS
(%)
Rap
idce
men
t(%
)
Slag
cem
ent(
%)
Fe2O3 89.33 89.80 37.49 2.84 64.47 54.25 18.84 95.70 69.54 80.79 58.57 3.66 0.54
CaO 0.52 0.47 14.17 1.28 14.61 21.49 54.19 11.57 4.25 9.53 63.03 38.06
SiO2 6.19 6.00 8.20 7.79 9.88 12.78 11.54 0.73 8.46 2.04 9.05 18.40 34.83
Al2O3 0.53 0.48 3.12 4.04 3.39 3.53 1.92 0.13 3.12 0.18 3.58 4.43 9.68
MgO 2.60 2.41 1.65 0.17 2.38 2.89 1.38 0.08 2.28 1.10 2.54 2.46 10.56
SO3 0.15 0.13 2.02 4.58 1.15 2.04 7.78 0.04 0.49 0.06 1.46 5.26 3.03C
(LECO) 36.96 82.70 0.36 22.05
Table 14 Chemical analysis for minor elements in by-products (ppm)
Pelle
tsfin
es0-
5m
m
Pelle
tsfin
es0-
10m
m
Cas
thou
sedu
st
Cok
edu
st
Prem
ix
Briq
uette
fines
desu
lphu
rizat
ion
scra
p
Mill
scal
e
Stee
lscr
ap
BO
Fsl
udge
BFS
Rap
idce
men
t
Slag
cem
ent
ZnO 3,323 205 879 338 51 685 623 13,660 9,858 514 35
Na2O 1,585 1,648 1,697 919 5,479 8,422 25,260 734 5,172 3,965 4,258 10,140 6,309
PbO 470 200 68 48 137 876 109
K2O 832 790 5,405 3,298 3,839 4,250 1,090 1,329 2,089 3,740 10,190 7,472
MnO 523 478 2,315 157 11,900 5,527 3,938 8,803 14,250 9,470 1,375 476 2,602
V2O5 1,180 1,252 2,537 425 7,529 3,518 3,005 201 6,114 3,684 1,699
TiO2 1,283 1,468 3,627 5,500 3,560 3,924 8,026 214 3,048 909 2,126 2,177 14,090
P2O5 370 349 1,163 2,231 3,071 1,345 914 409 2,592 1,581 1,523 962 34

81
Figure 36 Main elements in by-products
Figure 37 Minor elements in by-products
The chemical analysis of pellet fines showed that it is dominated by iron which is natural
considering that pellets are iron bearing material in BF burden. No considerable
difference was noticed between fine and coarse pellet fines. The rest of the main chemical
elements are slag formers (Si and Ca). Chemical analysis shows no traces of zinc nor lead
which are two of the harmful elements negatively affecting BF operation. Alkalis and

82
phosphorus are present but in relatively low quantity relative to the rest of by-products.
Considering CaO/SiO2 ratio, it appears that pellets are of acid type since acid pellets have
CaO/SiO2 ratio of less than 0.2 (Geerdes et al., 2015). The composition was in good
agreement with values reported by Singh and Bjorkman (2006) with slightly less iron
content, slightly more Ca, Mg, Aluminum, phosphorus and potassium . However, Si, S
and Na content were higher than reported values.
Cast house dust chemical analysis shows that iron and carbon are the main elements in
the composition along with high percentage of calcium and silicon. Harmful component
are relatively high including sulfur, zinc, alkalis, lead and phosphorus. The results were
slightly different from values reported by Lanzerstorfer (2017). It was reported that the
most abundant elements were Fe followed by Ca and C. The chemical analysis showed
that Fe content was less than reported while C content is considerably high being the
second most abundant element after Fe and with more concentration than Ca.
Coke dust was dominated by C as expected followed by lower amounts of Al, Si, S and
Fe. Besides the high concentration of S, other unwanted elements are present in
considerable concentrations including K and P. Traces of Zn and Na are found but they
are generally low. The results are in good agreement with values reported in literature.
However, C content was slightly lower than reported values while Fe, Si concentrations
as well as K and P were higher than reported values. S content was much higher than
reported values (Cavaliere, 2016)
Pre-mix is a mixture of 40% BF top dust and 60% mill scale. The most abundant elements
in pre-mix are Fe followed by Ca, Si and Al. High percentage of Fe in pre-mix is expected
due to the fact that mill scale makes up to 60% of the pre-mix. Considerable
concentrations of K, Na and P are also present in the pre-mix. In order to compare the
chemical composition analysis results, pre-mix composition based on mill scale and BF
from literature was used (Cavaliere, 2016; Robinson, 2008). Generally, the analysis
outcome is in good agreement with values reported in literature. However, Fe content is
lower than values reported in literature while Ca, Si, Na, K and Mn are higher.

83
Briquette fines dominating element is Fe followed by Ca and Si. Other elements present
in lower concentrations are Mg and S. Zn and Pb have low concentration but other
harmful elements such as K and Na are present. Compared to values reported in literature,
Fe is lower than reported values while Ca, Si, Mg and K are higher (Mohanty et al., 2016).
This is expected due to different briquettes utilizing different recipes upon preparation.
The results obtained are also in good agreement with the basic briquette chemical
composition calculations.
Desulfurization scrap chemical analysis showed that it is mainly dominated by Ca
followed by Fe and Si. It’s worth underlining that Fe content is the lowest compared to
other by-products (excluding coke dust). The analysis also shows very high content of Na
and S. K content is low and only a very small trace of Zn is detected.
Mill scale is mostly dominated by Fe. It can be considered as the main Fe source in the
briquette recipe. The rest of the composition consists of Si, Al, Co and Mn as well other
trace elements. The chemical analysis is generally in good agreement with values reported
in literature. However, sources checked do not report Co content which is, according to
the chemical analysis is up to 1.3% (Cavaliere, 2016; El-Hussiny and Shalabi, 2011;
Robinson, 2008)
Steel scrap is also dominated by Fe followed by Ca, Si, Al and Mg. Harmful elements
such as S, Na, P and Cr are present in low but considerable concentrations. BOF slag
chemical composition has been reported in many sources in literature (Das et al., 2007;
Kuo and Hou, 2014; Murphy et al., 1997). However, fewer sources in literature have
reported the chemical composition of the magnetically separated fraction of the slag
(Bölükbaşı and Tufan, 2014; Menad et al., 2014). Chemical analysis results are in good
agreement with results obtained from literature for the low intensity magnetically
separated fraction. However, Ca, P and Si values in literature are less than the analysis
outcome.
BOF sludge is dominated by Fe followed by smaller fractions of Ca and Si. The fraction
of Zn in BOF sludge is the highest amongst all constitutes of briquettes recipe.
Considerable concentrations of harmful elements are also found in the sludge such as Na,
84
K and P. The results are in good agreement with values reported by Robinson (2008) in
regards to Fe. However, C and Ca are much lower than reported while unwanted contents
such as Zn is much higher than reported values. Compared to values reported by Das et
al. (2007), Fe, Ca and Al content are lower than reported. However, Si, Mg and content
are higher. Fe is expected to be found in divalent state as it was reduced during the process
in BOF. Zn content is more than 1.3% in the composition which is very high.
BF sludge chemical composition is dominated by Fe and C followed by Ca, Si, and Al.
Carbon content in BF is amongst the highest in the used by-product. Unwanted elements
such as S, Zn, Na and K are found in low but considerable concentration. The presence
of Fe and C is most likely due to top gas leaving the furnace while carrying fines generated
by top charge material which are mostly pellets and coke that are rich in Fe and C
respectively. The chemical analysis results are in good agreement with results reported
by Omran et al. (2017) for BF sludge sample taken from the same plant. Compared to
values reported by Drobíková et al. (2016), the sludge contained slightly higher Fe and
Zn concentration while Pb concentration was lower than reported values.
Rapid cement chemical analysis showed that Ca is dominant in the composition followed
by Si, Al and Fe. Alkalis concentration combined is more than 2% which is very high
compared to the rest of by-products. Sulfur content is also very high with more than 5%.
The values are in good agreement with values taken from the cement producing company
available at their website (finnsementti, n.d.).
Slag cement (GGBFS) had lower Ca and higher Si concentrations compared to rapid
cement. However, the three primary components were also Ca, Si, MgO and Al
respectively. Slag cement contained less alkalis and sulphur compared to rapid cement.
The chemical composition is within the range obtained from technical data sheets of the
producing company (finnsementti, n.d.). Compared to values reported by Kuo and Hou
(2014), Ca was higher while Si was lower than the measured values. However, the main
components of the GGBFS were Ca, Si, Al, and Mg respectively. Fe was in the same
level as measured values, K was slightly lower than measured value and finally P was
slightly higher than measured.

85
The complete XRF and LECO analyses results for the raw material can be seen in
Appendix #1.
Chemical composition analysis of lignin was performed by other researchers (“About
used lignin,” 2018) and the results are listed in Table 15 below. The results are in good
agreement with values reported in literature except that carbon and sulphur content are
slightly lower than the reported values (Minu et al., 2012) .
Table 15 Chemical analysis of lignin on dry basis (wt %)
Total moisture 3.4
Ash (815 C) 0.3
C 61.3
H 6.23
N 0.7
S 0.087
O 31.4
Lignin has low sulphur content while it is rich in carbon which makes it a potential
replacement for coke dust. Also, the high carbon content may enhance self-reducing
characteristics of the briquettes.
Mineralogical composition
The mineralogical composition of the by-products materials are listed in Table 16. The
minerals phases are arranged in the order of abundance.

86
Table 16 By-products XRD analysis results
By-product Detected phases
Pellet fines 0-10 mm Hematite - Magnetite - Quartz
Pellet fines 0-5 mm Hematite - Magnetite - Quartz
BF stock/cast house dust Hematite - Magnetite and/or Wüstite - Quartz
Premix Hematite - Magnetite - Wüstite - Quartz
Briquette fines Hematite - Calcite – Magnetite- Wüstite
Desulfurization scrap Portlandite - Calcite - Magnetite - Quartz - Iron
Mill scale Magnetite - Wüstite - Hematite - Iron
Steel scrap Hematite - Wüstite - Magnetite - Quartz - Calcite
BF sludge Hematite - Calcite - Quartz – Magnetite/or Wüstite
BOF sludge Magnetite - Hematite - Wüstite - metal iron - Quartz - Calcite
Rapid cement Alite - Larnite - Brownmillerite
For both coarse and fine pellet fines, XRD analysis showed that the dominating phase is
hematite (Fe2O3) followed by magnetite (Fe3O4) and quartz (SiO2). It was expected for
pellet fines to be dominated by hematite as they are not yet reduced in the blast furnace.
Cast house dust dominating phase is hematite (Fe2O3) followed by magnetite (Fe3O4),
Wüstite (FeO) and quartz (SiO2). Magnetite (Fe3O4) and Wüstite (FeO) peaks were found
to be overlapping which requires further investigation into the Fe phases present. No
sources in literature were found to report XRD analysis results for cast house dusts.
However, Lanzerstorfer (2017) reported the presence of iron oxides in form of Fe2O3
detected through EDX.
EDX analysis indicated that carbon particles and iron oxides are the two main constitutes
of the cast house dust sample which is in agreement with XRF analysis results. The
dominating iron phase appeared to be Wüstite (FeO) which is found in irregular shapes
(Figure 38A). Wüstite is found mostly as inclusions in a matrix formed from elements
such as Ca, Si, Al and Mg which are also detected by XRF. However, some particles were
found to consist completely from wüstite.
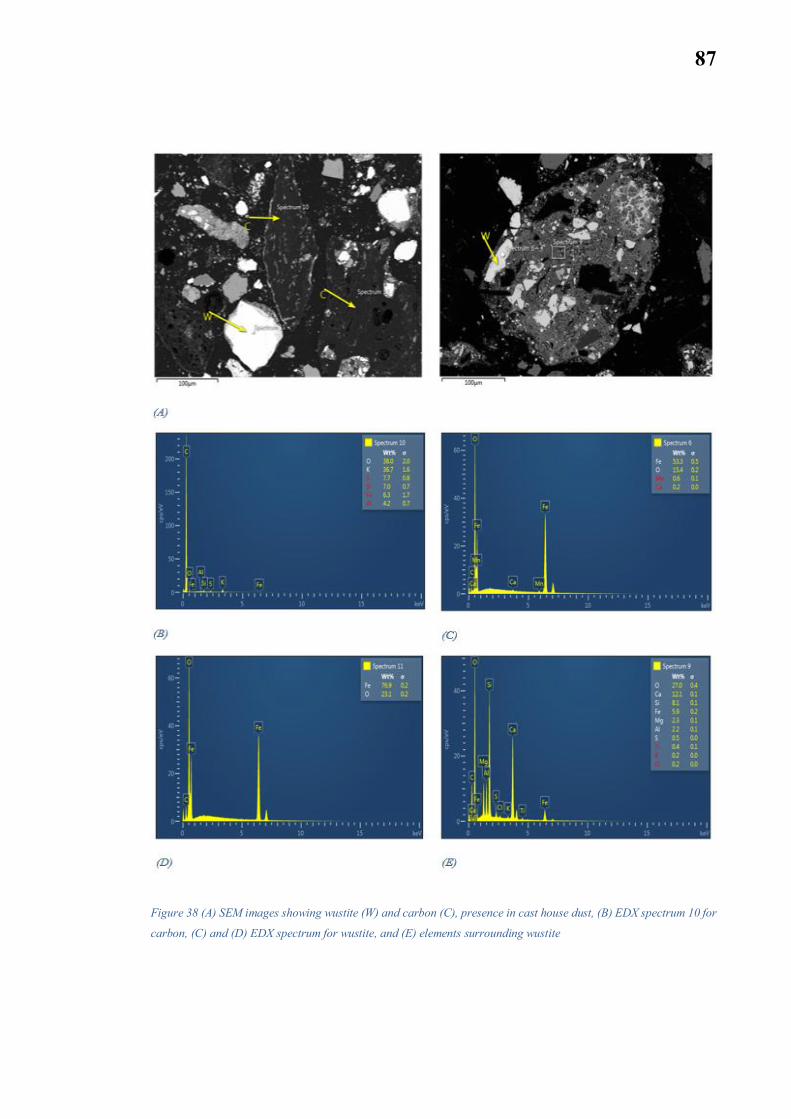
87
Figure 38 (A) SEM images showing wustite (W) and carbon (C), presence in cast house dust, (B) EDX spectrum 10 for
carbon, (C) and (D) EDX spectrum for wustite, and (E) elements surrounding wustite

88
Chemical analysis showed that coke dust mostly consists of C. XRD analysis showed one
main peak for C which is similar to that found for coke breeze reported by Zamalloa and
Utigard (1995) that corresponds to amorphous type of carbon that has wide range of
carbon lattice spacing.
Mill scale XRD analysis shows that the dominating phases are Fe3O4, Fe2O3 and FeO
which confirms the chemical analysis results which revealed that the dominating element
in mill scale is Fe. The results are in good agreement with values reported in literature
(El-Hussiny and Shalabi, 2011; Fosnacht, 1985). Robinson (2008) reported the presence
of minor phases in mill scale such as Ca(OH)2 and CaSiO3.
SEM images and EDS analysis of mill scale confirmed the XRD result as it revealed that
the sample mostly consists of metallic iron and iron oxides. Electron image showed that
particles are found in different shapes with different sizes. Elongated shape particles
appeared to be common. The dominating phases in mill scale, metallic iron (Fe), wüstite
(FeO) and magnetite (Fe3O4) were detected using EDX as can be seen in Figure 39 below.

89
Figure 39 (A) Electron image of mill scale with EDX revealing the presence of (B) metallic iron, (C) wustite and (D
and E) magnetite
90
BF sludge was dominated by hematite (Fe2O3). XRD also indicated the presence of calcite
(CaCO3), quartz (SiO2), magnetite (Fe3O4) or Wüstite (FeO). The intensity peaks of Fe3O4
and FeO were small indicating low concentrations. The reason might be that top gases
carry the fines of the top charge material which mostly consist of coke and pellets that are
dominated by carbon and hematite respectively. Quartz is contained in pellets and is
generated from coke ash while limestone is one source of calcite. Phases containing Zn
were not detected as chemical analysis showed low concentration of zinc (ZnO being less
than 1%), and also such material are isostructural with magnetite which leads to XRD
peaks overlapping (Vereš et al., 2012). This can explain why no Zn peaks were detected
in any of XRD results. The results are in good agreement with results reported in literature
(Omran et al., 2017; Persson and Ahmed, 2014; Vereš et al., 2012).
BOF XRD analysis revealed the presence of hematite (Fe2O3), calcite (CaCO3), quartz
(SiO2), magnetite (Fe3O4), wüstite (FeO) and metallic iron (Fe). The results are in good
agreement with phases reported by Das et al., (2007) except for the quartz phase which
was not reported. The results were also in good agreement with phases detection results
reported by Robinson (2008) except that he reported the presence of portlandite Ca(OH)2.
Persson and Ahmed (2014) also reported the presence of portlandite Ca(OH)2, however,
they did not report the presence of calcite (CaCO3). Kelebek et al. (2004) reported
detection of hematite (Fe2O3), iron oxide (FeO) and zinc ferrite (ZnFe2O4) while
magnetite (Fe3O4) presence was suggested after part of iron oxides responded to a
magnet.
Figure 40 shows SEM image of BOF sludge indicated that the BOF sludge is dominated
by Magnetite, as indicated by EDS (Figure 41 and Figure 42). Magnetite (Fe3O4) is found
mostly as spherical shape of different sizes. It is found either separated as a particle of
enclosed inside a matrix that consists mainly of phases dominated by iron oxides along
with other elements such as Ca and Si.
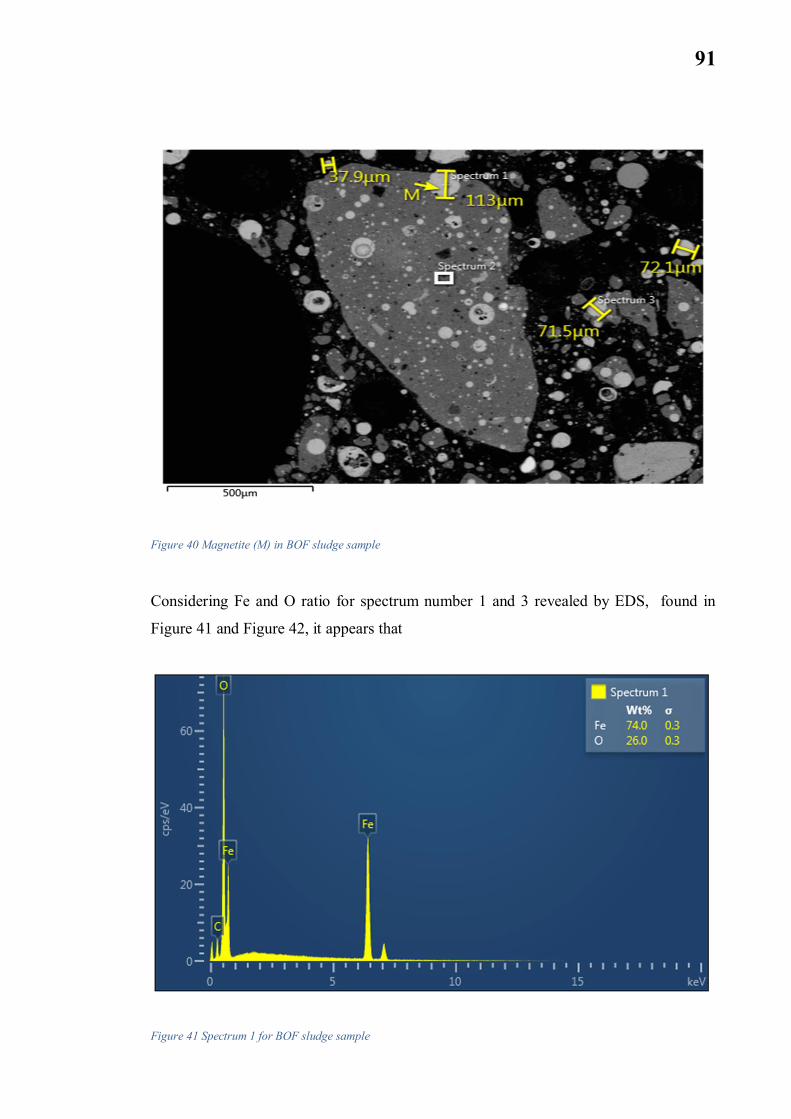
91
Figure 40 Magnetite (M) in BOF sludge sample
Considering Fe and O ratio for spectrum number 1 and 3 revealed by EDS, found in
Figure 41 and Figure 42, it appears that
Figure 41 Spectrum 1 for BOF sludge sample

92
Figure 42 Spectrum 3 for BOF sludge sample
Metallic iron phase is detected in BOF. Metallic iron is found in both spherical and
irregular shapes as in Figure 43 below.
Figure 43 Metallic iron (Fe) in BOF sludge sample

93
Elements distribution maps of BOF confirm the results from chemical analysis and shows
that BOF sludge is mostly dominated by iron oxides as shown in Figure 44 below.
Figure 44 Elements map for BOF sludge sample

94
EDX distribution map of Zn indicated the low concentration of ZN in BOF. Zn can be
detected in higher concentration near the bottom left corner of the image (in Yellow
Square). It appears to be surrounding a spherical shape of iron oxide that has a small core
of Fe. Zn is mostly present as zinc ferrite (ZnFe2O4) phase. The same observation has
been made by (Kelebek et al. (2004), they observed the presence of metallic iron core in
the BOF sludge which was coated by ferrous oxide layer and that in turn was coated by
fine particles of zinc ferrite.
Premix is a mixture between BF flue dust and mil scale with ratio of 60:40. Consequently,
its composition is expected to have phases from both by-products. BF flue dust has a
chemical and mineralogical composition similar to that of BF sludge and is reported in
literature (Robinson, 2008). The Phases detected for premix are Fe3O4, Fe2O3, FeO and
SiO2. Similarly, briquette fines are expected to have phases of material used to produce
briquettes. Since briquettes most dominating by-products constitutes were pellet fines and
mill scale, the phases detected were similar to both by-products, being hematite (Fe2O3),
calcite (CaCO3), magnetite (Fe3O4) and Wüstite (FeO).
Steel scrap XRD analysis showed the presence of hematite (Fe2O3). XRD also indicated
the presence of Wüstite (FeO), quartz (SiO2), magnetite (Fe3O4) and calcite (CaCO3) while
desulphurization scrap contained portlandite Ca(OH)2, calcite (CaCO3), Magnetite
(Fe3O4), quartz (SiO2) and iron (Fe). This is similar to results obtained in a study by Kuo
and Hou, (2014) where it was reported that detected phases in desulphurization slag
contained Ca(OH)2 which is the hydration phase of CaO while Calcite (CaCO3) is
produced by Ca(OH)2 and dissolved CO2.
EDX analysis results confirmed that magnetite (Fe3O4) is the dominating phase as
indicated by XRD. Magnetite appears mostly as spherical particles, but it is also found as
irregular and elongated particles. Metallic iron (Fe) is not commonly found but it appears
to be surrounded by iron oxides such as Wüstite (FeO) and magnetite (Fe3O4).

95
Figure 45 SEM image for steel scrap
Figure 46 EDX spectrum for (A), spherical magnetite particle, (B) elongated magnetite particle, (C) Wüstite
surrounding metallic iron and (D) metallic iron core

96
SEM image and EDX analysis for desulphurization scrap sample are shown in Figure 47
and Figure 48 respectively. It reveals that iron is mostly found in metallic state and is
mostly enclosed in a matrix. EDX spectrum of the matrix reveals that it is dominated by
Ca. Considering XRD analysis and EDX results the matrix is likely to consist mostly of
calcite (CaCO3) (As in spectrum 1 and 3) as well as portlandite Ca(OH) (As in spectrum
4) seen in Figure 47 and Figure 48 below.
Figure 47 SEM image of desulphurization scrap sample

97
Figure 48 EDX spectrum reveals the likely presence of (A, C) Calcite phase, (B) Metallic iron and (D) Portlandite
phase
As expected, Rapid cement detected phases were Alite (tricalcium silicate, Ca3SiO5),
Larnite (modified dicalcium silicate, Ca2SiO4), Brownmillerite (tetra-calcium
aluminoferrite, Ca2AlFeO5) which are the phases found in Portland clinker (Taylor,
1997). On the other hand, the XRD analysis for slag cement does not show diffraction
peaks which is likely due to slag cement being amorphous. XRD spectra obtained for slag
cement is similar to that obtained by Kuo and Hou (2014).
Particle size analysis
Particle size distribution analysis results for by-products are listed in Table 17 and are
shown in Figure 49 below.
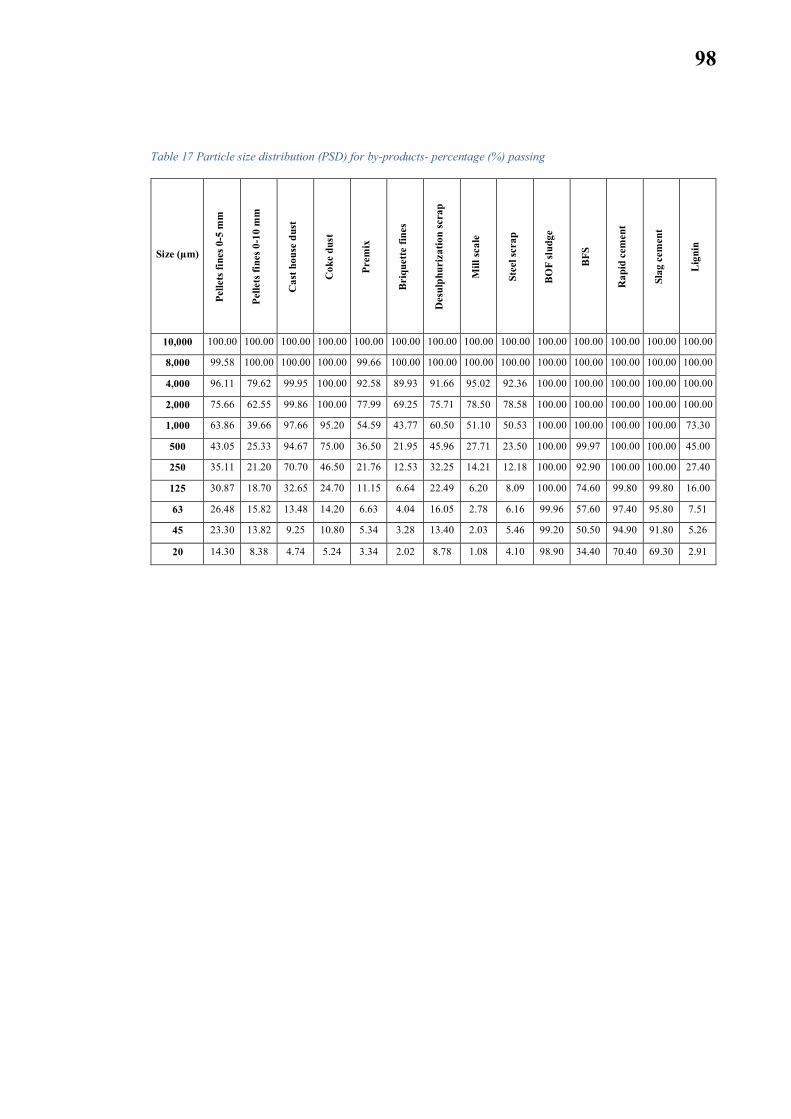
98
Table 17 Particle size distribution (PSD) for by-products- percentage (%) passing
Size (µm)
Pelle
tsfin
es0-
5m
m
Pelle
tsfin
es0-
10m
m
Cas
thou
sedu
st
Cok
edu
st
Prem
ix
Bri
quet
tefin
es
Des
ulph
uriz
atio
nsc
rap
Mill
scal
e
Stee
lscr
ap
BO
Fsl
udge
BFS
Rap
idce
men
t
Slag
cem
ent
Lig
nin
10,000 100.00 100.00 100.00 100.00 100.00 100.00 100.00 100.00 100.00 100.00 100.00 100.00 100.00 100.00
8,000 99.58 100.00 100.00 100.00 99.66 100.00 100.00 100.00 100.00 100.00 100.00 100.00 100.00 100.00
4,000 96.11 79.62 99.95 100.00 92.58 89.93 91.66 95.02 92.36 100.00 100.00 100.00 100.00 100.00
2,000 75.66 62.55 99.86 100.00 77.99 69.25 75.71 78.50 78.58 100.00 100.00 100.00 100.00 100.00
1,000 63.86 39.66 97.66 95.20 54.59 43.77 60.50 51.10 50.53 100.00 100.00 100.00 100.00 73.30
500 43.05 25.33 94.67 75.00 36.50 21.95 45.96 27.71 23.50 100.00 99.97 100.00 100.00 45.00
250 35.11 21.20 70.70 46.50 21.76 12.53 32.25 14.21 12.18 100.00 92.90 100.00 100.00 27.40
125 30.87 18.70 32.65 24.70 11.15 6.64 22.49 6.20 8.09 100.00 74.60 99.80 99.80 16.00
63 26.48 15.82 13.48 14.20 6.63 4.04 16.05 2.78 6.16 99.96 57.60 97.40 95.80 7.51
45 23.30 13.82 9.25 10.80 5.34 3.28 13.40 2.03 5.46 99.20 50.50 94.90 91.80 5.26
20 14.30 8.38 4.74 5.24 3.34 2.02 8.78 1.08 4.10 98.90 34.40 70.40 69.30 2.91

99
Figure 49 Particle size distribution analysis results for by-products
BF sludge particle size analysis shows that particles are mostly below 250 µm which is
noticeably coarser than values reported by Andersson et al. (2017) as BF sludge PSD
reported was finer than 80 µm. The reason for such a fine PSD was that aero-cyclone was
used as primary gas cleaning equipment which has high efficiency separating the finer
sizes particles. Results were in good agreement with PSD reported by Omran et al. (2017)
for sludge sample taken from the same source. Mill scale PSD ranged mostly from 125
µm to 4 mm which is in good agreement with values reported by El-Hussiny and Shalabi
(2011). The hard coarse particles of mill scale may form skeleton structure for the
briquettes. PSD analysis results revealed that BOF sludge has very fine particles that are
all below 45 µm which is in good agreement with results reported by Persson and Ahmed
(2014).
Both types of cement used had very similar particle size distribution with more than 95%
of particles being less than 63 µm. cement PSD is in good agreement with analysis carried
out by Su et al. (2004). Cast house dust was considerably coarser than values reported
Lanzerstorfer (2017) who reported that cast house dust PSD was below 100 µm while in

100
this study, PSD of cast house dust ranges mostly from 45 to 500 µm. Particle size
distribution analysis results for coke dust, steel scrap and premix was in good agreement
with values reported by Möttönen (2013). However, particle size distribution for
desulphurization scrap was slightly finer than reported values.
Considering particle size distribution results of by-products and the used recipes for
producing briquettes, the particle size distribution of different briquettes could be
obtained as shown in Table 18 below.
Table 18 Particle size distribution for briquettes recipes
Size (µm)
Bas
icbr
ique
tte
2%sl
udge
briq
uett
e
4%sl
udge
briq
uett
e
6%sl
udge
briq
uett
e
8%sl
udge
briq
uett
e
1%lig
nin
briq
uett
e
2%lig
nin
briq
uett
e
3%lig
nin
briq
uett
e
4%lig
nin
briq
uett
e
10,000.00 100.00 100.00 100.00 100.00 100.00 100.00 100.00 100.00 100.00
8,000.00 99.86 99.86 99.87 99.87 99.87 99.86 99.86 99.86 99.86
4,000.00 94.02 94.14 94.25 94.36 94.46 94.02 94.02 94.02 94.02
2,000.00 80.17 80.56 80.93 81.29 81.64 80.17 80.17 80.17 80.17
1,000.00 62.64 63.37 64.07 64.75 65.40 62.37 62.10 61.83 61.56
500.00 45.60 46.67 47.69 48.68 49.63 45.05 44.50 43.95 43.40
250.00 34.59 35.80 36.97 38.09 39.17 33.86 33.13 32.41 31.68
125.00 26.66 27.85 28.99 30.09 31.15 25.82 24.98 24.14 23.30
63.00 22.04 23.15 24.22 25.25 26.24 21.14 20.24 19.34 18.44
45.00 20.04 21.12 22.15 23.14 24.10 19.14 18.24 17.35 16.45
20.00 13.82 14.85 15.85 16.81 17.73 13.14 12.46 11.79 11.11
According to Kumar et al. (2017), increasing finer fraction (< 100µm) in briquettes
beyond 30% results reducing the strength and increasing the binder amount required. It
can be seen from the table that increasing BF and BOF sludge content introduced to the
briquette would result in the finer fraction of briquette to approach the recommended
values. However, when increasing lignin content substituting rapid cement, the fraction
of particles below 125 µm is decreased to around 23.3% which may be a reason to
negatively influence the briquette strength.
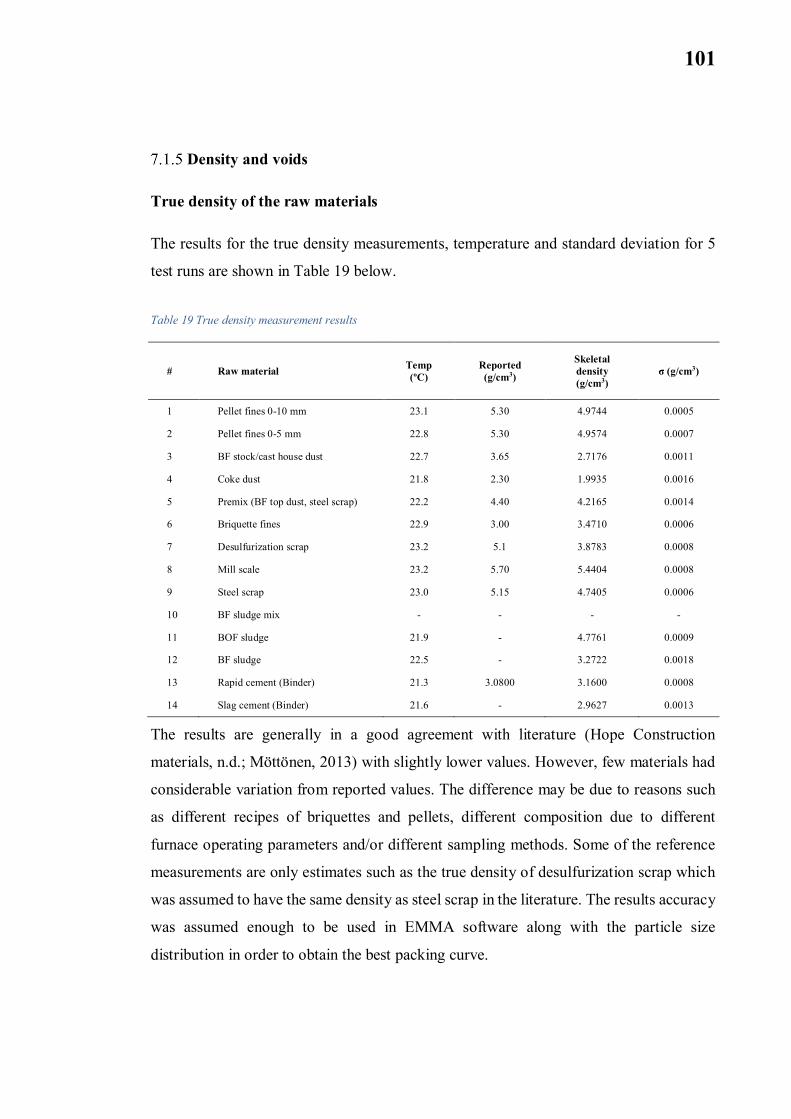
101
Density and voids
True density of the raw materials
The results for the true density measurements, temperature and standard deviation for 5
test runs are shown in Table 19 below.
Table 19 True density measurement results
# Raw material Temp(ºC)
Reported(g/cm3)
Skeletaldensity(g/cm3)
σ (g/cm3)
1 Pellet fines 0-10 mm 23.1 5.30 4.9744 0.0005
2 Pellet fines 0-5 mm 22.8 5.30 4.9574 0.0007
3 BF stock/cast house dust 22.7 3.65 2.7176 0.0011
4 Coke dust 21.8 2.30 1.9935 0.0016
5 Premix (BF top dust, steel scrap) 22.2 4.40 4.2165 0.0014
6 Briquette fines 22.9 3.00 3.4710 0.0006
7 Desulfurization scrap 23.2 5.1 3.8783 0.0008
8 Mill scale 23.2 5.70 5.4404 0.0008
9 Steel scrap 23.0 5.15 4.7405 0.0006
10 BF sludge mix - - - -
11 BOF sludge 21.9 - 4.7761 0.0009
12 BF sludge 22.5 - 3.2722 0.0018
13 Rapid cement (Binder) 21.3 3.0800 3.1600 0.0008
14 Slag cement (Binder) 21.6 - 2.9627 0.0013
The results are generally in a good agreement with literature (Hope Construction
materials, n.d.; Möttönen, 2013) with slightly lower values. However, few materials had
considerable variation from reported values. The difference may be due to reasons such
as different recipes of briquettes and pellets, different composition due to different
furnace operating parameters and/or different sampling methods. Some of the reference
measurements are only estimates such as the true density of desulfurization scrap which
was assumed to have the same density as steel scrap in the literature. The results accuracy
was assumed enough to be used in EMMA software along with the particle size
distribution in order to obtain the best packing curve.

102
Bulk density and voids
The bulk density results and voids percentage are shown in Table 20 below.
Table 20 Particle density, bulk density and voids percentage
# Raw material Skeleton density (kg/m3) Bulk density (kg/m3) Voids (%)
1 Pellet fines 0-10 mm 4,974.40 2,579.10 48.15
2 Pellet fines 0-5 mm 4,957.40 2,688.50 45.77
3 BF stock/cast house dust 2,717.60 1,089.93 59.89
4 Coke dust 1,993.50 364.75 81.70
5 Premix 4,216.50 2,076.14 50.76
6 Briquette fines 3,471.00 1,725.73 50.28
7 Desulfurization scrap 3,878.30 1,519.49 60.82
8 Mill scale 5,440.40 2,676.13 50.81
9 Steel scrap 4,740.50 2,406.33 49.24
10 BOF sludge 4,776.10 1,796.03 62.40
11 BF sludge 3,272.20 1,279.83 60.89
Results reveal that most of by-products used have an average voids of about 50% except
for coke which has much higher porosity at about 81.70%.
7.2 Briquettes
Briquettes compaction with EMMA
Particle compaction curve generated by EMMA software utilizing modified Andreassen
model with q value of 0.30 can be seen in figures below for basic recipe briquette, 8%
introduced sludge recipe and finally, for the briquette with 1% lignin substituting cement.
Figure 51 shows the compaction curve for basic recipe utilizing Andreassen model. The
red line shows the perfect particle backing based on modified Andreassen curve while
blue line is the particle packing of different recipes. Maximum and minimum particle size
is set to 8,000 and 0.7 µm respectively. The complete results for particle packing for all
used recipes with q-value of 0.30 and 0.28 can be found in appendix #3.

103
Figure 50 Basic briquette particle compaction (q=0.30)
Figure 51 Basic briquette particle compaction (q=0.30) utilizing Andreassen model

104
Figure 52 Compaction of briquette with 8% introduced sludge (q=0.30)
Figure 53 EMMA particle packing for 1% lignin briquette (q=0.30)
Comparing between the compaction curves generated by Andreassen model and modified
Andreassen model, it appears that Modified Andreassen model yields better and more
realistic results as minimum particle size is being considered in the model. Thus, Modified
Andreassen model was used for generating the perfect compaction curve for the rest of
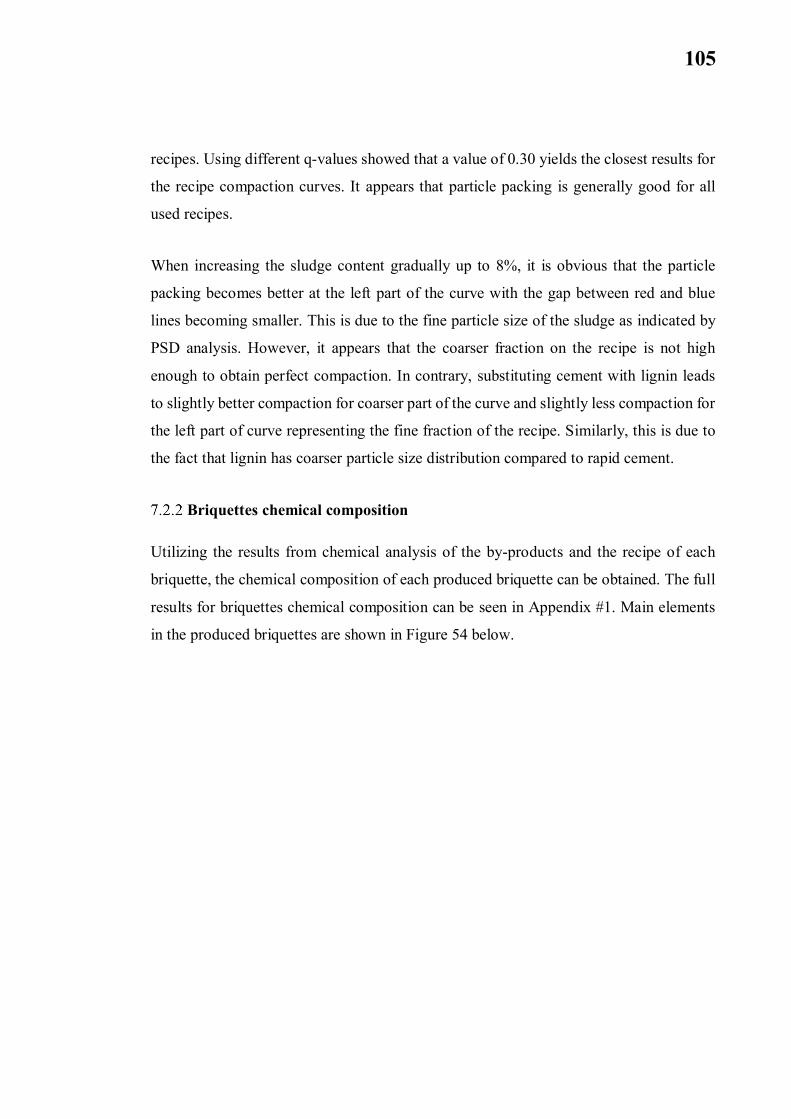
105
recipes. Using different q-values showed that a value of 0.30 yields the closest results for
the recipe compaction curves. It appears that particle packing is generally good for all
used recipes.
When increasing the sludge content gradually up to 8%, it is obvious that the particle
packing becomes better at the left part of the curve with the gap between red and blue
lines becoming smaller. This is due to the fine particle size of the sludge as indicated by
PSD analysis. However, it appears that the coarser fraction on the recipe is not high
enough to obtain perfect compaction. In contrary, substituting cement with lignin leads
to slightly better compaction for coarser part of the curve and slightly less compaction for
the left part of curve representing the fine fraction of the recipe. Similarly, this is due to
the fact that lignin has coarser particle size distribution compared to rapid cement.
Briquettes chemical composition
Utilizing the results from chemical analysis of the by-products and the recipe of each
briquette, the chemical composition of each produced briquette can be obtained. The full
results for briquettes chemical composition can be seen in Appendix #1. Main elements
in the produced briquettes are shown in Figure 54 below.

106
Figure 54 Main elements in different produced briquettes
It can be seen from the figure that Fe2O3 content is the same for all briquettes at around
61.5%. Introducing sludge to the briquettes does not affect the iron content as BOF and
BF sludge are rich in Fe. Also, substitution of rapid cement with lignin does not affect the
basic briquette overall iron content as rapid cement has originally low concentration of
iron. Carbon content increase slightly by increasing the introduced amount of sludge due
to the high C content in BOF sludge which more than 22%. Substitution of rapid cement
with lignin results in much higher C content in the produced briquette due to the high C
content in lignin which may have a good influence of the direct reduction characteristics
of the briquettes utilizing lignin.
Increasing the introduced sludge content does not seem to affect the CaO content as well
as CaO content in the sludge is similar to that of the average CaO in the other by-products
used in the briquettes. However, substitution of rapid cement with lignin results in
considerable decrease in CaO content as the rapid cement which is originally dominated
by CaO is replaced by lignin which does not contain any. SiO2 and Al2O3 stay at the same
level with the addition of sludge to the recipe due to the presence of the two elements in
both BF and BOF sludge. Introducing lignin as substitute to the rapid cement results into
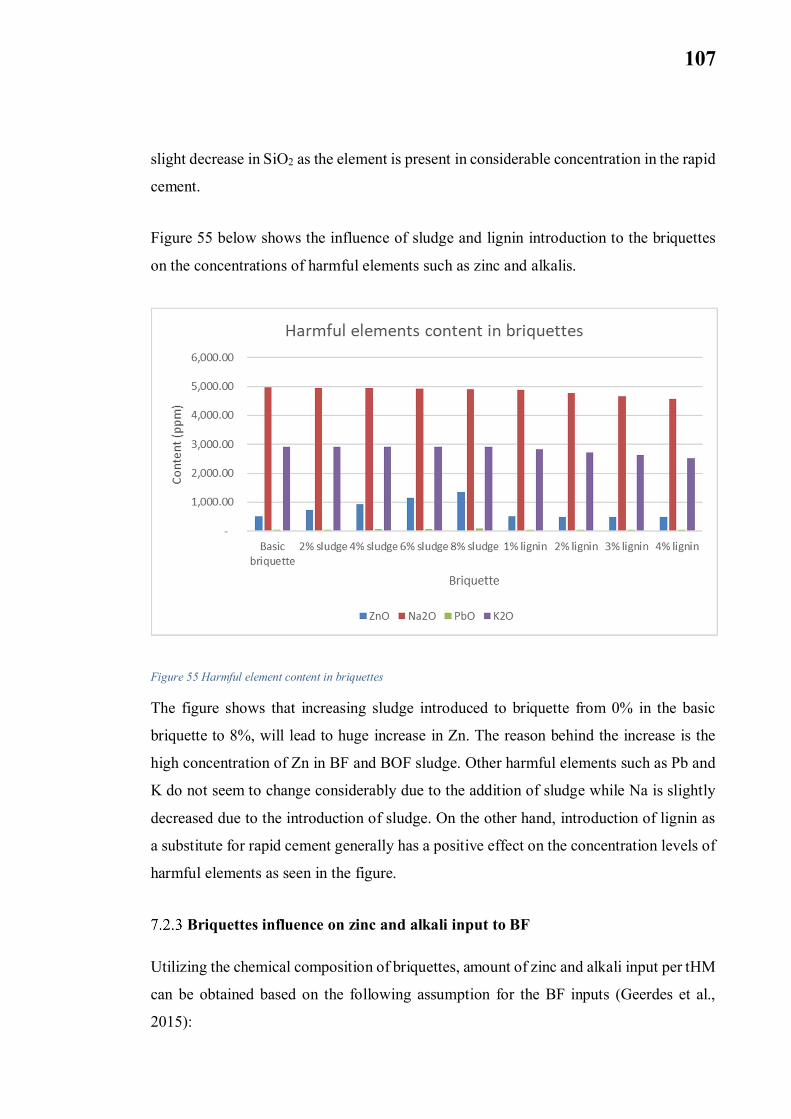
107
slight decrease in SiO2 as the element is present in considerable concentration in the rapid
cement.
Figure 55 below shows the influence of sludge and lignin introduction to the briquettes
on the concentrations of harmful elements such as zinc and alkalis.
Figure 55 Harmful element content in briquettes
The figure shows that increasing sludge introduced to briquette from 0% in the basic
briquette to 8%, will lead to huge increase in Zn. The reason behind the increase is the
high concentration of Zn in BF and BOF sludge. Other harmful elements such as Pb and
K do not seem to change considerably due to the addition of sludge while Na is slightly
decreased due to the introduction of sludge. On the other hand, introduction of lignin as
a substitute for rapid cement generally has a positive effect on the concentration levels of
harmful elements as seen in the figure.
Briquettes influence on zinc and alkali input to BF
Utilizing the chemical composition of briquettes, amount of zinc and alkali input per tHM
can be obtained based on the following assumption for the BF inputs (Geerdes et al.,
2015):

108
- Burden (pellets and briquettes) = 1,580 kg/tHM
- Coke = 300 kg/tHM
- Coal = 200 kg/tHM
It was assumed that pellets chemical composition is the same as coarse pellet fines, coke chemical
composition is the same as coke fines and coal composition being 0.286% Fe2O3, 3% SiO2 and
1.5% Al2O3 (Geerdes et al., 2015). Briquettes were assumed to be 8% of the total burden
introduced to BF. Naturally, introducing briquettes with increased sludge content results in
increased input of Zn per tHM. Zinc and alkali input values based on 8% share in burden
are listed in below.
Table 21 harmful elements input to BF based on 8% share in burden (g/tHM)
No
briq
uett
es
Bas
icbr
ique
tte
2%sl
udge
4%sl
udge
6%sl
udge
8%sl
udge
1%lig
nin
2%lig
nin
3%lig
nin
4%lig
nin
Zn 48.000 104.000 124.000 144.600 168.700 184.800 104.000 100.400 99.600 98.800
Na 2.136 2.448 2.448 2.448 2.443 2.442 2.438 2.429 2.419 2.410
K 1.858 2.082 2.082 2.082 2.082 2.082 2.071 2.060 2.050 2.039
Alkali 3.994 4.530 4.530 4.530 4.525 4.524 4.509 4.489 4.469 4.449
Figure 56 below shows how the zinc and alkali (Na and K) input to the process per tHM
change as different briquettes are introduced to the process.
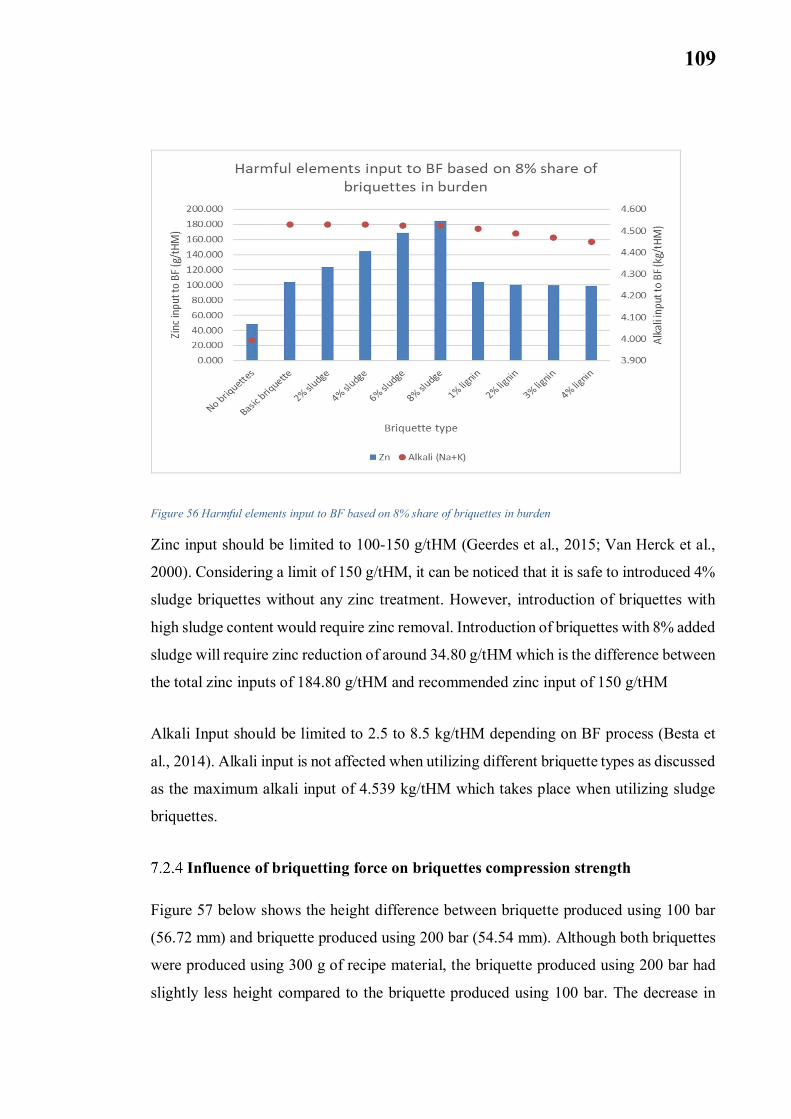
109
Figure 56 Harmful elements input to BF based on 8% share of briquettes in burden
Zinc input should be limited to 100-150 g/tHM (Geerdes et al., 2015; Van Herck et al.,
2000). Considering a limit of 150 g/tHM, it can be noticed that it is safe to introduced 4%
sludge briquettes without any zinc treatment. However, introduction of briquettes with
high sludge content would require zinc removal. Introduction of briquettes with 8% added
sludge will require zinc reduction of around 34.80 g/tHM which is the difference between
the total zinc inputs of 184.80 g/tHM and recommended zinc input of 150 g/tHM
Alkali Input should be limited to 2.5 to 8.5 kg/tHM depending on BF process (Besta et
al., 2014). Alkali input is not affected when utilizing different briquette types as discussed
as the maximum alkali input of 4.539 kg/tHM which takes place when utilizing sludge
briquettes.
Influence of briquetting force on briquettes compression strength
Figure 57 below shows the height difference between briquette produced using 100 bar
(56.72 mm) and briquette produced using 200 bar (54.54 mm). Although both briquettes
were produced using 300 g of recipe material, the briquette produced using 200 bar had
slightly less height compared to the briquette produced using 100 bar. The decrease in
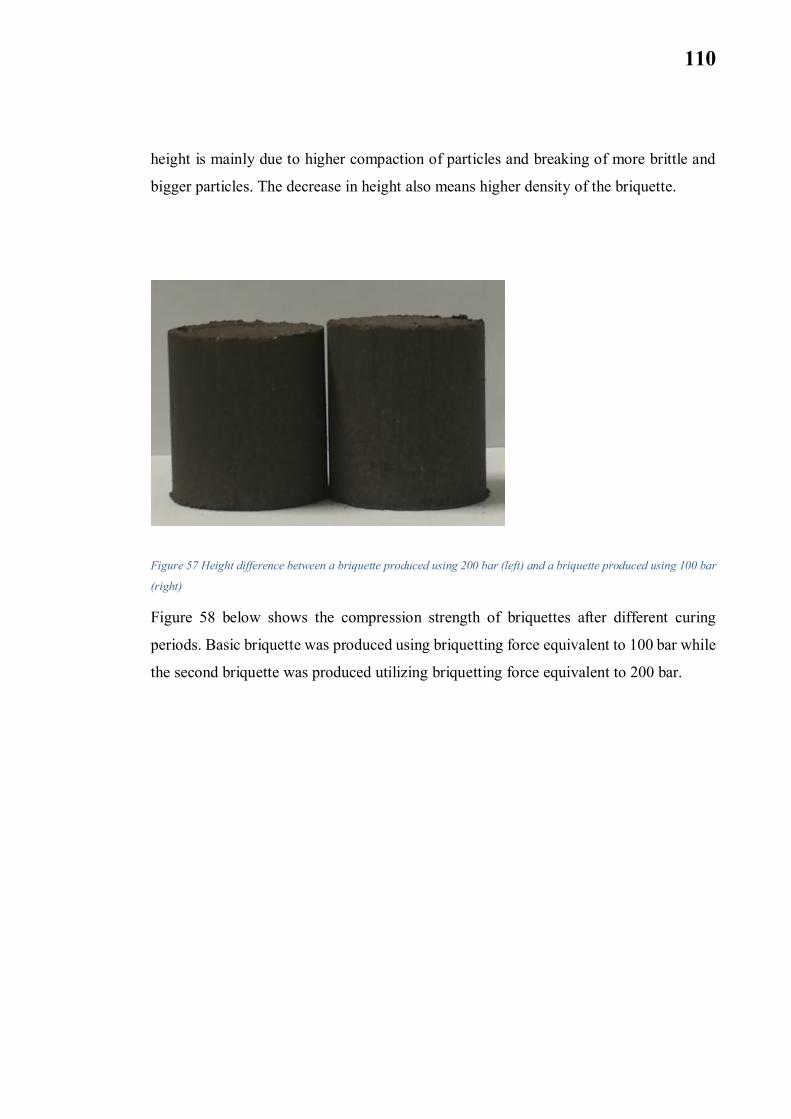
110
height is mainly due to higher compaction of particles and breaking of more brittle and
bigger particles. The decrease in height also means higher density of the briquette.
Figure 57 Height difference between a briquette produced using 200 bar (left) and a briquette produced using 100 bar
(right)
Figure 58 below shows the compression strength of briquettes after different curing
periods. Basic briquette was produced using briquetting force equivalent to 100 bar while
the second briquette was produced utilizing briquetting force equivalent to 200 bar.

111
Figure 58 Influence of briquetting force on briquettes compression strength
After 2 days curing period, briquette produced utilizing briquetting pressure of 100 bar
developed slightly higher compression strength compared to the briquettes that are
produced using higher force. However, as the curing period increased, the strength of the
basic briquette (utilizing 100 bar briquetting pressure) was considerably higher. Overall,
briquettes produced using 100 bar briquetting pressure performed better than briquettes
produced using 200 briquetting pressure after all curing periods that were checked. It was
expected for the increased briquetting force to lead to an increase in the number of contact
points between the particles which would ultimately lead to enhanced strength. However,
the briquetting strength has slightly decreased which might be due to the large pellet and
briquette fines as well as brittle particles such as coke particles breaking under load (Singh
and Bjorkman, 2006).
Figure 59 below shows the behavior of basic briquette recipe produced using briquetting
pressure of 100 and 200 bar. After 7 days of curing, no difference was noticed between
the failure behaviors of both briquettes upon testing. Both briquettes appeared to develop
cracks on the outer surface of the briquettes along their heights while losing considerable
fraction of their mass in form of fines and elongated briquette pieces that separated from
the outer surface. However, after 28 days of curing, tested briquettes exhibited different
failure behavior with briquettes produced using 100 bar briquetting pressure generating

112
less fines than the briquette produced using 200 bar briquetting pressure. Also, no
considerable pieces of the briquette produced using higher force were disintegrated from
the body of the briquette. In BF operation, it is important that minimum amount of fines
is generated as fines have negative effect on BF operation due to the formation of
impermeable layer that hinders that ascending reducing gases (Geerdes et al., 2015).
Figure 59 Briquettes failure after compression test
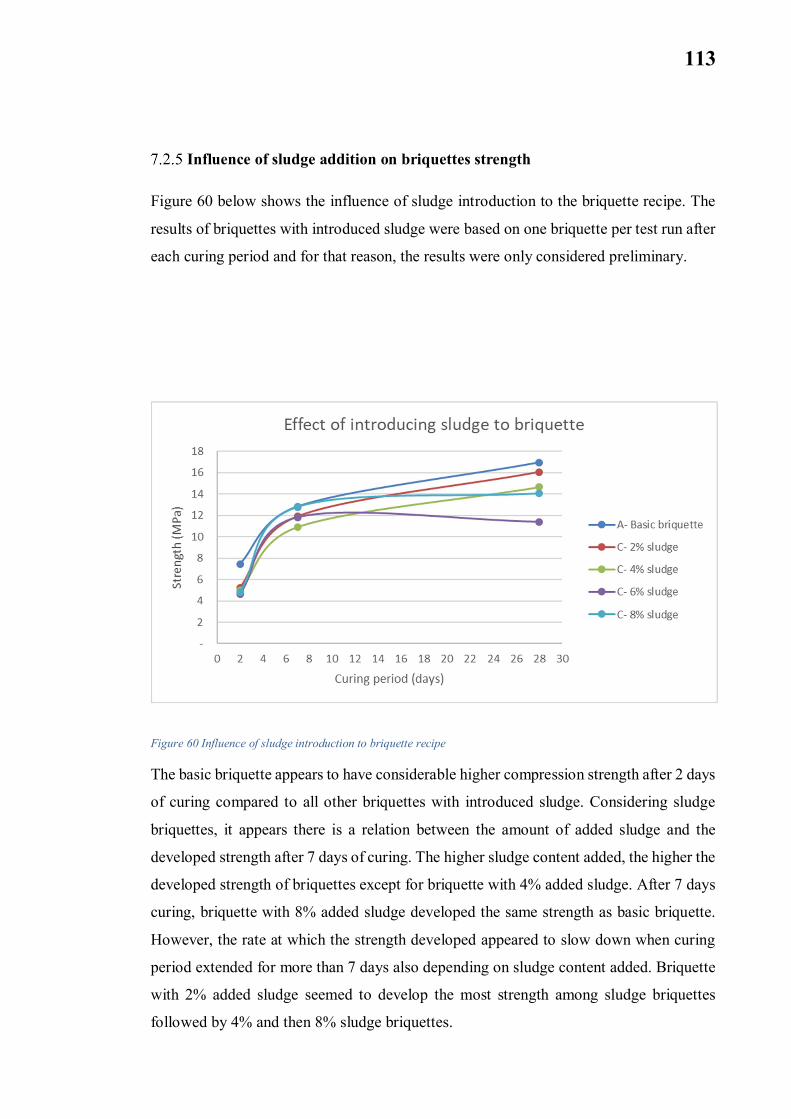
113
Influence of sludge addition on briquettes strength
Figure 60 below shows the influence of sludge introduction to the briquette recipe. The
results of briquettes with introduced sludge were based on one briquette per test run after
each curing period and for that reason, the results were only considered preliminary.
Figure 60 Influence of sludge introduction to briquette recipe
The basic briquette appears to have considerable higher compression strength after 2 days
of curing compared to all other briquettes with introduced sludge. Considering sludge
briquettes, it appears there is a relation between the amount of added sludge and the
developed strength after 7 days of curing. The higher sludge content added, the higher the
developed strength of briquettes except for briquette with 4% added sludge. After 7 days
curing, briquette with 8% added sludge developed the same strength as basic briquette.
However, the rate at which the strength developed appeared to slow down when curing
period extended for more than 7 days also depending on sludge content added. Briquette
with 2% added sludge seemed to develop the most strength among sludge briquettes
followed by 4% and then 8% sludge briquettes.

114
The briquette with 8% introduced sludge was considered to have adequate strength.
Therefore, this briquette recipe was tested again using three briquettes per test in order to
confirm and obtain a more reliable result. Figure 61 shows the test results of briquette
with 8% introduced sludge compared to basic recipe briquette.
Figure 61 Influence of 8% sludge addition to briquette recipe
Similar results are obtained with the compression strength of sludge briquette being
slightly lower than that of the basic briquette after 2 and 7 days of curing. However, the
compression strength of sludge briquette is considerably lower than basic briquette after
28 days of curing as final developed strength of sludge briquette after 28 days of curing
reaches an average of 13.94 MPa compared to an average of 16.96 MPa for basic
briquette. Strength development is likely to be affected by two factors, added sludge and
cement content. Added sludge appears to have positive influence on briquette strength
during the first curing period (2 and 7 days). This is due to the fine particle size of sludge
that contributes into increasing density by filling the voids and also increasing contact
point between particles ultimately resulting in enhanced strength (Pietsch, 2005; Su et al.,
2004). On the other hand, increasing sludge addition to briquette means overall lower
cement content in the briquette. The effect of lower cement can be seen considering longer
curing time as it can be observed from the graph that as briquette takes time to cure, the
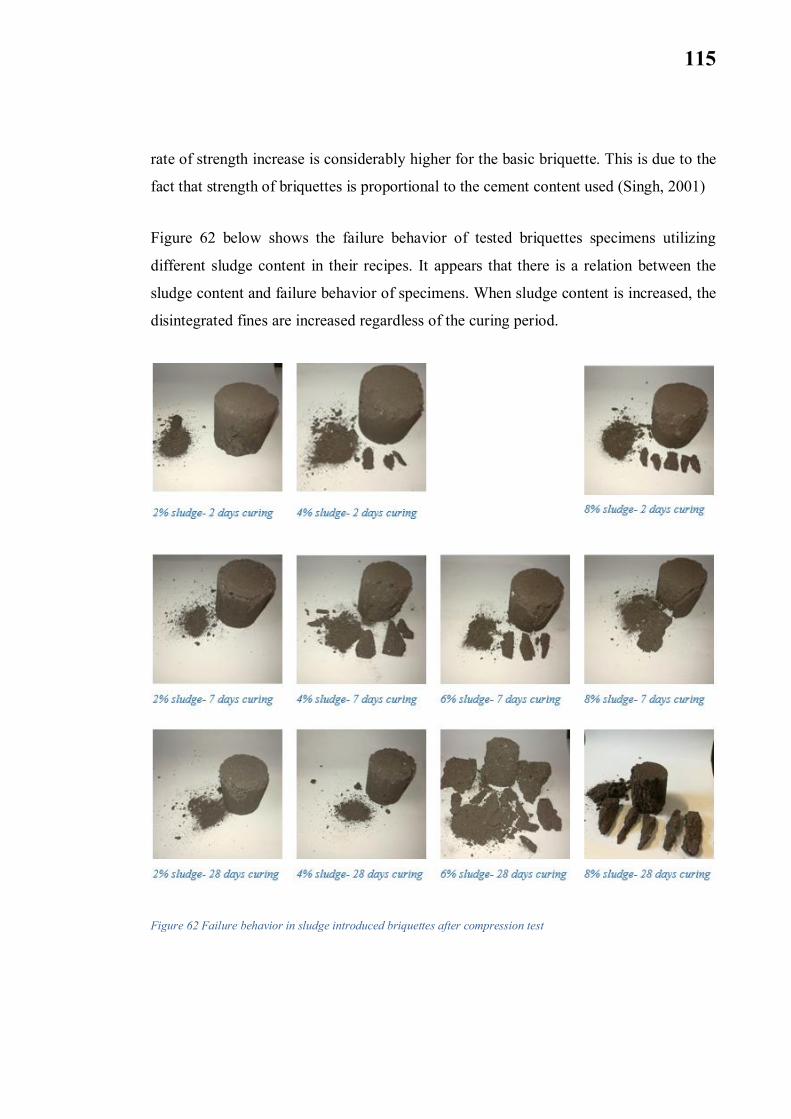
115
rate of strength increase is considerably higher for the basic briquette. This is due to the
fact that strength of briquettes is proportional to the cement content used (Singh, 2001)
Figure 62 below shows the failure behavior of tested briquettes specimens utilizing
different sludge content in their recipes. It appears that there is a relation between the
sludge content and failure behavior of specimens. When sludge content is increased, the
disintegrated fines are increased regardless of the curing period.
Figure 62 Failure behavior in sludge introduced briquettes after compression test
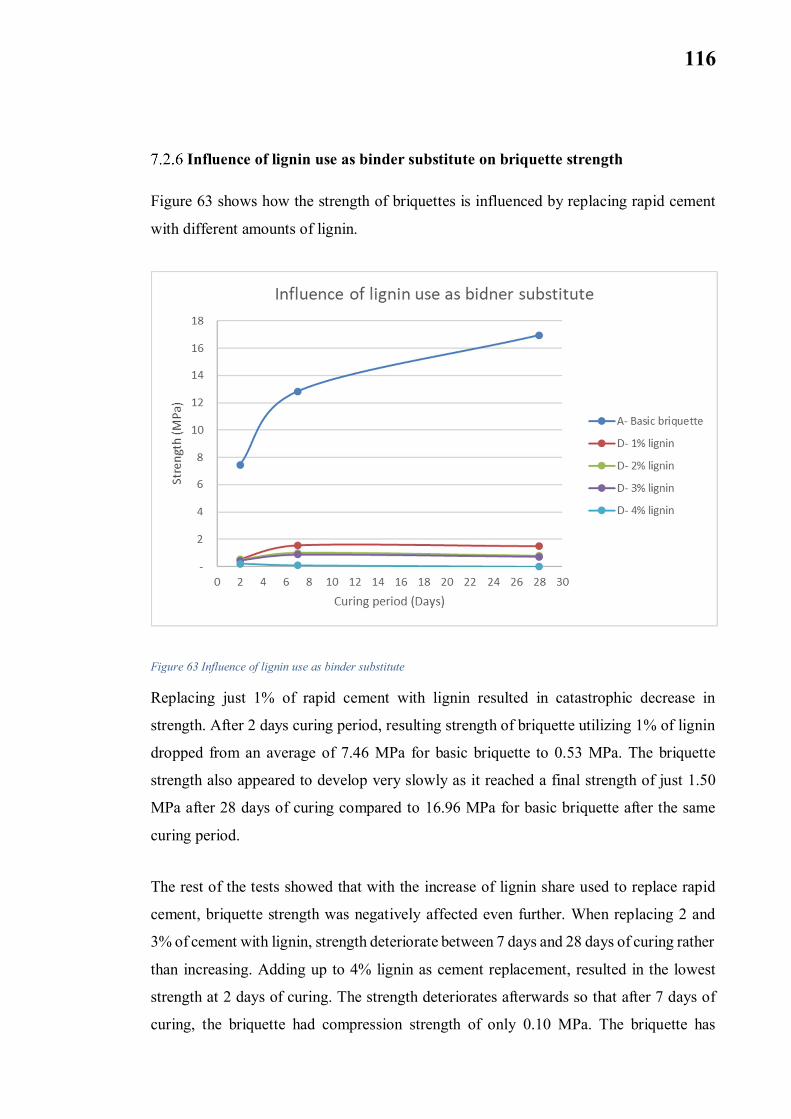
116
Influence of lignin use as binder substitute on briquette strength
Figure 63 shows how the strength of briquettes is influenced by replacing rapid cement
with different amounts of lignin.
Figure 63 Influence of lignin use as binder substitute
Replacing just 1% of rapid cement with lignin resulted in catastrophic decrease in
strength. After 2 days curing period, resulting strength of briquette utilizing 1% of lignin
dropped from an average of 7.46 MPa for basic briquette to 0.53 MPa. The briquette
strength also appeared to develop very slowly as it reached a final strength of just 1.50
MPa after 28 days of curing compared to 16.96 MPa for basic briquette after the same
curing period.
The rest of the tests showed that with the increase of lignin share used to replace rapid
cement, briquette strength was negatively affected even further. When replacing 2 and
3% of cement with lignin, strength deteriorate between 7 days and 28 days of curing rather
than increasing. Adding up to 4% lignin as cement replacement, resulted in the lowest
strength at 2 days of curing. The strength deteriorates afterwards so that after 7 days of
curing, the briquette had compression strength of only 0.10 MPa. The briquette has

117
collapsed after 14 days of curing as a result of slightly touching it. The briquette appeared
to retain its shape with no strength at all.
It was suspected that one of the factors resulting in reduced strength was the decreased
cement/water ratio as cement was replaced by lignin while maintaining the same amount
of water added. This is because cement/water ratio is one of the most important factors
affecting agglomerate strength (Pietsch, 2002; Singh, 2001). Figure 64 shows the effect
of adjusting water content so that cement/water ratio are the same as in basic briquette.
Figure 64 Influence of cement/water ratio on strength of lignin briquette
Lowering the water content has resulted in even lower strength which means higher
cement/water ratio was not one of the factors affecting the briquette strength. One of the
reasons may be that lignin used prevents the hydration reactions. This may have happened
due to the lignin generated in biofuel production being hydrophilic (Zhu et al., 2010),
absorbing considerable amount of water and hindering the hydration reaction. Another
reason might be that lignin interferes in the hydration chemical reactions, preventing the
formation of C-S-H. One reaction that affects the strength of cement is “carbonation”
reaction where carbon dioxide reacts with calcium hydroxide (CaOH), producing CaCO3,
leading to C-S-H with lower Ca/Si ratio that ultimately affects the strength negatively
(Lagerblad, 2005; Taylor, 1997). The effect is however limited to the surface in the

118
normal cases when surfaces with curing cement are exposed to atmosphere. Lignin might
have contributed into make the reaction intensity more severe.
Figure 65 below shows failure behavior of briquettes specimens with 2% introduced
lignin as rapid cement substitute and with 2 different water content after 7 days of curing.
It appears that regardless of the introduced water content, complete disintegration of
briquettes take place upon failure.
Figure 65 Failure behavior in briquettes specimen with 2% introduced lignin as binder substitute with different water
content
Briquettes drop tests
The outcome of drop test is demonstrated in Figure 66 below for two briquettes, basic
recipe and recipe with 8% introduced sludge after 2 and 7 days of curing. The results are
based on the average result for testing 3 briquettes of each recipe.

119
Figure 66 Drop test for briquettes with two different recipes
It can be seen that both recipes were able to survive 50 drops after 7 days curing.
However, basic recipe was only able to survive less than 40 drops after 2 days curing. On
the other hand, the briquettes with 8% introduced sludge, were able to survive 50 drops.
mass loss of briquettes cured for 2 days during the drop test is demonstrated in Figure 67
below. In average, the briquettes with 8% introduced sluge survived 50 drops while losing
around 22% of their original mass. Basic recipe briquettes exhibited higher mass loss
during the test with more than 35% mass loss after 30 drops.
Figure 67 Briquettes weight loss during 2 days-drop test

120
The results of drop tests after 2 days of curing shows that introduction of sludge has
noticeably improved drop damage resistance compared to basic recipe. The reason is
likely to be due to increased compaction with the fine particle size of sludge filling up the
voids in the briquettes and leading to increased number of contact points that contribute
to the briquette strength (El-Hussiny and Shalabi, 2011; Pietsch, 2005; Su et al., 2004).
Drop test results which are found in appendix #4 reveal that out of the three tested basic
recipe briquettes (at 2 days curing), only one briquette survived 50 drops while the other
two tested briquettes survived only 33 and 35 drops. It can be noticed that both recipe
briquettes exhibit sharp increase in mass loss after going through 20 drops with the mass
loss of basic briquette recipe being more severe.
The enhanced drop damage resitance for briquettes utilizing sludge may make it possible
to use the produced briquettes as part of the burden earlier than the basic recipe briquette.
It also means less fine generation inside the furnace and less loss of material upon
handling and transporting after the initial curing period of 2 days inside the humid
chambers.
Figure 68 Briquettes weight loss during 7 days-drop test
Figure 68 shows the mass loss exhibited by briquttes made from both recipes as a result
of dropping. Both btiquette recipes experience relatively low mass loss (under 7%) after

121
50 drops. However, basic recipe briquette experience less mass loss than that the briquette
with 8% introduced sludge.
Briquettes tumbling test
Results of tumbling test are shown in Table 22 where m0 is the mass of the three tested
briquettes before being tested, m1 being the mass of sieved portion + 6.30, m2 being the
mass of fraction – 6.30 mm + 500 µm.
Table 22 Tumbling test result
Briquette m0 (g) m1 (g) m2 (g) TI (%) AI (%)
Basic briquette 842.29 838.22 0.47 99.51679 0.427406
8% sludge recipe briquette 842.69 837.08 0.87 99.33427 0.562484
Figure 69 shows that there is no significant difference for the tumble and abrasion indices
between the two recipes. Basic briquette appears to have slightly higher tumble index
than the briquette with 8% introduced sludge and also appears to have slightly lower
abrasion index. This is likely due to the increased fine particle fraction in the briquette
recipe as a result of introduction of the sludge which has very fine size.

122
Figure 69 Tumble and abrasion indices for two briquette recipes

123
8 SUMMARY
The aims of this work are: (1) Characterization of by-products materials from SSAB
Raahe plant, Finland using different techniques; (2) study the influence of introducing BF
and BOF sludge to the briquette recipe on the mechanical properties of the briquette (3)
study the influence of partially replacing rapid cement with lignin which comes as a by-
product from a biofuel production plant. In this work, thirteen different by-products were
received from SSAB Europe Oy plant in Raahe in order to be utilized in a cold bonded
briquette.
Moisture content measurement, particle size distribution analysis, particle and bulk
density measurements were carried out for the by-products. Basic briquette recipe was
then determined based on the recipe currently employed at SSAB Europe Oy. EMMA
software was used to study the compaction on the basic recipe as well as other recipes
that utilize different shares of sludge and lignin. The compaction of the briquettes was
found to be adequate for all recipes.
Based on the characterization results, it was possible to determine zinc and alkali input to
BF when briquettes form 8% of the burden. It was found that due to the high zinc content
of sludge, zinc input would exceed limits necessary for smooth operation of the furnace.
Zinc concentration in sludge should be reduced by around 40%. Alkali concentrations
were found to be within safe operation limits.
Briquettes were produced based on different recipes utilizing BF and BOF sludge (with
a ratio of 1:1) as well as lignin. Mechanical properties of the produced briquettes were
tested through different mechanical tests such as cold compression test, drop test and
tumbler test. Tests were carried out after 2, 7 and 28 days curing of briquettes. Briquette
produced from basic recipe (currently employed at SSAB Europe Oy) acted as reference
briquette. The influence of changing briquetting force was preliminary studied using basic
recipe briquette. Doubling the briquetting force negatively influenced the briquette
strength, likely due to the breakage of bigger and more brittle particles due to the
increased force.

124
Increasing the sludge input to the briquette recipe by up to 8% still yielded briquettes with
adequate compression strength. The strength was almost the same compared to the
reference briquette after 2 and 7 days of curing, while it was noticeably less than the
reference briquette when tested after 28 days of curing. This was likely due to the finer
particles of the sludge contributing to the compaction of the briquette and achieving better
strength as a result during the initial phase of the curing. The lower strength after 28 days
of curing was likely due to the fact that introducing sludge to the briquette recipe meant
lower amount of cement that affected the briquette strength after the extended curing
period. Also for the same reason, introducing 8% sludge to the recipe appeared to
significantly improve drop damage resistance after 2 days of curing compared to the basic
recipe. Almost no change in drop damage resistance was noticed between the two
briquette recipes after 7 days of curing. Tumbler test results showed no significant
difference between basic recipe briquette and 8% introduced sludge briquette with the
basic briquette having slightly better abrasion and tumbler indices.
Introduction of lignin as rapid cement replacement resulted in catastrophic decrease in
strength. Hydration reactions did not seem to take place as no strength development was
noticed after 2 days curing period. Replacing 2% or more of the rapid cement with lignin
resulted in even lower compression strength after 7 and 28 days of curing compared to
compression strength after 2 days of curing. This is likely due to lignin interfering in the
hydration reaction, preventing the formation of C-S-H.
125
9 REFERENCES
About used lignin, 2018.AccuPyc II 1340 | Micromeritics [WWW Document], n.d. URL
http://www.micromeritics.com/Product-Showcase/AccuPyc-II-1340.aspx(accessed 1.17.18).
Ahmed, H.M., Viswanathan, N., Bjorkman, B., 2014. Composite Pellets - A PotentialRaw Material for Iron-Making. Steel Res. Int. 85, 293–306.https://doi.org/10.1002/srin.201300072
Andersson, A., Ahmed, H., Rosenkranz, J., Samuelsson, C., Björkman, B., 2017.Characterization and Upgrading of a Low Zinc-Containing and Fine Blast FurnaceSludge – A Multi-Objective Analysis. ISIJ Int. 57, 262–271.https://doi.org/10.2355/isijinternational.ISIJINT-2016-512
Asadi Zeydabadi, B., Mowla, D., Shariat, M.H., Fathi Kalajahi, J., 1997. Zinc recoveryfrom blast furnace flue dust. Hydrometallurgy 47, 113–125.https://doi.org/10.1016/S0304-386X(97)00039-X
Besta, P., SAMOLEJOVÁ, A., LENORT, R., JANOVSKÁ, K., KUTÁČ, J.,SIKOROVÁ, A., 2014. ALKALINE CARBONATES IN BLAST FURNACEPROCESS. Metalurgija 53, 549–552.
Bizhanov, A., Kurunov, I., Dalmia, Y., Mishra, B., Mishra, S., 2015. Blast FurnaceOperation with 100% Extruded Briquettes Charge. ISIJ Int. 55, 175–182.https://doi.org/10.2355/isijinternational.55.175
Bölükbaşı, ö. S., Tufan, B., 2014. Steelmaking slag beneficiation by magnetic separatorand impacts on sinter quality. Sci. Sinter. 46, 331–344.https://doi.org/10.2298/SOS1403331B
British Standards Institution, 2014. Determination of density by volumetric displacement.Skeleton density by gas pycnometry (BS ISO 12154-2014) (Standard). BSI,London.
British Standards Institution, 2008. Iron ore pellets for blast furnace and direct reductionfeedstocks — Determination of the crushing strength (BS ISO 4700:2007)(Standard).
British Standards Institution, 2007a. Iron ores for blast furnace and direct reductionfeedstocks. Determination of the tumble and abrasion indices. (BS ISO 3271-2007*) (Standard).
British Standards Institution, 2007b. Iron ores for blast furnace feedstocks. Determinationof the reducibility by the rate of reduction index-- (BS ISO 4695-2007) (Standard).
British Standards Institution, 1999. Tests for general properties of aggregates. Part 2 (BSEN 932-2:1999) (Standard). BSI, London.
British Standards Institution, 1998. Tests for mechanical and physical properties ofaggregates. Part 3: Determination of loose bulk density and voids (BS EN1097 :1998). British Standards Institution (BSI), London.
British Standards Institution, 1986. Methods for determination of particle sizedistribution. Part 1 (BS 3406-1:1986). BSI, Place of publication not identified.
British Standards Institution (BSI), 2008. Tests for mechanical and physical properties ofaggregates. Part 5: Determination of the water content by drying in a ventilatedoven. (BS EN 1097-5:2008) (Standard). BSI, London.
Bumiller, M., 2012. Sampling for Particle Size Analysis.

126
Calvo-Flores, F.G., Dobado Jiménez, J.A., Garcia, J.I., Martín-Martínez, F.J., 2015.Lignin and lignans as renewable raw materials: chemistry, technology andapplications, Wiley series in renewable resources. John Wiley and Sons, Inc,Chichester, West Sussex, United Kingdom.
Cavaliere, P., 2016. Ironmaking and Steelmaking Processes Greenhouse Emissions,Control, and Reduction. Springer, Cham.
Chu, M., Nogami, H., Yagi, J., 2004. Numerical analysis on charging carbon compositeagglomerates into blast furnace. ISIJ Int. 44, 510–517.
Cotana, F., Cavalaglio, G., Nicolini, A., Gelosia, M., Coccia, V., Petrozzi, A., Brinchi,L., 2014. Lignin as Co-product of Second Generation Bioethanol Production fromLigno-cellulosic Biomass. Energy Procedia 45, 52–60.https://doi.org/10.1016/j.egypro.2014.01.007
Dapkunas, S.J., Jillavenkatesa, A., Lum, L.H., 2001. Particle Size Characterization.NIST, Gaithersburg, MD.
Das, B., Prakash, S., Reddy, P.S.R., Misra, V.N., 2007. An overview of utilization of slagand sludge from steel industries. Resour. Conserv. Recycl. 50, 40–57.https://doi.org/10.1016/j.resconrec.2006.05.008
DIN 51067-1 [WWW Document], n.d. URLhttps://global.ihs.com/doc_detail.cfm?document_name=DIN%2051067-1&item_s_key=00099379 (accessed 12.26.17).
Drobíková, K., Plachá, D., Motyka, O., Gabor, R., Kutláková, K.M., Vallová, S.,Seidlerová, J., 2016. Recycling of blast furnace sludge by briquetting with starchbinder: Waste gas from thermal treatment utilizable as a fuel. Waste Manag. 48,471–477. https://doi.org/10.1016/j.wasman.2015.11.047
Dutta, S.K., Ghosh, A., 1994. Study of nonisothermal reduction of iron ore-coal/charcomposite pellet. Metall. Mater. Trans. B 25, 15–26.https://doi.org/10.1007/BF02663174
Electron microscopy sciences, n.d. EpofixTM Cold-Setting Embedding Resin TechnicalData Sheet [WWW Document]. URLhttps://www.emsdiasum.com/microscopy/technical/datasheet/1232.aspx(accessed 1.19.18).
El-Hussiny, N.A., Shalabi, M.E.H., 2011. A self-reduced intermediate product from ironand steel plants waste materials using a briquetting process. Powder Technol. 205,217–223.
Elkem Materials Mixture Analyser – EMMA, n.d.finnsementti, n.d. Finnsementti - Cements [WWW Document]. URL
http://www.finnsementti.fi/en/products/cements (accessed 2.26.18a).finnsementti, n.d. Finnsementti - Rapidsementti [WWW Document]. URL
http://www.finnsementti.fi/tuotteet/sementit/rapidsementti (accessed 2.27.18b).finnsementti, n.d. Finns cement - blast furnace powder KJ400 [WWW Document]. URL
http://www.finnsementti.fi/tuotteet/seosaineet-ja-silikajauheet/masuunikuonajauhe-kj400 (accessed 2.27.18c).
Fosnacht, D., 1985. CHARACTERIZATION AND UTILIZATION OF IRON-BEARING STEEL PLANT WASTE MATERIALS. Presented at the Physicalchemistry of extractive metallurgy conference, pp. 479–92.
Geerdes, M., Chaigneau, R., Kurunov, I., 2015. Modern Blast Furnace Ironmaking: AnIntroduction (Third Edition, 2015). IOS Press.
127
Halt, J.A., Kawatra, S.K., 2013. Review of organic binders for iron ore agglomeration.Miner. Metall. Process. 31, 73–94.
Han, Y., Tahmasebi, A., Yu, J., Li, X., Meesri, C., 2013. An Experimental Study onBinderless Briquetting of Low-Rank Coals. Chem. Eng. Technol. 36, 749–756.https://doi.org/10.1002/ceat.201300067
Hässler, B., 1974. Strength of iron-ore agglomerates during reduction. Int. J. Miner.Process. 1, 193–213.
Holappa, L., Taskinen, P., 2017. Process innovations and sustainability in Finnishmetallurgical industries. Miner. Process. Extr. Metall. 126, 70–80.https://doi.org/10.1080/03719553.2016.1259197
Hope Construction materials, n.d. Hope Rapid Cement: Technical Data Sheet [WWWDocument]. URLhttps://www.breedongroup.com/images/uploads/products/hope-Rapid-cement-datasheet-1114.pdf (accessed 1.18.18).
Horii, K., Tsutsumi, N., Kitano, Y., Kato, T., 2013. Processing and reusing technologiesfor steelmaking slag. Nippon Steel Tech. Rep. 104, 123–129.
Hosford, W.F., 2012. Iron and Steel. Cambridge University Press.Kasai, A., Matsui, Y., 2004. Lowering of Thermal Reserve Zone Temperature in Blast
Furnace by Adjoining Carbonaceous Material and Iron Ore. ISIJ Int. 44, 2073–2078. https://doi.org/10.2355/isijinternational.44.2073
Kelebek, S., Yörük, S., Davis, B., 2004. Characterization of basic oxygen furnace dustand zinc removal by acid leaching. Miner. Eng. 17, 285–291.https://doi.org/10.1016/j.mineng.2003.10.030
Koros, P.J., 2003. Dusts, scale, slags, sludges... not wastes, but sources of profits. Metall.Mater. Trans. B 34, 769–779.
Kumar, D.S., Sah, R., Sekhar, V.R., Vishwanath, S.C., 2017. Development and use ofmill scale briquettes in BOF. Ironmak. Steelmak. 44, 134–139.https://doi.org/10.1080/03019233.2016.1165499
Kuo, W.-T., Hou, T.-C., 2014. Engineering properties of alkali-activated binders by useof desulfurization slag and GGBFS. Constr. Build. Mater. 66, 229–234.https://doi.org/10.1016/j.conbuildmat.2014.05.056
Lagerblad, B., 2005. Carbon dioxide uptake during concrete life cycle: State of the art.Swedish Cement and Concrete Research Institute, Stockholm.
Lanzerstorfer, C., 2017. Characterization of dust from blast furnace cast house de-dusting.Environ. Technol. 38, 2440–2446.https://doi.org/10.1080/09593330.2016.1264487
Lea, F.M., Hewlett, P.C., 2008. Lea’s chemistry of cement and concrete. ElservierButterworth- Heinemann, Oxford; MA.
Legodi, M., Dewaal, D., 2007. The preparation of magnetite, goethite, hematite andmaghemite of pigment quality from mill scale iron waste. Dyes Pigments 74, 161–168. https://doi.org/10.1016/j.dyepig.2006.01.038
Lemos, L.R., da Rocha, S.H.F.S., de Castro, L.F.A., 2015. Reduction disintegrationmechanism of cold briquettes from blast furnace dust and sludge. J. Mater. Res.Technol. 4, 278–282. https://doi.org/10.1016/j.jmrt.2014.12.002
Lerssi, P., 2011. AN EFFECT OF ENVIRONMENTAL REGULATION ON RAAHESTEEL WORKS.
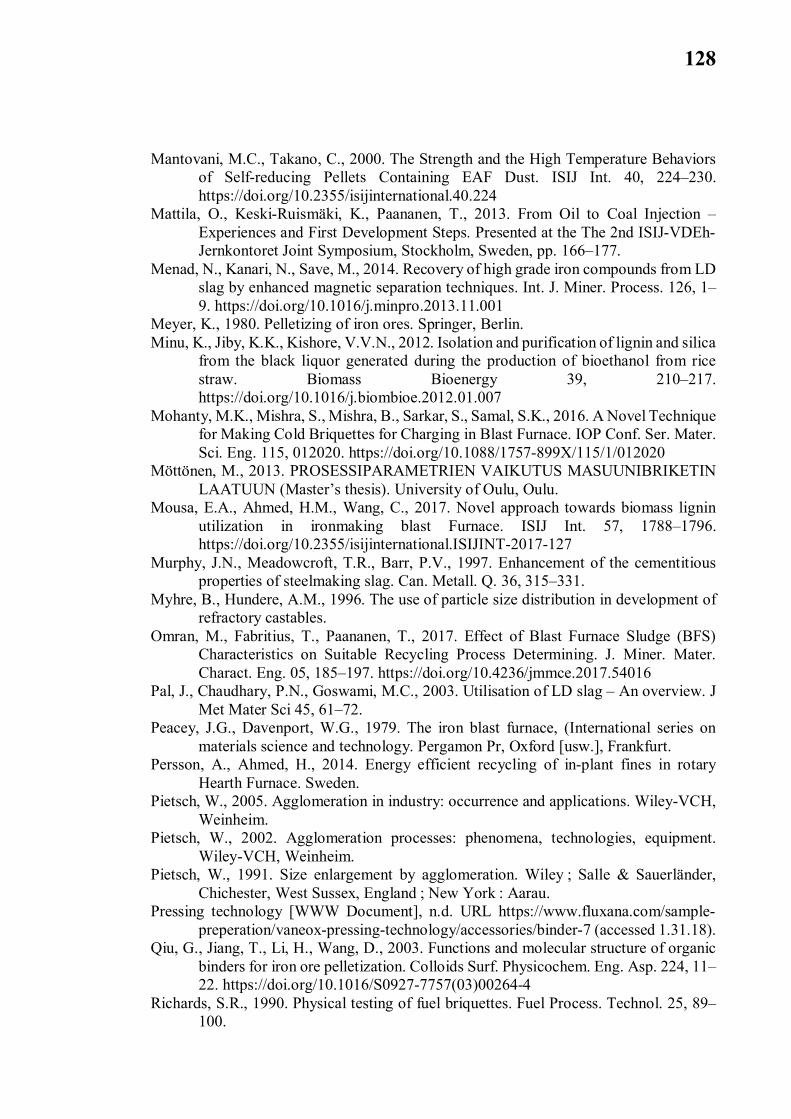
128
Mantovani, M.C., Takano, C., 2000. The Strength and the High Temperature Behaviorsof Self-reducing Pellets Containing EAF Dust. ISIJ Int. 40, 224–230.https://doi.org/10.2355/isijinternational.40.224
Mattila, O., Keski-Ruismäki, K., Paananen, T., 2013. From Oil to Coal Injection –Experiences and First Development Steps. Presented at the The 2nd ISIJ-VDEh-Jernkontoret Joint Symposium, Stockholm, Sweden, pp. 166–177.
Menad, N., Kanari, N., Save, M., 2014. Recovery of high grade iron compounds from LDslag by enhanced magnetic separation techniques. Int. J. Miner. Process. 126, 1–9. https://doi.org/10.1016/j.minpro.2013.11.001
Meyer, K., 1980. Pelletizing of iron ores. Springer, Berlin.Minu, K., Jiby, K.K., Kishore, V.V.N., 2012. Isolation and purification of lignin and silica
from the black liquor generated during the production of bioethanol from ricestraw. Biomass Bioenergy 39, 210–217.https://doi.org/10.1016/j.biombioe.2012.01.007
Mohanty, M.K., Mishra, S., Mishra, B., Sarkar, S., Samal, S.K., 2016. A Novel Techniquefor Making Cold Briquettes for Charging in Blast Furnace. IOP Conf. Ser. Mater.Sci. Eng. 115, 012020. https://doi.org/10.1088/1757-899X/115/1/012020
Möttönen, M., 2013. PROSESSIPARAMETRIEN VAIKUTUS MASUUNIBRIKETINLAATUUN (Master’s thesis). University of Oulu, Oulu.
Mousa, E.A., Ahmed, H.M., Wang, C., 2017. Novel approach towards biomass ligninutilization in ironmaking blast Furnace. ISIJ Int. 57, 1788–1796.https://doi.org/10.2355/isijinternational.ISIJINT-2017-127
Murphy, J.N., Meadowcroft, T.R., Barr, P.V., 1997. Enhancement of the cementitiousproperties of steelmaking slag. Can. Metall. Q. 36, 315–331.
Myhre, B., Hundere, A.M., 1996. The use of particle size distribution in development ofrefractory castables.
Omran, M., Fabritius, T., Paananen, T., 2017. Effect of Blast Furnace Sludge (BFS)Characteristics on Suitable Recycling Process Determining. J. Miner. Mater.Charact. Eng. 05, 185–197. https://doi.org/10.4236/jmmce.2017.54016
Pal, J., Chaudhary, P.N., Goswami, M.C., 2003. Utilisation of LD slag – An overview. JMet Mater Sci 45, 61–72.
Peacey, J.G., Davenport, W.G., 1979. The iron blast furnace, (International series onmaterials science and technology. Pergamon Pr, Oxford [usw.], Frankfurt.
Persson, A., Ahmed, H., 2014. Energy efficient recycling of in-plant fines in rotaryHearth Furnace. Sweden.
Pietsch, W., 2005. Agglomeration in industry: occurrence and applications. Wiley-VCH,Weinheim.
Pietsch, W., 2002. Agglomeration processes: phenomena, technologies, equipment.Wiley-VCH, Weinheim.
Pietsch, W., 1991. Size enlargement by agglomeration. Wiley ; Salle & Sauerländer,Chichester, West Sussex, England ; New York : Aarau.
Pressing technology [WWW Document], n.d. URL https://www.fluxana.com/sample-preperation/vaneox-pressing-technology/accessories/binder-7 (accessed 1.31.18).
Qiu, G., Jiang, T., Li, H., Wang, D., 2003. Functions and molecular structure of organicbinders for iron ore pelletization. Colloids Surf. Physicochem. Eng. Asp. 224, 11–22. https://doi.org/10.1016/S0927-7757(03)00264-4
Richards, S.R., 1990. Physical testing of fuel briquettes. Fuel Process. Technol. 25, 89–100.

129
Robinson, R., 2008. Studies in low temperature self-reduction of by-products fromintegrated iron and steelmaking. DIVA.
Robinson, R., Ökvist, L.S., 2003. Recycling of by-product pellets as burden in the blastfurnace process: a lab and pilot scale investigation.
Sah, R., Dutta, S.K., 2010. Effects of Binder on the Properties of Iron Ore-CoalComposite Pellets. Miner. Process. Extr. Metall. Rev. 31, 73–85.https://doi.org/10.1080/08827500903404732
Sarkar, R., 2016. Particle size distribution for refractory castables: a review.Singh, A.K.P., Raju, M.T., Jha, U., 2011. Recycling of Basic Oxygen Furnace (BOF)
sludge in iron and steel works. Int. J. Environ. Technol. Manag. 14, 19–32.Singh, M., 2001. Studies on the cold bonded briquettes of iron and steel plant by-products
as burden material for blast furnaces. DIVA.Singh, M., Bjorkman, B., 2006. Strength of cement-bonded briquettes. Miner. Metall.
Process. 23, 203–213.Singh, M., Björkman, B., 1999. Cold bond agglomerates of iron and steel plant
byproducts as burden material for blast furnaces.Slotwinski, J.A., Garboczi, E.J., Stutzman, P.E., Ferraris, C.F., Watson, S.S., Peltz, M.A.,
2014. Characterization of Metal Powders Used for Additive Manufacturing. J.Res. Natl. Inst. Stand. Technol. 119, 460. https://doi.org/10.6028/jres.119.018
Song, Q., 2013. Effect of nut coke on the performance of the ironmaking blast furnace.s.n., S.l.
Su, F., Lampinen, H.-O., Robinson, R., 2004. Recycling of Sludge and Dust to the BOFConverter by Cold Bonded Pelletizing. ISIJ Int. 44, 770–776.https://doi.org/10.2355/isijinternational.44.770
Sundqvist Ökvist, L., Jonsson, K., Lampinen, H., Eriksson, L., 1999. Recycling of In-Plant Fines as Cold-Bonded Agglomerates. Brussels, Belgium.
Taylor, H.F.W., 1997. Cement chemistry, 2nd ed. ed. T. Telford, London.Van Herck, P., Vandecasteele, C., Swennen, R., Mortier, R., 2000. Zinc and Lead
Removal from Blast Furnace Sludge with a Hydrometallurgical Process. Environ.Sci. Technol. 34, 3802–3808. https://doi.org/10.1021/es991033l
Vereš, J., Lovás, M., Jakabský, Š., Šepelák, V., Hredzák, S., 2012. Characterization ofblast furnace sludge and removal of zinc by microwave assisted extraction.Hydrometallurgy 129–130, 67–73.https://doi.org/10.1016/j.hydromet.2012.09.008
Worldsteel association, 2017. WORLD STEEL IN FIGURES 2017.Zamalloa, M., Utigard, T.A., 1995. Characterization of Industrial Coke Structures. ISIJ
Int. 35, 449–457. https://doi.org/10.2355/isijinternational.35.449Zhu, J.Y., Pan, X., Zalesny, R.S., 2010. Pretreatment of woody biomass for biofuel
production: energy efficiency, technologies, and recalcitrance. Appl. Microbiol.Biotechnol. 87, 847–857. https://doi.org/10.1007/s00253-010-2654-8

Appendix #1 Chemical composition of by-products and
briquettes
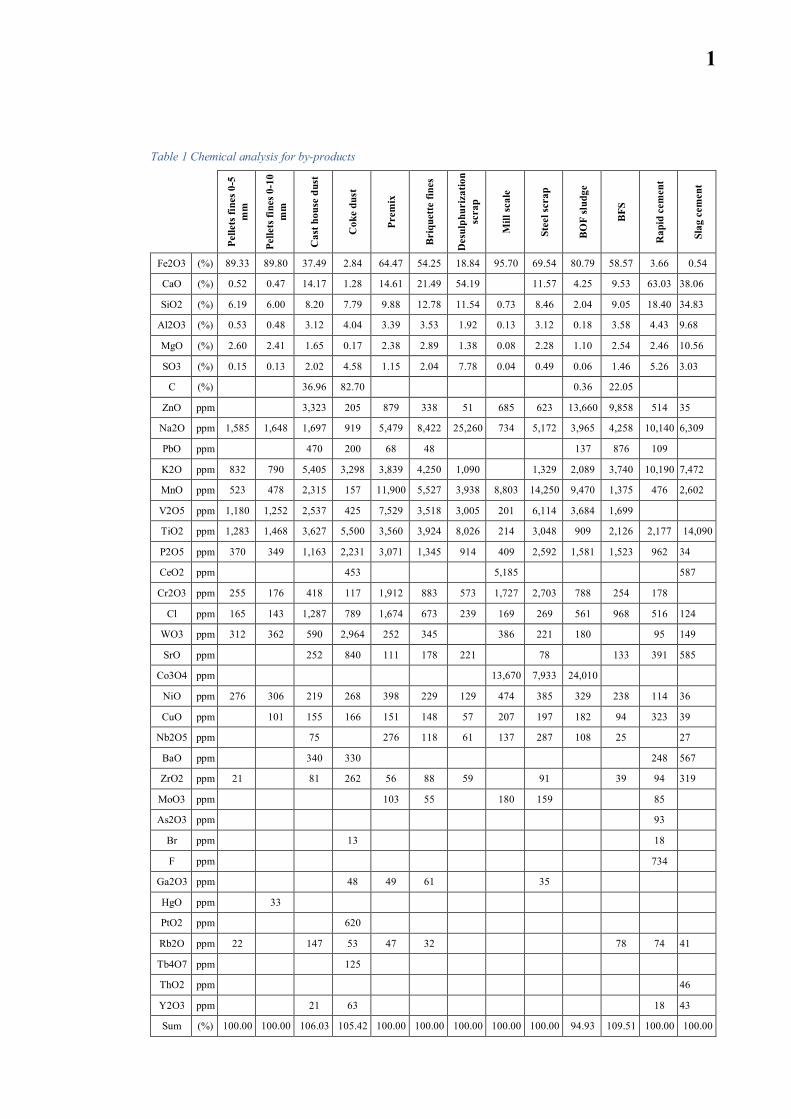
1
Table 1 Chemical analysis for by-products
Pelle
tsfin
es0-
5m
m
Pelle
tsfin
es0-
10m
m
Cas
thou
sedu
st
Cok
edu
st
Prem
ix
Bri
quet
tefin
es
Des
ulph
uriz
atio
nsc
rap
Mill
scal
e
Stee
lscr
ap
BO
Fsl
udge
BFS
Rap
idce
men
t
Slag
cem
ent
Fe2O3 (%) 89.33 89.80 37.49 2.84 64.47 54.25 18.84 95.70 69.54 80.79 58.57 3.66 0.54
CaO (%) 0.52 0.47 14.17 1.28 14.61 21.49 54.19 11.57 4.25 9.53 63.03 38.06
SiO2 (%) 6.19 6.00 8.20 7.79 9.88 12.78 11.54 0.73 8.46 2.04 9.05 18.40 34.83
Al2O3 (%) 0.53 0.48 3.12 4.04 3.39 3.53 1.92 0.13 3.12 0.18 3.58 4.43 9.68
MgO (%) 2.60 2.41 1.65 0.17 2.38 2.89 1.38 0.08 2.28 1.10 2.54 2.46 10.56
SO3 (%) 0.15 0.13 2.02 4.58 1.15 2.04 7.78 0.04 0.49 0.06 1.46 5.26 3.03
C (%) 36.96 82.70 0.36 22.05
ZnO ppm 3,323 205 879 338 51 685 623 13,660 9,858 514 35
Na2O ppm 1,585 1,648 1,697 919 5,479 8,422 25,260 734 5,172 3,965 4,258 10,140 6,309
PbO ppm 470 200 68 48 137 876 109
K2O ppm 832 790 5,405 3,298 3,839 4,250 1,090 1,329 2,089 3,740 10,190 7,472
MnO ppm 523 478 2,315 157 11,900 5,527 3,938 8,803 14,250 9,470 1,375 476 2,602
V2O5 ppm 1,180 1,252 2,537 425 7,529 3,518 3,005 201 6,114 3,684 1,699
TiO2 ppm 1,283 1,468 3,627 5,500 3,560 3,924 8,026 214 3,048 909 2,126 2,177 14,090
P2O5 ppm 370 349 1,163 2,231 3,071 1,345 914 409 2,592 1,581 1,523 962 34
CeO2 ppm 453 5,185 587
Cr2O3 ppm 255 176 418 117 1,912 883 573 1,727 2,703 788 254 178
Cl ppm 165 143 1,287 789 1,674 673 239 169 269 561 968 516 124
WO3 ppm 312 362 590 2,964 252 345 386 221 180 95 149
SrO ppm 252 840 111 178 221 78 133 391 585
Co3O4 ppm 13,670 7,933 24,010
NiO ppm 276 306 219 268 398 229 129 474 385 329 238 114 36
CuO ppm 101 155 166 151 148 57 207 197 182 94 323 39
Nb2O5 ppm 75 276 118 61 137 287 108 25 27
BaO ppm 340 330 248 567
ZrO2 ppm 21 81 262 56 88 59 91 39 94 319
MoO3 ppm 103 55 180 159 85
As2O3 ppm 93
Br ppm 13 18
F ppm 734
Ga2O3 ppm 48 49 61 35
HgO ppm 33
PtO2 ppm 620
Rb2O ppm 22 147 53 47 32 78 74 41
Tb4O7 ppm 125
ThO2 ppm 46
Y2O3 ppm 21 63 18 43
Sum (%) 100.00 100.00 106.03 105.42 100.00 100.00 100.00 100.00 100.00 94.93 109.51 100.00 100.00
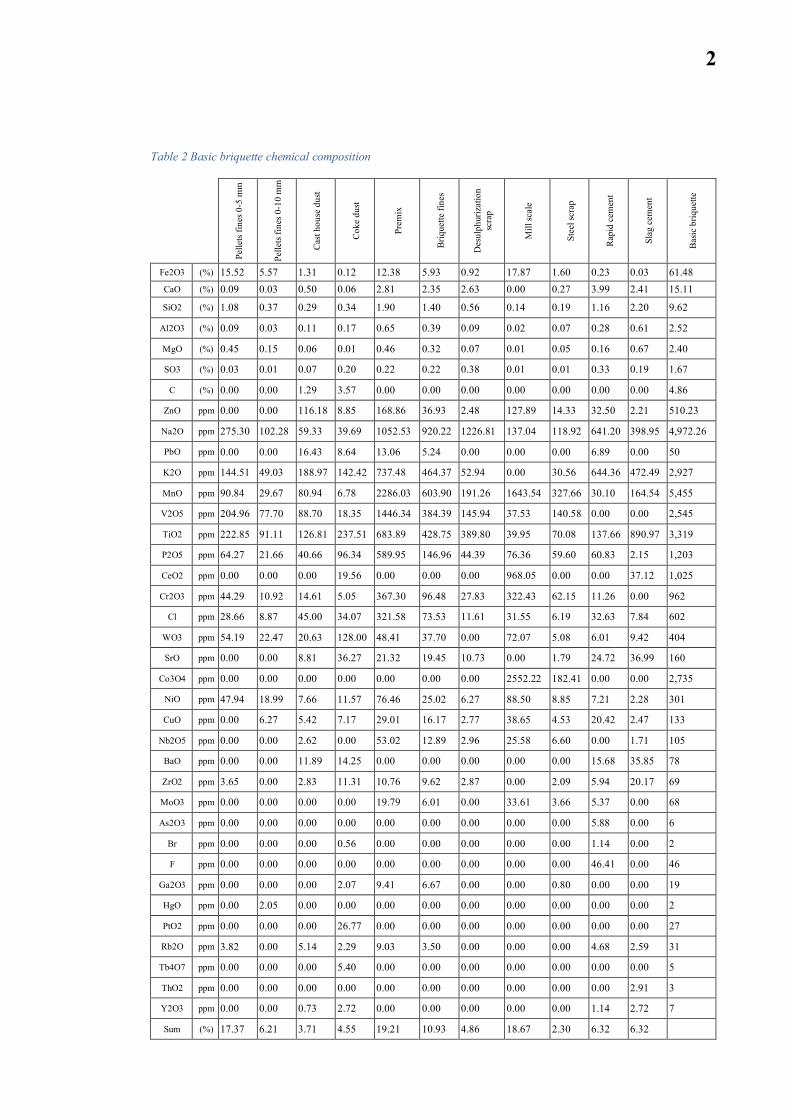
2
Table 2 Basic briquette chemical composition
Pelle
tsfin
es0-
5m
m
Pelle
tsfin
es0-
10m
m
Cast
hous
edu
st
Coke
dust
Prem
ix
Briq
uette
fines
Des
ulph
uriz
atio
nsc
rap
Mill
scal
e
Stee
lscr
ap
Rapi
dce
men
t
Slag
cem
ent
Basic
briq
uette
Fe2O3 (%) 15.52 5.57 1.31 0.12 12.38 5.93 0.92 17.87 1.60 0.23 0.03 61.48CaO (%) 0.09 0.03 0.50 0.06 2.81 2.35 2.63 0.00 0.27 3.99 2.41 15.11
SiO2 (%) 1.08 0.37 0.29 0.34 1.90 1.40 0.56 0.14 0.19 1.16 2.20 9.62
Al2O3 (%) 0.09 0.03 0.11 0.17 0.65 0.39 0.09 0.02 0.07 0.28 0.61 2.52
MgO (%) 0.45 0.15 0.06 0.01 0.46 0.32 0.07 0.01 0.05 0.16 0.67 2.40
SO3 (%) 0.03 0.01 0.07 0.20 0.22 0.22 0.38 0.01 0.01 0.33 0.19 1.67
C (%) 0.00 0.00 1.29 3.57 0.00 0.00 0.00 0.00 0.00 0.00 0.00 4.86
ZnO ppm 0.00 0.00 116.18 8.85 168.86 36.93 2.48 127.89 14.33 32.50 2.21 510.23
Na2O ppm 275.30 102.28 59.33 39.69 1052.53 920.22 1226.81 137.04 118.92 641.20 398.95 4,972.26
PbO ppm 0.00 0.00 16.43 8.64 13.06 5.24 0.00 0.00 0.00 6.89 0.00 50
K2O ppm 144.51 49.03 188.97 142.42 737.48 464.37 52.94 0.00 30.56 644.36 472.49 2,927
MnO ppm 90.84 29.67 80.94 6.78 2286.03 603.90 191.26 1643.54 327.66 30.10 164.54 5,455
V2O5 ppm 204.96 77.70 88.70 18.35 1446.34 384.39 145.94 37.53 140.58 0.00 0.00 2,545
TiO2 ppm 222.85 91.11 126.81 237.51 683.89 428.75 389.80 39.95 70.08 137.66 890.97 3,319
P2O5 ppm 64.27 21.66 40.66 96.34 589.95 146.96 44.39 76.36 59.60 60.83 2.15 1,203
CeO2 ppm 0.00 0.00 0.00 19.56 0.00 0.00 0.00 968.05 0.00 0.00 37.12 1,025
Cr2O3 ppm 44.29 10.92 14.61 5.05 367.30 96.48 27.83 322.43 62.15 11.26 0.00 962
Cl ppm 28.66 8.87 45.00 34.07 321.58 73.53 11.61 31.55 6.19 32.63 7.84 602
WO3 ppm 54.19 22.47 20.63 128.00 48.41 37.70 0.00 72.07 5.08 6.01 9.42 404
SrO ppm 0.00 0.00 8.81 36.27 21.32 19.45 10.73 0.00 1.79 24.72 36.99 160
Co3O4 ppm 0.00 0.00 0.00 0.00 0.00 0.00 0.00 2552.22 182.41 0.00 0.00 2,735
NiO ppm 47.94 18.99 7.66 11.57 76.46 25.02 6.27 88.50 8.85 7.21 2.28 301
CuO ppm 0.00 6.27 5.42 7.17 29.01 16.17 2.77 38.65 4.53 20.42 2.47 133
Nb2O5 ppm 0.00 0.00 2.62 0.00 53.02 12.89 2.96 25.58 6.60 0.00 1.71 105
BaO ppm 0.00 0.00 11.89 14.25 0.00 0.00 0.00 0.00 0.00 15.68 35.85 78
ZrO2 ppm 3.65 0.00 2.83 11.31 10.76 9.62 2.87 0.00 2.09 5.94 20.17 69
MoO3 ppm 0.00 0.00 0.00 0.00 19.79 6.01 0.00 33.61 3.66 5.37 0.00 68
As2O3 ppm 0.00 0.00 0.00 0.00 0.00 0.00 0.00 0.00 0.00 5.88 0.00 6
Br ppm 0.00 0.00 0.00 0.56 0.00 0.00 0.00 0.00 0.00 1.14 0.00 2
F ppm 0.00 0.00 0.00 0.00 0.00 0.00 0.00 0.00 0.00 46.41 0.00 46
Ga2O3 ppm 0.00 0.00 0.00 2.07 9.41 6.67 0.00 0.00 0.80 0.00 0.00 19
HgO ppm 0.00 2.05 0.00 0.00 0.00 0.00 0.00 0.00 0.00 0.00 0.00 2
PtO2 ppm 0.00 0.00 0.00 26.77 0.00 0.00 0.00 0.00 0.00 0.00 0.00 27
Rb2O ppm 3.82 0.00 5.14 2.29 9.03 3.50 0.00 0.00 0.00 4.68 2.59 31
Tb4O7 ppm 0.00 0.00 0.00 5.40 0.00 0.00 0.00 0.00 0.00 0.00 0.00 5
ThO2 ppm 0.00 0.00 0.00 0.00 0.00 0.00 0.00 0.00 0.00 0.00 2.91 3
Y2O3 ppm 0.00 0.00 0.73 2.72 0.00 0.00 0.00 0.00 0.00 1.14 2.72 7
Sum (%) 17.37 6.21 3.71 4.55 19.21 10.93 4.86 18.67 2.30 6.32 6.32

3
Table 3 2% sludge briquette chemical composition
Pelle
tsfin
es0-
5m
m
Pelle
tsfin
es0-
10m
m
Cast
hous
edu
st
Coke
dust
Prem
ix
Briq
uette
fines
Des
ulph
uriz
atio
nsc
rap
Mill
scal
e
Stee
lscr
ap
BOF
sludg
e
BFS
Rapi
dce
men
t
Slag
cem
ent
2%slu
dge
Fe2O3 (%) 15.21 5.46 1.29 0.12 12.14 5.81 0.90 17.52 1.57 0.79 0.57 0.23 0.03 61.64
CaO (%) 0.09 0.03 0.49 0.05 2.75 2.30 2.58 0.00 0.26 0.04 0.09 3.91 2.36 14.95
SiO2 (%) 1.05 0.37 0.28 0.33 1.86 1.37 0.55 0.13 0.19 0.02 0.09 1.14 2.16 9.54
Al2O3 (%) 0.09 0.03 0.11 0.17 0.64 0.38 0.09 0.02 0.07 0.00 0.04 0.27 0.60 2.51
MgO (%) 0.44 0.15 0.06 0.01 0.45 0.31 0.07 0.01 0.05 0.01 0.02 0.15 0.65 2.38
SO3 (%) 0.03 0.01 0.07 0.19 0.22 0.22 0.37 0.01 0.01 0.00 0.01 0.33 0.19 1.65
C (%) 0.00 0.00 1.27 3.50 0.00 0.00 0.00 0.00 0.00 0.00 0.22 0.00 0.00 4.99
ZnO ppm 0.00 0.00 113.90 8.68 165.55 36.21 2.43 125.38 14.04 133.92 96.65 31.87 2.17 730.80
Na2O ppm 269.91 100.27 58.17 38.91 1031.90 902.18 1202.75 134.35 116.59 38.87 41.75 628.62 391.12 4,955.39
PbO ppm 0.00 0.00 16.11 8.47 12.81 5.14 0.00 0.00 0.00 1.34 8.59 6.76 0.00 59
K2O ppm 141.68 48.07 185.27 139.63 723.02 455.27 51.90 0.00 29.96 20.48 36.67 631.72 463.22 2,927
MnO ppm 89.06 29.08 79.35 6.65 2241.20 592.06 187.51 1611.31 321.23 92.84 13.48 29.51 161.31 5,455
V2O5 ppm 200.94 76.18 86.96 17.99 1417.99 376.85 143.08 36.79 137.83 36.12 16.66 0.00 0.00 2,547
TiO2 ppm 218.48 89.32 124.32 232.86 670.48 420.34 382.16 39.17 68.71 8.91 20.84 134.96 873.50 3,284
P2O5 ppm 63.01 21.23 39.86 94.46 578.38 144.08 43.52 74.86 58.43 15.50 14.93 59.64 2.11 1,210
CeO2 ppm 0.00 0.00 0.00 19.18 0.00 0.00 0.00 949.07 0.00 0.00 0.00 0.00 36.39 1,005
Cr2O3 ppm 43.42 10.71 14.33 4.95 360.10 94.59 27.28 316.11 60.93 7.73 2.49 11.04 0.00 954
Cl ppm 28.10 8.70 44.11 33.40 315.28 72.09 11.38 30.93 6.06 5.50 9.49 31.99 7.69 605
WO3 ppm 53.13 22.03 20.22 125.49 47.46 36.96 0.00 70.65 4.98 1.76 0.00 5.89 9.24 398
SrO ppm 0.00 0.00 8.64 35.56 20.91 19.07 10.52 0.00 1.76 0.00 1.30 24.24 36.27 158
Co3O4 ppm 0.00 0.00 0.00 0.00 0.00 0.00 0.00 2502.17 178.83 235.39 0.00 0.00 0.00 2,916
NiO ppm 47.00 18.62 7.51 11.35 74.96 24.53 6.14 86.76 8.68 3.23 2.33 7.07 2.23 300
CuO ppm 0.00 6.15 5.31 7.03 28.44 15.85 2.71 37.89 4.44 1.78 0.92 20.02 2.42 133
Nb2O5 ppm 0.00 0.00 2.57 0.00 51.98 12.64 2.90 25.08 6.47 1.06 0.25 0.00 1.67 105
BaO ppm 0.00 0.00 11.65 13.97 0.00 0.00 0.00 0.00 0.00 0.00 0.00 15.37 35.15 76
ZrO2 ppm 3.58 0.00 2.78 11.09 10.55 9.43 2.81 0.00 2.05 0.00 0.38 5.83 19.78 68
MoO3 ppm 0.00 0.00 0.00 0.00 19.40 5.89 0.00 32.95 3.58 0.00 0.00 5.27 0.00 67
As2O3 ppm 0.00 0.00 0.00 0.00 0.00 0.00 0.00 0.00 0.00 0.00 0.00 5.77 0.00 6
Br ppm 0.00 0.00 0.00 0.55 0.00 0.00 0.00 0.00 0.00 0.00 0.00 1.12 0.00 2
F ppm 0.00 0.00 0.00 0.00 0.00 0.00 0.00 0.00 0.00 0.00 0.00 45.50 0.00 46
Ga2O3 ppm 0.00 0.00 0.00 2.03 9.23 6.53 0.00 0.00 0.79 0.00 0.00 0.00 0.00 19
HgO ppm 0.00 2.01 0.00 0.00 0.00 0.00 0.00 0.00 0.00 0.00 0.00 0.00 0.00 2
PtO2 ppm 0.00 0.00 0.00 26.25 0.00 0.00 0.00 0.00 0.00 0.00 0.00 0.00 0.00 26
Rb2O ppm 3.75 0.00 5.04 2.24 8.85 3.43 0.00 0.00 0.00 0.00 0.76 4.59 2.54 31
Tb4O7 ppm 0.00 0.00 0.00 5.29 0.00 0.00 0.00 0.00 0.00 0.00 0.00 0.00 0.00 5
ThO2 ppm 0.00 0.00 0.00 0.00 0.00 0.00 0.00 0.00 0.00 0.00 0.00 0.00 2.85 3
Y2O3 ppm 0.00 0.00 0.72 2.67 0.00 0.00 0.00 0.00 0.00 0.00 0.00 1.12 2.67 7
Sum (%) 17.03 6.08 3.63 4.46 18.83 10.71 4.76 18.30 2.25 0.93 1.07 6.20 6.20

4
Table 4 4% sludge briquette chemical composition
Pelle
tsfin
es0-
5m
m
Pelle
tsfin
es0-
10m
m
Cast
hous
edu
st
Coke
dust
Prem
ix
Briq
uett
efin
es
Desu
lphu
rizat
ion
scra
p
Mill
scal
e
Stee
lscr
ap
BOF
sludg
e
BFS
Rapi
dce
men
t
Slag
cem
ent
4%slu
dge
Fe2O3 (%) 14.92 5.36 1.26 0.12 11.91 5.70 0.88 17.18 1.54 1.55 1.13 0.22 0.03 61.80
CaO (%) 0.09 0.03 0.48 0.05 2.70 2.26 2.53 0.00 0.26 0.08 0.18 3.83 2.31 14.80
SiO2 (%) 1.03 0.36 0.28 0.32 1.82 1.34 0.54 0.13 0.19 0.04 0.17 1.12 2.12 9.47
Al2O3 (%) 0.09 0.03 0.10 0.17 0.63 0.37 0.09 0.02 0.07 0.00 0.07 0.27 0.59 2.50
MgO (%) 0.43 0.14 0.06 0.01 0.44 0.30 0.06 0.01 0.05 0.02 0.05 0.15 0.64 2.37
SO3 (%) 0.02 0.01 0.07 0.19 0.21 0.21 0.36 0.01 0.01 0.00 0.03 0.32 0.18 1.63
C (%) 0.00 0.00 1.24 3.43 0.00 0.00 0.00 0.00 0.00 0.01 0.42 0.00 0.00 5.11
ZnO ppm 0.00 0.00 111.71 8.51 162.36 35.51 2.38 122.97 13.77 262.69 189.58 31.25 2.13 942.88
Na2O ppm 264.71 98.34 57.05 38.16 1012.05 884.83 1179.62 131.77 114.35 76.25 81.88 616.54 383.60 4,939.16
PbO ppm 0.00 0.00 15.80 8.30 12.56 5.04 0.00 0.00 0.00 2.63 16.85 6.63 0.00 68
K2O ppm 138.95 47.14 181.70 136.94 709.12 446.51 50.90 0.00 29.38 40.17 71.92 619.58 454.32 2,927
MnO ppm 87.35 28.52 77.83 6.52 2198.10 580.67 183.90 1580.32 315.06 182.12 26.44 28.94 158.21 5,454
V2O5 ppm 197.07 74.71 85.29 17.65 1390.72 369.61 140.33 36.08 135.18 70.85 32.67 0.00 0.00 2,550
TiO2 ppm 214.28 87.60 121.93 228.38 657.58 412.26 374.81 38.42 67.39 17.48 40.88 132.37 856.71 3,250
P2O5 ppm 61.79 20.83 39.10 92.64 567.26 141.31 42.68 73.42 57.31 30.40 29.29 58.49 2.07 1,217
CeO2 ppm 0.00 0.00 0.00 18.81 0.00 0.00 0.00 930.82 0.00 0.00 0.00 0.00 35.69 985
Cr2O3 ppm 42.59 10.50 14.05 4.86 353.17 92.77 26.76 310.03 59.76 15.15 4.88 10.82 0.00 945
Cl ppm 27.56 8.53 43.27 32.76 309.21 70.71 11.16 30.34 5.95 10.79 18.62 31.37 7.54 608
WO3 ppm 52.11 21.60 19.83 123.08 46.55 36.25 0.00 69.30 4.89 3.46 0.00 5.78 9.06 392
SrO ppm 0.00 0.00 8.47 34.88 20.50 18.70 10.32 0.00 1.72 0.00 2.56 23.77 35.57 157
Co3O4 ppm 0.00 0.00 0.00 0.00 0.00 0.00 0.00 2454.05 175.39 461.73 0.00 0.00 0.00 3,091
NiO ppm 46.10 18.26 7.36 11.13 73.52 24.06 6.02 85.09 8.51 6.33 4.58 6.93 2.19 300
CuO ppm 0.00 6.03 5.21 6.89 27.89 15.55 2.66 37.16 4.36 3.50 1.81 19.64 2.37 133
Nb2O5 ppm 0.00 0.00 2.52 0.00 50.98 12.40 2.85 24.59 6.35 2.08 0.48 0.00 1.64 104
BaO ppm 0.00 0.00 11.43 13.70 0.00 0.00 0.00 0.00 0.00 0.00 0.00 15.08 34.47 75
ZrO2 ppm 3.51 0.00 2.72 10.88 10.34 9.25 2.76 0.00 2.01 0.00 0.75 5.72 19.40 67
MoO3 ppm 0.00 0.00 0.00 0.00 19.03 5.78 0.00 32.31 3.52 0.00 0.00 5.17 0.00 66
As2O3 ppm 0.00 0.00 0.00 0.00 0.00 0.00 0.00 0.00 0.00 0.00 0.00 5.65 0.00 6
Br ppm 0.00 0.00 0.00 0.54 0.00 0.00 0.00 0.00 0.00 0.00 0.00 1.09 0.00 2
F ppm 0.00 0.00 0.00 0.00 0.00 0.00 0.00 0.00 0.00 0.00 0.00 44.63 0.00 45
Ga2O3 ppm 0.00 0.00 0.00 1.99 9.05 6.41 0.00 0.00 0.77 0.00 0.00 0.00 0.00 18
HgO ppm 0.00 1.97 0.00 0.00 0.00 0.00 0.00 0.00 0.00 0.00 0.00 0.00 0.00 2
PtO2 ppm 0.00 0.00 0.00 25.74 0.00 0.00 0.00 0.00 0.00 0.00 0.00 0.00 0.00 26
Rb2O ppm 3.67 0.00 4.94 2.20 8.68 3.36 0.00 0.00 0.00 0.00 1.50 4.50 2.49 31
Tb4O7 ppm 0.00 0.00 0.00 5.19 0.00 0.00 0.00 0.00 0.00 0.00 0.00 0.00 0.00 5
ThO2 ppm 0.00 0.00 0.00 0.00 0.00 0.00 0.00 0.00 0.00 0.00 0.00 0.00 2.80 3
Y2O3 ppm 0.00 0.00 0.71 2.62 0.00 0.00 0.00 0.00 0.00 0.00 0.00 1.09 2.61 7
Sum (%) 16.70 5.97 3.56 4.38 18.47 10.51 4.67 17.95 2.21 1.83 2.11 6.08 6.08

5
Table 5 6% sludge briquette chemical composition
Pelle
tsfin
es0-
5m
m
Pelle
tsfin
es0-
10m
m
Cast
hous
edu
st
Coke
dust
Prem
ix
Briq
uette
fines
Des
ulph
uriz
atio
nsc
rap
Mill
scal
e
Stee
lscr
ap
BOF
sludg
e
BFS
Rapi
dce
men
t
Slag
cem
ent
6%slu
dge
Fe2O3 (%) 14.64 5.26 1.24 0.12 11.68 5.59 0.86 16.86 1.51 2.29 1.66 0.22 0.03 61.95
CaO (%) 0.08 0.03 0.47 0.05 2.65 2.21 2.48 0.00 0.25 0.12 0.27 3.76 2.27 14.65
SiO2 (%) 1.01 0.35 0.27 0.32 1.79 1.32 0.53 0.13 0.18 0.06 0.26 1.10 2.08 9.39
Al2O3 (%) 0.09 0.03 0.10 0.16 0.61 0.36 0.09 0.02 0.07 0.00 0.10 0.26 0.58 2.49
MgO (%) 0.43 0.14 0.05 0.01 0.43 0.30 0.06 0.01 0.05 0.03 0.07 0.15 0.63 2.36
SO3 (%) 0.02 0.01 0.07 0.19 0.21 0.21 0.36 0.01 0.01 0.00 0.04 0.31 0.18 1.62
C (%) 0.00 0.00 1.22 3.37 0.00 0.00 0.00 0.00 0.00 0.01 0.62 0.00 0.00 5.22
ZnO ppm 0.00 0.00 109.60 8.35 159.30 34.84 2.34 120.65 13.51 386.60 279.00 30.66 2.09 1,146.95
Na2O ppm 259.72 96.49 55.97 37.44 992.96 868.13 1157.36 129.28 112.19 112.22 120.51 604.90 376.36 4,923.54
PbO ppm 0.00 0.00 15.50 8.15 12.32 4.95 0.00 0.00 0.00 3.88 24.79 6.50 0.00 76
K2O ppm 136.33 46.25 178.28 134.36 695.74 438.09 49.94 0.00 28.83 59.12 105.85 607.89 445.74 2,926
MnO ppm 85.70 27.99 76.36 6.40 2156.63 569.72 180.43 1550.51 309.11 268.02 38.92 28.40 155.22 5,453
V2O5 ppm 193.36 73.30 83.68 17.31 1364.48 362.63 137.68 35.40 132.63 104.26 48.08 0.00 0.00 2,553
TiO2 ppm 210.23 85.95 119.63 224.07 645.18 404.48 367.74 37.69 66.12 25.73 60.17 129.87 840.54 3,217
P2O5 ppm 60.63 20.43 38.36 90.89 556.56 138.64 41.88 72.04 56.23 44.75 43.10 57.39 2.03 1,223
CeO2 ppm 0.00 0.00 0.00 18.46 0.00 0.00 0.00 913.25 0.00 0.00 0.00 0.00 35.02 967
Cr2O3 ppm 41.78 10.30 13.79 4.77 346.51 91.02 26.25 304.18 58.63 22.30 7.19 10.62 0.00 937
Cl ppm 27.04 8.37 42.45 32.14 303.38 69.37 10.95 29.77 5.84 15.88 27.40 30.78 7.40 611
WO3 ppm 51.12 21.19 19.46 120.75 45.67 35.56 0.00 67.99 4.79 5.09 0.00 5.67 8.89 386
SrO ppm 0.00 0.00 8.31 34.22 20.12 18.35 10.13 0.00 1.69 0.00 3.76 23.33 34.90 155
Co3O4 ppm 0.00 0.00 0.00 0.00 0.00 0.00 0.00 2407.75 172.08 679.53 0.00 0.00 0.00 3,259
NiO ppm 45.23 17.92 7.22 10.92 72.13 23.61 5.91 83.49 8.35 9.31 6.74 6.80 2.15 300
CuO ppm 0.00 5.91 5.11 6.76 27.37 15.26 2.61 36.46 4.27 5.15 2.66 19.27 2.33 133
Nb2O5 ppm 0.00 0.00 2.47 0.00 50.02 12.16 2.79 24.13 6.23 3.06 0.71 0.00 1.61 103
BaO ppm 0.00 0.00 11.21 13.44 0.00 0.00 0.00 0.00 0.00 0.00 0.00 14.79 33.82 73
ZrO2 ppm 3.44 0.00 2.67 10.67 10.15 9.07 2.70 0.00 1.97 0.00 1.10 5.61 19.03 66
MoO3 ppm 0.00 0.00 0.00 0.00 18.67 5.67 0.00 31.70 3.45 0.00 0.00 5.07 0.00 65
As2O3 ppm 0.00 0.00 0.00 0.00 0.00 0.00 0.00 0.00 0.00 0.00 0.00 5.55 0.00 6
Br ppm 0.00 0.00 0.00 0.53 0.00 0.00 0.00 0.00 0.00 0.00 0.00 1.07 0.00 2
F ppm 0.00 0.00 0.00 0.00 0.00 0.00 0.00 0.00 0.00 0.00 0.00 43.79 0.00 44
Ga2O3 ppm 0.00 0.00 0.00 1.96 8.88 6.29 0.00 0.00 0.76 0.00 0.00 0.00 0.00 18
HgO ppm 0.00 1.93 0.00 0.00 0.00 0.00 0.00 0.00 0.00 0.00 0.00 0.00 0.00 2
PtO2 ppm 0.00 0.00 0.00 25.26 0.00 0.00 0.00 0.00 0.00 0.00 0.00 0.00 0.00 25
Rb2O ppm 3.60 0.00 4.85 2.16 8.52 3.30 0.00 0.00 0.00 0.00 2.21 4.41 2.45 31
Tb4O7 ppm 0.00 0.00 0.00 5.09 0.00 0.00 0.00 0.00 0.00 0.00 0.00 0.00 0.00 5
ThO2 ppm 0.00 0.00 0.00 0.00 0.00 0.00 0.00 0.00 0.00 0.00 0.00 0.00 2.74 3
Y2O3 ppm 0.00 0.00 0.69 2.57 0.00 0.00 0.00 0.00 0.00 0.00 0.00 1.07 2.57 7
Sum (%) 16.39 5.85 3.50 4.29 18.12 10.31 4.58 17.61 2.17 2.69 3.10 5.97 5.97

6
Table 6 8% sludge briquette chemical composition
Pelle
tsfin
es0-
5m
m
Pelle
tsfin
es0-
10m
m
Cast
hous
edu
st
Coke
dust
Prem
ix
Briq
uette
fines
Des
ulph
uriz
atio
nsc
rap
Mill
scal
e
Stee
lscr
ap
BOF
sludg
e
BFS
Rapi
dce
men
t
Slag
cem
ent
8%slu
dge
Fe2O3 (%) 14.37 5.16 1.21 0.11 11.47 5.49 0.85 16.54 1.48 2.99 2.17 0.21 0.03 62.09
CaO (%) 0.08 0.03 0.46 0.05 2.60 2.17 2.44 0.00 0.25 0.16 0.35 3.69 2.23 14.50
SiO2 (%) 1.00 0.34 0.27 0.31 1.76 1.29 0.52 0.13 0.18 0.08 0.34 1.08 2.04 9.32
Al2O3 (%) 0.09 0.03 0.10 0.16 0.60 0.36 0.09 0.02 0.07 0.01 0.13 0.26 0.57 2.47
MgO (%) 0.42 0.14 0.05 0.01 0.42 0.29 0.06 0.01 0.05 0.04 0.09 0.14 0.62 2.35
SO3 (%) 0.02 0.01 0.07 0.18 0.20 0.21 0.35 0.01 0.01 0.00 0.05 0.31 0.18 1.60
C (%) 0.00 0.00 1.20 3.31 0.00 0.00 0.00 0.00 0.00 0.01 0.82 0.00 0.00 5.33
ZnO ppm 0.00 0.00 107.57 8.20 156.35 34.20 2.29 118.42 13.26 505.93 365.11 30.09 2.05 1,343.47
Na2O ppm 254.91 94.70 54.94 36.75 974.57 852.06 1135.93 126.89 110.11 146.85 157.70 593.70 369.39 4,908.50
PbO ppm 0.00 0.00 15.22 8.00 12.10 4.86 0.00 0.00 0.00 5.07 32.44 6.38 0.00 84
K2O ppm 133.81 45.40 174.97 131.87 682.86 429.97 49.02 0.00 28.29 77.37 138.52 596.63 437.49 2,926
MnO ppm 84.11 27.47 74.94 6.28 2116.69 559.17 177.09 1521.79 303.39 350.74 50.93 27.87 152.35 5,453
V2O5 ppm 189.78 71.95 82.13 16.99 1339.21 355.92 135.13 34.75 130.17 136.44 62.93 0.00 0.00 2,555
TiO2 ppm 206.34 84.36 117.42 219.92 633.23 396.99 360.93 36.99 64.89 33.67 78.74 127.46 824.98 3,186
P2O5 ppm 59.51 20.06 37.65 89.21 546.25 136.07 41.10 70.70 55.18 58.56 56.41 56.33 1.99 1,229
CeO2 ppm 0.00 0.00 0.00 18.11 0.00 0.00 0.00 896.34 0.00 0.00 0.00 0.00 34.37 949
Cr2O3 ppm 41.01 10.11 13.53 4.68 340.09 89.33 25.77 298.55 57.55 29.19 9.41 10.42 0.00 930
Cl ppm 26.54 8.22 41.66 31.55 297.76 68.09 10.75 29.22 5.73 20.78 35.85 30.21 7.26 614
WO3 ppm 50.18 20.80 19.10 118.52 44.82 34.90 0.00 66.73 4.71 6.67 0.00 5.56 8.72 381
SrO ppm 0.00 0.00 8.16 33.59 19.74 18.01 9.94 0.00 1.66 0.00 4.93 22.89 34.25 153
Co3O4 ppm 0.00 0.00 0.00 0.00 0.00 0.00 0.00 2363.16 168.90 889.26 0.00 0.00 0.00 3,421
NiO ppm 44.39 17.58 7.09 10.72 70.79 23.17 5.80 81.94 8.20 12.19 8.81 6.67 2.11 299
CuO ppm 0.00 5.80 5.02 6.64 26.86 14.97 2.56 35.78 4.19 6.74 3.48 18.91 2.28 133
Nb2O5 ppm 0.00 0.00 2.43 0.00 49.09 11.94 2.74 23.68 6.11 4.00 0.93 0.00 1.58 103
BaO ppm 0.00 0.00 11.01 13.20 0.00 0.00 0.00 0.00 0.00 0.00 0.00 14.52 33.20 72
ZrO2 ppm 3.38 0.00 2.62 10.48 9.96 8.90 2.65 0.00 1.94 0.00 1.44 5.50 18.68 66
MoO3 ppm 0.00 0.00 0.00 0.00 18.32 5.56 0.00 31.12 3.39 0.00 0.00 4.98 0.00 63
As2O3 ppm 0.00 0.00 0.00 0.00 0.00 0.00 0.00 0.00 0.00 0.00 0.00 5.45 0.00 5
Br ppm 0.00 0.00 0.00 0.52 0.00 0.00 0.00 0.00 0.00 0.00 0.00 1.05 0.00 2
F ppm 0.00 0.00 0.00 0.00 0.00 0.00 0.00 0.00 0.00 0.00 0.00 42.98 0.00 43
Ga2O3 ppm 0.00 0.00 0.00 1.92 8.72 6.17 0.00 0.00 0.75 0.00 0.00 0.00 0.00 18
HgO ppm 0.00 1.90 0.00 0.00 0.00 0.00 0.00 0.00 0.00 0.00 0.00 0.00 0.00 2
PtO2 ppm 0.00 0.00 0.00 24.79 0.00 0.00 0.00 0.00 0.00 0.00 0.00 0.00 0.00 25
Rb2O ppm 3.54 0.00 4.76 2.12 8.36 3.24 0.00 0.00 0.00 0.00 2.89 4.33 2.40 32
Tb4O7 ppm 0.00 0.00 0.00 5.00 0.00 0.00 0.00 0.00 0.00 0.00 0.00 0.00 0.00 5
ThO2 ppm 0.00 0.00 0.00 0.00 0.00 0.00 0.00 0.00 0.00 0.00 0.00 0.00 2.69 3
Y2O3 ppm 0.00 0.00 0.68 2.52 0.00 0.00 0.00 0.00 0.00 0.00 0.00 1.05 2.52 7
Sum (%) 16.08 5.75 3.43 4.22 17.79 10.12 4.50 17.29 2.13 3.52 4.06 5.85 5.86

7
Table 7 1% lignin briquette chemical composition
Pelle
tsfin
es0-
5m
m
Pelle
tsfin
es0-
10m
m
Cast
hous
edu
st
Coke
dust
Prem
ix
Briq
uette
fines
Des
ulph
uriz
atio
nsc
rap
Mill
scal
e
Stee
lscr
ap
Rapi
dce
men
t
Slag
cem
ent
Lign
in
1%lig
nin
Fe2O3 (%) 15.52 5.57 1.31 0.12 12.38 5.93 0.92 17.87 1.60 0.19 0.03 0.00 61.45
CaO (%) 0.09 0.03 0.50 0.06 2.81 2.35 2.63 0.00 0.27 3.35 2.41 0.00 14.48
SiO2 (%) 1.08 0.37 0.29 0.34 1.90 1.40 0.56 0.14 0.19 0.98 2.20 0.00 9.44
Al2O3 (%) 0.09 0.03 0.11 0.17 0.65 0.39 0.09 0.02 0.07 0.24 0.61 0.00 2.48
MgO (%) 0.45 0.15 0.06 0.01 0.46 0.32 0.07 0.01 0.05 0.13 0.67 0.00 2.37
SO3 (%) 0.03 0.01 0.07 0.20 0.22 0.22 0.38 0.01 0.01 0.28 0.19 0.00 1.61
C (%) 0.00 0.00 1.29 3.57 0.00 0.00 0.00 0.00 0.00 0.00 0.00 0.61 5.48
ZnO ppm 0.00 0.00 116.18 8.85 168.86 36.93 2.48 127.89 14.33 27.34 2.21 0.00 505.07
Na2O ppm 275.30 102.28 59.33 39.69 1052.53 920.22 1226.81 137.04 118.92 539.45 398.95 0.00 4,870.51
PbO ppm 0.00 0.00 16.43 8.64 13.06 5.24 0.00 0.00 0.00 5.80 0.00 0.00 49
K2O ppm 144.51 49.03 188.97 142.42 737.48 464.37 52.94 0.00 30.56 542.11 472.49 0.00 2,825
MnO ppm 90.84 29.67 80.94 6.78 2286.03 603.90 191.26 1643.54 327.66 25.32 164.54 0.00 5,450
V2O5 ppm 204.96 77.70 88.70 18.35 1446.34 384.39 145.94 37.53 140.58 0.00 0.00 0.00 2,545
TiO2 ppm 222.85 91.11 126.81 237.51 683.89 428.75 389.80 39.95 70.08 115.82 890.97 0.00 3,298
P2O5 ppm 64.27 21.66 40.66 96.34 589.95 146.96 44.39 76.36 59.60 51.18 2.15 0.00 1,194
CeO2 ppm 0.00 0.00 0.00 19.56 0.00 0.00 0.00 968.05 0.00 0.00 37.12 0.00 1,025
Cr2O3 ppm 44.29 10.92 14.61 5.05 367.30 96.48 27.83 322.43 62.15 9.47 0.00 0.00 961
Cl ppm 28.66 8.87 45.00 34.07 321.58 73.53 11.61 31.55 6.19 27.45 7.84 0.00 596
WO3 ppm 54.19 22.47 20.63 128.00 48.41 37.70 0.00 72.07 5.08 5.05 9.42 0.00 403
SrO ppm 0.00 0.00 8.81 36.27 21.32 19.45 10.73 0.00 1.79 20.80 36.99 0.00 156
Co3O4 ppm 0.00 0.00 0.00 0.00 0.00 0.00 0.00 2552.22 182.41 0.00 0.00 0.00 2,735
NiO ppm 47.94 18.99 7.66 11.57 76.46 25.02 6.27 88.50 8.85 6.06 2.28 0.00 300
CuO ppm 0.00 6.27 5.42 7.17 29.01 16.17 2.77 38.65 4.53 17.18 2.47 0.00 130
Nb2O5 ppm 0.00 0.00 2.62 0.00 53.02 12.89 2.96 25.58 6.60 0.00 1.71 0.00 105
BaO ppm 0.00 0.00 11.89 14.25 0.00 0.00 0.00 0.00 0.00 13.19 35.85 0.00 75
ZrO2 ppm 3.65 0.00 2.83 11.31 10.76 9.62 2.87 0.00 2.09 5.00 20.17 0.00 68
MoO3 ppm 0.00 0.00 0.00 0.00 19.79 6.01 0.00 33.61 3.66 4.52 0.00 0.00 68
As2O3 ppm 0.00 0.00 0.00 0.00 0.00 0.00 0.00 0.00 0.00 4.95 0.00 0.00 5
Br ppm 0.00 0.00 0.00 0.56 0.00 0.00 0.00 0.00 0.00 0.96 0.00 0.00 2
F ppm 0.00 0.00 0.00 0.00 0.00 0.00 0.00 0.00 0.00 39.05 0.00 0.00 39
Ga2O3 ppm 0.00 0.00 0.00 2.07 9.41 6.67 0.00 0.00 0.80 0.00 0.00 0.00 19
HgO ppm 0.00 2.05 0.00 0.00 0.00 0.00 0.00 0.00 0.00 0.00 0.00 0.00 2
PtO2 ppm 0.00 0.00 0.00 26.77 0.00 0.00 0.00 0.00 0.00 0.00 0.00 0.00 27
Rb2O ppm 3.82 0.00 5.14 2.29 9.03 3.50 0.00 0.00 0.00 3.94 2.59 0.00 30
Tb4O7 ppm 0.00 0.00 0.00 5.40 0.00 0.00 0.00 0.00 0.00 0.00 0.00 0.00 5
ThO2 ppm 0.00 0.00 0.00 0.00 0.00 0.00 0.00 0.00 0.00 0.00 2.91 0.00 3
Y2O3 ppm 0.00 0.00 0.73 2.72 0.00 0.00 0.00 0.00 0.00 0.96 2.72 0.00 7
Sum (%) 17.37 6.21 3.71 4.55 19.21 10.93 4.86 18.67 2.30 5.32 6.32 0.61

8
Table 8 2% lignin briquette chemical composition
Pelle
tsfin
es0-
5m
m
Pelle
tsfin
es0-
10m
m
Cast
hous
edu
st
Coke
dust
Prem
ix
Briq
uette
fines
Des
ulph
uriz
atio
nsc
rap
Mill
scal
e
Stee
lscr
ap
Rapi
dce
men
t
Slag
cem
ent
Lign
in
2%lig
nin
Fe2O3 (%) 15.52 5.57 1.31 0.12 12.38 5.93 0.92 17.87 1.60 0.16 0.03 0.00 61.41
CaO (%) 0.09 0.03 0.50 0.06 2.81 2.35 2.63 0.00 0.27 2.72 2.41 0.00 13.85
SiO2 (%) 1.08 0.37 0.29 0.34 1.90 1.40 0.56 0.14 0.19 0.80 2.20 0.00 9.26
Al2O3 (%) 0.09 0.03 0.11 0.17 0.65 0.39 0.09 0.02 0.07 0.19 0.61 0.00 2.43
MgO (%) 0.45 0.15 0.06 0.01 0.46 0.32 0.07 0.01 0.05 0.11 0.67 0.00 2.35
SO3 (%) 0.03 0.01 0.07 0.20 0.22 0.22 0.38 0.01 0.01 0.23 0.19 0.00 1.56
C (%) 0.00 0.00 1.29 3.57 0.00 0.00 0.00 0.00 0.00 0.00 0.00 1.23 6.09
ZnO ppm 0.00 0.00 116.18 8.85 168.86 36.93 2.48 127.89 14.33 22.20 2.21 0.00 499.93
Na2O ppm 275.30 102.28 59.33 39.69 1052.53 920.22 1226.81 137.04 118.92 438.05 398.95 0.00 4,769.11
PbO ppm 0.00 0.00 16.43 8.64 13.06 5.24 0.00 0.00 0.00 4.71 0.00 0.00 48
K2O ppm 144.51 49.03 188.97 142.42 737.48 464.37 52.94 0.00 30.56 440.21 472.49 0.00 2,723
MnO ppm 90.84 29.67 80.94 6.78 2286.03 603.90 191.26 1643.54 327.66 20.56 164.54 0.00 5,446
V2O5 ppm 204.96 77.70 88.70 18.35 1446.34 384.39 145.94 37.53 140.58 0.00 0.00 0.00 2,545
TiO2 ppm 222.85 91.11 126.81 237.51 683.89 428.75 389.80 39.95 70.08 94.05 890.97 0.00 3,276
P2O5 ppm 64.27 21.66 40.66 96.34 589.95 146.96 44.39 76.36 59.60 41.56 2.15 0.00 1,184
CeO2 ppm 0.00 0.00 0.00 19.56 0.00 0.00 0.00 968.05 0.00 0.00 37.12 0.00 1,025
Cr2O3 ppm 44.29 10.92 14.61 5.05 367.30 96.48 27.83 322.43 62.15 7.69 0.00 0.00 959
Cl ppm 28.66 8.87 45.00 34.07 321.58 73.53 11.61 31.55 6.19 22.29 7.84 0.00 591
WO3 ppm 54.19 22.47 20.63 128.00 48.41 37.70 0.00 72.07 5.08 4.10 9.42 0.00 402
SrO ppm 0.00 0.00 8.81 36.27 21.32 19.45 10.73 0.00 1.79 16.89 36.99 0.00 152
Co3O4 ppm 0.00 0.00 0.00 0.00 0.00 0.00 0.00 2552.22 182.41 0.00 0.00 0.00 2,735
NiO ppm 47.94 18.99 7.66 11.57 76.46 25.02 6.27 88.50 8.85 4.92 2.28 0.00 298
CuO ppm 0.00 6.27 5.42 7.17 29.01 16.17 2.77 38.65 4.53 13.95 2.47 0.00 126
Nb2O5 ppm 0.00 0.00 2.62 0.00 53.02 12.89 2.96 25.58 6.60 0.00 1.71 0.00 105
BaO ppm 0.00 0.00 11.89 14.25 0.00 0.00 0.00 0.00 0.00 10.71 35.85 0.00 73
ZrO2 ppm 3.65 0.00 2.83 11.31 10.76 9.62 2.87 0.00 2.09 4.06 20.17 0.00 67
MoO3 ppm 0.00 0.00 0.00 0.00 19.79 6.01 0.00 33.61 3.66 3.67 0.00 0.00 67
As2O3 ppm 0.00 0.00 0.00 0.00 0.00 0.00 0.00 0.00 0.00 4.02 0.00 0.00 4
Br ppm 0.00 0.00 0.00 0.56 0.00 0.00 0.00 0.00 0.00 0.78 0.00 0.00 1
F ppm 0.00 0.00 0.00 0.00 0.00 0.00 0.00 0.00 0.00 31.71 0.00 0.00 32
Ga2O3 ppm 0.00 0.00 0.00 2.07 9.41 6.67 0.00 0.00 0.80 0.00 0.00 0.00 19
HgO ppm 0.00 2.05 0.00 0.00 0.00 0.00 0.00 0.00 0.00 0.00 0.00 0.00 2
PtO2 ppm 0.00 0.00 0.00 26.77 0.00 0.00 0.00 0.00 0.00 0.00 0.00 0.00 27
Rb2O ppm 3.82 0.00 5.14 2.29 9.03 3.50 0.00 0.00 0.00 3.20 2.59 0.00 30
Tb4O7 ppm 0.00 0.00 0.00 5.40 0.00 0.00 0.00 0.00 0.00 0.00 0.00 0.00 5
ThO2 ppm 0.00 0.00 0.00 0.00 0.00 0.00 0.00 0.00 0.00 0.00 2.91 0.00 3
Y2O3 ppm 0.00 0.00 0.73 2.72 0.00 0.00 0.00 0.00 0.00 0.78 2.72 0.00 7
Sum (%) 17.37 6.21 3.71 4.55 19.21 10.93 4.86 18.67 2.30 4.32 6.32 1.23

9
Table 9 3% lignin briquette chemical composition
Pelle
tsfin
es0-
5m
m
Pelle
tsfin
es0-
10m
m
Cast
hous
edu
st
Coke
dust
Prem
ix
Briq
uette
fines
Des
ulph
uriz
atio
nsc
rap
Mill
scal
e
Stee
lscr
ap
Rapi
dce
men
t
Slag
cem
ent
Lign
in
3%lig
nin
Fe2O3 (%) 15.52 5.57 1.31 0.12 12.38 5.93 0.92 17.87 1.60 0.12 0.03 0.00 61.37
CaO (%) 0.09 0.03 0.50 0.06 2.81 2.35 2.63 0.00 0.27 2.09 2.41 0.00 13.22
SiO2 (%) 1.08 0.37 0.29 0.34 1.90 1.40 0.56 0.14 0.19 0.61 2.20 0.00 9.07
Al2O3 (%) 0.09 0.03 0.11 0.17 0.65 0.39 0.09 0.02 0.07 0.15 0.61 0.00 2.39
MgO (%) 0.45 0.15 0.06 0.01 0.46 0.32 0.07 0.01 0.05 0.08 0.67 0.00 2.32
SO3 (%) 0.03 0.01 0.07 0.20 0.22 0.22 0.38 0.01 0.01 0.17 0.19 0.00 1.51
C (%) 0.00 0.00 1.29 3.57 0.00 0.00 0.00 0.00 0.00 0.00 0.00 1.84 6.70
ZnO ppm 0.00 0.00 116.18 8.85 168.86 36.93 2.48 127.89 14.33 17.06 2.21 0.00 494.79
Na2O ppm 275.30 102.28 59.33 39.69 1052.53 920.22 1226.81 137.04 118.92 336.65 398.95 0.00 4,667.71
PbO ppm 0.00 0.00 16.43 8.64 13.06 5.24 0.00 0.00 0.00 3.62 0.00 0.00 47
K2O ppm 144.51 49.03 188.97 142.42 737.48 464.37 52.94 0.00 30.56 338.31 472.49 0.00 2,621
MnO ppm 90.84 29.67 80.94 6.78 2286.03 603.90 191.26 1643.54 327.66 15.80 164.54 0.00 5,441
V2O5 ppm 204.96 77.70 88.70 18.35 1446.34 384.39 145.94 37.53 140.58 0.00 0.00 0.00 2,545
TiO2 ppm 222.85 91.11 126.81 237.51 683.89 428.75 389.80 39.95 70.08 72.28 890.97 0.00 3,254
P2O5 ppm 64.27 21.66 40.66 96.34 589.95 146.96 44.39 76.36 59.60 31.94 2.15 0.00 1,174
CeO2 ppm 0.00 0.00 0.00 19.56 0.00 0.00 0.00 968.05 0.00 0.00 37.12 0.00 1,025
Cr2O3 ppm 44.29 10.92 14.61 5.05 367.30 96.48 27.83 322.43 62.15 5.91 0.00 0.00 957
Cl ppm 28.66 8.87 45.00 34.07 321.58 73.53 11.61 31.55 6.19 17.13 7.84 0.00 586
WO3 ppm 54.19 22.47 20.63 128.00 48.41 37.70 0.00 72.07 5.08 3.15 9.42 0.00 401
SrO ppm 0.00 0.00 8.81 36.27 21.32 19.45 10.73 0.00 1.79 12.98 36.99 0.00 148
Co3O4 ppm 0.00 0.00 0.00 0.00 0.00 0.00 0.00 2552.22 182.41 0.00 0.00 0.00 2,735
NiO ppm 47.94 18.99 7.66 11.57 76.46 25.02 6.27 88.50 8.85 3.78 2.28 0.00 297
CuO ppm 0.00 6.27 5.42 7.17 29.01 16.17 2.77 38.65 4.53 10.72 2.47 0.00 123
Nb2O5 ppm 0.00 0.00 2.62 0.00 53.02 12.89 2.96 25.58 6.60 0.00 1.71 0.00 105
BaO ppm 0.00 0.00 11.89 14.25 0.00 0.00 0.00 0.00 0.00 8.23 35.85 0.00 70
ZrO2 ppm 3.65 0.00 2.83 11.31 10.76 9.62 2.87 0.00 2.09 3.12 20.17 0.00 66
MoO3 ppm 0.00 0.00 0.00 0.00 19.79 6.01 0.00 33.61 3.66 2.82 0.00 0.00 66
As2O3 ppm 0.00 0.00 0.00 0.00 0.00 0.00 0.00 0.00 0.00 3.09 0.00 0.00 3
Br ppm 0.00 0.00 0.00 0.56 0.00 0.00 0.00 0.00 0.00 0.60 0.00 0.00 1
F ppm 0.00 0.00 0.00 0.00 0.00 0.00 0.00 0.00 0.00 24.37 0.00 0.00 24
Ga2O3 ppm 0.00 0.00 0.00 2.07 9.41 6.67 0.00 0.00 0.80 0.00 0.00 0.00 19
HgO ppm 0.00 2.05 0.00 0.00 0.00 0.00 0.00 0.00 0.00 0.00 0.00 0.00 2
PtO2 ppm 0.00 0.00 0.00 26.77 0.00 0.00 0.00 0.00 0.00 0.00 0.00 0.00 27
Rb2O ppm 3.82 0.00 5.14 2.29 9.03 3.50 0.00 0.00 0.00 2.46 2.59 0.00 29
Tb4O7 ppm 0.00 0.00 0.00 5.40 0.00 0.00 0.00 0.00 0.00 0.00 0.00 0.00 5
ThO2 ppm 0.00 0.00 0.00 0.00 0.00 0.00 0.00 0.00 0.00 0.00 2.91 0.00 3
Y2O3 ppm 0.00 0.00 0.73 2.72 0.00 0.00 0.00 0.00 0.00 0.60 2.72 0.00 7
Sum (%) 17.37 6.21 3.71 4.55 19.21 10.93 4.86 18.67 2.30 3.32 6.32 1.84

10
Table 10 4% lignin briquette chemical compositionPe
llets
fines
0-5
mm
Pelle
tsfin
es0-
10m
m
Cast
hous
edu
st
Coke
dust
Prem
ix
Briq
uette
fines
Des
ulph
uriz
atio
nsc
rap
Mill
scal
e
Stee
lscr
ap
Rapi
dce
men
t
Slag
cem
ent
Lign
in
4%lig
nin
Fe2O3 (%) 15.52 5.57 1.31 0.12 12.38 5.93 0.92 17.87 1.60 0.08 0.03 0.00 61.34
CaO (%) 0.09 0.03 0.50 0.06 2.81 2.35 2.63 0.00 0.27 1.46 2.41 0.00 12.59
SiO2 (%) 1.08 0.37 0.29 0.34 1.90 1.40 0.56 0.14 0.19 0.43 2.20 0.00 8.89
Al2O3 (%) 0.09 0.03 0.11 0.17 0.65 0.39 0.09 0.02 0.07 0.10 0.61 0.00 2.34
MgO (%) 0.45 0.15 0.06 0.01 0.46 0.32 0.07 0.01 0.05 0.06 0.67 0.00 2.30
SO3 (%) 0.03 0.01 0.07 0.20 0.22 0.22 0.38 0.01 0.01 0.12 0.19 0.00 1.46
C (%) 0.00 0.00 1.29 3.57 0.00 0.00 0.00 0.00 0.00 0.00 0.00 2.45 7.32
ZnO ppm 0.00 0.00 116.18 8.85 168.86 36.93 2.48 127.89 14.33 11.92 2.21 0.00 489.65
Na2O ppm 275.30 102.28 59.33 39.69 1052.53 920.22 1226.81 137.04 118.92 235.25 398.95 0.00 4,566.31
PbO ppm 0.00 0.00 16.43 8.64 13.06 5.24 0.00 0.00 0.00 2.53 0.00 0.00 46
K2O ppm 144.51 49.03 188.97 142.42 737.48 464.37 52.94 0.00 30.56 236.41 472.49 0.00 2,519
MnO ppm 90.84 29.67 80.94 6.78 2286.03 603.90 191.26 1643.54 327.66 11.04 164.54 0.00 5,436
V2O5 ppm 204.96 77.70 88.70 18.35 1446.34 384.39 145.94 37.53 140.58 0.00 0.00 0.00 2,545
TiO2 ppm 222.85 91.11 126.81 237.51 683.89 428.75 389.80 39.95 70.08 50.51 890.97 0.00 3,232
P2O5 ppm 64.27 21.66 40.66 96.34 589.95 146.96 44.39 76.36 59.60 22.32 2.15 0.00 1,165
CeO2 ppm 0.00 0.00 0.00 19.56 0.00 0.00 0.00 968.05 0.00 0.00 37.12 0.00 1,025
Cr2O3 ppm 44.29 10.92 14.61 5.05 367.30 96.48 27.83 322.43 62.15 4.13 0.00 0.00 955
Cl ppm 28.66 8.87 45.00 34.07 321.58 73.53 11.61 31.55 6.19 11.97 7.84 0.00 581
WO3 ppm 54.19 22.47 20.63 128.00 48.41 37.70 0.00 72.07 5.08 2.20 9.42 0.00 400
SrO ppm 0.00 0.00 8.81 36.27 21.32 19.45 10.73 0.00 1.79 9.07 36.99 0.00 144
Co3O4 ppm 0.00 0.00 0.00 0.00 0.00 0.00 0.00 2552.22 182.41 0.00 0.00 0.00 2,735
NiO ppm 47.94 18.99 7.66 11.57 76.46 25.02 6.27 88.50 8.85 2.64 2.28 0.00 296
CuO ppm 0.00 6.27 5.42 7.17 29.01 16.17 2.77 38.65 4.53 7.49 2.47 0.00 120
Nb2O5 ppm 0.00 0.00 2.62 0.00 53.02 12.89 2.96 25.58 6.60 0.00 1.71 0.00 105
BaO ppm 0.00 0.00 11.89 14.25 0.00 0.00 0.00 0.00 0.00 5.75 35.85 0.00 68
ZrO2 ppm 3.65 0.00 2.83 11.31 10.76 9.62 2.87 0.00 2.09 2.18 20.17 0.00 65
MoO3 ppm 0.00 0.00 0.00 0.00 19.79 6.01 0.00 33.61 3.66 1.97 0.00 0.00 65
As2O3 ppm 0.00 0.00 0.00 0.00 0.00 0.00 0.00 0.00 0.00 2.16 0.00 0.00 2
Br ppm 0.00 0.00 0.00 0.56 0.00 0.00 0.00 0.00 0.00 0.42 0.00 0.00 1
F ppm 0.00 0.00 0.00 0.00 0.00 0.00 0.00 0.00 0.00 17.03 0.00 0.00 17
Ga2O3 ppm 0.00 0.00 0.00 2.07 9.41 6.67 0.00 0.00 0.80 0.00 0.00 0.00 19
HgO ppm 0.00 2.05 0.00 0.00 0.00 0.00 0.00 0.00 0.00 0.00 0.00 0.00 2
PtO2 ppm 0.00 0.00 0.00 26.77 0.00 0.00 0.00 0.00 0.00 0.00 0.00 0.00 27
Rb2O ppm 3.82 0.00 5.14 2.29 9.03 3.50 0.00 0.00 0.00 1.72 2.59 0.00 28
Tb4O7 ppm 0.00 0.00 0.00 5.40 0.00 0.00 0.00 0.00 0.00 0.00 0.00 0.00 5
ThO2 ppm 0.00 0.00 0.00 0.00 0.00 0.00 0.00 0.00 0.00 0.00 2.91 0.00 3
Y2O3 ppm 0.00 0.00 0.73 2.72 0.00 0.00 0.00 0.00 0.00 0.42 2.72 0.00 7
Sum (%) 17.37 6.21 3.71 4.55 19.21 10.93 4.86 18.67 2.30 2.32 6.32 2.45

Appendix #2 XRD results

1
Figure 1 Blast furnace sludge XRD analysis
Figure 2 Briquettes fines XRD analysis
Meas. data:BFSCalcite, syn, Ca ( C O3 ), 04-007-8659Hematite, syn, Fe2 O3, 04-015-6943magnetite, syn, Fe3 O4, 04-018-0091Wustite, syn, Fe O, 04-005-9792Quartz, syn, Si O2, 04-008-4821
2-theta (deg)
Inte
nsity
(cps
)
20 40 60 80 0e+000
1e+005
2e+005
3e+005
4e+005
Calc
ite,s
yn
Hem
atite
,syn
Hem
atite
,syn
Hem
atite
,syn
Hem
atite
,syn
Hem
atite
,syn
mag
netit
e,sy
n
mag
netit
e,sy
nmag
netit
e,sy
n mag
netit
e,sy
nm
agne
tite,
syn
mag
netit
e,sy
n mag
netit
e,sy
nm
agne
tite,
synm
agne
tite,
syn
mag
netit
e,sy
nmag
netit
e,sy
nm
agne
tite,
syn
mag
netit
e,sy
nmag
netit
e,sy
n
mag
netit
e,sy
n mag
netit
e,sy
nm
agne
tite,
synm
agne
tite,
syn
Wus
tite,
syn
Wus
tite,
syn
Wus
tite,
syn
Qua
rtz,s
yn
Qua
rtz,s
ynQ
uartz
,syn
2-theta (deg)
Inte
nsity
(cps
)
20 40 60 80 0.0e+000
5.0e+004
1.0e+005
1.5e+005
Hem
atite
,syn
Hem
atite
,syn
Hem
atite
,syn
calc
iteM
agne
tite
Mag
netit
e
Mag
netit
e
Wus
tite,
syn
Wus
tite,
syn
Wus
tite,
syn

2
Figure 3 Cast house dust XRD analysis
Figure 4 Coke dust XRD analysis
Meas. data:cast house dustHematite, syn, Fe2 O3, 04-010-3230wustite, Fe O, 04-005-9689magnetite, Fe3 O4, 04-015-8207Quartz, syn, Si O2, 01-082-0511
2-theta (deg)
Inte
nsity
(cps
)
20 40 60 80 0.0e+000
5.0e+004
1.0e+005
1.5e+005
2.0e+005
Hem
atite
,syn
Hem
atite
,syn
Hem
atite
,syn
Hem
atite
,syn
Hem
atite
,syn
wus
tite
wus
tite
wus
tite
mag
netit
e
mag
netit
e
mag
netit
e
Qua
rtz,s
yn Qua
rtz,s
yn
Meas. data:coke dustCarbon, C, 01-082-9929
2-theta (deg)
Inte
nsity
(cps
)
20 40 60 80 0.0e+000
5.0e+004
1.0e+005
Car
bon
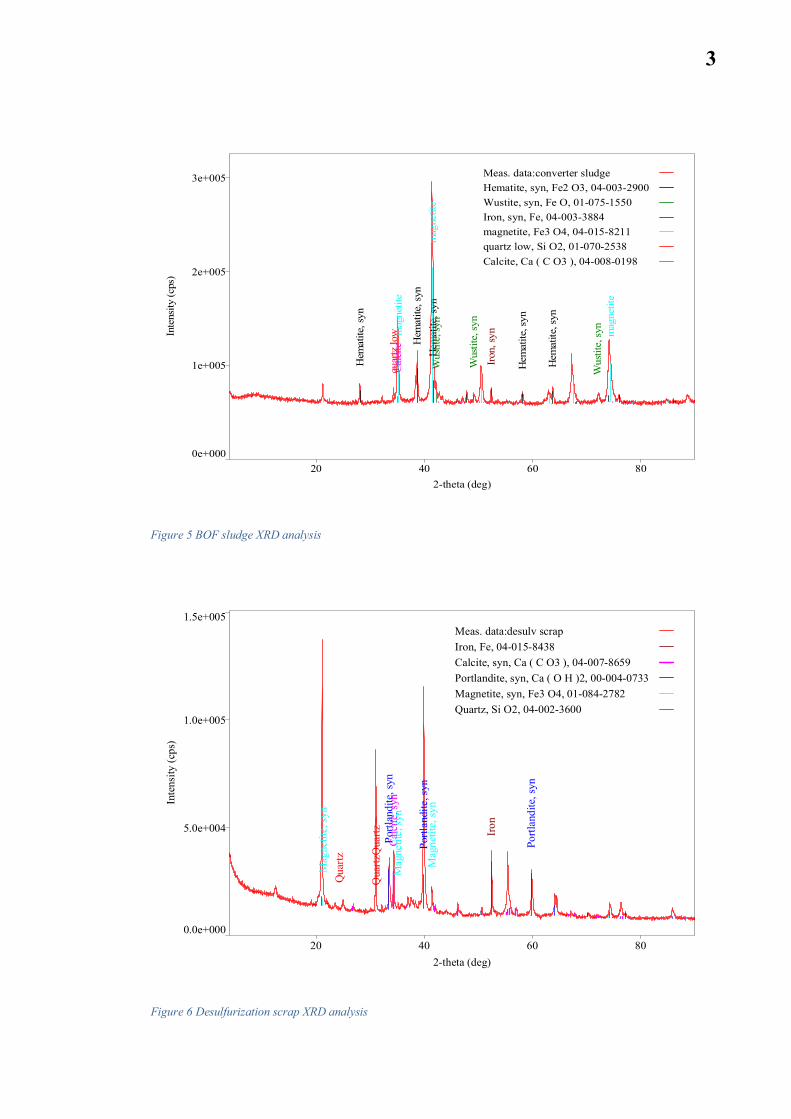
3
Figure 5 BOF sludge XRD analysis
Figure 6 Desulfurization scrap XRD analysis
Meas. data:converter sludgeHematite, syn, Fe2 O3, 04-003-2900Wustite, syn, Fe O, 01-075-1550Iron, syn, Fe, 04-003-3884magnetite, Fe3 O4, 04-015-8211quartz low, Si O2, 01-070-2538Calcite, Ca ( C O3 ), 04-008-0198
2-theta (deg)
Inte
nsity
(cps
)
20 40 60 80 0e+000
1e+005
2e+005
3e+005
Hem
atite
,syn
Hem
atite
,syn
Hem
atite
,syn
Hem
atite
,syn
Hem
atite
,syn
Wus
tite,
syn
Wus
tite,
syn
Wus
tite,
syn
Iron
,synm
agne
tite
mag
netit
e
mag
netit
e
quar
tzlo
wC
alci
te
Meas. data:desulv scrapIron, Fe, 04-015-8438Calcite, syn, Ca ( C O3 ), 04-007-8659Portlandite, syn, Ca ( O H )2, 00-004-0733Magnetite, syn, Fe3 O4, 01-084-2782Quartz, Si O2, 04-002-3600
2-theta (deg)
Inte
nsity
(cps
)
20 40 60 80 0.0e+000
5.0e+004
1.0e+005
1.5e+005
Iron
Cal
cite
,syn
Portl
andi
te,s
yn
Portl
andi
te,s
yn
Portl
andi
te,s
yn
Mag
netit
e,sy
n
Mag
netit
e,sy
n
Mag
netit
e,sy
n
Qua
rtz
Qua
rtzQ
uartz

4
Figure 7 Mill scale XRD analysis
Figure 8 Fine pellet fines (0-5mm) XRD analysis
Meas. data:mill scaleIron, syn, Fe, 04-003-5301magnetite, Fe3 O4, 04-015-8207Hematite, syn, Fe2 O3, 04-006-9058Wustite, syn, Fe0.92 O, 04-004-7638
2-theta (deg)
Inte
nsity
(cps
)
20 40 60 80 0e+000
1e+005
2e+005
3e+005
Iron,
syn
mag
netit
e
mag
netit
e
mag
netit
e
Hem
atite
,syn
Hem
atite
,syn
Hem
atite
,syn
Hem
atite
,syn
Hem
atite
,syn
Hem
atite
,syn
Wus
tite,
syn
Wus
tite,
syn
Wus
tite,
syn
Meas. data:pellet fine 0-5mmQuartz, syn, Si O2, 01-087-2096Hematite, syn, Fe2 O3, 04-003-5818Magnetite, syn, Fe3 O4, 04-007-2718
2-theta (deg)
Inte
nsity
(cps
)
20 40 60 80 0.0e+000
2.0e+005
4.0e+005
6.0e+005
8.0e+005
1.0e+006
Qua
rtz,s
yn
Qua
rtz,s
ynQ
uartz
,synH
emat
ite,s
yn
Hem
atite
,syn
Hem
atite
,syn
Hem
atite
,syn
Hem
atite
,syn
Hem
atite
,syn
Mag
netit
e,sy
n
Mag
netit
e,sy
n
Mag
netit
e,sy
n

5
Figure 9 Coarse pellet fines (0-10mm) XRD analysis
Figure 10 Pre-mix XRD analysis
Meas. data:pellet fine 0-10mmHematite, Fe2 O3, 01-087-1164Quartz, syn, Si O2, 01-087-2096magnetite, syn, Fe3 O4, 04-015-3102
2-theta (deg)
Inte
nsity
(cps
)
20 40 60 80 0.0e+000
2.0e+005
4.0e+005
6.0e+005
8.0e+005
Hem
atite
Hem
atite
Hem
atite
Hem
atite
Qua
rtz,s
yn
Qua
rtz,s
ynQ
uartz
,syn
mag
netit
e,sy
n
mag
netit
e,sy
n
Meas. data:premixmagnetite, syn, Fe3 O4, 04-018-0091Hematite, syn, Fe2 O3, 04-015-6947Wustite, syn, Fe O, 04-008-2748Calcite, syn, Ca ( C O3 ), 04-007-0049Quartz low, syn, Si O2, 03-065-0466
2-theta (deg)
Inte
nsity
(cps
)
20 40 60 80 0.0e+000
5.0e+004
1.0e+005
1.5e+005
2.0e+005
mag
netit
e,sy
n mag
netit
e,sy
n mag
netit
e,sy
nm
agne
tite,
syn
mag
netit
e,sy
nmag
netit
e,sy
nm
agne
tite,
syn m
agne
tite,
syn
mag
netit
e,sy
n mag
netit
e,sy
nm
agne
tite,
syn
mag
netit
e,sy
nmag
netit
e,sy
n
mag
netit
e,sy
n mag
netit
e,sy
nm
agne
tite,
synm
agne
tite,
syn
Hem
atite
,syn Hem
atite
,syn
Hem
atite
,syn
Hem
atite
,syn
Hem
atite
,syn
Hem
atite
,syn
Hem
atite
,syn
Hem
atite
,syn
Wus
tite,
syn
Wus
tite,
syn
Calc
ite,s
yn
Qua
rtzlo
w,s
yn
Qua
rtzlo
w,s
ynQ
uartz
low
,syn
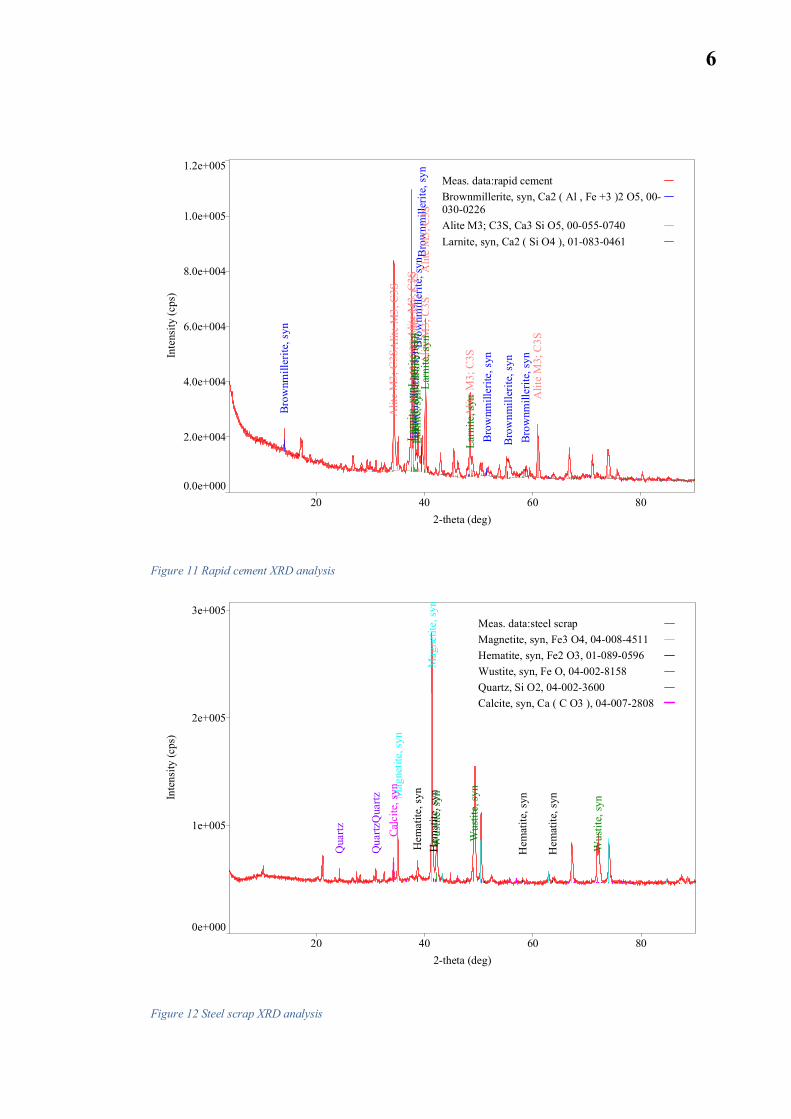
6
Figure 11 Rapid cement XRD analysis
Figure 12 Steel scrap XRD analysis
Meas. data:rapid cementBrownmillerite, syn, Ca2 ( Al , Fe +3 )2 O5, 00-030-0226Alite M3; C3S, Ca3 Si O5, 00-055-0740Larnite, syn, Ca2 ( Si O4 ), 01-083-0461
2-theta (deg)
Inte
nsity
(cps
)
20 40 60 80 0.0e+000
2.0e+004
4.0e+004
6.0e+004
8.0e+004
1.0e+005
1.2e+005
Brow
nmill
erite
,syn
Bro
wnm
iller
ite,s
ynBr
ownm
iller
ite,s
ynB
row
nmill
erite
,syn
Brow
nmill
erite
,syn
Bro
wnm
iller
ite,s
ynBr
ownm
iller
ite,s
yn
Alit
eM
3;C
3SA
lite
M3;
C3S
Alit
eM
3;C
3SA
lite
M3;
C3S
Alit
eM
3;C
3SA
lite
M3;
C3S
Alit
eM
3;C
3S
Alit
eM
3;C
3S
Alit
eM
3;C
3S
Larn
ite,s
ynLa
rnite
,syn
Larn
ite,s
ynLa
rnite
,syn
Larn
ite,s
ynLa
rnite
,syn
Larn
ite,s
yn
Meas. data:steel scrapMagnetite, syn, Fe3 O4, 04-008-4511Hematite, syn, Fe2 O3, 01-089-0596Wustite, syn, Fe O, 04-002-8158Quartz, Si O2, 04-002-3600Calcite, syn, Ca ( C O3 ), 04-007-2808
2-theta (deg)
Inte
nsity
(cps
)
20 40 60 80 0e+000
1e+005
2e+005
3e+005
Mag
netit
e,sy
n
Mag
netit
e,sy
nH
emat
ite,s
ynH
emat
ite,s
yn
Hem
atite
,syn
Hem
atite
,syn
Wus
tite,
syn
Wus
tite,
syn
Wus
tite,
syn
Qua
rtz
Qua
rtzQ
uartz
Calc
ite,s
yn

Appendix #3 EMMA particle packing results

1
Figure 1 EMMA particle packing for basic recipe with
q=0.28
Figure 2 EMMA particle packing for basic recipe with
q=0.30
Figure 3 EMMA particle packing for 2% sludge
briquette with q=0.28
Figure 4 EMMA particle packing for 2% sludge
briquette with q=0.30
Figure 5 EMMA particle packing for 4% sludge
briquette with q=0.28
Figure 6 EMMA particle packing for 4% sludge
briquette with q=0.30

2
Figure 7 EMMA particle packing for 6% sludge
briquette with q=0.28
Figure 8 EMMA particle packing for6 % sludge
briquette with q=0.30
Figure 9 EMMA particle packing for 8% sludge
briquette with q=0.28
Figure 10 EMMA particle packing 8% sludge briquette
with q=0.30
Figure 11 EMMA particle packing for 1% lignin
briquette with q=0.28
Figure 12 EMMA particle packing for 1% lignin
briquette with q=0.30

3
Figure 13 EMMA particle packing for 2% lignin
briquette with q=0.28
Figure 14 EMMA particle packing for 2% lignin
briquette with q=0.30
Figure 15 EMMA particle packing for 3% lignin
briquette with q=0.28
Figure 16 EMMA particle packing for 3% lignin
briquette with q=0.30
Figure 17 EMMA particle packing for 4% lignin
briquette with q=0.28
Figure 18 EMMA particle packing for 4% lignin
briquette with q=0.30

Appendix #4 Drop test results

1
2 days-drop test
65A118 Basic recipe 68E118 (8%sludge)Number of
drops Mass (g) Number ofdrops Mass (g)
0 (Initial mass) 295.07 0 (Initial mass) 295.9410 287.21 10 288.9520 269.77 20 282.1330 210.63 30 273.8840 197.65 40 264.8950 178.36 50 253.26
66A119 Basic recipe 69E119 (8%sludge)Number of
drops Mass (g) Number ofdrops Mass (g)
0 (Initial mass) 295.76 0 (Initial mass) 298.4810 286.53 10 291.6320 267.1 20 279.6830 154.89 30 271.433 129.19 40 253.58
50 236.99
67A120 Basic recipe 70E120 (8%sludge)Number of
drops Mass (g) Number ofdrops Mass (g)
0 (Initial mass) 294.69 0 (Initial mass) 294.6910 283.27 10 283.920 263.72 20 276.930 196.45 30 232.0635 92.15 40 216.5
50 205.64

2
7 days-drop test
37A110 Basic recipe 54E115 (8% sludge)Number of
drops Mass (g) Number ofdrops Mass (g)
0 (Initial mass) 313.92 0 (Initial mass) 279.88910 311.07 10 277.920 308.37 20 275.330 304.3 30 271.4940 301.81 40 268.4950 298.94 50 262
38A111 Basic recipe 55E116 (8% sludge)Number of
drops Mass (g) Number ofdrops Mass (g)
0 (Initial mass) 245.819 0 (Initial mass) 285.8610 244.72 10 282.9420 243.52 20 279.0630 240.57 30 276.1940 238.91 40 272.2650 237.5 50 268.6
39A112 Basic recipe 56E117 (8% sludge)Number of
drops Mass (g) Number ofdrops Mass (g)
0 (Initial mass) 265.12 0 (Initial mass) 285.210 263.21 10 281.8520 261.4 20 277.4630 258.65 30 273.2440 256.7 40 270.4250 253.7 50 267.15

Appendix #5 Briquettes recipes and test results

1
Table 1 Briquettes used for compression tests
Recipe Composition
Briq
uett
ing
pres
sure
(bar
)
Wat
erco
nten
t(%
db)
Cur
ing
(Day
s)
Forc
e(N
)
1 A 11 Basic recipe 100 9.5% 2 13,747.602 A 12 Basic recipe 100 9.5% 2 16,328.493 A 13 Basic recipe 100 9.5% 2 14,763.934 A 14 Basic recipe 100 9.5% 7 25,558.135 A 15 Basic recipe 100 9.5% 7 24,766.706 A 16 Basic recipe 100 9.5% 7 26,847.667 A 17 Basic recipe 100 9.5% 28 34,486.598 A 18 Basic recipe 100 9.5% 28 36,602.959 A 19 Basic recipe 100 9.5% 28 30,843.13
10 B 11 Basic recipe 200 9.5% 2 14,452.2311 B 12 Basic recipe 200 9.5% 7 23,612.9312 B 13 Basic recipe 200 9.5% 28 25,357.9313 C 11 Basic recipe 2% sludge 1:1 100 9.5% 2 10,525.2414 C 12 Basic recipe 2% sludge 1:1 100 9.5% 7 23,848.4115 C 21 Basic recipe 4% sludge 1:1 100 9.5% 2 9,969.0116 C 22 Basic recipe 4% sludge 1:1 100 9.5% 7 21,897.5917 C 31 Basic recipe 6% sludge 1:1 100 9.5% 2 9,319.2218 C 32 Basic recipe 6% sludge 1:1 100 9.5% 7 23,695.5819 C 41 Basic recipe 8% sludge 1:1 100 9.5% 2 9,677.0020 C 42 Basic recipe 8% sludge 1:1 100 9.5% 7 25,612.5021 C 13 Basic recipe 2% sludge 1:1 100 9.5% 28 32,156.8222 C 23 Basic recipe 4% sludge 1:1 100 9.5% 28 29,383.1623 C 33 Basic recipe 6% sludge 1:1 100 9.5% 28 22,823.7824 C 43 Basic recipe 8% sludge 1:1 100 9.5% 28 28,144.6025 D 11 Basic recipe 1% Lignin 100 9.5% 2 1,058.1526 D 12 Basic recipe 1% Lignin 100 9.5% 7 3,114.4827 D 13 Basic recipe 1% Lignin 100 9.5% 28 2,997.0928 D 21 Basic recipe 2% Lignin 100 9.5% 2 1,046.6829 D 22 Basic recipe 2% Lignin 100 9.5% 7 2,019.0830 D 23 Basic recipe 2% Lignin 100 9.5% 28 1,607.6931 D 31 Basic recipe 3% Lignin 100 9.5% 2 868.2632 D 32 Basic recipe 3% Lignin 100 9.5% 7 1,768.9833 D 33 Basic recipe 3% Lignin 100 9.5% 28 1,455.9434 D 41 Basic recipe 4% Lignin 100 9.5% 2 424.31
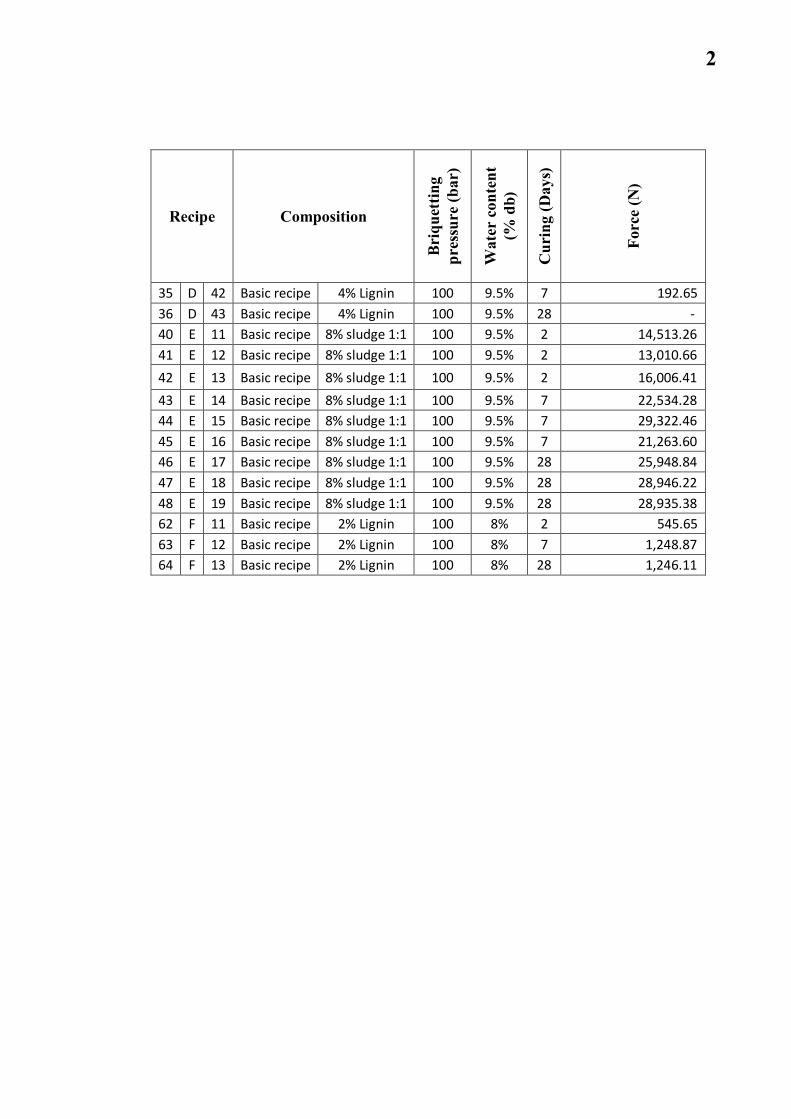
2
Recipe Composition
Briq
uett
ing
pres
sure
(bar
)
Wat
erco
nten
t(%
db)
Cur
ing
(Day
s)
Forc
e(N
)
35 D 42 Basic recipe 4% Lignin 100 9.5% 7 192.6536 D 43 Basic recipe 4% Lignin 100 9.5% 28 -40 E 11 Basic recipe 8% sludge 1:1 100 9.5% 2 14,513.2641 E 12 Basic recipe 8% sludge 1:1 100 9.5% 2 13,010.6642 E 13 Basic recipe 8% sludge 1:1 100 9.5% 2 16,006.4143 E 14 Basic recipe 8% sludge 1:1 100 9.5% 7 22,534.2844 E 15 Basic recipe 8% sludge 1:1 100 9.5% 7 29,322.4645 E 16 Basic recipe 8% sludge 1:1 100 9.5% 7 21,263.6046 E 17 Basic recipe 8% sludge 1:1 100 9.5% 28 25,948.8447 E 18 Basic recipe 8% sludge 1:1 100 9.5% 28 28,946.2248 E 19 Basic recipe 8% sludge 1:1 100 9.5% 28 28,935.3862 F 11 Basic recipe 2% Lignin 100 8% 2 545.6563 F 12 Basic recipe 2% Lignin 100 8% 7 1,248.8764 F 13 Basic recipe 2% Lignin 100 8% 28 1,246.11
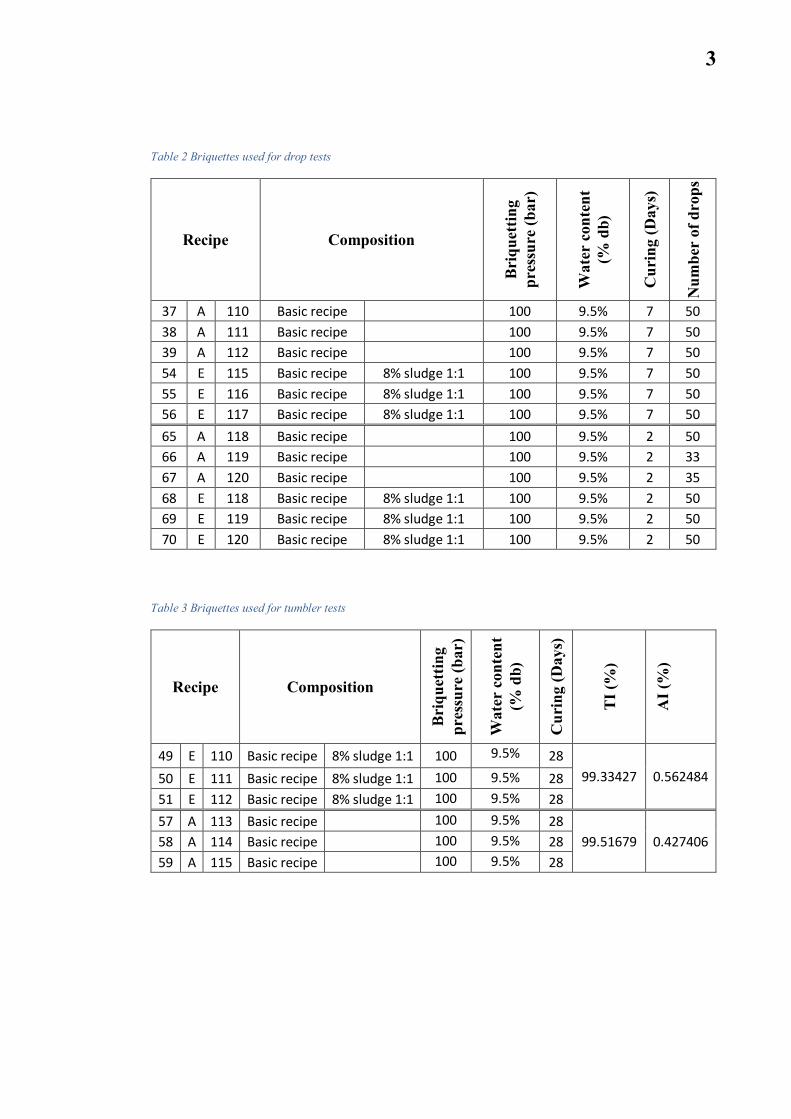
3
Table 2 Briquettes used for drop tests
Recipe Composition
Briq
uett
ing
pres
sure
(bar
)
Wat
erco
nten
t(%
db)
Cur
ing
(Day
s)
Num
ber
ofdr
ops
37 A 110 Basic recipe 100 9.5% 7 5038 A 111 Basic recipe 100 9.5% 7 5039 A 112 Basic recipe 100 9.5% 7 5054 E 115 Basic recipe 8% sludge 1:1 100 9.5% 7 5055 E 116 Basic recipe 8% sludge 1:1 100 9.5% 7 5056 E 117 Basic recipe 8% sludge 1:1 100 9.5% 7 5065 A 118 Basic recipe 100 9.5% 2 5066 A 119 Basic recipe 100 9.5% 2 3367 A 120 Basic recipe 100 9.5% 2 3568 E 118 Basic recipe 8% sludge 1:1 100 9.5% 2 5069 E 119 Basic recipe 8% sludge 1:1 100 9.5% 2 5070 E 120 Basic recipe 8% sludge 1:1 100 9.5% 2 50
Table 3 Briquettes used for tumbler tests
Recipe Composition
Briq
uett
ing
pres
sure
(bar
)
Wat
erco
nten
t(%
db)
Cur
ing
(Day
s)
TI(%
)
AI(
%)
49 E 110 Basic recipe 8% sludge 1:1 100 9.5% 2899.33427 0.56248450 E 111 Basic recipe 8% sludge 1:1 100 9.5% 28
51 E 112 Basic recipe 8% sludge 1:1 100 9.5% 2857 A 113 Basic recipe 100 9.5% 28
99.51679 0.42740658 A 114 Basic recipe 100 9.5% 2859 A 115 Basic recipe 100 9.5% 28