RECORD LINKAGE OF 2006 CENSUS RECORDS … · Figure 1: Screenshot of QualityStage after running...
176
1 Public Health Monograph Series No.33 ISSN 1178-7139 RECORD LINKAGE OF 2006 CENSUS RECORDS AND 2006-2011 MORTALITY AND CANCER REGISTRATION RECORDS: UNLOCK RATIOS AND LINKAGE WEIGHTS New Zealand Census Mortality Study/CancerTrends Technical Report No. 8. Kate Sloane June Atkinson Neela Bastiampillai Tony Blakely April 2015 A technical report published by the Department of Public Health, University of Otago, Wellington ISBN 978-0-9876663-8-3
Transcript of RECORD LINKAGE OF 2006 CENSUS RECORDS … · Figure 1: Screenshot of QualityStage after running...

1
Public Health Monograph Series
No.33
ISSN 1178-7139
RECORD LINKAGE OF 2006 CENSUS RECORDS AND 2006-2011
MORTALITY AND CANCER REGISTRATION RECORDS: UNLOCK
RATIOS AND LINKAGE WEIGHTS
New Zealand Census Mortality Study/CancerTrends
Technical Report No. 8.
Kate Sloane
June Atkinson
Neela Bastiampillai
Tony Blakely
April 2015
A technical report published by the Department of Public Health,
University of Otago, Wellington
ISBN 978-0-9876663-8-3

2
Acknowledgements
The Ministry of Health funds the New Zealand Census Mortality and CancerTrends
Study 2006-2011 (NZCMS/CT). The NZCMS was merged with the CancerTrends
project in 2010. The Health Research Council of New Zealand (HRC) initially funded
the New Zealand Census Mortality Study (NZCMS), and the MoH initially funded the
CancerTrends study, followed by funding by the HRC. The census data was provided
by Statistics New Zealand and the mortality and cancer registration data was
provided by the Ministry of Health.
We would like to thank those at Statistics New Zealand (in particular Gareth Meech,
Rosemary Goodyear, Kirsten Nissen, Conrad MacCormick, Wendy Dobson and all the
members of the Census and Datalab groups at SNZ) for help with the data,
QualityStage and June Atkinson’s secondment.

3
Statistics New Zealand Security Statement
The New Zealand Census Mortality Study and CancerTrends study were initiated by
Professor Tony Blakely and his co-researchers from the University of Otago,
Wellington. It was approved by the Government Statistician as a Data Laboratory
project under the Microdata Access Protocols. All research publications are based on
researcher initiated ideas.
Access to the data used in this study was provided by Statistics New Zealand under
conditions designed to give effect to the security and confidentiality provisions of the
Statistics Act 1975. The results presented in this study are the work of the authors,
not Statistics New Zealand.
The full security statement is available at:
http://www.otago.ac.nz/wellington/research/hirp/otago025301.html

4
Table of Contents
Acknowledgements .................................................................................................... 2
Statistics New Zealand Security Statement ............................................................... 3
Table of Contents ....................................................................................................... 4
List of Tables .............................................................................................................. 6
List of Figures ........................................................................................................... 10
Introduction ............................................................................................................. 11
PROCESS OF RECORD LINKAGE ................................................................................ 13
Linkage Bias .............................................................................................................. 20
WEIGHTING OF MORTALITY AND CANCER REGISTRATION RECORDS ..................... 22
Territorial Authorities (TAs) ..................................................................................... 23
Weighting of Linked Records within ‘Acceptable’ Strata ........................................ 28
Weighting of Non-Linked Census Records ............................................................... 30
MIGRATION ADJUSTMENTS ..................................................................................... 31
UNLOCK RATIOS FOR 2006-2011 ............................................................................. 39
Weighting of Unlock Dataset to represent all Mortality Records ........................... 40
Unlock Ratios for Mortality and Cancer Registration Data Compared to Census
Data .......................................................................................................................... 44
UNLOCK RATIOS BY BY SOCIODEMOGRAPHICS ....................................................... 47
Unlock Ratio Conclusions ......................................................................................... 48
References ............................................................................................................... 49
Appendix A ............................................................................................................... 51
Appendix B ............................................................................................................... 61
Unlock Ratios Stratified by Sex ............................................................................ 61
Unlock Ratios Stratified by Age ............................................................................ 63
Unlock Ratios Stratified by NZ Deprivation ......................................................... 79
Unlock Ratios Stratified by Regional Health Authority (RHA) or Regional Council
.............................................................................................................................. 91
Unlock Ratios Stratified by District Health Board (DHB) ................................... 105
Unlock Ratios Stratified by Rurality ................................................................... 117
5
Unlock Ratios Stratified by Cause of Death ....................................................... 122
Appendix C ............................................................................................................. 143
Appendix D ............................................................................................................. 169

6
List of Tables
Table 1: QualityStage Pass details ............................................................................... 14
Table 2: Number of linked and percentage of total linked Mortality, Cancer and
Combined 2006-2011 data to the 2006 Census for QualityStage Match Pass Number
...................................................................................................................................... 18
Table 3: Number of linked and percentage of total linked Mortality, Cancer and
Combined 2006-2011 data to the 2006 Census for QualityStage Match Group ......... 19
Table 4: Linkage and Unlock status .............................................................................. 19
Table 5: Unlock status by QualityStage Match Group ................................................. 19
Table 6: Number and percentage of linked and non-linked Total, Mortality and
Cancer Registrations for the 2006-2011 datasets ....................................................... 21
Table 7: TA clusters for Mortality linkage weights ...................................................... 24
Table 8: TA clusters for Cancer linkage weights .......................................................... 24
Table 9: Parameter estimates, standard errors for TA clusters for Mortality records 25
Table 10: Parameter estimates, standard errors for TA clusters for Cancer
Registration records ..................................................................................................... 25
Table 11: Distribution of linkage weights for linked Mortality and Cancer Registration
records ......................................................................................................................... 29
Table 12: Distribution of the age and ethnicity adjusted unlock weight for the
Mortality (within 5 years) population, 2006-2011 cohort ........................................... 42
Table 13: Distribution of the age and ethnicity adjusted unlock weight for Cancer
Registration (within 5 years) population, 2006-2011 cohort ...................................... 43
Table 14: Census Total Ethnicity by Mortality and NHI Total Ethnicity, 2006-2011 .... 45
Table 15: Census Total Ethnicity by Cancer Registration and NHI Total Ethnicity, 2006-
2011 ............................................................................................................................. 45
Table 16: Census Prioritised Ethnicity by Mortality and NHI Prioritised Ethnicity,
2006-2011 .................................................................................................................... 46
Table 17: Census Prioritised Ethnicity by Cancer Registration and NHI Prioritised
Ethnicity, 2006-2011 .................................................................................................... 46
Table 18: Census Sole Ethnicity by Mortality and NHI Sole Ethnicity, 2006-2011 ...... 46

7
Table 19: Census Sole Ethnicity by Cancer Registration and NHI Sole Ethnicity, 2006-
2011 ............................................................................................................................. 47
Table 20: All-Cause Mortality 1996-2011 results by single year for Māori Ethnicity,
age <75 years, all data, by sex ..................................................................................... 51
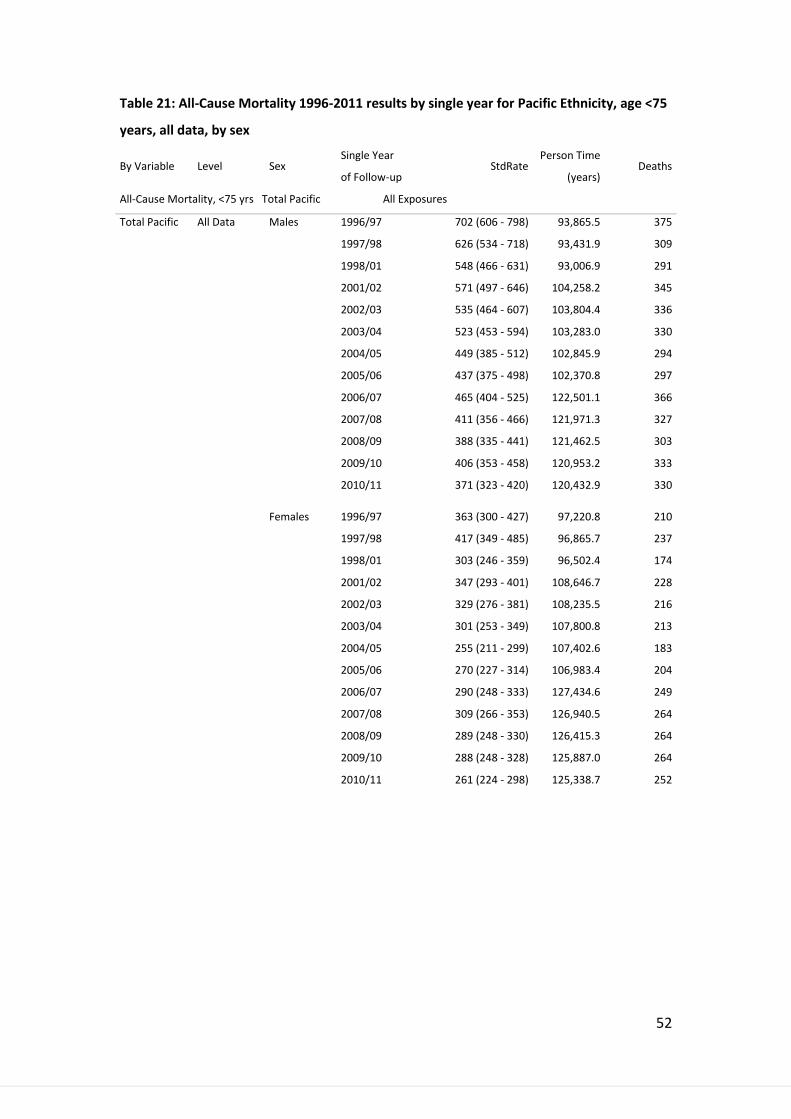
Table 21: All-Cause Mortality 1996-2011 results by single year for Pacific Ethnicity,
age <75 years, all data, by sex ..................................................................................... 52
Table 22: All-Cause Mortality 1996-2011 results by single year for Pacific Ethnicity,
age <75 years, born in NZ, by sex ................................................................................ 53
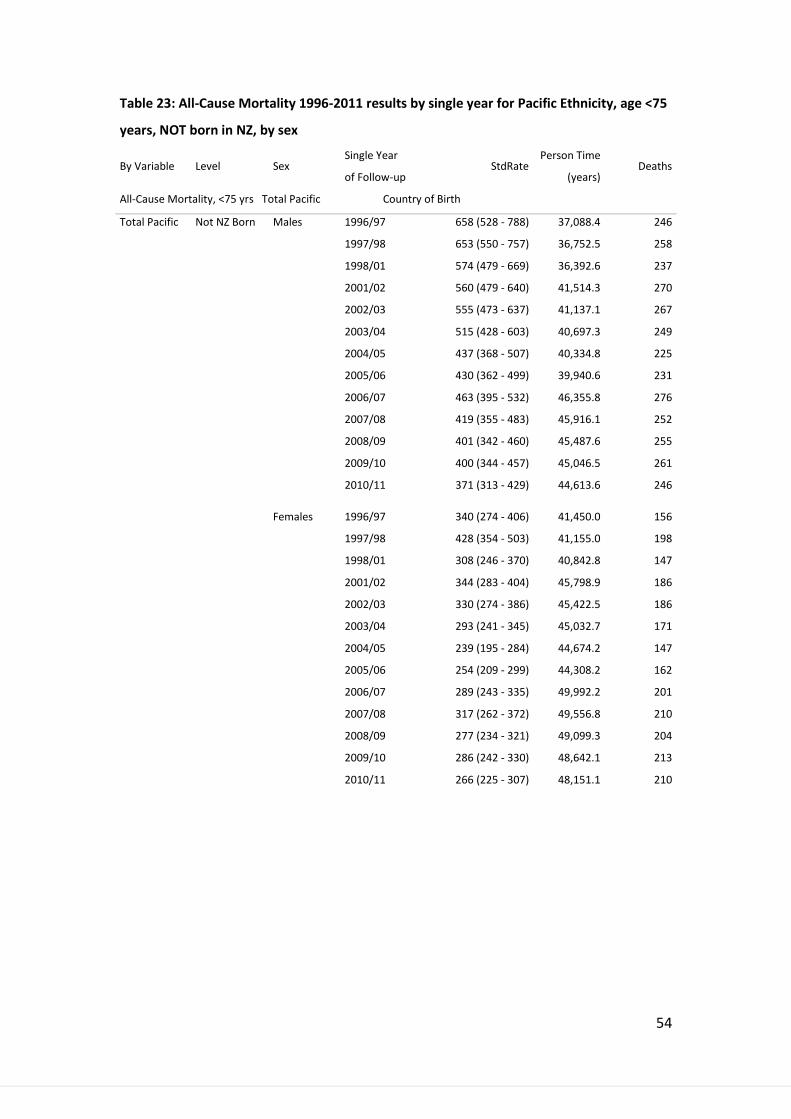
Table 23: All-Cause Mortality 1996-2011 results by single year for Pacific Ethnicity,
age <75 years, NOT born in NZ, by sex ........................................................................ 54
Table 24: All-Cause Mortality 1996-2011 results by single year for Asian Ethnicity, age
<75 years, all data, by sex ............................................................................................ 55
Table 25: All-Cause Mortality 1996-2011 results by single year for Asian Ethnicity, age
<75 years, born in NZ, by sex ....................................................................................... 56
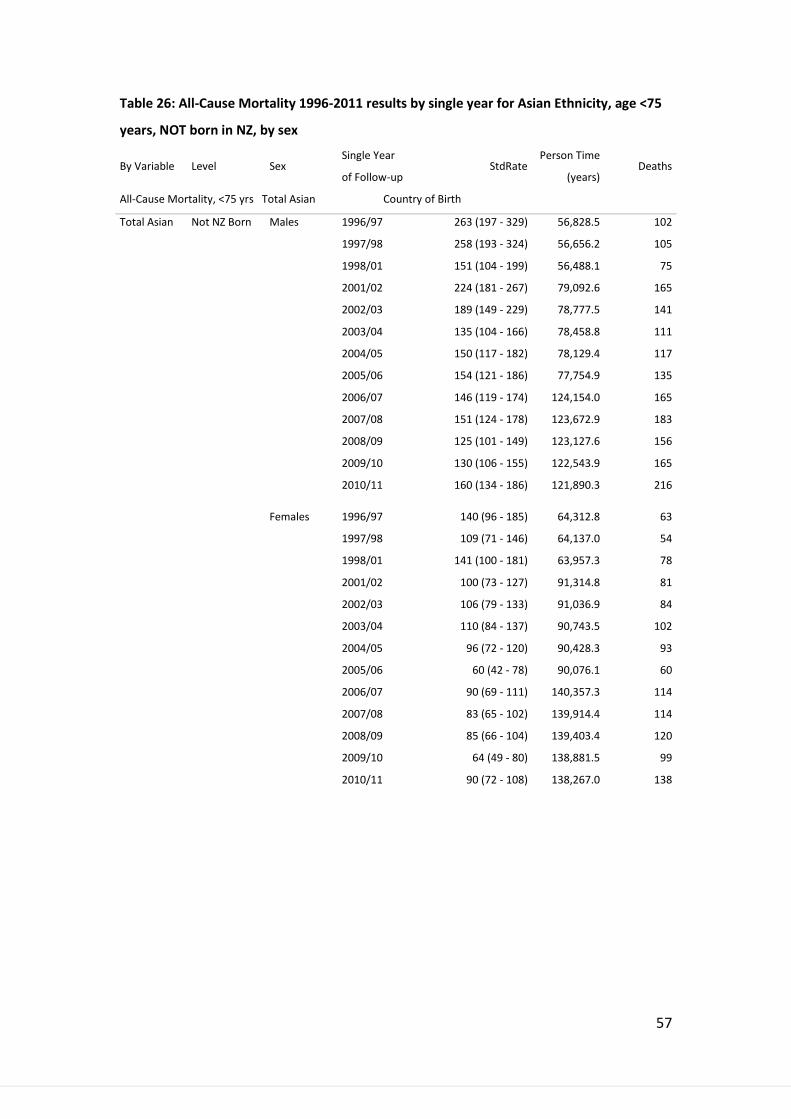
Table 26: All-Cause Mortality 1996-2011 results by single year for Asian Ethnicity, age
<75 years, NOT born in NZ, by sex ............................................................................... 57
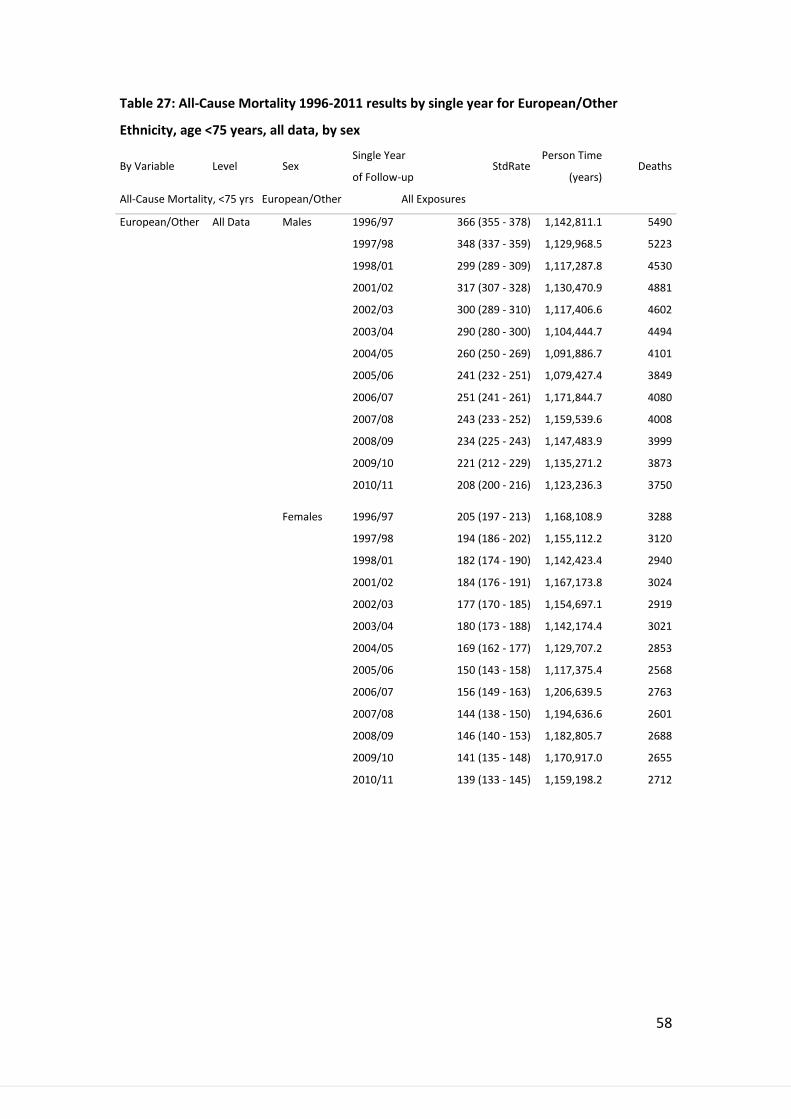
Table 27: All-Cause Mortality 1996-2011 results by single year for European/Other
Ethnicity, age <75 years, all data, by sex ..................................................................... 58
Table 28: All-Cause Mortality 1996-2011 results by single year for European/Other
Ethnicity, age <75 years, born in NZ, by sex ................................................................ 59
Table 29: All-Cause Mortality 1996-2011 results by single year for European/Other
Ethnicity, age <75 years, NOT born in NZ, by sex ........................................................ 60
Table 30: Census Total Ethnicity by Mortality and NHI Total Ethnicity stratified by Sex,
2006-2011 .................................................................................................................... 61
Table 31: Census Total Ethnicity by Cancer Registration and NHI Total Ethnicity
stratified by Sex, 2006-2011 ........................................................................................ 61
Table 32: Census Prioritised Ethnicity by Mortality and NHI Prioritised Ethnicity
stratified by Sex, 2006-2011 ........................................................................................ 62
Table 33: Census Prioritised Ethnicity by Cancer Registration and NHI Prioritised
Ethnicity Stratified by Sex, 2006-2011 ......................................................................... 62

8
Table 34: Census Total Ethnicity by Mortality and NHI Total Ethnicity stratified by Age
Group, 2006-2011 ........................................................................................................ 63
Table 35: Census Total Ethnicity by Cancer Registration and NHI Total Ethnicity
Stratified by Age Group, 2006-2011 ............................................................................ 66
Table 36: Census Prioritised Ethnicity by Mortality and NHI Priortised Ethnicity
stratified by Age Group, 2006-2011 ............................................................................ 70
Table 37: Census Prioritised Ethnicity by Cancer Registration and NHI Prioritised
Ethnicity Stratified by Age Group, 2006-2011 ............................................................. 74
Table 38: Census Total Ethnicity by Mortality and NHI Total Ethnicity stratified by NZ
Deprivation, 2006-2011 ............................................................................................... 79
Table 39: Census Total Ethnicity by Cancer Registration and NHI Total Ethnicity
stratified by NZ Deprivation, 2006-2011 ..................................................................... 81
Table 40: Census Prioritised Ethnicity by Mortality and NHI Prioritised Ethnicity
stratified by NZ Deprivation, 2006-2011 ..................................................................... 84
Table 41: Census Prioritised Ethnicity by Cancer Registration and NHI Prioritised
Ethnicity stratified by NZ Depriviation, 2006-2011 ..................................................... 87
Table 42: Census Total Ethnicity by Mortality and NHI Total Ethnicity stratified by
RHA or Regional Council, 2006-2011 ........................................................................... 91
Table 43: Census Total Ethnicity by Cancer Registration and NHI Total Ethnicity
stratified by RHA or Regional Council, 2006-2011 ....................................................... 94
Table 44: Census Prioritised Ethnicity by Mortality and NHI Prioritised Ethnicity
stratified by RHA or Regional Council, 2006-2011 ....................................................... 96
Table 45: Census Prioritised Ethnicity by Cancer Registration and NHI Prioritised
Ethnicity stratified by RHA or Regional Council, 2006-2011...................................... 100
Table 46: Census Total Ethnicity by Mortality and NHI Total Ethnicity stratified by
DHB, 2006-2011 ......................................................................................................... 105
Table 47: Total Ethnicity by Cancer Registration and NHI Total Ethnicity stratified by
DHB, 2006-2011 ......................................................................................................... 107
Table 48: Census Prioritised Ethnicity by Mortality and NHI Prioritised Ethnicity
stratified by DHB, 2006-2011 ..................................................................................... 110

9
Table 49: Census Prioritised Ethnicity by Cancer Registration and NHI Prioritised
Ethnicity stratified by DHB, 2006-2011 ...................................................................... 113
Table 50: Census Total Ethnicity by Mortality and NHI Total Ethnicity stratified by
Rurality, 2006-2011. ................................................................................................... 117
Table 51: Census Total Ethnicity by Cancer Registration and NHI Total Ethnicity
stratified by Rurality, 2006-2011 ............................................................................... 118
Table 52: Census Prioritised Ethnicity by Mortality and NHI Prioritised Ethnicity
stratified by Rurality, 2006-2011 ............................................................................... 119
Table 53: Census Prioritised Ethnicity by Cancer Registration and NHI Prioritised
Ethnicity stratified by Rurality, 2006-2011 ................................................................ 120
Table 54: Census Total Ethnicity by Mortality and NHI Total Ethnicity stratified by
Cause of Death Groupings, 2006-2011 ...................................................................... 122
Table 55: Census Total Ethnicity by Cancer Registration and NHI Total Ethnicity
stratified by First Cancer Registration, 2006-2011 .................................................... 123
Table 56: Census Prioritised Ethnicity by Mortality and NHI Prioritised Ethnicity
stratified by ICD, 2006-2011 ...................................................................................... 132
Table 57: Census Prioritised Ethnicity by Cancer Registration and NHI Prioritised
Ethnicity stratified by first Cancer Registration, 2006-2011 ...................................... 133

10
List of Figures
Figure 1: Screenshot of QualityStage after running meshblock passes 1 to 3 and area
unit passes 1 to 4. ........................................................................................................ 16
Figure 2: All-Cause Mortality <75 years All Data for NZMaori, Pacific, nonMPA and
Asian by sex .................................................................................................................. 33
Figure 3: All-Cause Mortality <75 yrs Born for NZMaori, Pacific and nonMPA by sex 34
Figure 4: All-Cause Mortality <75 years Not NZ born for Pacific, nonMPA and Asian by
sex ................................................................................................................................ 35
Figure 5: All-Cause Mortality <75 years All Data for NZMaori, Pacific and nonMPA by
sex ................................................................................................................................ 36
Figure 6: All-Cause Mortality <75 years NZ Born for NZMaori, Pacific and nonMPA by
sex ................................................................................................................................ 37
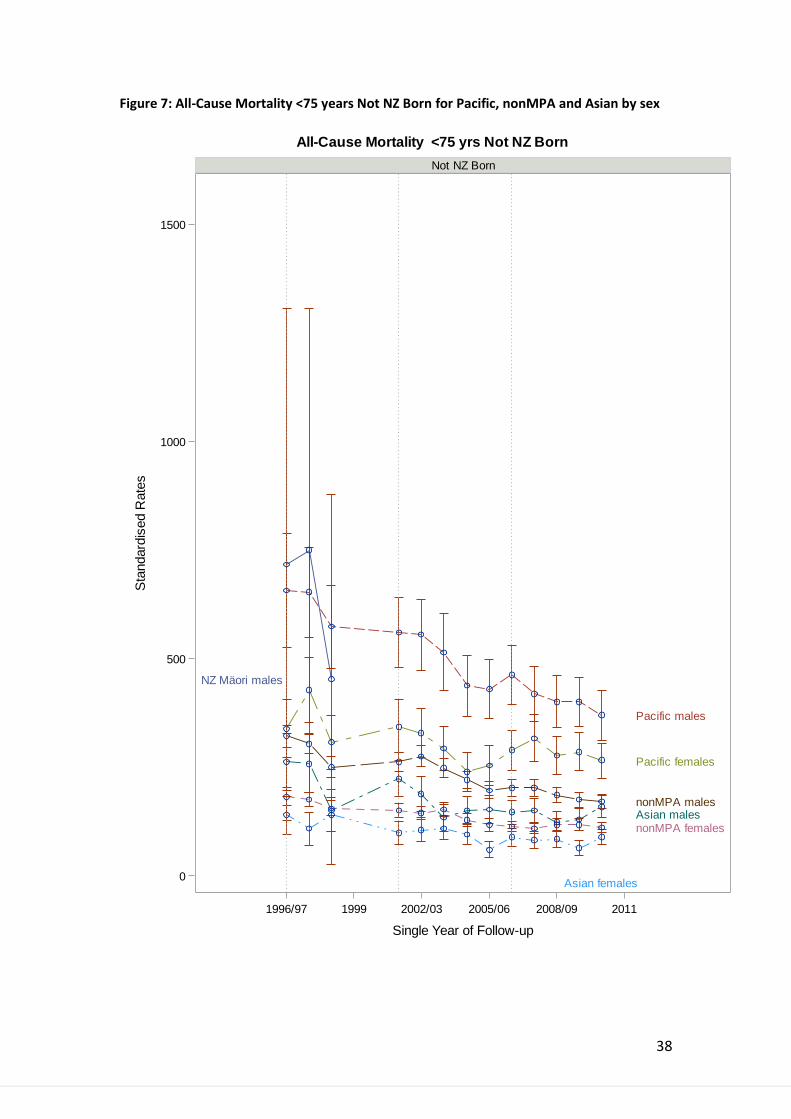
Figure 7: All-Cause Mortality <75 years Not NZ Born for Pacific, nonMPA and Asian by
sex ................................................................................................................................ 38
11
Introduction
This report outlines the process of linking mortality and cancer registration records
from the years 2006 to 2011 to the 2006 Census data. In previous cohorts, only
mortality records were linked to census data, however for the 2006-2011 cohort it
was more efficient to combine the mortality and cancer registrations in the one
dataset and link these to the census. This report is a short technical report, where
much of the methods and theory can be found in previous NZCMS and/or
CancerTrends technical reports (see: www.uow.otago.ac.nz/nzcms-info.html or
www.uow.otago.ac.nz/cancertrends-info.html for the reports).
The objectives of this report are to:
1. Describe the process of linking mortality and cancer registration records to
the census data.
2. Describe the calculation of separate mortality and cancer ‘unlock ratios’ to
correct for numerator-denominator bias caused by the numerator and
denominator derived from different data sources.
3. Describe the calculation of separate mortality and cancer ‘linkage weights’ to
allow for incomplete record linkage between the 2006 census data and the
corresponding 2006-2011 mortality and cancer records.
4. Describe the investigation of possibly including ‘migration adjustors’ to
possibly take account of the effect of migration bias.
Data and analyses from this report contribute to the existing literature on linkage
bias and the numerator-denominator bias in New Zealand census and mortality and
cancer registration records. Previous technical documentation for the census and
mortality linkage include Blakely, Salmond and Woodward (1999); Blakely and
Atkinson (2001); Hill, Atkinson and Blakely (2002); Ajwani, Blakely, Robson, Atkinson,
Fawcett and Kiro (2002); Fawcett, Blakely and Atkinson (2002); Ajwani, Blakely,
Robson, Tobias and Bonne (2003); Fawcett, Atkinson, Herd and Blakely (2008); Tan,
Blakely and Atkinson (2010). All NZCMS reports are available at the website:

12
www.uow.otago.ac.nz/nzcms-info.html. Previous technical documentation for the
census and cancer registration linkage include Atkinson, Shaw, Blakely, Stanley and
Sloane (2010). All CancerTrends reports are available at the website:
www.uow.otago.ac.nz/cancertrends-info.html.
The numbers in the tables have been random rounded base 3 as per usual SNZ
protocols and the minimum cell size reported has been rounded to 6.

13
PROCESS OF RECORD LINKAGE
The 2006-2011 mortality and cancer registration cohort was linked to the 2006
census dataset, using an anonymous and probalistic linkage process. Mortality and
cancer registrations in this five-year period were linked to the individual census
records of the 2006 census. The process of record linkage is briefly covered in this
report. The theory and methods of the record linkage can be found in previous
published technical reports for the NZCMS and CancerTrends studies (NZCMS - Hill,
Atkinson et al (2002); Fawcett, Atkinson et al (2008); Tan, Blakely and Atkinson
(2010) and CancerTrends - Atkinson, Shaw, et al (2010)).
All of the mortality or cancer registration record linkages (1981 to 2006) have used
variants of the same software to do the matching, however the product name and
versions have changed over time. The 2006-2011 linkage process used the product
called IBM InfoSphere DataStage and QualityStage DesignerTM. June Atkinson was
seconded into Statistics New Zealand to prepare the datasets and conduct the
linkage.
We combined both the mortality information and the cancer registry information
together into the one file for linking with the census file. This would not have
influenced any linkage outcome and was more efficient than conducting two
separate linkages. An additional benefit is that for cancer analyses we now know
when a person died, regardless of if they had cancer or not and therefore our person
time calculations can be more accurate (previously if they did not have cancer we
would have assumed that they lived for the whole follow-up period). Also we can
now use the cause of death in any cancer analyses (previously we just had their date
of death in the dataset).
We included extra mortality records for March to December 2011 in the file for
linkage in case we would include them in our analyses but decided later to exclude

14
them because we did not have the corresponding Cancer Registration files. It was
tidier to use five years of follow-up for our analyses.
Variables for matching were the same as in the previous cohorts except there was
now an addition of a MELAA ethnicity variable (Middle Eastern, Latin American or
African).
SAS was again used as an interface and to investigate possible cut-off values for
accepting links. Appendix C gives the full SAS program used for the process.
Appendix D contains the match specification details of the first three meshblock
passes.
Figure 1 shows a screenshot of QualityStage after successfully running the three
meshblock passes and the four area unit passes.
Table 1: QualityStage Pass details
Pass Number Block Variable Cut-off Value
1 Meshblock option 1 16.0
2 Meshblock option 2 16.0
3 Meshblock option 3 16.0
4 Area Unit option 1 with sex 15.0 (lower weight as sex is now a blocking variable)
5 Area Unit option 2 with sex 15.0
6 Area Unit option 3 with sex 15.0
7 Area Unit option 4 with sex 15.0
8 Meshblock option 1 No cut-off but processed in SAS for clerical review
9 Meshblock option 2 No cut-off but processed in SAS for clerical review
10 Meshblock option 3 No cut-off but processed in SAS for clerical review
11 Meshblock option 4 No cut-off but processed in SAS for clerical review
12 Area Unit option 1 with sex No cut-off but processed in SAS for clerical review
13 Area Unit option 2 with sex No cut-off but processed in SAS for clerical review
14 Area Unit option 3 with sex No cut-off but processed in SAS for clerical review
15 Area Unit option 4 with sex No cut-off but processed in SAS for clerical review
16 Area Unit option 5 with sex No cut-off but processed in SAS for clerical review
17 Area Unit option 6 with sex No cut-off but processed in SAS for clerical review

15
18 Area Unit option 7 with sex No cut-off but processed in SAS for clerical review
19 Area Unit option 8 with sex No cut-off but processed in SAS for clerical review
20 Area Unit option 1 (no sex block) No cut-off but processed in SAS for clerical review

16
Figure 1: Screenshot of QualityStage after running meshblock passes 1 to 3 and area unit passes 1 to 4.

17
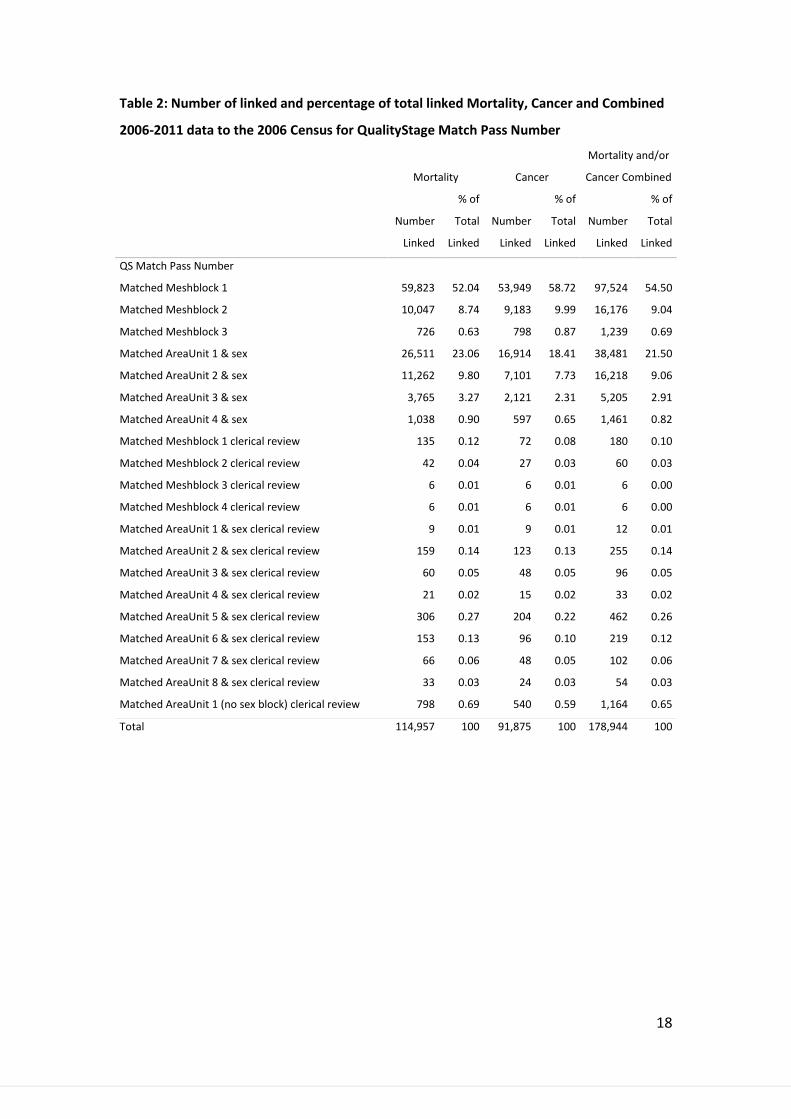
The following tables show the linkage statistics for looking at the mortality records,
at the cancer registration records, and looking at the combined records that could
contain mortality and/or cancer registration records.
In previous census-linkages, we were able to set the cut-off at the meshblock passes
using a duplicate method (Blakely and Salmond (2002)). However, the version of
QualityStage software used for the latest linkages now makes it difficult to extract
the number of duplicate pairs (i.e. one mortality or cancer record linked to two or
more census records). Given this issue, we were initially conservative at accepting
links at the meshblock passess. On the initial area unit passes, however, many of
these same ‘marginal’ links were again present with no duplicates, suggesting a high
probability of being true links. They were accepted, and this explains why the
percentage of links accepted at the initial area unit passes is higher than in previous
years and why about a third of all links were found using area unit as the blocking
variable.
Second, in the absence of being able to formally use the duplicate method, we could
not calculate PPVs (positive predictive values; the proportion of accepted links that
are expected to be true links). However, we have developed extensive experience
with these estimations in past linkages where we attempted to ensure that the
marginal PPV (i.e. that at the cut-off itself, not the average above the cut-off) was
80% or greater in the area unit passes. We applied these learnings (e.g. the
combinations of matching variables by block variable) from previous linkages to the
2006-2011 linkage, and therefore by extension estimate that the overall PPV (i.e. all
links) is probably in excess of 98%.
The SAS code related to the QualityStage Matching Process is available in Appendix
C.
18
Table 2: Number of linked and percentage of total linked Mortality, Cancer and Combined
2006-2011 data to the 2006 Census for QualityStage Match Pass Number
Mortality Cancer
Mortality and/or
Cancer Combined
Number
Linked
% of
Total
Linked
Number
Linked
% of
Total
Linked
Number
Linked
% of
Total
Linked
QS Match Pass Number
59,823 52.04 53,949 58.72 97,524 54.50 Matched Meshblock 1
Matched Meshblock 2 10,047 8.74 9,183 9.99 16,176 9.04
Matched Meshblock 3 726 0.63 798 0.87 1,239 0.69
Matched AreaUnit 1 & sex 26,511 23.06 16,914 18.41 38,481 21.50
Matched AreaUnit 2 & sex 11,262 9.80 7,101 7.73 16,218 9.06
Matched AreaUnit 3 & sex 3,765 3.27 2,121 2.31 5,205 2.91
Matched AreaUnit 4 & sex 1,038 0.90 597 0.65 1,461 0.82
Matched Meshblock 1 clerical review 135 0.12 72 0.08 180 0.10
Matched Meshblock 2 clerical review 42 0.04 27 0.03 60 0.03
Matched Meshblock 3 clerical review 6 0.01 6 0.01 6 0.00
Matched Meshblock 4 clerical review 6 0.01 6 0.01 6 0.00
Matched AreaUnit 1 & sex clerical review 9 0.01 9 0.01 12 0.01
Matched AreaUnit 2 & sex clerical review 159 0.14 123 0.13 255 0.14
Matched AreaUnit 3 & sex clerical review 60 0.05 48 0.05 96 0.05
Matched AreaUnit 4 & sex clerical review 21 0.02 15 0.02 33 0.02
Matched AreaUnit 5 & sex clerical review 306 0.27 204 0.22 462 0.26
Matched AreaUnit 6 & sex clerical review 153 0.13 96 0.10 219 0.12
Matched AreaUnit 7 & sex clerical review 66 0.06 48 0.05 102 0.06
Matched AreaUnit 8 & sex clerical review 33 0.03 24 0.03 54 0.03
Matched AreaUnit 1 (no sex block) clerical review 798 0.69 540 0.59 1,164 0.65
Total 114,957 100 91,875 100 178,944 100

19
Table 3: Number of linked and percentage of total linked Mortality, Cancer and Combined
2006-2011 data to the 2006 Census for QualityStage Match Group
Mortality Cancer
Mortality and/or
Cancer Combined
Number
Linked
% of
Total
Linked
Number
Linked
% of
Total
Linked
Number
Linked
% of
Total
Linked
QS Match Group
576 0.50 390 0.42 867 0.48
Area Unit, Clerical Review, High Weights (>=15 or
>=16)
Area Unit, Clerical Review, Medium Weights (>=12 or
>=13) 1,029 0.90 714 0.78 1,530 0.86
Area Unit, High Weights (>=15) 42,576 37.04 26,730 29.10 61,365 34.29
Meshblock, Clerical Review, High Weights (>=16) 33 0.03 21 0.02 48 0.03
Meshblock, Clerical Review, High Weights (>=13) 147 0.13 81 0.09 198 0.11
Meshblock, High Weights (>=16) 70,596 61.41 63,933 69.59 114,936 64.23
Table 4: Linkage and Unlock status
Mortality Cancer
N % N %
Linkage Status For Unlock
24,207 17.39 22,608 19.75 Not Linked No
Linked No 3,540 2.54 2,013 1.76
Yes 111,414 80.06 89,859 78.49
Table 5: Unlock status by QualityStage Match Group
Mortality For Unlock Cancer For Unlock
No Yes No Yes
N
Column
% N
Column
% N
Column
% N
Column
%
QS Match Group
60 1.69 516 0.46 54 2.67 336 0.37
Area Unit, Clerical Review, High
Weights (>=15 or >=16)
Area Unit, Clerical Review,
Medium Weights (>=12 or >=13) 1,005 28.37 24 0.02 525 26.00 192 0.21

20
Mortality For Unlock Cancer For Unlock
No Yes No Yes
N
Column
% N
Column
% N
Column
% N
Column
%
Area Unit, High Weights (>=15) 1,296 36.58 41,280 37.05 645 31.95 26,088 29.03
Meshblock, Clerical Review, High
Weights (>=16) 33 0.93 6 0.01 21 1.04 6 0.01
Meshblock, Clerical Review, High
Weights (>=13) 144 4.06 6 0.01 72 3.57 12 0.01
Meshblock, High Weights (>=16) 1,005 28.37 69,591 62.46 702 34.77 63,228 70.36
Linkage Bias
Linkage bias occurs when there are systematic differences by socio-demographic
factors, such as age and deprivation, between linked and unlinked mortality and
cancer registration records with census records. For detail on linkage bias refer to
the previous NZCMS technical report (Tan, Blakely and Atkinson (2010)) and
CancerTrends technical report (Atkinson, Shaw et al (2010)).
To compensate for linkage bias, it is necessary to calculate weights that adjust for
the misclassification of mortality and/or cancer registration outcome.
The 2006-2011 mortality dataset included the following variables:
1. Age group (note the age was capped at 97 years)
2. Prioritised ethnicity i.e. Maori, Pacific, Asian and
NonMaoriNonPacificNonAsian (nonMPA)
3. Gender
4. Territorial Local Authorities (TA) Cluster
5. Death months since Census
6. Level of mobility in area (% of area unit residents that had moved since the
2006 census)
7. International Cause of Death (ICD) Group
8. NZ Deprivation Index quintiles
9. Rurality

21
The 2006-2011 cancer registration dataset included the following variables:
1. Age group (note the age was capped at 97 years)
2. Prioritised ethnicity i.e. Maori, Pacific, Asian and
NonMaoriNonPacificNonAsian (nonMPA)
3. Gender
4. Cancer registration months since Census
5. Level of mobility in area (% of area unit residents that had moved since the
2006 census)
6. Territorial Local Authorities (TA) Cluster
7. NZ Deprivation Index two groups
The overall percentage of deaths linked for the 2006-2011 cohort was 82.61% for
mortality and 80.25% for cancer. The mortality proportion is more than the overall
percentage of deaths linked for the previously combined years of 2001-2004 and
2004-2006, which was 80.81%. The cancer proprortion is less than the overall
percentage of linked cancer registrations in the 2001-2004 cohort of 82%.
Table 6 shows the number and percentage of linked and non-linked mortality and
cancer registration datasets, 2006-2011.
Table 6: Number and percentage of linked and non-linked Total, Mortality and Cancer
Registrations for the 2006-2011 datasets
Mortality Cancer
Mortality and/or Cancer
Combined
N % N % N %
Linkage Status
24,207 17.39 22,608 19.75 41,388 18.78 Non Linked
Linked 114,957 82.61 91,875 80.25 178,944 81.22
Total 139,164 100.00 114,483 100.00 220,332 100.00

22
WEIGHTING OF MORTALITY AND CANCER
REGISTRATION RECORDS
As only a proportion of the mortality and cancer registration records are linked to
their respective census record, weighting the number of linked mortality and cancer
registration records in each stratum allows the number of deaths and cancer
registrations in those stratum to be estimated. Detailed linkage weight calculations
for the linked and unlinked cohort records can be found in the previous NZCMS
technical report (Tan, Blakely and Atkinson (2010)).
Originally for 2006/11, exactly the same method of calculating linkage and unlock
weights was used as described for 2004/06. However after completing this, it was
noticed that some linked records were being given weights less than one which they
should not have. This was due to application of weights calculated at one level of
stratification being applied to subsidiary strata. Therefore, all linkage weights for
2001/06 and 2006/11, and unlock weights for 2006/11 were redone with an
additional step included in each loop of checking minimum and maximum weights
and combining linked strata if otherwise they had a weight less than one or similarly
combining non-linked strata if otherwise they had a weight greater than one. Full
details of the new procedures and SAS programs are available from the authors and
a short explanatory note explaining the new procedure will be placed on the website
- www.uow.otago.ac.nz/nzcms-info.html.
Linkage weights were calculated separately for strata based on the
sociodemographic variables that were predictors of linkage in the regression
analyses:
Mortality linkage weights were derived within strata of these variables:
1. Age group
2. Prioritised ethnicity

23
3. Gender
4. TA Cluster
5. Death months since Census
6. Mobility
7. ICD Group
8. NZ Deprivation Index quintiles
9. Rurality
These variables created a number of non zero strata, with the majority of linked
records meeting the acceptance criteria at the most detailed level. Details are
available from the authors.
Cancer registration linkage weights were derived with the strata variables:
1. Age group
2. Prioritised ethnicity
3. Gender
4. Cancer registration months since Census
5. Mobility
6. TA Cluster
7. NZ Deprivation Index two groups
These variables created a number of non-zero strata, with the majority of linked
records meeting the acceptance criteria at the most detailed level. Details are
available from the authors.
Territorial Authorities (TAs)
Cluster analysis was used to group TAs systematically, based on the beta values
obtained from the regression analysis. See the previous NZCMS technical report
(Tan, Blakely and Atkinson (2010)) for more detail.

24
The optimal number of TA clusters found for mortality linkage weights was nine.
These were as follows:
Table 7: TA clusters for Mortality linkage weights
Cluster Name TA
CL10 Ashburton, Buller, Westland, Whakatane, Kapiti Coast, New Plymouth, Invercargill, Waipa,
Taupo, Waimakariri, North Shore, Waitakere
CL11 Carterton, Rodney, Porirua, Lower Hutt, Queenstown-Lakes, Kawerau, Mackenzie
CL13 Selwyn, Waitomo, Hastings (includes Chatham Islands), South Taranaki, Central Otago,
Stratford, Hauraki, Tasman, Tararua, Upper Hutt, Hamilton
Waikato
CL14 Kaikoura, Wanganui, Otorohanga Tauranga, Manukau
CL16 Horowhenua, Ruapehu, Papakura, Rotorua, Opotiki, Thames Coromandel, Timaru, Franklin,
Nelson, Marlborough
CL18 Masterton, Wairoa, Christchurch, South Waikato, Southland, Matamata-Piako, Dunedin
CL24 Napier, Palmerston North, South Wairarapa, Rangitikei, Western Bay of Plenty
CL30 Clutha, Grey
CL9 Auckland, Central Hawkes Bay, Waimate, Waitaki, Hurunui, Whangarei, Gisborne, Gore,
Manawatu, Wellington, Kaipara, Far North
The optimal number of TA clusters found for cancer registration linkage weights was
ten. These were as follows:
Table 8: TA clusters for Cancer linkage weights
Cluster Name TA
CL10 Opotiki, Southland, Grey, Western Bay of Plenty, Clutha, Ruapehu,
Central Hawkes Bay, Horowhenua, Matamata-Piako, Christchurch,
Whangarei
CL11 Far North, Wairoa, Westland, Kaipara
CL12 Otorohanga, Upper Hutt, Mackenzie, South Waikato, Manawatu,
Stratford, Invercargill, Selwyn, North Shore, Tauranga, Taupo,
Masterton, Kapiti Coast
CL13 Buller, Waimakariri, South Wairarapa, Waitakere, Ashburton, Hauraki,
Porirua, Lower Hutt
CL14 Kawerau, Waipa, New Plymouth, Rangitikei, Central Otago, Franklin,
Papakura, Thames Coromandel, Hamilton, Rotorua, Whakatane,
Hurunui, South Taranaki, Nelson,
CL17 Gisborne, Malborough, Gore, Hastings, Queenstown-Lakes, Tararua,
Tasman, Dunedin
25
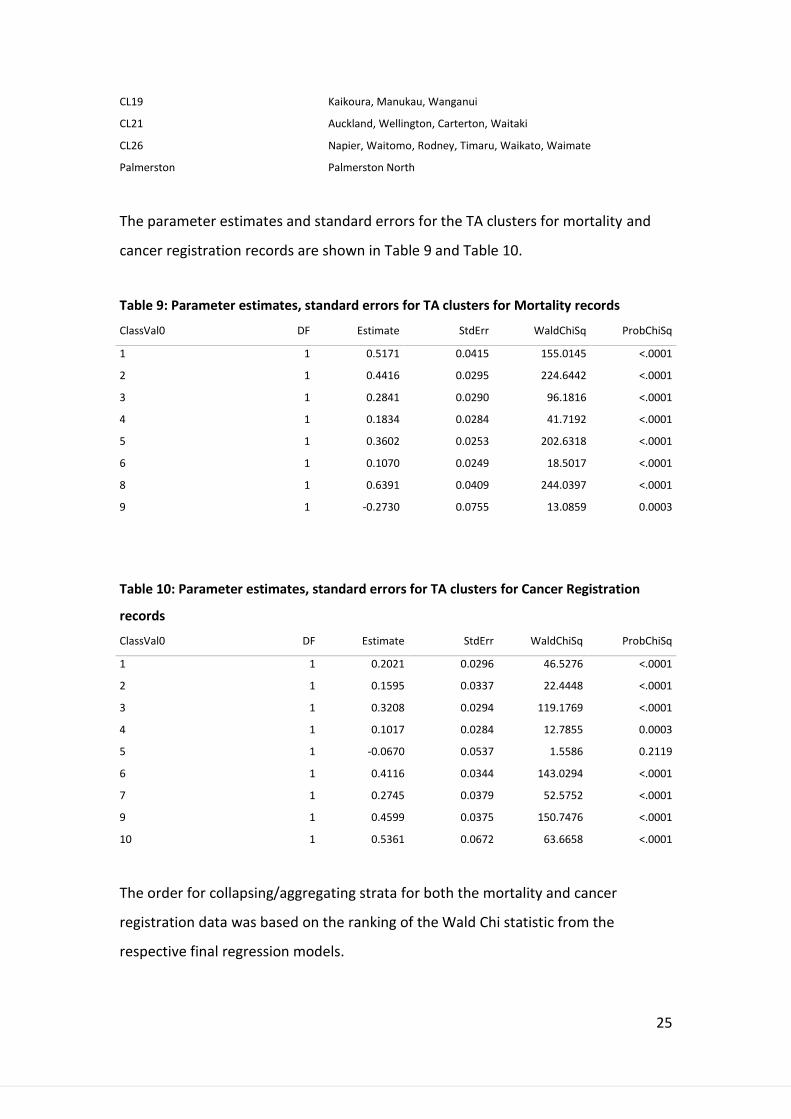
CL19 Kaikoura, Manukau, Wanganui
CL21 Auckland, Wellington, Carterton, Waitaki
CL26 Napier, Waitomo, Rodney, Timaru, Waikato, Waimate
Palmerston Palmerston North
The parameter estimates and standard errors for the TA clusters for mortality and
cancer registration records are shown in Table 9 and Table 10.
Table 9: Parameter estimates, standard errors for TA clusters for Mortality records
ClassVal0 DF Estimate StdErr WaldChiSq ProbChiSq
1 1 0.5171 0.0415 155.0145 <.0001
2 1 0.4416 0.0295 224.6442 <.0001
3 1 0.2841 0.0290 96.1816 <.0001
4 1 0.1834 0.0284 41.7192 <.0001
5 1 0.3602 0.0253 202.6318 <.0001
6 1 0.1070 0.0249 18.5017 <.0001
8 1 0.6391 0.0409 244.0397 <.0001
9 1 -0.2730 0.0755 13.0859 0.0003
Table 10: Parameter estimates, standard errors for TA clusters for Cancer Registration
records
ClassVal0 DF Estimate StdErr WaldChiSq ProbChiSq
1 1 0.2021 0.0296 46.5276 <.0001
2 1 0.1595 0.0337 22.4448 <.0001
3 1 0.3208 0.0294 119.1769 <.0001
4 1 0.1017 0.0284 12.7855 0.0003
5 1 -0.0670 0.0537 1.5586 0.2119
6 1 0.4116 0.0344 143.0294 <.0001
7 1 0.2745 0.0379 52.5752 <.0001
9 1 0.4599 0.0375 150.7476 <.0001
10 1 0.5361 0.0672 63.6658 <.0001
The order for collapsing/aggregating strata for both the mortality and cancer
registration data was based on the ranking of the Wald Chi statistic from the
respective final regression models.
26
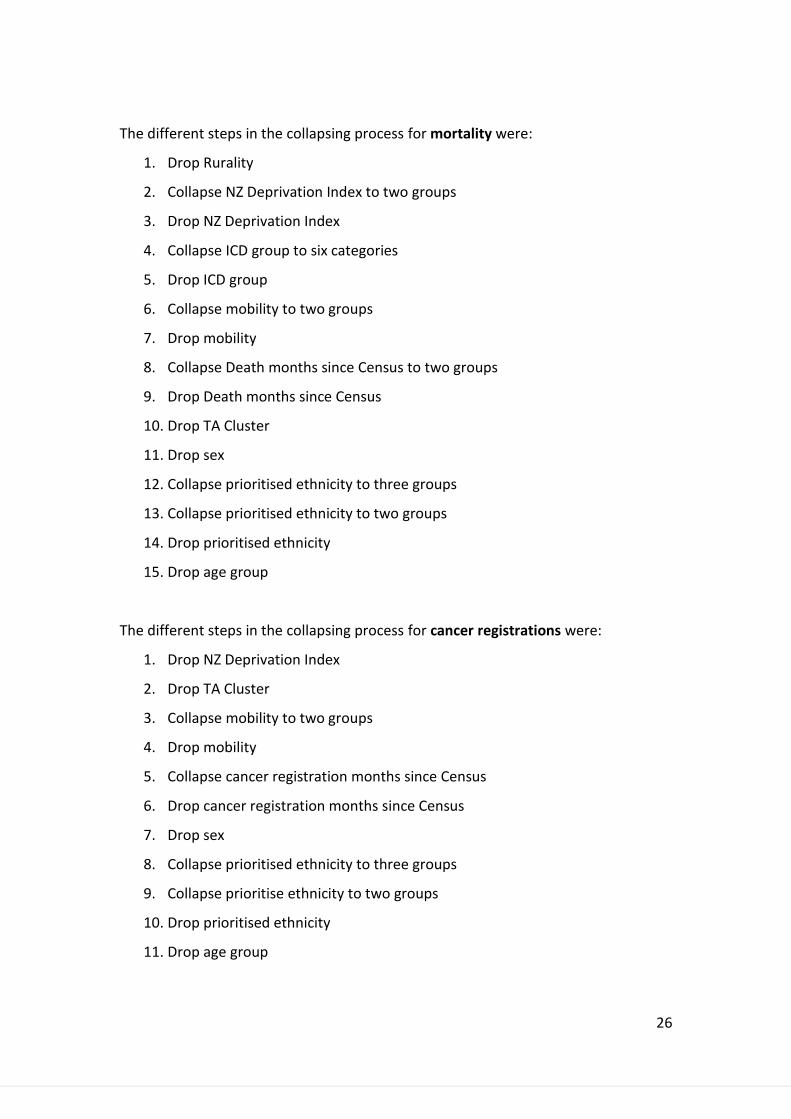
The different steps in the collapsing process for mortality were:
1. Drop Rurality
2. Collapse NZ Deprivation Index to two groups
3. Drop NZ Deprivation Index
4. Collapse ICD group to six categories
5. Drop ICD group
6. Collapse mobility to two groups
7. Drop mobility
8. Collapse Death months since Census to two groups
9. Drop Death months since Census
10. Drop TA Cluster
11. Drop sex
12. Collapse prioritised ethnicity to three groups
13. Collapse prioritised ethnicity to two groups
14. Drop prioritised ethnicity
15. Drop age group
The different steps in the collapsing process for cancer registrations were:
1. Drop NZ Deprivation Index
2. Drop TA Cluster
3. Collapse mobility to two groups
4. Drop mobility
5. Collapse cancer registration months since Census
6. Drop cancer registration months since Census
7. Drop sex
8. Collapse prioritised ethnicity to three groups
9. Collapse prioritise ethnicity to two groups
10. Drop prioritised ethnicity
11. Drop age group

27
The SAS code for stratification and collapsing of strata is available upon request.

28
Weighting of Linked Records within ‘Acceptable’ Strata
For the method of calculating weighting of linked mortality and cancer registration
records please see the NZCMS technical report (Tan, Blakely and Atkinson (2010)),
plus the explanatory note of the amendment to the method which will be available
from the authors and placed on the website - www.uow.otago.ac.nz/nzcms-
info.html.
Although the mortality and the cancer registration data was combined for the
linkage process, there may be differences in the linkage rates between census and
mortalitiy/cancer data by strata, and therefore separate weights for mortality
records and cancer registration records needed to be calculated and the relevant
one should be used in any analyses of the data.
Table 11 show the distribution of linkage weights for linked mortality and cancer
registration records. The linkage weights, when applied in future analyses of data,
will weight up the linked deaths/cancers such that they represent the estimated true
number of deaths/cancers for each socio-deomgraphic strata, removing (nearly all
of) the misclassification bias of the death/cancer outcome introduced by imperfect
sensitivity of the record linkage to determine death/cancer status.

29
Table 11: Distribution of linkage weights for linked Mortality and Cancer Registration
records
W_AgEthAdj Mortality W_AgEthAdjCancer
Frequency 114,954 91,872
Mean 1.211 1.246
StdDev 0.159 0.222
Minimum 1.000 1.000
Maximum 2.720 5.710
P1 1.000 1.000
P5 1.000 1.008
P10 1.000 1.056
P25 1.133 1.107
P50 1.198 1.190
P75 1.278 1.318
P90 1.370 1.500
P95 1.476 1.691
P99 1.812 2.078

30
Weighting of Non-Linked Census Records
As per the previous 2001-2004 and 2004-2006 cohorts, linked census-mortality and
cancer registration records only account for approx 1% of the total number of census
records. Therefore weighting of non-linked weights occurred. Non-linked weights
were derived from detailed strata - no acceptance testing or collapsing of strata was
performed. For more information about the weighting of non-linked census records
see the previous NZCMS technical report (Tan, Blakely and Atkinson (2010)), plus the
new explanatory note.
The same strata variables were used for deriving both the mortality and cancer
registration non-linked weights, these were as follows:
1. Age group
2. Prioritised ethnicity
3. Gender
4. Mobility
5. NZ Deprivation Index
6. Rurality

31
MIGRATION ADJUSTMENTS
As seen in previous years, the mortality rates were dropping more than expected for
Pacific people in the five years following the census. One explanation for this is that
Pacific people about to die are likely to return to their country of birth, and thus we
do not have their mortality record. Put another way, the sensitivity of the linkage to
ascertain ‘true’ deaths would diminish over time, biasing down Pacific rates with
increasing time since census night. If this is true, then a sudden increase in
‘observed’ mortality would occur in 2006/07 (compared to 2005/06). Due to the
NZCMS being a closed cohort, with no ability to censor census respondents when
they emigrate (and not being able to link NZCMS data to immigration data), deaths
amongst these census respondents who subsequently emigrate are not observed.
This likely bias affects comparisions of mortality rates over time. Refer to the
previous NZCMS technical report (Tan, Blakely and Atkinson (2010)) for more detail
regarding this.
To check whether emigration effects the comparision of mortality rates we
calculated all-cause mortality incidence rates for people <75 years of age by single
year of follow-up for 1996-1998, 2001-2006, 2006-2011 by ethnicity (Maori, Pacific,
Asian, nonMaoriPacificAsian, nonMaori and also splits of Pacific and/or Asian). This
was calculated overall and by age groups, country of birth and year of New Zealand
residency.
Figure 2 through

32
Figure 7 show the standardised rates for all-exposure and country of birth for <75
year olds. The all-cause mortality 1996-2011 results by single year can be found in
Appendix A.
The figures possibly show a kick-up in mortality among non-New Zealand born Pacific
people from 2005/06 to 2006/07. This could be consistent with increasing (post
census night) migration of Pacific people back to their country of birth, and therefore
a bias to missing deaths that increases with time post census. However, it is subtle if
occurring. We will probably just present Pacific mortality rates by 2.5 year periods in
the 2001/02 to 2010/11 period, and state that there may be some underestimation
for the second and fourth 2.5 year periods. We will also undertake regression
analyses to test whether any 'jump' in (observed) mortality rates from 2005/06 to
2006/07 is statistically significant.

33
Figure 2: All-Cause Mortality <75 years All Data for NZMaori, Pacific, nonMPA and Asian by
sex
All-Cause Mortality <75 yrs All Data
Sta
ndard
ised R
ate
s
Asian
nonMPA
NZ Mäori
Pacific
Females
AsiannonMPA
NZ Mäori
Pacific
Males
1996/97 1998/01 2000 2002/03 2004/05 2006/07 2008/09 2010/11
Single Year of Follow-up
0
500
1000
1500
0
500
1000
1500

34
Figure 3: All-Cause Mortality <75 yrs Born for NZMaori, Pacific and nonMPA by sex
All-Cause Mortality <75 yrs Born NZS
tandard
ised R
ate
s
AsiannonMPA
NZ Mäori
Pacific
Females
AsiannonMPA
NZ Mäori
Pacific
Males
1996/97 1998/01 2000 2002/03 2004/05 2006/07 2008/09 2010/11
Single Year of Follow-up
0
500
1000
1500
0
500
1000
1500

35
Figure 4: All-Cause Mortality <75 years Not NZ born for Pacific, nonMPA and Asian by sex
All-Cause Mortality <75 yrs Not NZ BornS
tandard
ised R
ate
s
Asian
nonMPA
Pacific
Females
AsiannonMPA
NZ Mäori
Pacific
Males
1996/97 1998/01 2000 2002/03 2004/05 2006/07 2008/09 2010/11
Single Year of Follow-up
0
500
1000
1500
0
500
1000
1500

36
Figure 5: All-Cause Mortality <75 years All Data for NZMaori, Pacific and nonMPA by sex
All-Cause Mortality <75 yrs All Data
Asian females
Asian malesnonMPA females
nonMPA males
NZ Mäori females
NZ Mäori males
Pacific females
Pacific males
All Data
1996/97 1998/01 2000 2002/03 2004/05 2006/07 2008/09 2010/11
Single Year of Follow-up
0
500
1000
1500
Sta
ndard
ised R
ate
s

37
Figure 6: All-Cause Mortality <75 years NZ Born for NZMaori, Pacific and nonMPA by sex
All-Cause Mortality <75 yrs Born NZ
Asian females
Asian males
nonMPA females
nonMPA males
NZ Mäori females
NZ Mäori males
Pacific females
Pacific males
Born NZ
1996/97 1998/01 2000 2002/03 2004/05 2006/07 2008/09 2010/11
Single Year of Follow-up
0
500
1000
1500
Sta
ndard
ised R
ate
s
38
Figure 7: All-Cause Mortality <75 years Not NZ Born for Pacific, nonMPA and Asian by sex
All-Cause Mortality <75 yrs Not NZ Born
Asian females
Asian malesnonMPA females
nonMPA males
NZ Mäori males
Pacific females
Pacific males
Not NZ Born
1996/97 1999 2002/03 2005/06 2008/09 2011
Single Year of Follow-up
0
500
1000
1500
Sta
ndard
ised R
ate
s

39
UNLOCK RATIOS FOR 2006-2011
Unlock ratios are the adjustment ratios used to correct for the numerator-
denominator bias in the calculation of ethnic-specific mortality and cancer
registration rates. For more detail on unlock ratios refer to the previous NZCMS
Technical Report (Tan, Blakely and Atkinson (2010)), and to a publication likely to
appear soon in the NZMJ (Boyd, Atkinson and Blakely (under review)).
Ethnicity could be classified using one of three definitions:
1) TOTAL:
An individual was assigned as Māori if any ethnic group identified on the
census or mortality record was Māori. The same was done for Pacific, Asian,
nonMPA ethnicities; individuals could be assigned multiple ethnic groups and
consequently the sum of counts across ethnic groups will be greater than
actual number of decedents.
2) PRIORITISED:
An individual was assigned as Māori if any of the three possible self-identified
ethnicity responses was Māori. For non-Māori, an individual was assigned as
Pacific if one of the self-identified ethnic groups was Pacific. For non-Māori
non-Pacific, an individual was assigned as Asian if one of the self-identified
ethnic groups was Asian. The remaining individuals were assigned as nonMPA
(equivalent to sole nonMPA).
3) SOLE:
An individual was assigned as Māori if Māori was the only ethnic group self
identified. Similarly, an individual was assigned as Pacific or Asian if it was the
only self-identified ethnic group. All others were assigned as non-Māori non-
Pacific non-Asian (nonMPA). The nonMPA group also included some extra
decedents that, for example, self-identified multiple ethnic groups.

40
Weighting of Unlock Dataset to represent all Mortality
Records
As with the linkage weights, unlock weights were calculated using the same method
as the 2004-2006 NZCMS update (Tan, Blakely and Atkinson (2010)). A stepwise
logistic regression model was used to determine significant predictors of Highly
Probable Links (HPL) linkage. Age group, prioritised ethnicity, sex and an age group
by sex interaction term were forced into each model. All other predictor variables
were determined by the stepwise algorithm assuming a 5% entry level. The Wald
Chi-square statistics were used to determine the order of collapse of the original
strata. Unlock strata were considered acceptable if the following criteria were met:
1. Not down to the final three collapses AND Strata has at least three HPL links
AND derived weight for current strata is less than two OR,
2. Down to the final three collapses AND Strata has at least three HPL links, OR
3. No further collapse is possible
4. HPL links did not have a weight less than 1.0
For more detail on the methods for calculating unlock linkage weights, see the
previous NZCMS technical report (Tan, Blakely and Atkinson (2010)), and the new
explanatory note of the amendment to the method on the website -
www.uow.otago.ac.nz/nzcms-info.html.
Mortality unlock weights were derived with the following strata variables:
1. Age group
2. Prioritised ethnicity
3. Gender
4. Mobility
5. ICD Group
6. RHA
7. NZ Deprivation Index

41
The order of collapsing of strata variables for mortality was as follows:
1. Collapse NZ Deprivation Index to quintiles
2. Collapse NZ Deprivation Index to two groups
3. Drop NZ Deprivation Index
4. Drop RHA
5. Collapse ICD group to six categories
6. Drop ICD group
7. Collapse mobility to two groups
8. Drop mobility
9. Drop sex
10. Collapse prioritised ethnicity to three groups
11. Collapse prioritised ethnicity to two groups
12. Drop prioritised ethnicity
13. Drop age group
Cancer registration unlock weights were derived with the follwing strata variables:
1. Age group
2. Prioritised ethnicity
3. Gender
4. Mobility
5. RHA
6. NZ Deprivation Index
The order of collapsing of strata variables for cancer registration was as follows:
0. Collapse NZ Deprivation Index to quintiles
1. Collapse NZ Deprivation Index to two groups
2. Drop NZ Deprivation Index
3. Drop RHA
4. Collapse mobility to two groups
5. Drop mobility

42
6. Drop sex
7. Collapse prioritised ethnicity to three groups
8. Collapse prioritised ehtncity to two groups
9. Drop prioritised ethnicity
10. Drop age group
The distribution of unlock weights for mortality can be seen in Table 12 and for
cancer registrations in Table 13.
Table 12: Distribution of the age and ethnicity adjusted unlock weight for the Mortality
(within 5 years) population, 2006-2011 cohort
W_AgeEthAdj_Unlock_Mort
Frequency 111,414
Mean 1.249
StdDev 0.207
Minimum 0.998
Maximum 3.979
P1 0.999
P5 1.000
P10 1.000
P25 1.106
P50 1.206
P75 1.343
P90 1.500
P95 1.660
P99 1.985

43
Table 13: Distribution of the age and ethnicity adjusted unlock weight for Cancer
Registration (within 5 years) population, 2006-2011 cohort
W_AgeEthAdj_Unlock_CT
Frequency 89,859
Mean 1.274
StdDev 0.237
Minimum 0.998
Maximum 5.737
P1 1.000
P5 1.076
P10 1.100
P25 1.143
P50 1.203
P75 1.313
P90 1.515
P95 1.750
P99 2.343
44
Unlock Ratios for Mortality and Cancer
Registration Data Compared to Census Data
The tables below show the number of deaths by census, mortality record and
National Health Index (NHI) and the number of those who identified as a particular
ethnicity by census, cancer registration and by NHI, using the total, prioritised and
sole ethnicity definitions (as stated above).
The New Zealand Census-Mortality Study (NZCMS) previously demonstrated
substantial undercounting of Māori and Pacific deaths on mortality data relative to
census data for the 1980s and 1990s. This ‘numerator-denominator’ bias had
markedly improved by 2006. This ethnic undercounting phenomenon has also been
demonstrated in the New Zealand Cancer Registry.
A ‘total’ definition of ethnicity showed the closest agreement between census and
the other data sources. The census to mortality ratios are close to 1.0 for Māori
(1.01), Pacific (0.98) and ‘non-Māori non-Pacific non-Asian’ people (0.98), but have
increased for Asian (1.05 compared to 0.99 in 2001). Census to Cancer Registry ratios
are also close to 1.0 for ‘non-Māori non-Pacific non-Asian’ people (1.03), and
dramatically improved for the other ethnicities when compared to 2001 (Māori 1.18
to 1.01, Pacific 1.11 to 0.97, Asian 1.15 to 1.08). This coincides with changes to the
way the Cancer Registry extracts ethnicity. There is an apparent pattern for residual
undercounting of Māori deaths and cancer registrations in DHBs with a low
proportion of Māori in their population.
With this analysis of 2006-11 mortality data, Cancer Registry data, and linked 2006
census records, we have demonstrated that the ‘total’ definition of ethnicity
continues to be the best method to use for alignment of health data and census data
ethnicity counts. That is, we recommend using total ethnicity counts on mortality

45
and Cancer Registry data when using census data as the denominator in the
calculation of rates to avoid numerator-denominator bias.
For more information about the classification of ethnicities and ethnicity groupings
refer to the previous NZCMS technical report (Tan, Blakely and Atkinson (2010)).
Table 14: Census Total Ethnicity by Mortality and NHI Total Ethnicity, 2006-2011
Total Ethnicity Census
Deaths
Mortality
Deaths
Census to
Mortality
Ratio
NHI
Deaths
Census to
NHI Ratio
Total NZ Mäori 13,686 13,527 1.01 12,684 1.08
Total Pacific 4,533 4,632 0.98 4,302 1.05
Total Asian 2,994 2,865 1.05 2,655 1.13
nonMPA (European/Other) 116,235 118,320 0.98 113,133 1.03
Missing 1,998 51 39.18 6,546 0.31
Total 139,143 139,143 139,143
Table 15: Census Total Ethnicity by Cancer Registration and NHI Total Ethnicity, 2006-2011
Total Ethnicity Census
Ethnicity
First Cancer
Register
Eth
Census to
Cancer
Ratio
NHI
Eth
Census to
NHI Ratio
Total NZ Mäori 10,497 10,431 1.01 9,729 1.08
Total Pacific 3,390 3,507 0.97 3,306 1.03
Total Asian 3,768 3,483 1.08 3,417 1.10
nonMPA (European/Other) 96,306 93,222 1.03 93,498 1.03
Missing 903 4,263 0.21 4,770 0.19
Total 114,498 114,498 114,498

46
Table 16: Census Prioritised Ethnicity by Mortality and NHI Prioritised Ethnicity, 2006-2011
Prioritised Ethnicity Census
Deaths
Mortality
Deaths
Census to
Mortality
Ratio
NHI
Deaths
Census to
NHI Ratio
Mäori 13,686 13,527 1.01 12,684 1.08
Pacific People 4,347 4,524 0.96 4,215 1.03
NonMäoriNonPac 119,115 121,041 0.98 115,701 1.03
Asian 2,880 2,721 1.06 2,565 1.12
NonMäoriNonPacNonAs 116,235 118,320 0.98 113,133 1.03
Missing 1,998 51 39.18 6,546 0.31
Total 139,143 139,143 139,143
Table 17: Census Prioritised Ethnicity by Cancer Registration and NHI Prioritised Ethnicity,
2006-2011
Prioritised Ethnicity Census
Ethnicity
First Cancer
Register Eth
Census to
Cancer
Ratio
NHI
Eth
Census to
NHI Ratio
Mäori 10,497 10,431 1.01 9,729 1.08
Pacific People 3,180 3,285 0.97 3,183 1.00
NonMäoriNonPac 99,918 96,513 1.04 96,813 1.03
Asian 3,612 3,294 1.10 3,315 1.09
NonMäoriNonPacNonAs 96,306 93,222 1.03 93,498 1.03
Missing 903 4,263 0.21 4,770 0.19
Total 114,498 114,498 114,498
Table 18: Census Sole Ethnicity by Mortality and NHI Sole Ethnicity, 2006-2011
Sole Ethnicity Census
Deaths
Mortality
Deaths
Census to
Mortality
Ratio
NHI
Deaths
Census to
NHI Ratio
Mäori 10,518 12,042 0.87 11,343 0.93
Pacific People 4,053 4,191 0.97 4,005 1.01
Asian 2,775 2,589 1.07 2,511 1.11
Remainder 121,800 120,327 1.01 121,287 1.00
Total 139,143 139,143 139,143
47
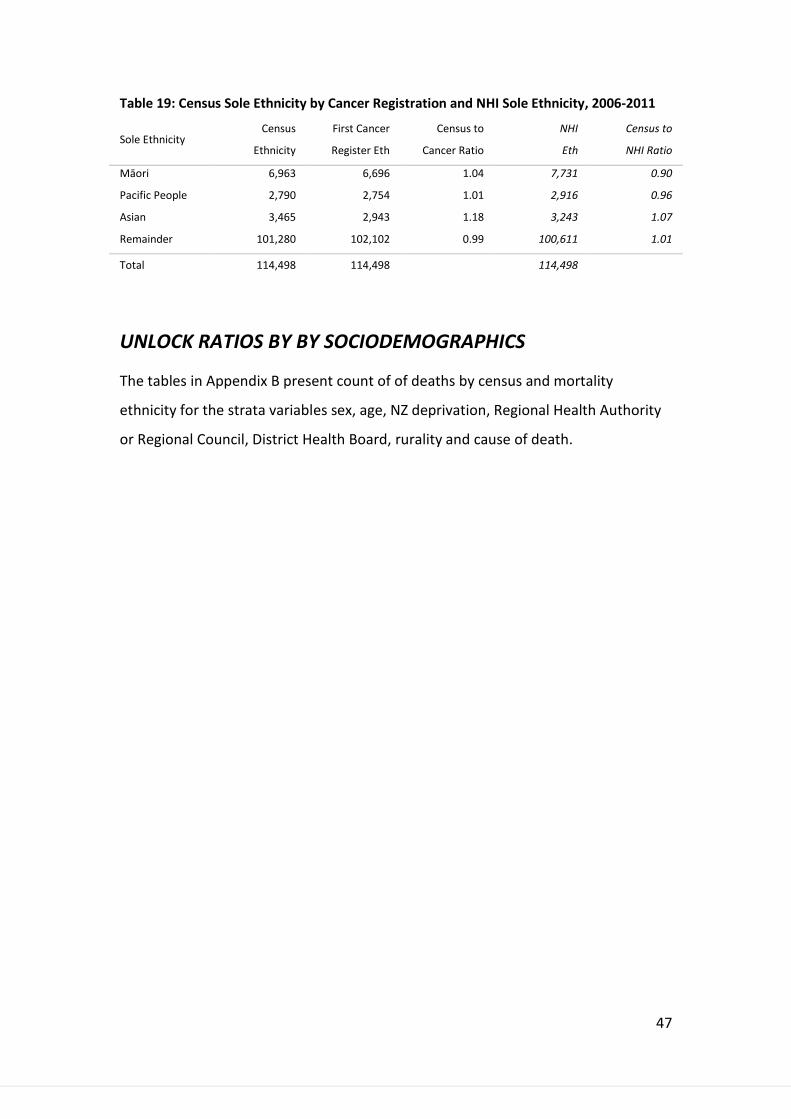
Table 19: Census Sole Ethnicity by Cancer Registration and NHI Sole Ethnicity, 2006-2011
Sole Ethnicity Census
Ethnicity
First Cancer
Register Eth
Census to
Cancer Ratio
NHI
Eth
Census to
NHI Ratio
Māori 6,963 6,696 1.04 7,731 0.90
Pacific People 2,790 2,754 1.01 2,916 0.96
Asian 3,465 2,943 1.18 3,243 1.07
Remainder 101,280 102,102 0.99 100,611 1.01
Total 114,498 114,498 114,498
UNLOCK RATIOS BY BY SOCIODEMOGRAPHICS
The tables in Appendix B present count of of deaths by census and mortality
ethnicity for the strata variables sex, age, NZ deprivation, Regional Health Authority
or Regional Council, District Health Board, rurality and cause of death.
48
Unlock Ratio Conclusions
These results generally resemble those obtained with the 2004-2006 unlock data, as
per the previous 2001-2004 unlock data. As before, there is little differences in the
census and mortality ethnicity counts when using Total and Prioritised Ethnicity
definitions. For a fuller interpretation, please see the paper Boyd, Atkinson and
Blakely (under review) which is also available from the authors.

49
References
Atkinson, J., Shaw, C., Blakely, T., Stanley, J., Sloane, K. (2010). Linkage of Census and
Cancer Registrations, 1981-2004. CancerTrends Technical Report No. 1. Wellington:
Department of Public Health, University of Otago, Wellington. (Available at
www.uow.otago.ac.nz/cancertrends-info.html).
Ajwani, S., Blakely, T., Robson, B., Atkinson, J., Fawcett, J., & Kiro, K. (2002).
Unlocking the Numerator-Denominator Bias for the 1980s and 1990s: NZCMS
Technical Report No. 4. Wellington: Department of Public Health, Wellington School
of Medicine and Health Sciences, University of Otago. (Available at
www.uow.otago.ac.nz/nzcms-info.html).
Ajwani, S., Blakely, T., Robson, B., Atkinson, J., & Kiro, C. (2004). Unlocking the
Numerator-Denominator Bias III: adjustment ratios by ethnicity for 1981-1999
mortality data. The New Zealand Census-Mortality Study. New Zealand Medical
Journal, 116, 6.
Ajwani, S., Blakely, T., Robson, B., Bonne, M., & Tobias, M. (2003). Decades of
Disparity: Ethnic mortality trends in New Zealand 1980-1999. Wellington: Ministry of
Health. (Available at www.uow.otago.ac.nz/nzcms-info.html).
Blakely, T. (2001). Socio-Economic Factors and Mortality Among 25-64 Year Olds: The
New Zealand Census-Mortality Study. Unpublished Doctorate, University of Otago.
(Available at www.uow.otago.ac.nz/nzcms-info.html).
— (2002). Anonymous and probabilistic linkage of census and mortality data: The
New Zealand Census-Mortality Study, New Zealand Conference on Database
Integration and Linked Employer-Employee Data. Wellington: Department of Labour.

50
Blakely, T., & Salmond, C. (2002). Probabilistic record linkage and a method to
calculate the positive predictive value. ije, 31, 1246-1252.
Blakely, T., Salmond, C., & Woodward, A. (1999). Anonymous record linkage of 1991
census records and 1991-94 mortality records: The New Zealand Census-Mortality
Study. Wellington: Department of Public Health, Wellington School of Medicine,
University of Otago. (Available at www.uow.otago.ac.nz/nzcms-info.html).
Boyd, M., Atkinson, J., & Blakely, T. Ethnic counts on mortality, NZ Cancer Registry
and census data: 2006-2011, NZMJ (under review).
Fawcett, J., Blakely, T., & Atkinson, J. (2002). Weighting the 81, 86, 91 & 96 census-
mortality cohorts to adjust for linkage bias. NZCMS Technical Report No. 5. (pp. 92).
Wellington: Department of Public Health, Wellington School of Medicine and Health
Sciences, University of Otago. (Available at www.uow.otago.ac.nz/nzcms-info.html).
Hill, S., Atkinson, J., & Blakely, T. (2002). Anonymous Record Linkage of Census and
Mortality Records: 1981, 1986, 1991,1996 Census Cohorts: NZCMS Technical Report
No 3. Wellington: Department of Public Health, Wellington School of Medicine and
Health Sciences, University of Otago. (Available at www.uow.otago.ac.nz/nzcms-
info.html).
Fawcett, J., Atkinson, J., Blakely, T. (2008) Record Linkage of Census and Mortality
2001-04 Records: New Zealand Census-Mortality Study Technical Report No. 6.
Wellington: Department of Public Health, University of Otago, Wellington. (Available
at www.uow.otago.ac.nz/nzcms-info.html).
Tan, L., Blakely, T., Tobias, M., Atkinson, J. Mortality by ethnic group to 2006: is
extending census-mortality linkage robust? NZ Med J 2012; 125(1357)

51
Appendix A
Table 20: All-Cause Mortality 1996-2011 results by single year for Māori Ethnicity, age <75
years, all data, by sex
By Variable Level Sex Single Year
of Follow-up StdRate
Person Time
(years) Deaths
All-Cause Mortality, <75 yrs Total NZ Mäori All Exposures
Total NZ Mäori All Data Males 1996/97 910 (846 - 973) 235,953.1 1293
1997/98 796 (736 - 855) 234,547.6 1101
1998/01 765 (708 - 823) 233,141.3 1086
2001/02 723 (671 - 776) 231,345.1 1068
2002/03 750 (697 - 804) 229,965.9 1095
2003/04 702 (651 - 753) 228,507.5 1065
2004/05 672 (623 - 722) 227,100.0 1029
2005/06 581 (536 - 626) 225,705.0 942
2006/07 669 (622 - 716) 251,381.7 1152
2007/08 631 (585 - 677) 249,783.2 1119
2008/09 592 (548 - 635) 248,278.0 1071
2009/10 572 (530 - 614) 246,685.3 1071
2010/11 499 (460 - 537) 245,114.8 972
Females 1996/97 580 (531 - 629) 247,682.8 852
1997/98 571 (523 - 619) 246,498.2 834
1998/01 473 (430 - 516) 245,347.0 717
2001/02 549 (506 - 592) 246,172.3 861
2002/03 500 (459 - 541) 244,921.6 789
2003/04 458 (419 - 496) 243,730.8 747
2004/05 486 (448 - 525) 242,513.4 834
2005/06 407 (372 - 442) 241,246.5 708
2006/07 427 (393 - 461) 269,824.2 828
2007/08 397 (365 - 429) 268,465.0 777
2008/09 415 (383 - 448) 267,074.2 837
2009/10 374 (344 - 405) 265,681.0 786
2010/11 371 (342 - 401) 264,308.3 813
52
Table 21: All-Cause Mortality 1996-2011 results by single year for Pacific Ethnicity, age <75
years, all data, by sex
By Variable Level Sex Single Year
of Follow-up StdRate
Person Time
(years) Deaths
All-Cause Mortality, <75 yrs Total Pacific All Exposures
Total Pacific All Data Males 1996/97 702 (606 - 798) 93,865.5 375
1997/98 626 (534 - 718) 93,431.9 309
1998/01 548 (466 - 631) 93,006.9 291
2001/02 571 (497 - 646) 104,258.2 345
2002/03 535 (464 - 607) 103,804.4 336
2003/04 523 (453 - 594) 103,283.0 330
2004/05 449 (385 - 512) 102,845.9 294
2005/06 437 (375 - 498) 102,370.8 297
2006/07 465 (404 - 525) 122,501.1 366
2007/08 411 (356 - 466) 121,971.3 327
2008/09 388 (335 - 441) 121,462.5 303
2009/10 406 (353 - 458) 120,953.2 333
2010/11 371 (323 - 420) 120,432.9 330
Females 1996/97 363 (300 - 427) 97,220.8 210
1997/98 417 (349 - 485) 96,865.7 237
1998/01 303 (246 - 359) 96,502.4 174
2001/02 347 (293 - 401) 108,646.7 228
2002/03 329 (276 - 381) 108,235.5 216
2003/04 301 (253 - 349) 107,800.8 213
2004/05 255 (211 - 299) 107,402.6 183
2005/06 270 (227 - 314) 106,983.4 204
2006/07 290 (248 - 333) 127,434.6 249
2007/08 309 (266 - 353) 126,940.5 264
2008/09 289 (248 - 330) 126,415.3 264
2009/10 288 (248 - 328) 125,887.0 264
2010/11 261 (224 - 298) 125,338.7 252

53
Table 22: All-Cause Mortality 1996-2011 results by single year for Pacific Ethnicity, age <75
years, born in NZ, by sex
By Variable Level Sex Single Year
of Follow-up StdRate
Person Time
(years) Deaths
All-Cause Mortality, <75 yrs Total Pacific Country of Birth
Total Pacific Born NZ Males 1996/97 1190 (781 - 1600) 55,387.8 126
1997/98 513 (247 - 778) 55,295.0 48
1998/01 443 (193 - 692) 55,233.2 51
2001/02 486 (178 - 794) 61,935.9 78
2002/03 311 (131 - 492) 61,864.5 63
2003/04 527 (247 - 806) 61,787.7 81
2004/05 333 (131 - 534) 61,715.7 63
2005/06 545 (226 - 863) 61,642.8 63
2006/07 245 (108 - 381) 74,297.0 84
2007/08 291 (139 - 442) 74,215.4 69
2008/09 158 (5 - 311) 74,145.2 48
2009/10 351 (105 - 597) 74,082.6 72
2010/11 353 (163 - 543) 74,007.5 69
Females 1996/97 439 (181 - 697) 54,370.3 48
1997/98 224 (63 - 385) 54,315.2 42
1998/01 359 (122 - 596) 54,267.6 30
2001/02 344 (55 - 633) 62,111.8 42
2002/03 354 (91 - 617) 62,080.0 30
2003/04 401 (103 - 699) 62,040.7 36
2004/05 226 (47 - 405) 62,004.0 33
2005/06 405 (141 - 670) 61,956.3 42
2006/07 127 (49 - 206) 75,613.5 42
2007/08 360 (114 - 607) 75,565.3 45
2008/09 278 (78 - 478) 75,511.7 48
2009/10 395 (149 - 641) 75,451.0 48
2010/11 195 (43 - 347) 75,402.4 39
54
Table 23: All-Cause Mortality 1996-2011 results by single year for Pacific Ethnicity, age <75
years, NOT born in NZ, by sex
By Variable Level Sex Single Year
of Follow-up StdRate
Person Time
(years) Deaths
All-Cause Mortality, <75 yrs Total Pacific Country of Birth
Total Pacific Not NZ Born Males 1996/97 658 (528 - 788) 37,088.4 246
1997/98 653 (550 - 757) 36,752.5 258
1998/01 574 (479 - 669) 36,392.6 237
2001/02 560 (479 - 640) 41,514.3 270
2002/03 555 (473 - 637) 41,137.1 267
2003/04 515 (428 - 603) 40,697.3 249
2004/05 437 (368 - 507) 40,334.8 225
2005/06 430 (362 - 499) 39,940.6 231
2006/07 463 (395 - 532) 46,355.8 276
2007/08 419 (355 - 483) 45,916.1 252
2008/09 401 (342 - 460) 45,487.6 255
2009/10 400 (344 - 457) 45,046.5 261
2010/11 371 (313 - 429) 44,613.6 246
Females 1996/97 340 (274 - 406) 41,450.0 156
1997/98 428 (354 - 503) 41,155.0 198
1998/01 308 (246 - 370) 40,842.8 147
2001/02 344 (283 - 404) 45,798.9 186
2002/03 330 (274 - 386) 45,422.5 186
2003/04 293 (241 - 345) 45,032.7 171
2004/05 239 (195 - 284) 44,674.2 147
2005/06 254 (209 - 299) 44,308.2 162
2006/07 289 (243 - 335) 49,992.2 201
2007/08 317 (262 - 372) 49,556.8 210
2008/09 277 (234 - 321) 49,099.3 204
2009/10 286 (242 - 330) 48,642.1 213
2010/11 266 (225 - 307) 48,151.1 210

55
Table 24: All-Cause Mortality 1996-2011 results by single year for Asian Ethnicity, age <75
years, all data, by sex
By Variable Level Sex Single Year
of Follow-up StdRate
Person Time
(years) Deaths
All-Cause Mortality, <75 yrs Total Asian All Exposures
Total Asian All Data Males 1996/97 303 (237 - 368) 78,598.3 147
1997/98 294 (228 - 359) 78,377.9 132
1998/01 172 (125 - 220) 78,165.7 96
2001/02 235 (193 - 276) 104,001.5 192
2002/03 199 (160 - 238) 103,653.4 162
2003/04 148 (117 - 179) 103,300.0 129
2004/05 156 (124 - 189) 102,942.6 135
2005/06 156 (124 - 187) 102,540.3 147
2006/07 157 (129 - 184) 159,686.8 192
2007/08 153 (127 - 180) 159,160.9 201
2008/09 131 (107 - 154) 158,579.7 177
2009/10 140 (116 - 164) 157,948.8 195
2010/11 168 (142 - 193) 157,249.4 249
Females 1996/97 148 (105 - 191) 85,749.8 75
1997/98 120 (84 - 156) 85,546.9 72
1998/01 139 (101 - 176) 85,329.7 87
2001/02 103 (77 - 129) 116,018.3 96
2002/03 116 (87 - 145) 115,707.1 102
2003/04 109 (84 - 135) 115,378.5 111
2004/05 109 (85 - 133) 115,029.6 114
2005/06 65 (47 - 83) 114,640.6 69
2006/07 101 (80 - 122) 175,152.6 135
2007/08 86 (67 - 104) 174,670.6 129
2008/09 89 (71 - 108) 174,124.2 132
2009/10 74 (57 - 91) 173,560.1 120
2010/11 93 (75 - 111) 172,903.9 159

56
Table 25: All-Cause Mortality 1996-2011 results by single year for Asian Ethnicity, age <75
years, born in NZ, by sex
By Variable Level Sex Single Year
of Follow-up StdRate
Person Time
(years) Deaths
All-Cause Mortality, <75 yrs Total Asian Country of Birth
Total Asian Born NZ Males 1996/97 466 (225 - 708) 21,053.3 42
1997/98 565 (281 - 850) 21,008.6 27
1998/01 282 (94 - 471) 20,968.0 21
2001/02 353 (155 - 551) 24,371.0 27
2002/03 234 (63 - 405) 24,340.5 18
2003/04 265 (103 - 427) 24,309.2 21
2004/05 201 (56 - 347) 24,281.7 15
2005/06 175 (46 - 305) 24,256.9 15
2006/07 197 (74 - 321) 34,308.7 24
2007/08 191 (65 - 316) 34,270.6 21
2008/09 194 (81 - 308) 34,239.7 24
2009/10 312 (155 - 469) 34,197.1 27
2010/11 267 (133 - 401) 34,158.6 27
Females 1996/97 218 (54 - 381) 20,650.4 15
1997/98 159 (51 - 267) 20,625.4 18
2002/03 110 (11 - 208) 24,131.3 12
2004/05 140 (35 - 245) 24,100.6 18
2005/06 167 (46 - 289) 24,038.1 18
2006/07 176 (59 - 292) 33,471.6 21
2007/08 102 (28 - 176) 33,438.4 12
2008/09 94 (19 - 168) 33,412.0 12
2009/10 126 (37 - 215) 33,379.8 18
2010/11 114 (41 - 187) 33,344.1 15
57
Table 26: All-Cause Mortality 1996-2011 results by single year for Asian Ethnicity, age <75
years, NOT born in NZ, by sex
By Variable Level Sex Single Year
of Follow-up StdRate
Person Time
(years) Deaths
All-Cause Mortality, <75 yrs Total Asian Country of Birth
Total Asian Not NZ Born Males 1996/97 263 (197 - 329) 56,828.5 102
1997/98 258 (193 - 324) 56,656.2 105
1998/01 151 (104 - 199) 56,488.1 75
2001/02 224 (181 - 267) 79,092.6 165
2002/03 189 (149 - 229) 78,777.5 141
2003/04 135 (104 - 166) 78,458.8 111
2004/05 150 (117 - 182) 78,129.4 117
2005/06 154 (121 - 186) 77,754.9 135
2006/07 146 (119 - 174) 124,154.0 165
2007/08 151 (124 - 178) 123,672.9 183
2008/09 125 (101 - 149) 123,127.6 156
2009/10 130 (106 - 155) 122,543.9 165
2010/11 160 (134 - 186) 121,890.3 216
Females 1996/97 140 (96 - 185) 64,312.8 63
1997/98 109 (71 - 146) 64,137.0 54
1998/01 141 (100 - 181) 63,957.3 78
2001/02 100 (73 - 127) 91,314.8 81
2002/03 106 (79 - 133) 91,036.9 84
2003/04 110 (84 - 137) 90,743.5 102
2004/05 96 (72 - 120) 90,428.3 93
2005/06 60 (42 - 78) 90,076.1 60
2006/07 90 (69 - 111) 140,357.3 114
2007/08 83 (65 - 102) 139,914.4 114
2008/09 85 (66 - 104) 139,403.4 120
2009/10 64 (49 - 80) 138,881.5 99
2010/11 90 (72 - 108) 138,267.0 138
58
Table 27: All-Cause Mortality 1996-2011 results by single year for European/Other
Ethnicity, age <75 years, all data, by sex
By Variable Level Sex Single Year
of Follow-up StdRate
Person Time
(years) Deaths
All-Cause Mortality, <75 yrs European/Other All Exposures
European/Other All Data Males 1996/97 366 (355 - 378) 1,142,811.1 5490
1997/98 348 (337 - 359) 1,129,968.5 5223
1998/01 299 (289 - 309) 1,117,287.8 4530
2001/02 317 (307 - 328) 1,130,470.9 4881
2002/03 300 (289 - 310) 1,117,406.6 4602
2003/04 290 (280 - 300) 1,104,444.7 4494
2004/05 260 (250 - 269) 1,091,886.7 4101
2005/06 241 (232 - 251) 1,079,427.4 3849
2006/07 251 (241 - 261) 1,171,844.7 4080
2007/08 243 (233 - 252) 1,159,539.6 4008
2008/09 234 (225 - 243) 1,147,483.9 3999
2009/10 221 (212 - 229) 1,135,271.2 3873
2010/11 208 (200 - 216) 1,123,236.3 3750
Females 1996/97 205 (197 - 213) 1,168,108.9 3288
1997/98 194 (186 - 202) 1,155,112.2 3120
1998/01 182 (174 - 190) 1,142,423.4 2940
2001/02 184 (176 - 191) 1,167,173.8 3024
2002/03 177 (170 - 185) 1,154,697.1 2919
2003/04 180 (173 - 188) 1,142,174.4 3021
2004/05 169 (162 - 177) 1,129,707.2 2853
2005/06 150 (143 - 158) 1,117,375.4 2568
2006/07 156 (149 - 163) 1,206,639.5 2763
2007/08 144 (138 - 150) 1,194,636.6 2601
2008/09 146 (140 - 153) 1,182,805.7 2688
2009/10 141 (135 - 148) 1,170,917.0 2655
2010/11 139 (133 - 145) 1,159,198.2 2712

59
Table 28: All-Cause Mortality 1996-2011 results by single year for European/Other
Ethnicity, age <75 years, born in NZ, by sex
By Variable Level Sex Single Year
of Follow-up StdRate
Person Time
(years) Deaths
All-Cause Mortality, <75 yrs European/Other Country of Birth
European/Other Born NZ Males 1996/97 377 (364 - 390) 965,736.4 4305
1997/98 355 (342 - 368) 955,973.4 4056
1998/01 310 (298 - 322) 946,307.1 3576
2001/02 329 (316 - 341) 956,125.6 3882
2002/03 305 (293 - 317) 946,302.4 3606
2003/04 298 (287 - 310) 936,633.4 3567
2004/05 268 (257 - 279) 927,290.8 3273
2005/06 251 (240 - 261) 917,965.4 3114
2006/07 262 (251 - 273) 960,709.1 3258
2007/08 253 (242 - 264) 951,571.9 3195
2008/09 246 (235 - 256) 942,616.1 3219
2009/10 231 (222 - 241) 933,558.3 3120
2010/11 217 (207 - 226) 924,633.8 3012
Females 1996/97 210 (201 - 220) 995,989.1 2655
1997/98 197 (188 - 206) 985,942.5 2481
1998/01 188 (179 - 196) 976,162.1 2397
2001/02 190 (181 - 199) 992,854.1 2484
2002/03 183 (175 - 191) 982,928.3 2397
2003/04 185 (176 - 193) 973,038.1 2457
2004/05 177 (169 - 185) 963,218.7 2376
2005/06 157 (149 - 165) 953,493.0 2139
2006/07 164 (157 - 172) 991,908.4 2271
2007/08 151 (144 - 158) 982,758.3 2109
2008/09 153 (146 - 161) 973,765.4 2205
2009/10 147 (140 - 154) 964,686.0 2154
2010/11 144 (137 - 151) 955,844.3 2205

60
Table 29: All-Cause Mortality 1996-2011 results by single year for European/Other
Ethnicity, age <75 years, NOT born in NZ, by sex
By Variable Level Sex Single Year
of Follow-up StdRate
Person Time
(years) Deaths
All-Cause Mortality, <75 yrs European/Other Country of Birth
European/Other Not NZ Born Males 1996/97 322 (296 - 348) 165,582.7 1131
1997/98 305 (280 - 329) 162,641.0 1092
1998/01 251 (227 - 275) 159,760.7 906
2001/02 263 (241 - 285) 169,223.7 969
2002/03 276 (252 - 299) 166,087.1 972
2003/04 249 (227 - 271) 162,883.0 897
2004/05 220 (200 - 240) 159,755.3 792
2005/06 197 (178 - 216) 156,727.5 714
2006/07 202 (183 - 221) 201,430.4 765
2007/08 202 (182 - 222) 198,481.2 762
2008/09 186 (169 - 204) 195,592.8 732
2009/10 175 (158 - 192) 192,646.0 699
2010/11 172 (155 - 188) 189,719.0 690
Females 1996/97 182 (161 - 204) 161,055.0 582
1997/98 175 (159 - 191) 158,288.3 606
1998/01 156 (138 - 174) 155,534.3 507
2001/02 150 (134 - 167) 168,762.3 501
2002/03 145 (131 - 160) 166,363.9 498
2003/04 154 (139 - 169) 163,867.8 540
2004/05 129 (114 - 144) 161,364.7 435
2005/06 118 (104 - 131) 158,894.1 414
2006/07 113 (101 - 126) 204,656.8 432
2007/08 109 (98 - 120) 202,110.2 432
2008/09 118 (105 - 132) 199,562.3 441
2009/10 119 (106 - 131) 197,014.8 459
2010/11 112 (100 - 124) 194,399.1 453
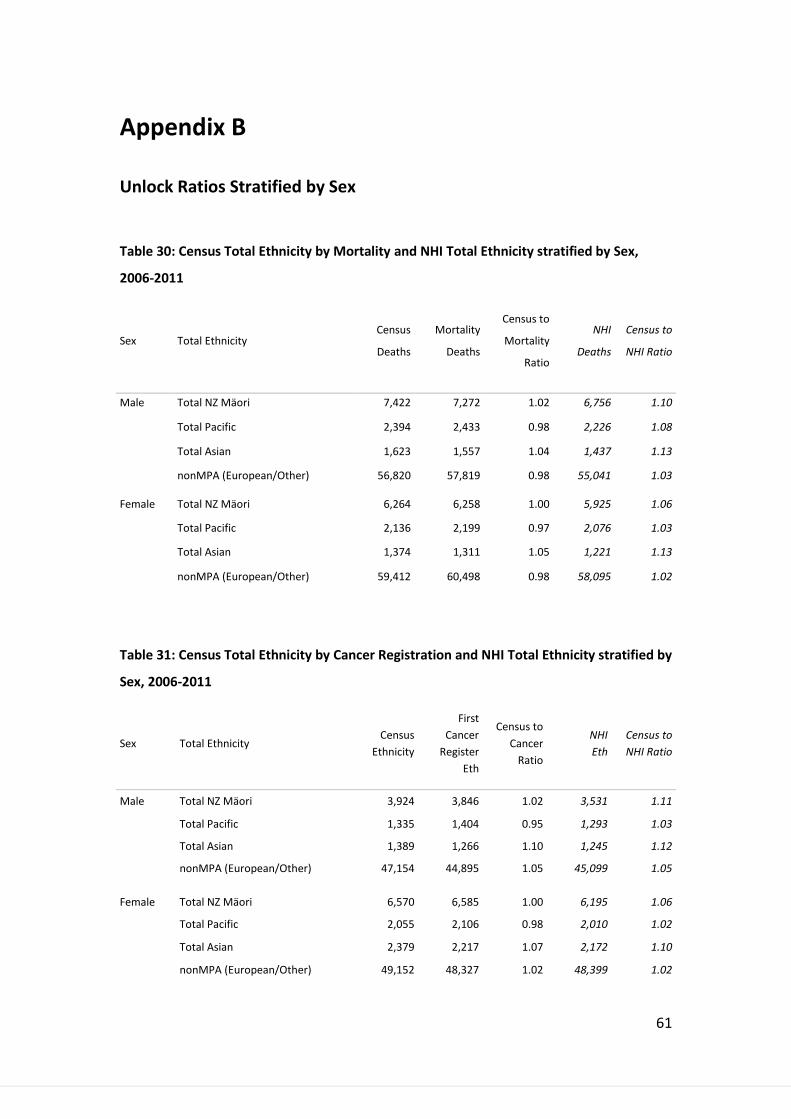
61
Appendix B
Unlock Ratios Stratified by Sex
Table 30: Census Total Ethnicity by Mortality and NHI Total Ethnicity stratified by Sex,
2006-2011
Sex Total Ethnicity Census
Deaths
Mortality
Deaths
Census to
Mortality
Ratio
NHI
Deaths
Census to
NHI Ratio
Male Total NZ Mäori 7,422 7,272 1.02 6,756 1.10
Total Pacific 2,394 2,433 0.98 2,226 1.08
Total Asian 1,623 1,557 1.04 1,437 1.13
nonMPA (European/Other) 56,820 57,819 0.98 55,041 1.03
Female Total NZ Mäori 6,264 6,258 1.00 5,925 1.06
Total Pacific 2,136 2,199 0.97 2,076 1.03
Total Asian 1,374 1,311 1.05 1,221 1.13
nonMPA (European/Other) 59,412 60,498 0.98 58,095 1.02
Table 31: Census Total Ethnicity by Cancer Registration and NHI Total Ethnicity stratified by
Sex, 2006-2011
Sex Total Ethnicity Census
Ethnicity
First
Cancer
Register
Eth
Census to
Cancer
Ratio
NHI
Eth
Census to
NHI Ratio
Male Total NZ Mäori 3,924 3,846 1.02 3,531 1.11
Total Pacific 1,335 1,404 0.95 1,293 1.03
Total Asian 1,389 1,266 1.10 1,245 1.12
nonMPA (European/Other) 47,154 44,895 1.05 45,099 1.05
Female Total NZ Mäori 6,570 6,585 1.00 6,195 1.06
Total Pacific 2,055 2,106 0.98 2,010 1.02
Total Asian 2,379 2,217 1.07 2,172 1.10
nonMPA (European/Other) 49,152 48,327 1.02 48,399 1.02
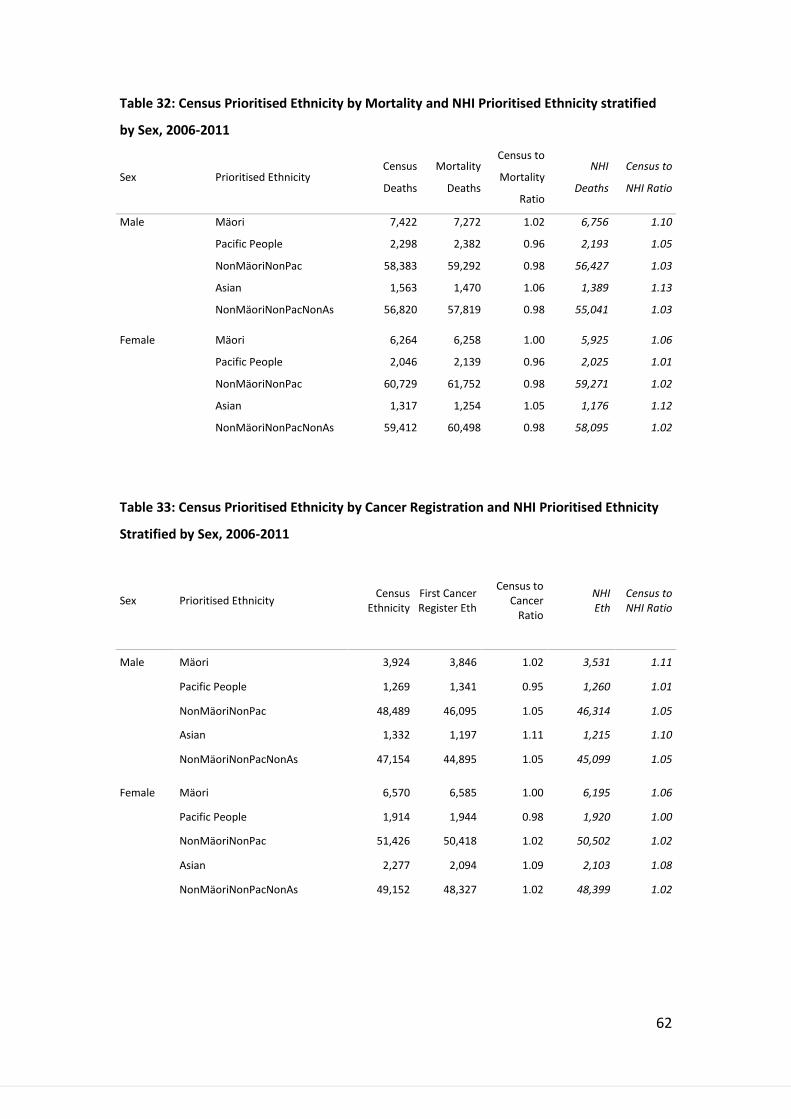
62
Table 32: Census Prioritised Ethnicity by Mortality and NHI Prioritised Ethnicity stratified
by Sex, 2006-2011
Sex Prioritised Ethnicity Census
Deaths
Mortality
Deaths
Census to
Mortality
Ratio
NHI
Deaths
Census to
NHI Ratio
Male Mäori 7,422 7,272 1.02 6,756 1.10
Pacific People 2,298 2,382 0.96 2,193 1.05
NonMäoriNonPac 58,383 59,292 0.98 56,427 1.03
Asian 1,563 1,470 1.06 1,389 1.13
NonMäoriNonPacNonAs 56,820 57,819 0.98 55,041 1.03
Female Mäori 6,264 6,258 1.00 5,925 1.06
Pacific People 2,046 2,139 0.96 2,025 1.01
NonMäoriNonPac 60,729 61,752 0.98 59,271 1.02
Asian 1,317 1,254 1.05 1,176 1.12
NonMäoriNonPacNonAs 59,412 60,498 0.98 58,095 1.02
Table 33: Census Prioritised Ethnicity by Cancer Registration and NHI Prioritised Ethnicity
Stratified by Sex, 2006-2011
Sex Prioritised Ethnicity Census
Ethnicity First Cancer Register Eth
Census to Cancer
Ratio
NHI Eth
Census to NHI Ratio
Male Mäori 3,924 3,846 1.02 3,531 1.11
Pacific People 1,269 1,341 0.95 1,260 1.01
NonMäoriNonPac 48,489 46,095 1.05 46,314 1.05
Asian 1,332 1,197 1.11 1,215 1.10
NonMäoriNonPacNonAs 47,154 44,895 1.05 45,099 1.05
Female Mäori 6,570 6,585 1.00 6,195 1.06
Pacific People 1,914 1,944 0.98 1,920 1.00
NonMäoriNonPac 51,426 50,418 1.02 50,502 1.02
Asian 2,277 2,094 1.09 2,103 1.08
NonMäoriNonPacNonAs 49,152 48,327 1.02 48,399 1.02

63
Unlock Ratios Stratified by Age
Table 34: Census Total Ethnicity by Mortality and NHI Total Ethnicity stratified by Age
Group, 2006-2011
Age Group 5 Year
Age Group Ethnicity
Census
Deaths
Mortality
Deaths
Census to
Mortality
Ratio
NHI
Deaths
Census to
NHI Ratio
0- 4 yrs Total NZ Mäori 105 114 0.92 105 1.00
Total Pacific 57 48 1.19 48 1.19
Total Asian 21 21 1.00 21 1.00
nonMPA (European/Other) 129 123 1.05 129 1.00
312 306 4.16 303 4.19 5- 9 yrs Total NZ Mäori 72 72 1.00 69 1.04
Total Pacific 24 27 0.89 18 1.33
nonMPA (European/Other) 84 84 1.00 87 0.97
180 183 2.89 174 3.34 10-14 yrs Total NZ Mäori 228 222 1.03 195 1.17
Total Pacific 57 54 1.06 51 1.12
Total Asian 24 18 1.33 18 1.33
nonMPA (European/Other) 255 270 0.94 270 0.94
564 564 4.36 534 4.56 15-19 yrs Total NZ Mäori 306 300 1.02 285 1.07
Total Pacific 105 84 1.25 84 1.25
Total Asian 39 27 1.44 27 1.44
nonMPA (European/Other) 570 588 0.97 576 0.99
1,020 999 4.68 972 4.75 20-24 yrs Total NZ Mäori 234 234 1.00 222 1.05
Total Pacific 87 90 0.97 87 1.00
Total Asian 42 33 1.27 33 1.27
nonMPA (European/Other) 438 453 0.97 420 1.04
801 810 4.21 762 4.36 25-29 yrs Total NZ Mäori 234 222 1.05 210 1.11
Total Pacific 75 72 1.04 63 1.19
Total Asian 51 42 1.21 42 1.21
nonMPA (European/Other) 450 468 0.96 444 1.01
810 804 4.26 759 4.52 30-34 yrs Total NZ Mäori 339 336 1.01 297 1.14
Total Pacific 120 108 1.11 96 1.25
Total Asian 48 45 1.07 42 1.14
nonMPA (European/Other) 696 714 0.97 678 1.03
1,203 1,203 4.16 1,113 4.56 35-39 yrs Total NZ Mäori 468 447 1.05 411 1.14
Total Pacific 189 186 1.02 168 1.13
Total Asian 78 69 1.13 66 1.18

64
Age Group 5 Year
Age Group Ethnicity
Census
Deaths
Mortality
Deaths
Census to
Mortality
Ratio
NHI
Deaths
Census to
NHI Ratio
nonMPA (European/Other) 1,071 1,107 0.97 1,056 1.01
1,806 1,809 4.17 1,701 4.46 40-44 yrs Total NZ Mäori 726 729 1.00 708 1.03
Total Pacific 216 201 1.07 192 1.13
Total Asian 105 102 1.03 93 1.13
nonMPA (European/Other) 1,611 1,644 0.98 1,506 1.07
2,658 2,676 4.08 2,499 4.36 45-49 yrs Total NZ Mäori 963 954 1.01 912 1.06
Total Pacific 246 237 1.04 237 1.04
Total Asian 138 129 1.07 120 1.15
nonMPA (European/Other) 2,346 2,400 0.98 2,226 1.05
3,693 3,720 4.10 3,495 4.30 50-54 yrs Total NZ Mäori 1,182 1,164 1.02 1,110 1.06
Total Pacific 306 333 0.92 303 1.01
Total Asian 210 195 1.08 192 1.09
nonMPA (European/Other) 3,243 3,297 0.98 3,084 1.05
4,941 4,989 4.00 4,689 4.21 55-59 yrs Total NZ Mäori 1,440 1,428 1.01 1,380 1.04
Total Pacific 423 429 0.99 393 1.08
Total Asian 225 207 1.09 195 1.15
nonMPA (European/Other) 4,995 5,076 0.98 4,743 1.05
7,083 7,140 4.07 6,711 4.32 60-64 yrs Total NZ Mäori 1,524 1,494 1.02 1,437 1.06
Total Pacific 441 465 0.95 438 1.01
Total Asian 282 264 1.07 237 1.19
nonMPA (European/Other) 6,558 6,669 0.98 6,300 1.04
8,805 8,892 4.02 8,412 4.30 65-69 yrs Total NZ Mäori 1,731 1,731 1.00 1,617 1.07
Total Pacific 549 567 0.97 528 1.04
Total Asian 297 294 1.01 267 1.11
nonMPA (European/Other) 8,799 8,907 0.99 8,535 1.03
11,376 11,499 3.97 10,947 4.25 70-74 yrs Total NZ Mäori 1,563 1,509 1.04 1,464 1.07
Total Pacific 534 558 0.96 522 1.02
Total Asian 372 369 1.01 339 1.10
nonMPA (European/Other) 12,165 12,357 0.98 11,739 1.04
14,634 14,793 3.99 14,064 4.23 75-79 yrs Total NZ Mäori 1,239 1,212 1.02 1,104 1.12
Total Pacific 486 522 0.93 498 0.98
Total Asian 342 351 0.97 309 1.11
nonMPA (European/Other) 18,822 19,134 0.98 18,381 1.02
20,889 21,219 3.90 20,292 4.23 80-84 yrs Total NZ Mäori 804 828 0.97 705 1.14
Total Pacific 342 363 0.94 336 1.02
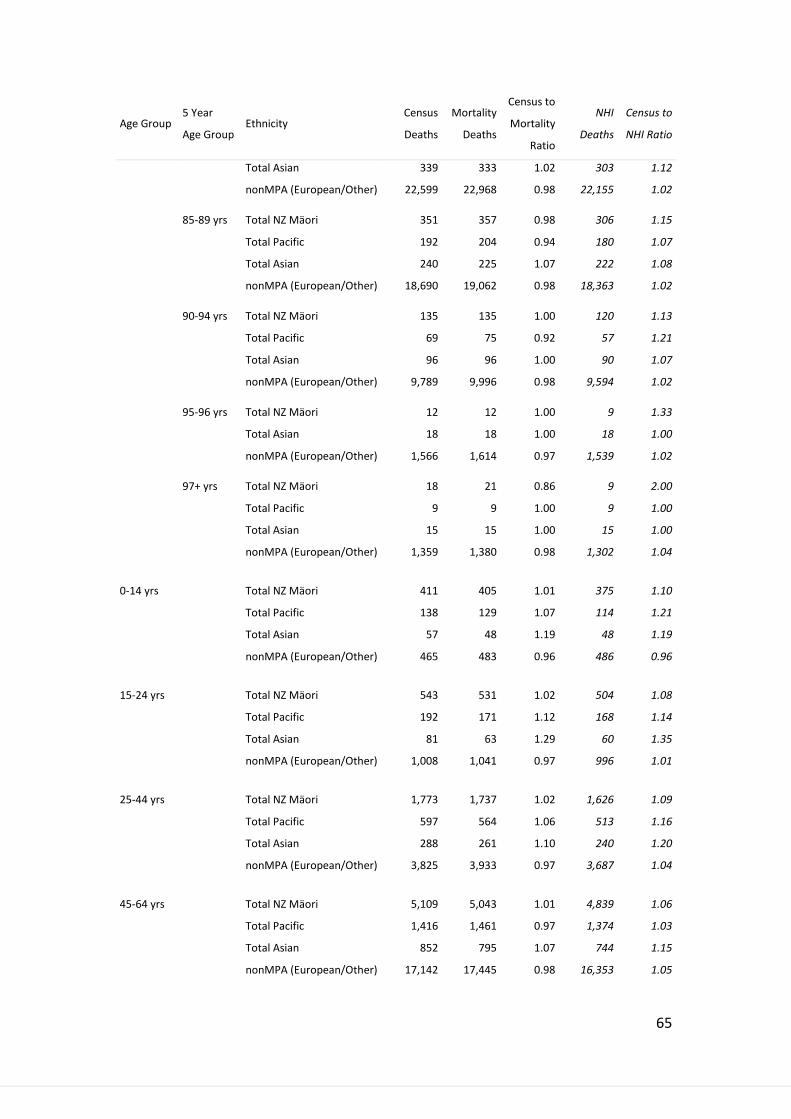
65
Age Group 5 Year
Age Group Ethnicity
Census
Deaths
Mortality
Deaths
Census to
Mortality
Ratio
NHI
Deaths
Census to
NHI Ratio
Total Asian 339 333 1.02 303 1.12
nonMPA (European/Other) 22,599 22,968 0.98 22,155 1.02
24,084 24,492 3.91 23,499 4.30 85-89 yrs Total NZ Mäori 351 357 0.98 306 1.15
Total Pacific 192 204 0.94 180 1.07
Total Asian 240 225 1.07 222 1.08
nonMPA (European/Other) 18,690 19,062 0.98 18,363 1.02
19,473 19,848 3.97 19,071 4.32 90-94 yrs Total NZ Mäori 135 135 1.00 120 1.13
Total Pacific 69 75 0.92 57 1.21
Total Asian 96 96 1.00 90 1.07
nonMPA (European/Other) 9,789 9,996 0.98 9,594 1.02
10,089 10,302 3.90 9,861 4.43 95-96 yrs Total NZ Mäori 12 12 1.00 9 1.33
Total Asian 18 18 1.00 18 1.00
nonMPA (European/Other) 1,566 1,614 0.97 1,539 1.02
1,596 1,644 2.97 1,566 3.35 97+ yrs Total NZ Mäori 18 21 0.86 9 2.00
Total Pacific 9 9 1.00 9 1.00
Total Asian 15 15 1.00 15 1.00
nonMPA (European/Other) 1,359 1,380 0.98 1,302 1.04
1,401 1,425 3.84 1,335 5.04 137,418 139,317 83.61 132,759 90.38 0-14 yrs Total NZ Mäori 411 405 1.01 375 1.10
Total Pacific 138 129 1.07 114 1.21
Total Asian 57 48 1.19 48 1.19
nonMPA (European/Other) 465 483 0.96 486 0.96
1,071 1,065 4.23 1,023 4.46 1,071 1,065 4.23 1,023 4.46 15-24 yrs Total NZ Mäori 543 531 1.02 504 1.08
Total Pacific 192 171 1.12 168 1.14
Total Asian 81 63 1.29 60 1.35
nonMPA (European/Other) 1,008 1,041 0.97 996 1.01
1,824 1,806 4.40 1,728 4.58 1,824 1,806 4.40 1,728 4.58 25-44 yrs Total NZ Mäori 1,773 1,737 1.02 1,626 1.09
Total Pacific 597 564 1.06 513 1.16
Total Asian 288 261 1.10 240 1.20
nonMPA (European/Other) 3,825 3,933 0.97 3,687 1.04
6,483 6,495 4.15 6,066 4.49 6,483 6,495 4.15 6,066 4.49 45-64 yrs Total NZ Mäori 5,109 5,043 1.01 4,839 1.06
Total Pacific 1,416 1,461 0.97 1,374 1.03
Total Asian 852 795 1.07 744 1.15
nonMPA (European/Other) 17,142 17,445 0.98 16,353 1.05
24,519 24,744 4.03 23,310 4.29 24,519 24,744 4.03 23,310 4.29

66
Age Group 5 Year
Age Group Ethnicity
Census
Deaths
Mortality
Deaths
Census to
Mortality
Ratio
NHI
Deaths
Census to
NHI Ratio
65-74 yrs Total NZ Mäori 3,297 3,240 1.02 3,081 1.07
Total Pacific 1,083 1,125 0.96 1,050 1.03
Total Asian 666 663 1.00 606 1.10
nonMPA (European/Other) 20,964 21,267 0.99 20,274 1.03
26,010 26,295 3.97 25,011 4.23 26,010 26,295 3.97 25,011 4.23 75-84 yrs Total NZ Mäori 2,043 2,040 1.00 1,806 1.13
Total Pacific 828 882 0.94 834 0.99
Total Asian 681 681 1.00 612 1.11
nonMPA (European/Other) 41,421 42,102 0.98 40,536 1.02
44,973 45,705 3.92 43,788 4.25 44,973 45,705 3.92 43,788 4.25 >= 85 yrs Total NZ Mäori 513 528 0.97 450 1.14
Total Pacific 279 297 0.94 252 1.11
Total Asian 366 354 1.03 345 1.06
nonMPA (European/Other) 31,407 32,052 0.98 30,795 1.02
Table 35: Census Total Ethnicity by Cancer Registration and NHI Total Ethnicity Stratified
by Age Group, 2006-2011
Age Group 5 Year
Age Group Ethnicity
Census
Ethnicity
First
Cancer
Register
Eth
Census to
Cancer
Ratio
NHI
Eth
Census to
NHI Ratio
0- 4 yrs Total NZ Mäori 54 54 1.00 54 1.00
Total Pacific 27 24 1.13 21 1.29
Total Asian 24 18 1.33 21 1.14
nonMPA (European/Other) 90 96 0.94 96 0.94
195 192 4.40 192 4.37 5- 9 yrs Total NZ Mäori 24 36 0.67 36 0.67
Total Pacific 21 24 0.88 21 1.00
nonMPA (European/Other) 84 78 1.08 78 1.08
129 138 2.63 135 2.75 10-14 yrs Total NZ Mäori 75 66 1.14 69 1.09
Total Pacific 36 36 1.00 33 1.09
Total Asian 12 9 1.33 9 1.33
nonMPA (European/Other) 183 189 0.97 192 0.95
306 300 4.44 303 4.46 15-19 yrs Total NZ Mäori 354 312 1.13 294 1.20
Total Pacific 72 51 1.41 54 1.33
Total Asian 57 36 1.58 36 1.58
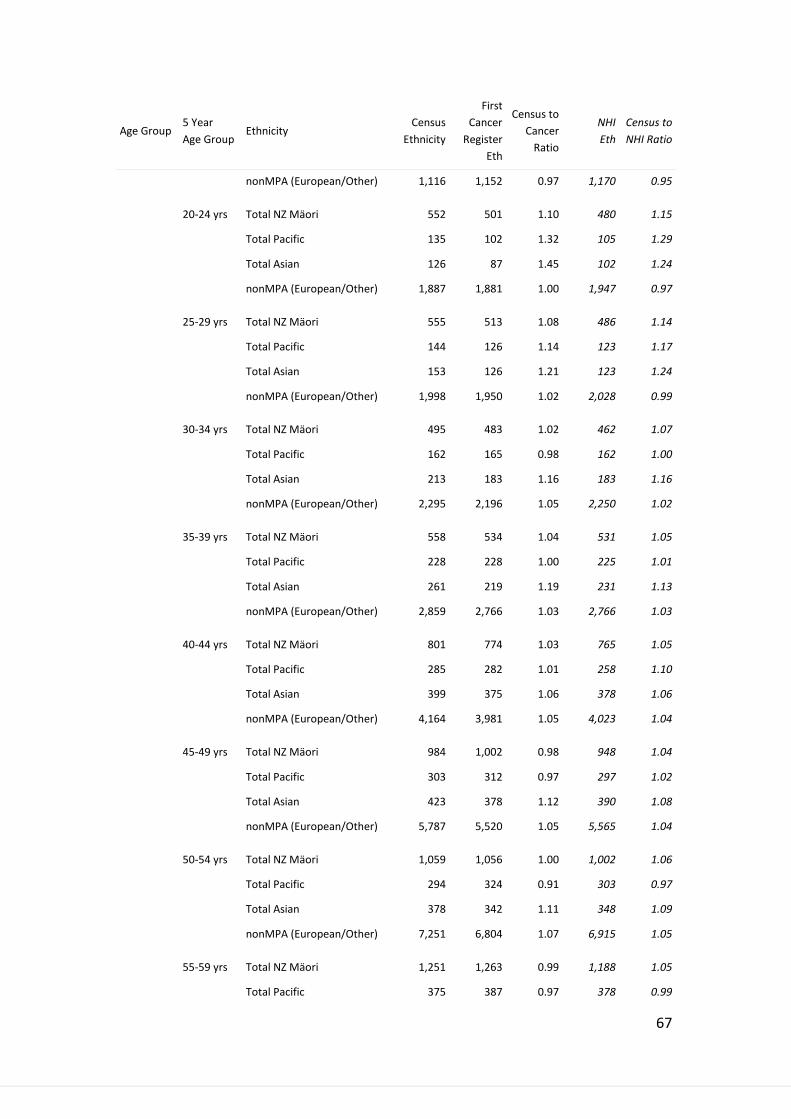
67
Age Group 5 Year
Age Group Ethnicity
Census
Ethnicity
First
Cancer
Register
Eth
Census to
Cancer
Ratio
NHI
Eth
Census to
NHI Ratio
nonMPA (European/Other) 1,116 1,152 0.97 1,170 0.95
1,599 1,551 5.09 1,554 5.06 20-24 yrs Total NZ Mäori 552 501 1.10 480 1.15
Total Pacific 135 102 1.32 105 1.29
Total Asian 126 87 1.45 102 1.24
nonMPA (European/Other) 1,887 1,881 1.00 1,947 0.97
2,700 2,571 4.87 2,634 4.65 25-29 yrs Total NZ Mäori 555 513 1.08 486 1.14
Total Pacific 144 126 1.14 123 1.17
Total Asian 153 126 1.21 123 1.24
nonMPA (European/Other) 1,998 1,950 1.02 2,028 0.99
2,850 2,715 4.45 2,760 4.54 30-34 yrs Total NZ Mäori 495 483 1.02 462 1.07
Total Pacific 162 165 0.98 162 1.00
Total Asian 213 183 1.16 183 1.16
nonMPA (European/Other) 2,295 2,196 1.05 2,250 1.02
3,165 3,027 4.21 3,057 4.25 35-39 yrs Total NZ Mäori 558 534 1.04 531 1.05
Total Pacific 228 228 1.00 225 1.01
Total Asian 261 219 1.19 231 1.13
nonMPA (European/Other) 2,859 2,766 1.03 2,766 1.03
3,906 3,747 4.26 3,753 4.22 40-44 yrs Total NZ Mäori 801 774 1.03 765 1.05
Total Pacific 285 282 1.01 258 1.10
Total Asian 399 375 1.06 378 1.06
nonMPA (European/Other) 4,164 3,981 1.05 4,023 1.04
5,649 5,412 4.15 5,424 4.25 45-49 yrs Total NZ Mäori 984 1,002 0.98 948 1.04
Total Pacific 303 312 0.97 297 1.02
Total Asian 423 378 1.12 390 1.08
nonMPA (European/Other) 5,787 5,520 1.05 5,565 1.04
7,497 7,212 4.12 7,200 4.18 50-54 yrs Total NZ Mäori 1,059 1,056 1.00 1,002 1.06
Total Pacific 294 324 0.91 303 0.97
Total Asian 378 342 1.11 348 1.09
nonMPA (European/Other) 7,251 6,804 1.07 6,915 1.05
8,982 8,526 4.09 8,568 4.17 55-59 yrs Total NZ Mäori 1,251 1,263 0.99 1,188 1.05
Total Pacific 375 387 0.97 378 0.99
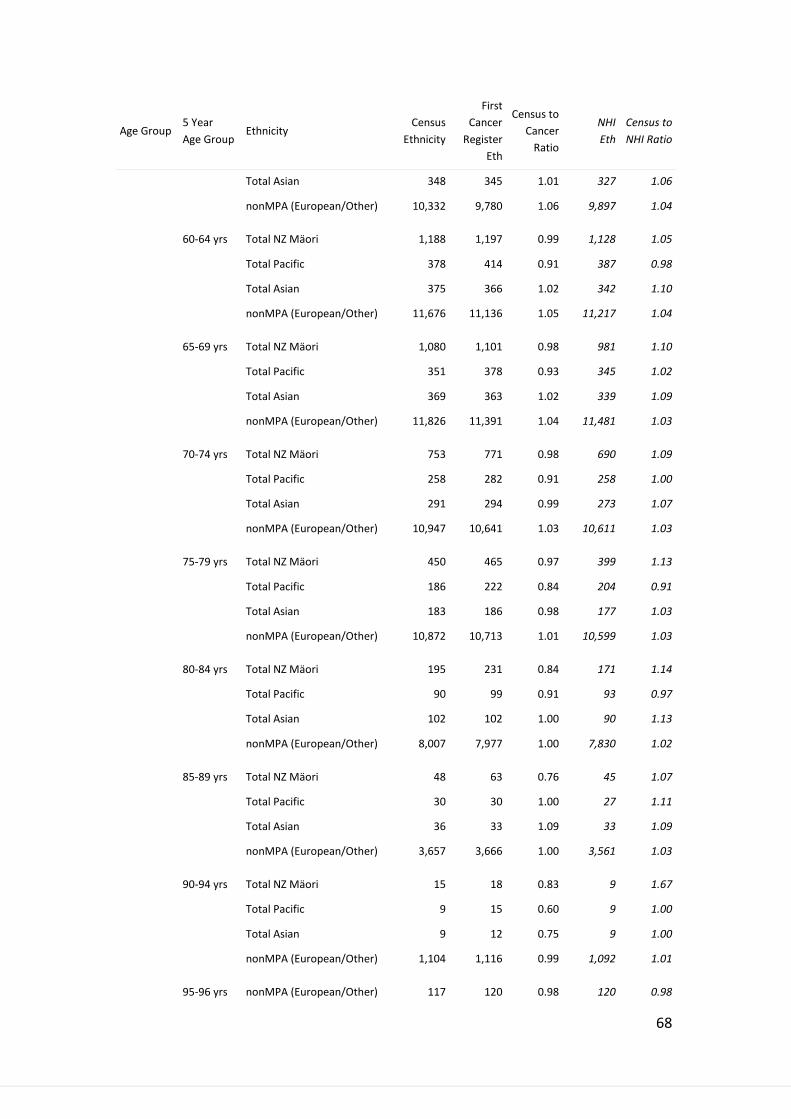
68
Age Group 5 Year
Age Group Ethnicity
Census
Ethnicity
First
Cancer
Register
Eth
Census to
Cancer
Ratio
NHI
Eth
Census to
NHI Ratio
Total Asian 348 345 1.01 327 1.06
nonMPA (European/Other) 10,332 9,780 1.06 9,897 1.04
12,306 11,775 4.03 11,790 4.14 60-64 yrs Total NZ Mäori 1,188 1,197 0.99 1,128 1.05
Total Pacific 378 414 0.91 387 0.98
Total Asian 375 366 1.02 342 1.10
nonMPA (European/Other) 11,676 11,136 1.05 11,217 1.04
13,617 13,113 3.97 13,074 4.17 65-69 yrs Total NZ Mäori 1,080 1,101 0.98 981 1.10
Total Pacific 351 378 0.93 345 1.02
Total Asian 369 363 1.02 339 1.09
nonMPA (European/Other) 11,826 11,391 1.04 11,481 1.03
13,626 13,233 3.97 13,146 4.24 70-74 yrs Total NZ Mäori 753 771 0.98 690 1.09
Total Pacific 258 282 0.91 258 1.00
Total Asian 291 294 0.99 273 1.07
nonMPA (European/Other) 10,947 10,641 1.03 10,611 1.03
12,249 11,988 3.91 11,832 4.19 75-79 yrs Total NZ Mäori 450 465 0.97 399 1.13
Total Pacific 186 222 0.84 204 0.91
Total Asian 183 186 0.98 177 1.03
nonMPA (European/Other) 10,872 10,713 1.01 10,599 1.03
11,691 11,586 3.80 11,379 4.10 80-84 yrs Total NZ Mäori 195 231 0.84 171 1.14
Total Pacific 90 99 0.91 93 0.97
Total Asian 102 102 1.00 90 1.13
nonMPA (European/Other) 8,007 7,977 1.00 7,830 1.02
8,394 8,409 3.75 8,184 4.26 85-89 yrs Total NZ Mäori 48 63 0.76 45 1.07
Total Pacific 30 30 1.00 27 1.11
Total Asian 36 33 1.09 33 1.09
nonMPA (European/Other) 3,657 3,666 1.00 3,561 1.03
3,771 3,792 3.85 3,666 4.30 90-94 yrs Total NZ Mäori 15 18 0.83 9 1.67
Total Pacific 9 15 0.60 9 1.00
Total Asian 9 12 0.75 9 1.00
nonMPA (European/Other) 1,104 1,116 0.99 1,092 1.01
1,137 1,161 3.17 1,119 4.68 95-96 yrs nonMPA (European/Other) 117 120 0.98 120 0.98
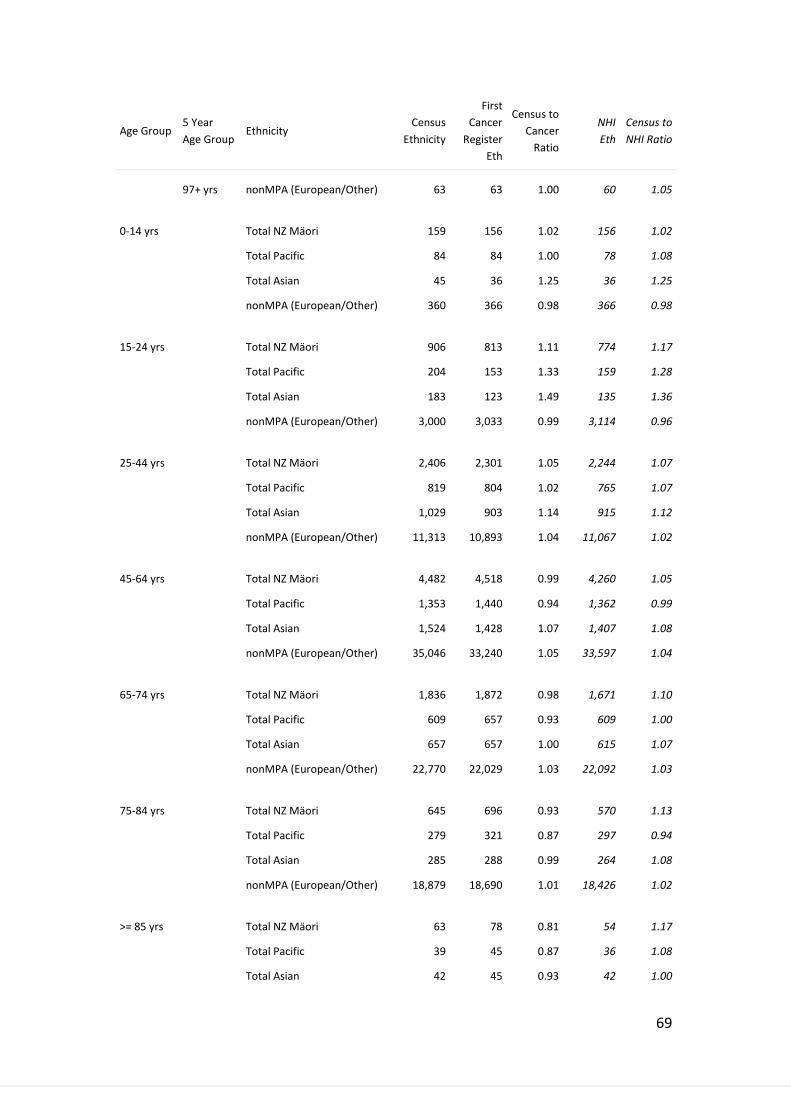
69
Age Group 5 Year
Age Group Ethnicity
Census
Ethnicity
First
Cancer
Register
Eth
Census to
Cancer
Ratio
NHI
Eth
Census to
NHI Ratio
117 120 0.98 120 0.98 97+ yrs nonMPA (European/Other) 63 63 1.00 60 1.05
63 63 1.00 60 1.05 113,949 110,631 79.14 109,950 83.01 0-14 yrs Total NZ Mäori 159 156 1.02 156 1.02
Total Pacific 84 84 1.00 78 1.08
Total Asian 45 36 1.25 36 1.25
nonMPA (European/Other) 360 366 0.98 366 0.98
648 642 4.25 636 4.33 648 642 4.25 636 4.33 15-24 yrs Total NZ Mäori 906 813 1.11 774 1.17
Total Pacific 204 153 1.33 159 1.28
Total Asian 183 123 1.49 135 1.36
nonMPA (European/Other) 3,000 3,033 0.99 3,114 0.96
4,293 4,122 4.92 4,182 4.77 4,293 4,122 4.92 4,182 4.77 25-44 yrs Total NZ Mäori 2,406 2,301 1.05 2,244 1.07
Total Pacific 819 804 1.02 765 1.07
Total Asian 1,029 903 1.14 915 1.12
nonMPA (European/Other) 11,313 10,893 1.04 11,067 1.02
15,567 14,901 4.25 14,991 4.28 15,567 14,901 4.25 14,991 4.28 45-64 yrs Total NZ Mäori 4,482 4,518 0.99 4,260 1.05
Total Pacific 1,353 1,440 0.94 1,362 0.99
Total Asian 1,524 1,428 1.07 1,407 1.08
nonMPA (European/Other) 35,046 33,240 1.05 33,597 1.04
42,405 40,626 4.05 40,626 4.16 42,405 40,626 4.05 40,626 4.16 65-74 yrs Total NZ Mäori 1,836 1,872 0.98 1,671 1.10
Total Pacific 609 657 0.93 609 1.00
Total Asian 657 657 1.00 615 1.07
nonMPA (European/Other) 22,770 22,029 1.03 22,092 1.03
25,872 25,215 3.94 24,987 4.20 25,872 25,215 3.94 24,987 4.20 75-84 yrs Total NZ Mäori 645 696 0.93 570 1.13
Total Pacific 279 321 0.87 297 0.94
Total Asian 285 288 0.99 264 1.08
nonMPA (European/Other) 18,879 18,690 1.01 18,426 1.02
20,088 19,995 3.80 19,557 4.17 20,088 19,995 3.80 19,557 4.17 >= 85 yrs Total NZ Mäori 63 78 0.81 54 1.17
Total Pacific 39 45 0.87 36 1.08
Total Asian 42 45 0.93 42 1.00

70
Age Group 5 Year
Age Group Ethnicity
Census
Ethnicity
First
Cancer
Register
Eth
Census to
Cancer
Ratio
NHI
Eth
Census to
NHI Ratio
nonMPA (European/Other) 4,941 4,968 0.99 4,836 1.02
Table 36: Census Prioritised Ethnicity by Mortality and NHI Priortised Ethnicity stratified by
Age Group, 2006-2011
Age Group 5 Year
Age Group Prioritised Ethnicity
Census
Deaths
Mortality
Deaths
Census to
Mortality
Ratio
NHI
Deaths
Census to
NHI Ratio
0- 4 yrs Mäori 105 114 0.92 105 1.00
Pacific People 33 36 0.92 36 0.92
NonMäoriNonPac 147 141 1.04 147 1.00
Asian 21 15 1.40 15 1.40
NonMäoriNonPacNonAs 129 123 1.05 129 1.00
435 429 5.33 432 5.32 5- 9 yrs Mäori 72 72 1.00 69 1.04
Pacific People 18 12 1.50 12 1.50
NonMäoriNonPac 93 96 0.97 96 0.97
NonMäoriNonPacNonAs 84 84 1.00 87 0.97
267 264 4.47 264 4.48 10-14 yrs Mäori 228 222 1.03 195 1.17
Pacific People 36 39 0.92 42 0.86
NonMäoriNonPac 279 291 0.96 282 0.99
Asian 24 18 1.33 12 2.00
NonMäoriNonPacNonAs 255 270 0.94 270 0.94
822 840 5.18 801 5.96 15-19 yrs Mäori 306 300 1.02 285 1.07
Pacific People 78 75 1.04 69 1.13
NonMäoriNonPac 603 612 0.99 603 1.00
Asian 33 27 1.22 24 1.38
NonMäoriNonPacNonAs 570 588 0.97 576 0.99
1,590 1,602 5.24 1,557 5.57 20-24 yrs Mäori 234 234 1.00 222 1.05
Pacific People 84 84 1.00 81 1.04
NonMäoriNonPac 477 483 0.99 453 1.05
Asian 39 30 1.30 33 1.18
NonMäoriNonPacNonAs 438 453 0.97 420 1.04
1,272 1,284 5.26 1,209 5.36
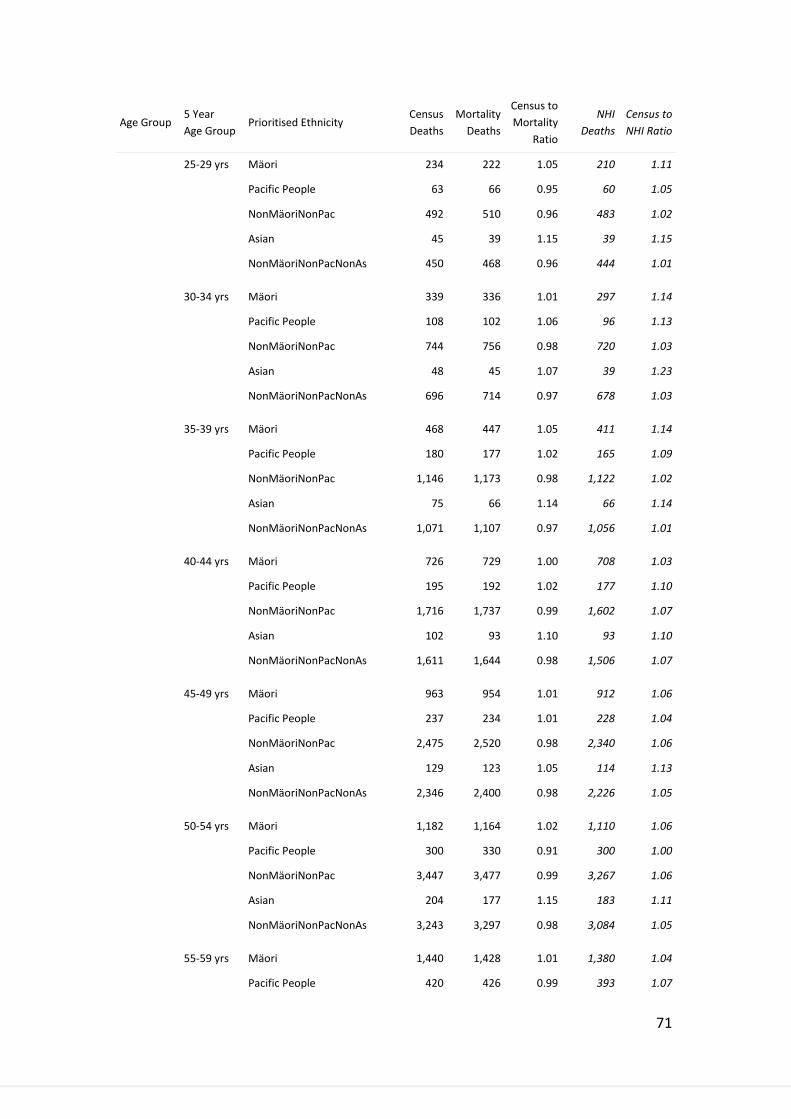
71
Age Group 5 Year
Age Group Prioritised Ethnicity
Census
Deaths
Mortality
Deaths
Census to
Mortality
Ratio
NHI
Deaths
Census to
NHI Ratio
25-29 yrs Mäori 234 222 1.05 210 1.11
Pacific People 63 66 0.95 60 1.05
NonMäoriNonPac 492 510 0.96 483 1.02
Asian 45 39 1.15 39 1.15
NonMäoriNonPacNonAs 450 468 0.96 444 1.01
1,284 1,305 5.07 1,236 5.34 30-34 yrs Mäori 339 336 1.01 297 1.14
Pacific People 108 102 1.06 96 1.13
NonMäoriNonPac 744 756 0.98 720 1.03
Asian 48 45 1.07 39 1.23
NonMäoriNonPacNonAs 696 714 0.97 678 1.03
1,935 1,953 5.09 1,830 5.56 35-39 yrs Mäori 468 447 1.05 411 1.14
Pacific People 180 177 1.02 165 1.09
NonMäoriNonPac 1,146 1,173 0.98 1,122 1.02
Asian 75 66 1.14 66 1.14
NonMäoriNonPacNonAs 1,071 1,107 0.97 1,056 1.01
2,940 2,970 5.16 2,820 5.40 40-44 yrs Mäori 726 729 1.00 708 1.03
Pacific People 195 192 1.02 177 1.10
NonMäoriNonPac 1,716 1,737 0.99 1,602 1.07
Asian 102 93 1.10 93 1.10
NonMäoriNonPacNonAs 1,611 1,644 0.98 1,506 1.07
4,350 4,395 5.09 4,086 5.37 45-49 yrs Mäori 963 954 1.01 912 1.06
Pacific People 237 234 1.01 228 1.04
NonMäoriNonPac 2,475 2,520 0.98 2,340 1.06
Asian 129 123 1.05 114 1.13
NonMäoriNonPacNonAs 2,346 2,400 0.98 2,226 1.05
6,150 6,231 5.03 5,820 5.34 50-54 yrs Mäori 1,182 1,164 1.02 1,110 1.06
Pacific People 300 330 0.91 300 1.00
NonMäoriNonPac 3,447 3,477 0.99 3,267 1.06
Asian 204 177 1.15 183 1.11
NonMäoriNonPacNonAs 3,243 3,297 0.98 3,084 1.05
8,376 8,445 5.05 7,944 5.28 55-59 yrs Mäori 1,440 1,428 1.01 1,380 1.04
Pacific People 420 426 0.99 393 1.07
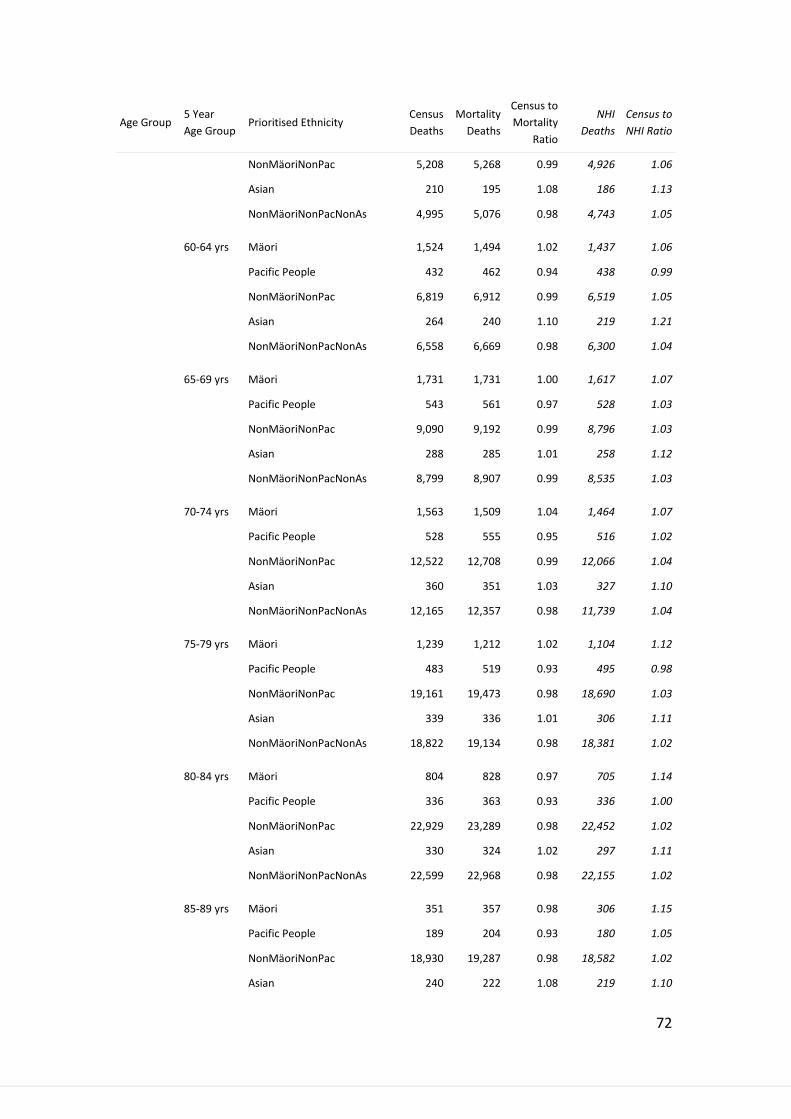
72
Age Group 5 Year
Age Group Prioritised Ethnicity
Census
Deaths
Mortality
Deaths
Census to
Mortality
Ratio
NHI
Deaths
Census to
NHI Ratio
NonMäoriNonPac 5,208 5,268 0.99 4,926 1.06
Asian 210 195 1.08 186 1.13
NonMäoriNonPacNonAs 4,995 5,076 0.98 4,743 1.05
12,273 12,393 5.05 11,628 5.35 60-64 yrs Mäori 1,524 1,494 1.02 1,437 1.06
Pacific People 432 462 0.94 438 0.99
NonMäoriNonPac 6,819 6,912 0.99 6,519 1.05
Asian 264 240 1.10 219 1.21
NonMäoriNonPacNonAs 6,558 6,669 0.98 6,300 1.04
15,597 15,777 5.03 14,913 5.35 65-69 yrs Mäori 1,731 1,731 1.00 1,617 1.07
Pacific People 543 561 0.97 528 1.03
NonMäoriNonPac 9,090 9,192 0.99 8,796 1.03
Asian 288 285 1.01 258 1.12
NonMäoriNonPacNonAs 8,799 8,907 0.99 8,535 1.03
20,451 20,676 4.96 19,734 5.28 70-74 yrs Mäori 1,563 1,509 1.04 1,464 1.07
Pacific People 528 555 0.95 516 1.02
NonMäoriNonPac 12,522 12,708 0.99 12,066 1.04
Asian 360 351 1.03 327 1.10
NonMäoriNonPacNonAs 12,165 12,357 0.98 11,739 1.04
27,138 27,480 4.99 26,112 5.27 75-79 yrs Mäori 1,239 1,212 1.02 1,104 1.12
Pacific People 483 519 0.93 495 0.98
NonMäoriNonPac 19,161 19,473 0.98 18,690 1.03
Asian 339 336 1.01 306 1.11
NonMäoriNonPacNonAs 18,822 19,134 0.98 18,381 1.02
40,044 40,674 4.92 38,976 5.26 80-84 yrs Mäori 804 828 0.97 705 1.14
Pacific People 336 363 0.93 336 1.00
NonMäoriNonPac 22,929 23,289 0.98 22,452 1.02
Asian 330 324 1.02 297 1.11
NonMäoriNonPacNonAs 22,599 22,968 0.98 22,155 1.02
46,998 47,772 4.88 45,945 5.29 85-89 yrs Mäori 351 357 0.98 306 1.15
Pacific People 189 204 0.93 180 1.05
NonMäoriNonPac 18,930 19,287 0.98 18,582 1.02
Asian 240 222 1.08 219 1.10

73
Age Group 5 Year
Age Group Prioritised Ethnicity
Census
Deaths
Mortality
Deaths
Census to
Mortality
Ratio
NHI
Deaths
Census to
NHI Ratio
NonMäoriNonPacNonAs 18,690 19,062 0.98 18,363 1.02
38,400 39,132 4.95 37,650 5.34 90-94 yrs Mäori 135 135 1.00 120 1.13
Pacific People 66 75 0.88 57 1.16
NonMäoriNonPac 9,885 10,086 0.98 9,684 1.02
Asian 93 93 1.00 90 1.03
NonMäoriNonPacNonAs 9,789 9,996 0.98 9,594 1.02
19,968 20,385 4.84 19,545 5.36 95-96 yrs Mäori 12 12 1.00 9 1.33
NonMäoriNonPac 1,581 1,629 0.97 1,557 1.02
Asian 18 18 1.00 18 1.00
NonMäoriNonPacNonAs 1,566 1,614 0.97 1,539 1.02
3,177 3,273 3.94 3,123 4.37 97+ yrs Mäori 18 21 0.86 9 2.00
Pacific People 9 9 1.00 9 1.00
NonMäoriNonPac 1,374 1,392 0.99 1,317 1.04
Asian 15 15 1.00 15 1.00
NonMäoriNonPacNonAs 1,359 1,380 0.98 1,302 1.04
2,775 2,817 4.83 2,652 6.08 256,242 260,097 104.4 248,277 111.9 0-14 yrs Mäori 411 405 1.01 375 1.10
Pacific People 87 90 0.97 90 0.97
NonMäoriNonPac 516 528 0.98 525 0.98
Asian 54 45 1.20 39 1.38
NonMäoriNonPacNonAs 465 483 0.96 486 0.96
1,533 1,551 5.12 1,515 5.39 1,533 1,551 5.12 1,515 5.39 15-24 yrs Mäori 543 531 1.02 504 1.08
Pacific People 162 156 1.04 147 1.10
NonMäoriNonPac 1,080 1,098 0.98 1,053 1.03
Asian 69 57 1.21 57 1.21
NonMäoriNonPacNonAs 1,008 1,041 0.97 996 1.01
2,862 2,883 5.22 2,757 5.43 2,862 2,883 5.22 2,757 5.43 25-44 yrs Mäori 1,773 1,737 1.02 1,626 1.09
Pacific People 546 537 1.02 498 1.10
NonMäoriNonPac 4,092 4,179 0.98 3,924 1.04
Asian 267 246 1.09 237 1.13
NonMäoriNonPacNonAs 3,825 3,933 0.97 3,687 1.04
10,503 10,632 5.08 9,972 5.40 10,503 10,632 5.08 9,972 5.40

74
Age Group 5 Year
Age Group Prioritised Ethnicity
Census
Deaths
Mortality
Deaths
Census to
Mortality
Ratio
NHI
Deaths
Census to
NHI Ratio
45-64 yrs Mäori 5,109 5,043 1.01 4,839 1.06
Pacific People 1,389 1,449 0.96 1,353 1.03
NonMäoriNonPac 17,952 18,180 0.99 17,055 1.05
Asian 807 735 1.10 702 1.15
NonMäoriNonPacNonAs 17,142 17,445 0.98 16,353 1.05
42,399 42,852 5.04 40,302 5.34 42,399 42,852 5.04 40,302 5.34 65-74 yrs Mäori 3,297 3,240 1.02 3,081 1.07
Pacific People 1,068 1,116 0.96 1,047 1.02
NonMäoriNonPac 21,612 21,900 0.99 20,862 1.04
Asian 648 633 1.02 585 1.11
NonMäoriNonPacNonAs 20,964 21,267 0.99 20,274 1.03
47,589 48,156 4.98 45,849 5.27 47,589 48,156 4.98 45,849 5.27 75-84 yrs Mäori 2,043 2,040 1.00 1,806 1.13
Pacific People 822 879 0.94 828 0.99
NonMäoriNonPac 42,090 42,762 0.98 41,142 1.02
Asian 669 660 1.01 603 1.11
NonMäoriNonPacNonAs 41,421 42,102 0.98 40,536 1.02
87,045 88,443 4.91 84,915 5.27 87,045 88,443 4.91 84,915 5.27 >= 85 yrs Mäori 513 528 0.97 450 1.14
Pacific People 276 294 0.94 252 1.10
NonMäoriNonPac 31,770 32,397 0.98 31,134 1.02
Asian 366 345 1.06 342 1.07
NonMäoriNonPacNonAs 31,407 32,052 0.98 30,795 1.02
Table 37: Census Prioritised Ethnicity by Cancer Registration and NHI Prioritised Ethnicity
Stratified by Age Group, 2006-2011
Age Group 5 Year
Age Group Prioritised Ethnicity
Census
Ethnicity
First
Cancer
Register
Eth
Census to
Cancer
Ratio
NHI
Eth
Census to
NHI Ratio
0- 4 yrs Mäori 54 54 1.00 54 1.00
Pacific People 18 18 1.00 18 1.00
NonMäoriNonPac 111 114 0.97 114 0.97
Asian 18 15 1.20 18 1.00
NonMäoriNonPacNonAs 90 96 0.94 96 0.94

75
Age Group 5 Year
Age Group Prioritised Ethnicity
Census
Ethnicity
First
Cancer
Register
Eth
Census to
Cancer
Ratio
NHI
Eth
Census to
NHI Ratio
291 297 5.11 300 4.91 5- 9 yrs Mäori 24 36 0.67 36 0.67
Pacific People 21 18 1.17 18 1.17
NonMäoriNonPac 93 84 1.11 84 1.11
NonMäoriNonPacNonAs 84 78 1.08 78 1.08
222 216 4.03 216 4.03 10-14 yrs Mäori 75 66 1.14 69 1.09
Pacific People 24 33 0.73 30 0.80
NonMäoriNonPac 198 198 1.00 201 0.99
Asian 12 9 1.33 6 2.00
NonMäoriNonPacNonAs 183 189 0.97 192 0.95
492 495 5.17 498 5.83 15-19 yrs Mäori 354 312 1.13 294 1.20
Pacific People 57 45 1.27 51 1.12
NonMäoriNonPac 1,164 1,188 0.98 1,200 0.97
Asian 48 33 1.45 30 1.60
NonMäoriNonPacNonAs 1,116 1,152 0.97 1,170 0.95
2,739 2,730 5.80 2,745 5.84 20-24 yrs Mäori 552 501 1.10 480 1.15
Pacific People 105 78 1.35 84 1.25
NonMäoriNonPac 1,992 1,962 1.02 2,037 0.98
Asian 105 84 1.25 93 1.13
NonMäoriNonPacNonAs 1,887 1,881 1.00 1,947 0.97
4,641 4,506 5.72 4,641 5.48 25-29 yrs Mäori 555 513 1.08 486 1.14
Pacific People 114 105 1.09 108 1.06
NonMäoriNonPac 2,136 2,070 1.03 2,148 0.99
Asian 138 120 1.15 120 1.15
NonMäoriNonPacNonAs 1,998 1,950 1.02 2,028 0.99
4,941 4,758 5.37 4,890 5.33 30-34 yrs Mäori 495 483 1.02 462 1.07
Pacific People 147 147 1.00 150 0.98
NonMäoriNonPac 2,493 2,367 1.05 2,427 1.03
Asian 201 174 1.16 180 1.12
NonMäoriNonPacNonAs 2,295 2,196 1.05 2,250 1.02
5,631 5,367 5.28 5,469 5.22 35-39 yrs Mäori 558 534 1.04 531 1.05
Pacific People 213 216 0.99 216 0.99
NonMäoriNonPac 3,108 2,982 1.04 2,994 1.04
Asian 249 213 1.17 228 1.09
NonMäoriNonPacNonAs 2,859 2,766 1.03 2,766 1.03
6,987 6,711 5.27 6,735 5.20

76
Age Group 5 Year
Age Group Prioritised Ethnicity
Census
Ethnicity
First
Cancer
Register
Eth
Census to
Cancer
Ratio
NHI
Eth
Census to
NHI Ratio
40-44 yrs Mäori 801 774 1.03 765 1.05
Pacific People 261 267 0.98 249 1.05
NonMäoriNonPac 4,554 4,347 1.05 4,395 1.04
Asian 393 363 1.08 375 1.05
NonMäoriNonPacNonAs 4,164 3,981 1.05 4,023 1.04
10,173 9,732 5.19 9,807 5.23 45-49 yrs Mäori 984 1,002 0.98 948 1.04
Pacific People 288 294 0.98 285 1.01
NonMäoriNonPac 6,195 5,877 1.05 5,946 1.04
Asian 408 360 1.13 381 1.07
NonMäoriNonPacNonAs 5,787 5,520 1.05 5,565 1.04
13,662 13,053 5.19 13,125 5.20 50-54 yrs Mäori 1,059 1,056 1.00 1,002 1.06
Pacific People 279 303 0.92 291 0.96
NonMäoriNonPac 7,620 7,122 1.07 7,251 1.05
Asian 369 318 1.16 336 1.10
NonMäoriNonPacNonAs 7,251 6,804 1.07 6,915 1.05
16,578 15,603 5.22 15,795 5.22 55-59 yrs Mäori 1,251 1,263 0.99 1,188 1.05
Pacific People 360 378 0.95 372 0.97
NonMäoriNonPac 10,671 10,098 1.06 10,212 1.04
Asian 339 318 1.07 315 1.08
NonMäoriNonPacNonAs 10,332 9,780 1.06 9,897 1.04
22,953 21,837 5.13 21,984 5.18 60-64 yrs Mäori 1,188 1,197 0.99 1,128 1.05
Pacific People 369 399 0.92 378 0.98
NonMäoriNonPac 12,027 11,463 1.05 11,541 1.04
Asian 351 327 1.07 324 1.08
NonMäoriNonPacNonAs 11,676 11,136 1.05 11,217 1.04
25,611 24,522 5.08 24,588 5.19 65-69 yrs Mäori 1,080 1,101 0.98 981 1.10
Pacific People 348 363 0.96 345 1.01
NonMäoriNonPac 12,183 11,742 1.04 11,817 1.03
Asian 357 351 1.02 336 1.06
NonMäoriNonPacNonAs 11,826 11,391 1.04 11,481 1.03
25,794 24,948 5.04 24,960 5.23 70-74 yrs Mäori 753 771 0.98 690 1.09
Pacific People 258 276 0.93 261 0.99
NonMäoriNonPac 11,229 10,923 1.03 10,881 1.03
Asian 285 288 0.99 270 1.06
NonMäoriNonPacNonAs 10,947 10,641 1.03 10,611 1.03
23,472 22,899 4.96 22,713 5.20
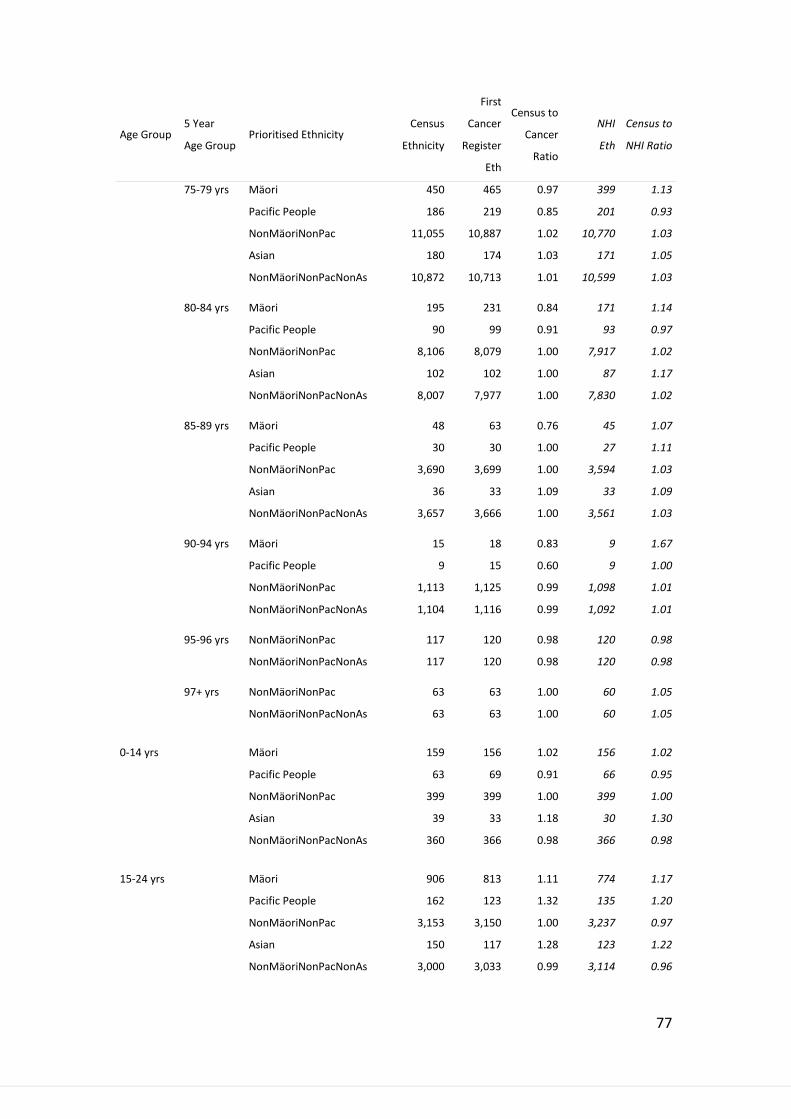
77
Age Group 5 Year
Age Group Prioritised Ethnicity
Census
Ethnicity
First
Cancer
Register
Eth
Census to
Cancer
Ratio
NHI
Eth
Census to
NHI Ratio
75-79 yrs Mäori 450 465 0.97 399 1.13
Pacific People 186 219 0.85 201 0.93
NonMäoriNonPac 11,055 10,887 1.02 10,770 1.03
Asian 180 174 1.03 171 1.05
NonMäoriNonPacNonAs 10,872 10,713 1.01 10,599 1.03
22,743 22,458 4.88 22,140 5.17 80-84 yrs Mäori 195 231 0.84 171 1.14
Pacific People 90 99 0.91 93 0.97
NonMäoriNonPac 8,106 8,079 1.00 7,917 1.02
Asian 102 102 1.00 87 1.17
NonMäoriNonPacNonAs 8,007 7,977 1.00 7,830 1.02
16,500 16,488 4.75 16,098 5.32 85-89 yrs Mäori 48 63 0.76 45 1.07
Pacific People 30 30 1.00 27 1.11
NonMäoriNonPac 3,690 3,699 1.00 3,594 1.03
Asian 36 33 1.09 33 1.09
NonMäoriNonPacNonAs 3,657 3,666 1.00 3,561 1.03
7,461 7,491 4.85 7,260 5.33 90-94 yrs Mäori 15 18 0.83 9 1.67
Pacific People 9 15 0.60 9 1.00
NonMäoriNonPac 1,113 1,125 0.99 1,098 1.01
NonMäoriNonPacNonAs 1,104 1,116 0.99 1,092 1.01
2,241 2,274 3.41 2,208 4.69 95-96 yrs NonMäoriNonPac 117 120 0.98 120 0.98
NonMäoriNonPacNonAs 117 120 0.98 120 0.98
234 240 1.96 240 1.96 97+ yrs NonMäoriNonPac 63 63 1.00 60 1.05
NonMäoriNonPacNonAs 63 63 1.00 60 1.05
126 126 2.00 120 2.10 213,492 206,751 99.41 206,532 102.9 0-14 yrs Mäori 159 156 1.02 156 1.02
Pacific People 63 69 0.91 66 0.95
NonMäoriNonPac 399 399 1.00 399 1.00
Asian 39 33 1.18 30 1.30
NonMäoriNonPacNonAs 360 366 0.98 366 0.98
1,020 1,023 5.09 1,017 5.25 1,020 1,023 5.09 1,017 5.25 15-24 yrs Mäori 906 813 1.11 774 1.17
Pacific People 162 123 1.32 135 1.20
NonMäoriNonPac 3,153 3,150 1.00 3,237 0.97
Asian 150 117 1.28 123 1.22
NonMäoriNonPacNonAs 3,000 3,033 0.99 3,114 0.96
7,371 7,236 5.70 7,383 5.52 7,371 7,236 5.70 7,383 5.52

78
Age Group 5 Year
Age Group Prioritised Ethnicity
Census
Ethnicity
First
Cancer
Register
Eth
Census to
Cancer
Ratio
NHI
Eth
Census to
NHI Ratio
25-44 yrs Mäori 2,406 2,301 1.05 2,244 1.07
Pacific People 738 729 1.01 723 1.02
NonMäoriNonPac 12,294 11,766 1.04 11,964 1.03
Asian 984 870 1.13 900 1.09
NonMäoriNonPacNonAs 11,313 10,893 1.04 11,067 1.02
27,735 26,559 5.27 26,898 5.23 27,735 26,559 5.27 26,898 5.23 45-64 yrs Mäori 4,482 4,518 0.99 4,260 1.05
Pacific People 1,299 1,368 0.95 1,329 0.98
NonMäoriNonPac 36,513 34,563 1.06 34,953 1.04
Asian 1,467 1,323 1.11 1,356 1.08
NonMäoriNonPacNonAs 35,046 33,240 1.05 33,597 1.04
78,807 75,012 5.16 75,495 5.19 78,807 75,012 5.16 75,495 5.19 65-74 yrs Mäori 1,836 1,872 0.98 1,671 1.10
Pacific People 606 639 0.95 603 1.00
NonMäoriNonPac 23,412 22,668 1.03 22,698 1.03
Asian 642 636 1.01 609 1.05
NonMäoriNonPacNonAs 22,770 22,029 1.03 22,092 1.03
49,266 47,844 5.00 47,673 5.21 49,266 47,844 5.00 47,673 5.21 75-84 yrs Mäori 645 696 0.93 570 1.13
Pacific People 276 315 0.88 294 0.94
NonMäoriNonPac 19,161 18,963 1.01 18,687 1.03
Asian 279 273 1.02 258 1.08
NonMäoriNonPacNonAs 18,879 18,690 1.01 18,426 1.02
39,240 38,937 4.85 38,235 5.20 39,240 38,937 4.85 38,235 5.20 >= 85 yrs Mäori 63 78 0.81 54 1.17
Pacific People 39 45 0.87 36 1.08
NonMäoriNonPac 4,986 5,010 1.00 4,878 1.02
Asian 42 42 1.00 42 1.00
NonMäoriNonPacNonAs 4,941 4,968 0.99 4,836 1.02

79
Unlock Ratios Stratified by NZ Deprivation
Table 38: Census Total Ethnicity by Mortality and NHI Total Ethnicity stratified by NZ
Deprivation, 2006-2011
NZDep06
Grp1
NZDep06
Grp2
NZDep06
Grp3 Total Ethnicity
Census
Deaths
Mortality
Deaths
Census
to
Mortality
Ratio
NHI
Deaths
Census
to
NHI
Ratio
Dep 1 Total NZ Mäori 195 195 1.00 165 1.18
Total Pacific 60 69 0.87 51 1.18
Total Asian 243 237 1.03 225 1.08
nonMPA
(European/Other) 8,937 9,012 0.99 8,541 1.05
Dep 2 Total NZ Mäori 345 345 1.00 318 1.08
Total Pacific 111 123 0.90 102 1.09
Total Asian 255 243 1.05 231 1.10
nonMPA
(European/Other) 10,119 10,230 0.99 9,690 1.04
Dep 3 Total NZ Mäori 477 465 1.03 426 1.12
Total Pacific 108 114 0.95 96 1.13
Total Asian 291 291 1.00 273 1.07
nonMPA
(European/Other) 11,049 11,253 0.98 10,728 1.03
Dep 4 Total NZ Mäori 609 594 1.03 531 1.15
Total Pacific 186 186 1.00 165 1.13
Total Asian 333 315 1.06 291 1.14
nonMPA
(European/Other) 12,321 12,522 0.98 11,931 1.03
Dep 5 Total NZ Mäori 735 717 1.03 633 1.16
Total Pacific 165 180 0.92 153 1.08
Total Asian 321 315 1.02 297 1.08
nonMPA
(European/Other) 12,639 12,828 0.99 12,288 1.03
Dep 6 Total NZ Mäori 1,023 957 1.07 888 1.15
Total Pacific 255 276 0.92 258 0.99
Total Asian 294 276 1.07 258 1.14
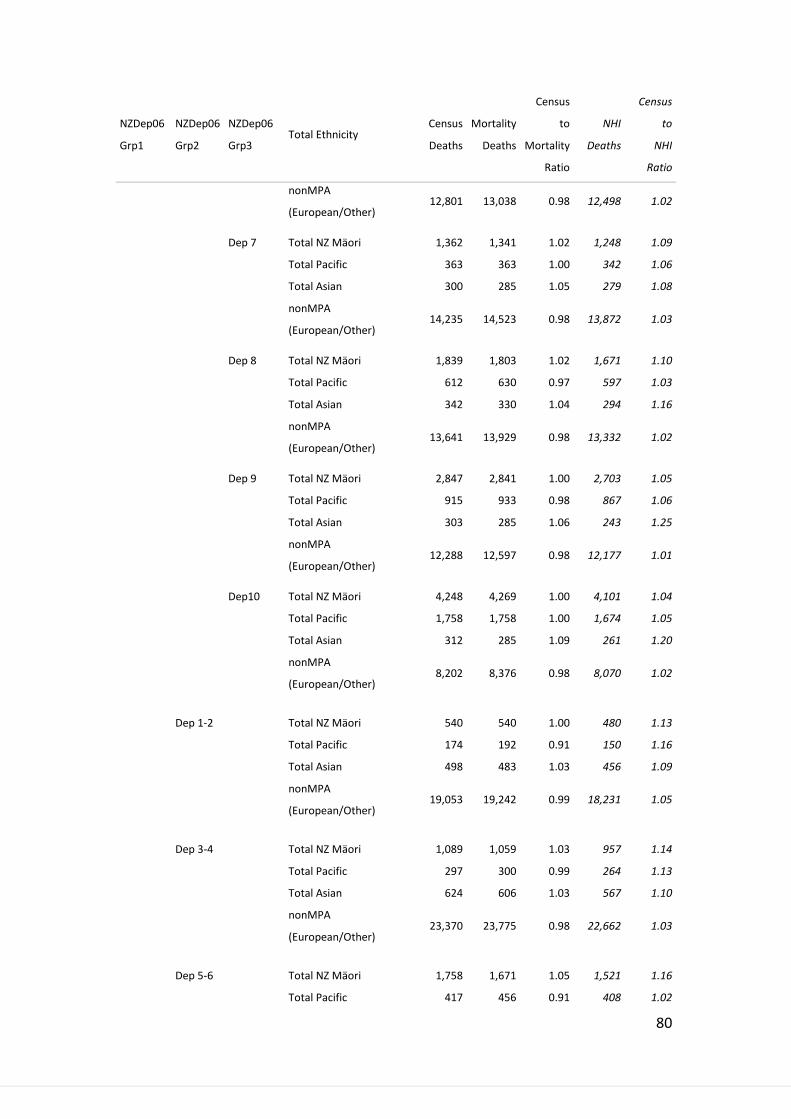
80
NZDep06
Grp1
NZDep06
Grp2
NZDep06
Grp3 Total Ethnicity
Census
Deaths
Mortality
Deaths
Census
to
Mortality
Ratio
NHI
Deaths
Census
to
NHI
Ratio
nonMPA
(European/Other) 12,801 13,038 0.98 12,498 1.02
Dep 7 Total NZ Mäori 1,362 1,341 1.02 1,248 1.09
Total Pacific 363 363 1.00 342 1.06
Total Asian 300 285 1.05 279 1.08
nonMPA
(European/Other) 14,235 14,523 0.98 13,872 1.03
Dep 8 Total NZ Mäori 1,839 1,803 1.02 1,671 1.10
Total Pacific 612 630 0.97 597 1.03
Total Asian 342 330 1.04 294 1.16
nonMPA
(European/Other) 13,641 13,929 0.98 13,332 1.02
Dep 9 Total NZ Mäori 2,847 2,841 1.00 2,703 1.05
Total Pacific 915 933 0.98 867 1.06
Total Asian 303 285 1.06 243 1.25
nonMPA
(European/Other) 12,288 12,597 0.98 12,177 1.01
Dep10 Total NZ Mäori 4,248 4,269 1.00 4,101 1.04
Total Pacific 1,758 1,758 1.00 1,674 1.05
Total Asian 312 285 1.09 261 1.20
nonMPA
(European/Other) 8,202 8,376 0.98 8,070 1.02
Dep 1-2 Total NZ Mäori 540 540 1.00 480 1.13
Total Pacific 174 192 0.91 150 1.16
Total Asian 498 483 1.03 456 1.09
nonMPA
(European/Other) 19,053 19,242 0.99 18,231 1.05
Dep 3-4 Total NZ Mäori 1,089 1,059 1.03 957 1.14
Total Pacific 297 300 0.99 264 1.13
Total Asian 624 606 1.03 567 1.10
nonMPA
(European/Other) 23,370 23,775 0.98 22,662 1.03
Dep 5-6 Total NZ Mäori 1,758 1,671 1.05 1,521 1.16
Total Pacific 417 456 0.91 408 1.02

81
NZDep06
Grp1
NZDep06
Grp2
NZDep06
Grp3 Total Ethnicity
Census
Deaths
Mortality
Deaths
Census
to
Mortality
Ratio
NHI
Deaths
Census
to
NHI
Ratio
Total Asian 612 591 1.04 555 1.10
nonMPA
(European/Other) 25,440 25,869 0.98 24,786 1.03
Dep 7-8 Total NZ Mäori 3,201 3,141 1.02 2,922 1.10
Total Pacific 975 993 0.98 939 1.04
Total Asian 642 615 1.04 576 1.11
nonMPA
(European/Other) 27,873 28,452 0.98 27,204 1.02
Dep 9-10 Total NZ Mäori 7,095 7,110 1.00 6,804 1.04
Total Pacific 2,670 2,691 0.99 2,541 1.05
Total Asian 618 570 1.08 504 1.23
nonMPA
(European/Other) 20,487 20,973 0.98 20,247 1.01
Dep 1-6 Total NZ Mäori 3,387 3,273 1.03 2,958 1.15
Total Pacific 885 948 0.93 822 1.08
Total Asian 1,734 1,680 1.03 1,578 1.10
nonMPA
(European/Other) 67,863 68,886 0.99 65,676 1.03
Dep 7-10 Total NZ Mäori 10,293 10,254 1.00 9,723 1.06
Total Pacific 3,645 3,684 0.99 3,480 1.05
Total Asian 1,260 1,185 1.06 1,077 1.17
nonMPA
(European/Other) 48,360 49,425 0.98 47,451 1.02
Table 39: Census Total Ethnicity by Cancer Registration and NHI Total Ethnicity stratified by
NZ Deprivation, 2006-2011
NZDep06
Grp1
NZDep06
Grp2
NZDep06
Grp3 Total Ethnicity
Census
Ethnicity
First
Cancer
Register
Eth
Census
to
Cancer
Ratio
NHI
Eth
Census
to
NHI
Ratio
Dep 1 Total NZ Mäori 333 315 1.06 285 1.17
Total Pacific 63 87 0.72 72 0.88

82
NZDep06
Grp1
NZDep06
Grp2
NZDep06
Grp3 Total Ethnicity
Census
Ethnicity
First
Cancer
Register
Eth
Census
to
Cancer
Ratio
NHI
Eth
Census
to
NHI
Ratio
Total Asian 375 345 1.09 342 1.10
nonMPA
(European/Other) 11,277 10,632 1.06 10,722 1.05
Dep 2 Total NZ Mäori 402 369 1.09 336 1.20
Total Pacific 96 105 0.91 93 1.03
Total Asian 375 345 1.09 348 1.08
nonMPA
(European/Other) 11,094 10,524 1.05 10,608 1.05
Dep 3 Total NZ Mäori 465 420 1.11 375 1.24
Total Pacific 117 120 0.98 114 1.03
Total Asian 399 372 1.07 372 1.07
nonMPA
(European/Other) 10,812 10,356 1.04 10,380 1.04
Dep 4 Total NZ Mäori 525 510 1.03 462 1.14
Total Pacific 168 192 0.88 165 1.02
Total Asian 393 363 1.08 348 1.13
nonMPA
(European/Other) 10,698 10,329 1.04 10,353 1.03
Dep 5 Total NZ Mäori 708 669 1.06 618 1.15
Total Pacific 153 150 1.02 147 1.04
Total Asian 447 417 1.07 411 1.09
nonMPA
(European/Other) 10,548 10,272 1.03 10,275 1.03
Dep 6 Total NZ Mäori 933 918 1.02 870 1.07
Total Pacific 240 267 0.90 249 0.96
Total Asian 381 342 1.11 336 1.13
nonMPA
(European/Other) 10,116 9,861 1.03 9,849 1.03
Dep 7 Total NZ Mäori 1,074 1,059 1.01 981 1.09
Total Pacific 288 276 1.04 267 1.08
Total Asian 420 381 1.10 390 1.08
nonMPA
(European/Other) 10,113 9,900 1.02 9,852 1.03
Dep 8 Total NZ Mäori 1,410 1,425 0.99 1,329 1.06
Total Pacific 501 519 0.97 489 1.02

83
NZDep06
Grp1
NZDep06
Grp2
NZDep06
Grp3 Total Ethnicity
Census
Ethnicity
First
Cancer
Register
Eth
Census
to
Cancer
Ratio
NHI
Eth
Census
to
NHI
Ratio
Total Asian 378 339 1.12 336 1.13
nonMPA
(European/Other) 8,889 8,742 1.02 8,766 1.01
Dep 9 Total NZ Mäori 2,004 2,028 0.99 1,908 1.05
Total Pacific 651 687 0.95 657 0.99
Total Asian 309 291 1.06 270 1.14
nonMPA
(European/Other) 7,806 7,692 1.01 7,710 1.01
Dep10 Total NZ Mäori 2,646 2,715 0.97 2,574 1.03
Total Pacific 1,113 1,107 1.01 1,056 1.05
Total Asian 291 291 1.00 270 1.08
nonMPA
(European/Other) 4,950 4,902 1.01 4,962 1.00
Dep 1-2 Total NZ Mäori 732 681 1.07 621 1.18
Total Pacific 159 192 0.83 162 0.98
Total Asian 753 690 1.09 690 1.09
nonMPA
(European/Other) 22,371 21,153 1.06 21,333 1.05
Dep 3-4 Total NZ Mäori 987 930 1.06 834 1.18
Total Pacific 285 312 0.91 279 1.02
Total Asian 792 735 1.08 717 1.10
nonMPA
(European/Other) 21,507 20,682 1.04 20,736 1.04
Dep 5-6 Total NZ Mäori 1,641 1,584 1.04 1,485 1.11
Total Pacific 393 414 0.95 393 1.00
Total Asian 825 759 1.09 744 1.11
nonMPA
(European/Other) 20,658 20,133 1.03 20,127 1.03
Dep 7-8 Total NZ Mäori 2,481 2,490 1.00 2,310 1.07
Total Pacific 789 795 0.99 753 1.05
Total Asian 798 720 1.11 726 1.10
nonMPA
(European/Other) 19,002 18,645 1.02 18,618 1.02
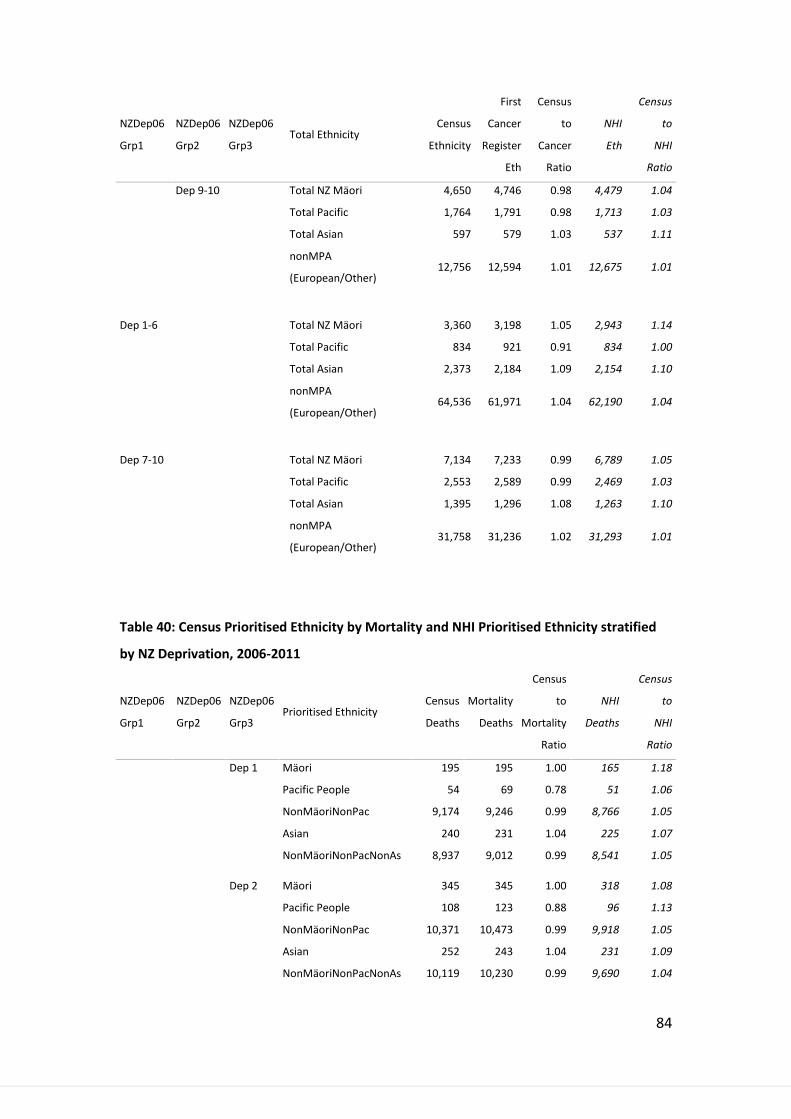
84
NZDep06
Grp1
NZDep06
Grp2
NZDep06
Grp3 Total Ethnicity
Census
Ethnicity
First
Cancer
Register
Eth
Census
to
Cancer
Ratio
NHI
Eth
Census
to
NHI
Ratio
Dep 9-10 Total NZ Mäori 4,650 4,746 0.98 4,479 1.04
Total Pacific 1,764 1,791 0.98 1,713 1.03
Total Asian 597 579 1.03 537 1.11
nonMPA
(European/Other) 12,756 12,594 1.01 12,675 1.01
Dep 1-6 Total NZ Mäori 3,360 3,198 1.05 2,943 1.14
Total Pacific 834 921 0.91 834 1.00
Total Asian 2,373 2,184 1.09 2,154 1.10
nonMPA
(European/Other) 64,536 61,971 1.04 62,190 1.04
Dep 7-10 Total NZ Mäori 7,134 7,233 0.99 6,789 1.05
Total Pacific 2,553 2,589 0.99 2,469 1.03
Total Asian 1,395 1,296 1.08 1,263 1.10
nonMPA
(European/Other) 31,758 31,236 1.02 31,293 1.01
Table 40: Census Prioritised Ethnicity by Mortality and NHI Prioritised Ethnicity stratified
by NZ Deprivation, 2006-2011
NZDep06
Grp1
NZDep06
Grp2
NZDep06
Grp3 Prioritised Ethnicity
Census
Deaths
Mortality
Deaths
Census
to
Mortality
Ratio
NHI
Deaths
Census
to
NHI
Ratio
Dep 1 Mäori 195 195 1.00 165 1.18
Pacific People 54 69 0.78 51 1.06
NonMäoriNonPac 9,174 9,246 0.99 8,766 1.05
Asian 240 231 1.04 225 1.07
NonMäoriNonPacNonAs 8,937 9,012 0.99 8,541 1.05
Dep 2 Mäori 345 345 1.00 318 1.08
Pacific People 108 123 0.88 96 1.13
NonMäoriNonPac 10,371 10,473 0.99 9,918 1.05
Asian 252 243 1.04 231 1.09
NonMäoriNonPacNonAs 10,119 10,230 0.99 9,690 1.04

85
NZDep06
Grp1
NZDep06
Grp2
NZDep06
Grp3 Prioritised Ethnicity
Census
Deaths
Mortality
Deaths
Census
to
Mortality
Ratio
NHI
Deaths
Census
to
NHI
Ratio
Dep 3 Mäori 477 465 1.03 426 1.12
Pacific People 108 111 0.97 93 1.16
NonMäoriNonPac 11,334 11,541 0.98 10,995 1.03
Asian 285 285 1.00 270 1.06
NonMäoriNonPacNonAs 11,049 11,253 0.98 10,728 1.03
Dep 4 Mäori 609 594 1.03 531 1.15
Pacific People 174 180 0.97 165 1.05
NonMäoriNonPac 12,648 12,831 0.99 12,219 1.04
Asian 324 309 1.05 288 1.13
NonMäoriNonPacNonAs 12,321 12,522 0.98 11,931 1.03
Dep 5 Mäori 735 717 1.03 633 1.16
Pacific People 156 174 0.90 150 1.04
NonMäoriNonPac 12,957 13,137 0.99 12,579 1.03
Asian 318 306 1.04 291 1.09
NonMäoriNonPacNonAs 12,639 12,828 0.99 12,288 1.03
Dep 6 Mäori 1,023 957 1.07 888 1.15
Pacific People 246 273 0.90 252 0.98
NonMäoriNonPac 13,089 13,305 0.98 12,750 1.03
Asian 285 264 1.08 249 1.14
NonMäoriNonPacNonAs 12,801 13,038 0.98 12,498 1.02
Dep 7 Mäori 1,362 1,341 1.02 1,248 1.09
Pacific People 345 360 0.96 339 1.02
NonMäoriNonPac 14,526 14,796 0.98 14,139 1.03
Asian 294 270 1.09 270 1.09
NonMäoriNonPacNonAs 14,235 14,523 0.98 13,872 1.03
Dep 8 Mäori 1,839 1,803 1.02 1,671 1.10
Pacific People 588 606 0.97 576 1.02
NonMäoriNonPac 13,965 14,232 0.98 13,611 1.03
Asian 327 303 1.08 282 1.16
NonMäoriNonPacNonAs 13,641 13,929 0.98 13,332 1.02
Dep 9 Mäori 2,847 2,841 1.00 2,703 1.05
Pacific People 876 906 0.97 849 1.03
NonMäoriNonPac 12,573 12,849 0.98 12,405 1.01
Asian 285 252 1.13 228 1.25
NonMäoriNonPacNonAs 12,288 12,597 0.98 12,177 1.01

86
NZDep06
Grp1
NZDep06
Grp2
NZDep06
Grp3 Prioritised Ethnicity
Census
Deaths
Mortality
Deaths
Census
to
Mortality
Ratio
NHI
Deaths
Census
to
NHI
Ratio
Dep10 Mäori 4,248 4,269 1.00 4,101 1.04
Pacific People 1,689 1,725 0.98 1,641 1.03
NonMäoriNonPac 8,469 8,628 0.98 8,307 1.02
Asian 270 252 1.07 237 1.14
NonMäoriNonPacNonAs 8,202 8,376 0.98 8,070 1.02
Dep 1-2 Mäori 540 540 1.00 480 1.13
Pacific People 162 189 0.86 150 1.08
NonMäoriNonPac 19,545 19,719 0.99 18,684 1.05
Asian 492 474 1.04 453 1.09
NonMäoriNonPacNonAs 19,053 19,242 0.99 18,231 1.05
Dep 3-4 Mäori 1,089 1,059 1.03 957 1.14
Pacific People 282 294 0.96 258 1.09
NonMäoriNonPac 23,979 24,372 0.98 23,214 1.03
Asian 609 597 1.02 555 1.10
NonMäoriNonPacNonAs 23,370 23,775 0.98 22,662 1.03
Dep 5-6 Mäori 1,758 1,671 1.05 1,521 1.16
Pacific People 402 447 0.90 402 1.00
NonMäoriNonPac 26,046 26,439 0.99 25,326 1.03
Asian 603 573 1.05 540 1.12
NonMäoriNonPacNonAs 25,440 25,869 0.98 24,786 1.03
Dep 7-8 Mäori 3,201 3,141 1.02 2,922 1.10
Pacific People 936 963 0.97 918 1.02
NonMäoriNonPac 28,494 29,025 0.98 27,753 1.03
Asian 621 576 1.08 549 1.13
NonMäoriNonPacNonAs 27,873 28,452 0.98 27,204 1.02
Dep 9-10 Mäori 7,095 7,110 1.00 6,804 1.04
Pacific People 2,562 2,631 0.97 2,487 1.03
NonMäoriNonPac 21,042 21,480 0.98 20,712 1.02
Asian 552 507 1.09 465 1.19
NonMäoriNonPacNonAs 20,487 20,973 0.98 20,247 1.01
Dep 1-6 Mäori 3,387 3,273 1.03 2,958 1.15
Pacific People 849 930 0.91 810 1.05

87
NZDep06
Grp1
NZDep06
Grp2
NZDep06
Grp3 Prioritised Ethnicity
Census
Deaths
Mortality
Deaths
Census
to
Mortality
Ratio
NHI
Deaths
Census
to
NHI
Ratio
NonMäoriNonPac 69,570 70,530 0.99 67,227 1.03
Asian 1,707 1,644 1.04 1,551 1.10
NonMäoriNonPacNonAs 67,863 68,886 0.99 65,676 1.03
Dep 7-10 Mäori 10,293 10,254 1.00 9,723 1.06
Pacific People 3,498 3,591 0.97 3,408 1.03
NonMäoriNonPac 49,536 50,505 0.98 48,465 1.02
Asian 1,173 1,077 1.09 1,014 1.16
NonMäoriNonPacNonAs 48,360 49,425 0.98 47,451 1.02
Table 41: Census Prioritised Ethnicity by Cancer Registration and NHI Prioritised Ethnicity
stratified by NZ Depriviation, 2006-2011
NZDep06
Grp1
NZDep06
Grp2
NZDep06
Grp3 Prioritised Ethnicity
Census
Ethnicity
First
Cancer
Register
Eth
Census
to
Cancer
Ratio
NHI
Eth
Census
to
NHI
Ratio
Dep 1 Mäori 333 315 1.06 285 1.17
Pacific People 54 75 0.72 63 0.86
NonMäoriNonPac 11,643 10,965 1.06 11,061 1.05
Asian 366 333 1.10 336 1.09
NonMäoriNonPacNonAs 11,277 10,632 1.06 10,722 1.05
Dep 2 Mäori 402 369 1.09 336 1.20
Pacific People 90 96 0.94 90 1.00
NonMäoriNonPac 11,466 10,857 1.06 10,947 1.05
Asian 372 336 1.11 339 1.10
NonMäoriNonPacNonAs 11,094 10,524 1.05 10,608 1.05
Dep 3 Mäori 465 420 1.11 375 1.24
Pacific People 108 117 0.92 111 0.97
NonMäoriNonPac 11,199 10,722 1.04 10,749 1.04
Asian 390 369 1.06 369 1.06
NonMäoriNonPacNonAs 10,812 10,356 1.04 10,380 1.04
Dep 4 Mäori 525 510 1.03 462 1.14
Pacific People 156 186 0.84 159 0.98
NonMäoriNonPac 11,082 10,671 1.04 10,695 1.04
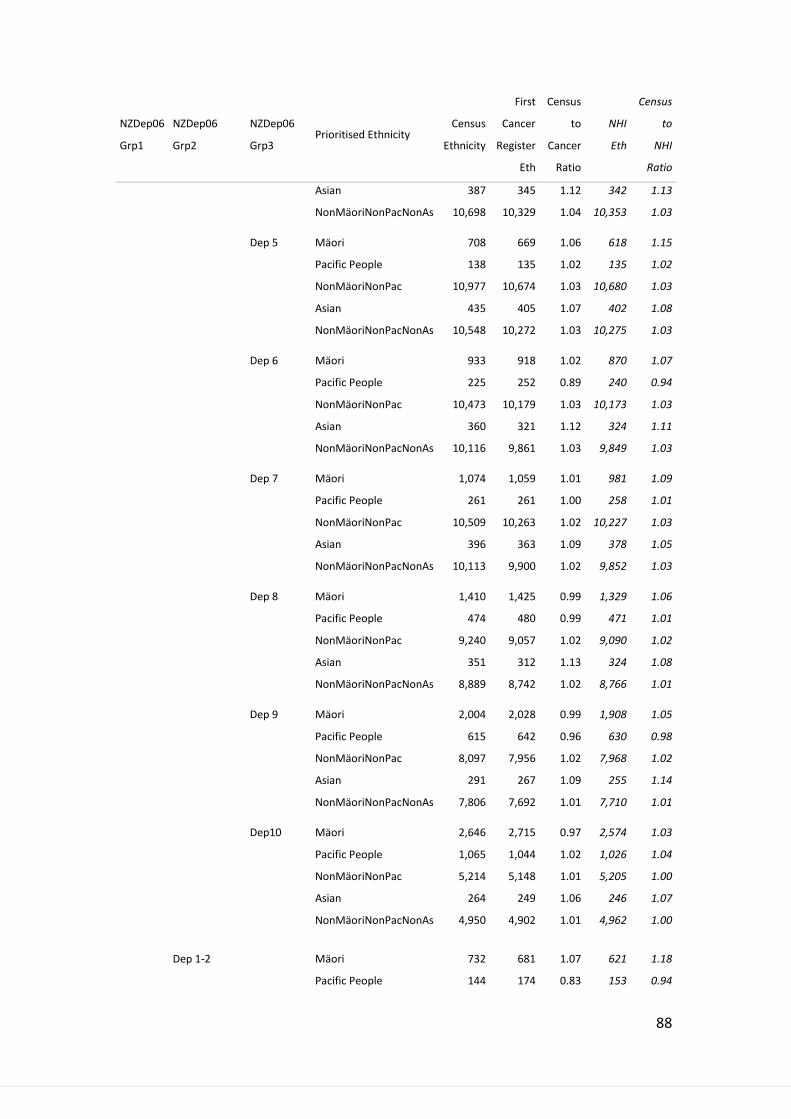
88
NZDep06
Grp1
NZDep06
Grp2
NZDep06
Grp3 Prioritised Ethnicity
Census
Ethnicity
First
Cancer
Register
Eth
Census
to
Cancer
Ratio
NHI
Eth
Census
to
NHI
Ratio
Asian 387 345 1.12 342 1.13
NonMäoriNonPacNonAs 10,698 10,329 1.04 10,353 1.03
Dep 5 Mäori 708 669 1.06 618 1.15
Pacific People 138 135 1.02 135 1.02
NonMäoriNonPac 10,977 10,674 1.03 10,680 1.03
Asian 435 405 1.07 402 1.08
NonMäoriNonPacNonAs 10,548 10,272 1.03 10,275 1.03
Dep 6 Mäori 933 918 1.02 870 1.07
Pacific People 225 252 0.89 240 0.94
NonMäoriNonPac 10,473 10,179 1.03 10,173 1.03
Asian 360 321 1.12 324 1.11
NonMäoriNonPacNonAs 10,116 9,861 1.03 9,849 1.03
Dep 7 Mäori 1,074 1,059 1.01 981 1.09
Pacific People 261 261 1.00 258 1.01
NonMäoriNonPac 10,509 10,263 1.02 10,227 1.03
Asian 396 363 1.09 378 1.05
NonMäoriNonPacNonAs 10,113 9,900 1.02 9,852 1.03
Dep 8 Mäori 1,410 1,425 0.99 1,329 1.06
Pacific People 474 480 0.99 471 1.01
NonMäoriNonPac 9,240 9,057 1.02 9,090 1.02
Asian 351 312 1.13 324 1.08
NonMäoriNonPacNonAs 8,889 8,742 1.02 8,766 1.01
Dep 9 Mäori 2,004 2,028 0.99 1,908 1.05
Pacific People 615 642 0.96 630 0.98
NonMäoriNonPac 8,097 7,956 1.02 7,968 1.02
Asian 291 267 1.09 255 1.14
NonMäoriNonPacNonAs 7,806 7,692 1.01 7,710 1.01
Dep10 Mäori 2,646 2,715 0.97 2,574 1.03
Pacific People 1,065 1,044 1.02 1,026 1.04
NonMäoriNonPac 5,214 5,148 1.01 5,205 1.00
Asian 264 249 1.06 246 1.07
NonMäoriNonPacNonAs 4,950 4,902 1.01 4,962 1.00
Dep 1-2 Mäori 732 681 1.07 621 1.18
Pacific People 144 174 0.83 153 0.94

89
NZDep06
Grp1
NZDep06
Grp2
NZDep06
Grp3 Prioritised Ethnicity
Census
Ethnicity
First
Cancer
Register
Eth
Census
to
Cancer
Ratio
NHI
Eth
Census
to
NHI
Ratio
NonMäoriNonPac 23,109 21,825 1.06 22,008 1.05
Asian 741 669 1.11 675 1.10
NonMäoriNonPacNonAs 22,371 21,153 1.06 21,333 1.05
Dep 3-4 Mäori 987 930 1.06 834 1.18
Pacific People 264 300 0.88 270 0.98
NonMäoriNonPac 22,278 21,396 1.04 21,444 1.04
Asian 774 711 1.09 711 1.09
NonMäoriNonPacNonAs 21,507 20,682 1.04 20,736 1.04
Dep 5-6 Mäori 1,641 1,584 1.04 1,485 1.11
Pacific People 363 384 0.95 375 0.97
NonMäoriNonPac 21,453 20,853 1.03 20,853 1.03
Asian 795 723 1.10 726 1.10
NonMäoriNonPacNonAs 20,658 20,133 1.03 20,127 1.03
Dep 7-8 Mäori 2,481 2,490 1.00 2,310 1.07
Pacific People 735 744 0.99 729 1.01
NonMäoriNonPac 19,749 19,320 1.02 19,320 1.02
Asian 747 678 1.10 699 1.07
NonMäoriNonPacNonAs 19,002 18,645 1.02 18,618 1.02
Dep 9-10 Mäori 4,650 4,746 0.98 4,479 1.04
Pacific People 1,677 1,686 0.99 1,656 1.01
NonMäoriNonPac 13,311 13,104 1.02 13,176 1.01
Asian 558 513 1.09 501 1.11
NonMäoriNonPacNonAs 12,756 12,594 1.01 12,675 1.01
Dep 1-6 Mäori 3,360 3,198 1.05 2,943 1.14
Pacific People 768 858 0.90 798 0.96
NonMäoriNonPac 66,843 64,074 1.04 64,308 1.04
Asian 2,307 2,103 1.10 2,112 1.09
NonMäoriNonPacNonAs 64,536 61,971 1.04 62,190 1.04
Dep 7-10 Mäori 7,134 7,233 0.99 6,789 1.05
Pacific People 2,412 2,427 0.99 2,385 1.01
NonMäoriNonPac 33,060 32,427 1.02 32,493 1.02
Asian 1,302 1,191 1.09 1,200 1.09
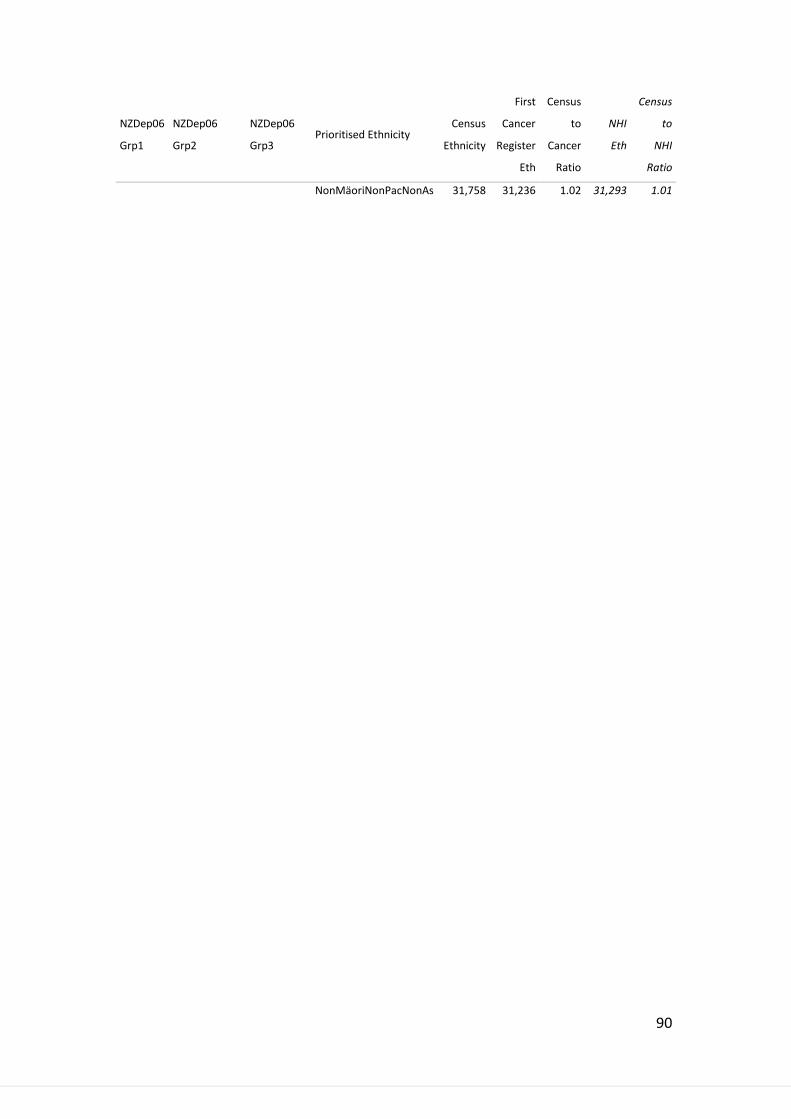
90
NZDep06
Grp1
NZDep06
Grp2
NZDep06
Grp3 Prioritised Ethnicity
Census
Ethnicity
First
Cancer
Register
Eth
Census
to
Cancer
Ratio
NHI
Eth
Census
to
NHI
Ratio
NonMäoriNonPacNonAs 31,758 31,236 1.02 31,293 1.01

91
Unlock Ratios Stratified by Regional Health Authority (RHA) or Regional
Council
Table 42: Census Total Ethnicity by Mortality and NHI Total Ethnicity stratified by RHA or
Regional Council, 2006-2011
Regional
Health
Authority
Regional
Council Total Ethnicity
Census
Deaths
Mortality
Deaths
Census
to
Mortality
Ratio
NHI
Deaths
Census
to
NHI
Ratio
Not
Applicable Northland Region Total NZ Mäori 1,446 1,479 0.98 1,374 1.05
Total Pacific 51 48 1.06 36 1.42
Total Asian 24 21 1.14 18 1.33
nonMPA
(European/Other) 4,485 4,578 0.98 4,533 0.99
Auckland Region Total NZ Mäori 2,793 2,799 1.00 2,613 1.07
Total Pacific 3,186 3,321 0.96 3,105 1.03
Total Asian 1,872 1,818 1.03 1,707 1.10
nonMPA
(European/Other) 26,499 26,964 0.98 25,689 1.03
Waikato Region Total NZ Mäori 2,073 1,965 1.05 1,938 1.07
Total Pacific 201 207 0.97 186 1.08
Total Asian 150 132 1.14 126 1.19
nonMPA
(European/Other) 11,043 11,325 0.98 10,719 1.03
Bay of Plenty Region Total NZ Mäori 1,929 1,926 1.00 1,896 1.02
Total Pacific 135 126 1.07 123 1.10
Total Asian 81 72 1.13 66 1.23
nonMPA
(European/Other) 8,613 8,769 0.98 8,532 1.01
Gisborne Region Total NZ Mäori 663 711 0.93 672 0.99
nonMPA
(European/Other) 1,134 1,119 1.01 1,128 1.01
Hawke's Bay Region Total NZ Mäori 948 885 1.07 891 1.06
Total Pacific 78 81 0.96 66 1.18
Total Asian 60 51 1.18 42 1.43

92
Regional
Health
Authority
Regional
Council Total Ethnicity
Census
Deaths
Mortality
Deaths
Census
to
Mortality
Ratio
NHI
Deaths
Census
to
NHI
Ratio
nonMPA
(European/Other) 4,959 5,052 0.98 4,788 1.04
Taranaki Region Total NZ Mäori 390 390 1.00 354 1.10
Total Pacific 18 18 1.00 9 2.00
Total Asian 12 15 0.80 12 1.00
nonMPA
(European/Other) 3,801 3,891 0.98 3,675 1.03
Manawatu-Wanganui
Region Total NZ Mäori 1,029 1,050 0.98 912 1.13
Total Pacific 60 51 1.18 42 1.43
Total Asian 81 78 1.04 69 1.17
nonMPA
(European/Other) 7,719 7,770 0.99 7,071 1.09
Wellington Region Total NZ Mäori 996 1,023 0.97 900 1.11
Total Pacific 552 549 1.01 528 1.05
Total Asian 402 384 1.05 363 1.11
nonMPA
(European/Other) 11,469 11,661 0.98 11,040 1.04
West Coast Region Total NZ Mäori 63 69 0.91 57 1.11
nonMPA
(European/Other) 1,230 1,251 0.98 1,227 1.00
Canterbury Region Total NZ Mäori 696 615 1.13 555 1.25
Total Pacific 153 144 1.06 138 1.11
Total Asian 216 198 1.09 174 1.24
nonMPA
(European/Other) 19,521 19,848 0.98 18,891 1.03
Otago Region Total NZ Mäori 180 168 1.07 144 1.25
Total Pacific 36 42 0.86 30 1.20
Total Asian 54 57 0.95 51 1.06
nonMPA
(European/Other) 7,404 7,533 0.98 7,398 1.00
Southland Region Total NZ Mäori 261 249 1.05 204 1.28
Total Pacific 27 27 1.00 27 1.00
Total Asian 12 9 1.33 6 2.00

93
Regional
Health
Authority
Regional
Council Total Ethnicity
Census
Deaths
Mortality
Deaths
Census
to
Mortality
Ratio
NHI
Deaths
Census
to
NHI
Ratio
nonMPA
(European/Other) 3,477 3,558 0.98 3,525 0.99
Tasman Region Total NZ Mäori 45 51 0.88 39 1.15
nonMPA
(European/Other) 1,488 1,497 0.99 1,476 1.01
Nelson Region Total NZ Mäori 60 36 1.67 30 2.00
Total Pacific 12 9 1.33 9 1.33
nonMPA
(European/Other) 1,716 1,794 0.96 1,758 0.98
Marlborough Region Total NZ Mäori 105 96 1.09 90 1.17
nonMPA
(European/Other) 1,671 1,701 0.98 1,671 1.00
Northern Total NZ Mäori 4,308 4,362 0.99 4,065 1.06
Total Pacific 3,243 3,375 0.96 3,138 1.03
Total Asian 1,902 1,845 1.03 1,725 1.10
nonMPA
(European/Other) 31,287 31,842 0.98 30,510 1.03
Midland Total NZ Mäori 5,103 5,028 1.01 4,899 1.04
Total Pacific 363 348 1.04 324 1.12
Total Asian 252 228 1.11 213 1.18
nonMPA
(European/Other) 24,534 25,053 0.98 24,000 1.02
Central Total NZ Mäori 3,075 3,033 1.01 2,757 1.12
Total Pacific 708 696 1.02 645 1.10
Total Asian 552 525 1.05 483 1.14
nonMPA
(European/Other) 28,782 29,235 0.98 27,582 1.04
Southern Total NZ Mäori 1,200 1,104 1.09 963 1.25
Total Pacific 219 216 1.01 195 1.12
Total Asian 288 270 1.07 237 1.22
nonMPA
(European/Other) 31,635 32,187 0.98 31,041 1.02

94
Table 43: Census Total Ethnicity by Cancer Registration and NHI Total Ethnicity stratified by
RHA or Regional Council, 2006-2011
Regional
Health
Authority
Regional
Council Total Ethnicity
Census
Ethnicity
First
Cancer
Register
Eth
Census
to
Cancer
Ratio
NHI
Eth
Census
to
NHI
Ratio
Not
Applicable Northland Region Total NZ Mäori 900 936 0.96 870 1.03
Total Pacific 42 42 1.00 36 1.17
Total Asian 18 24 0.75 15 1.20
nonMPA
(European/Other) 3,726 3,687 1.01 3,741 1.00
Auckland Region Total NZ Mäori 2,364 2,295 1.03 2,160 1.09
Total Pacific 2,295 2,385 0.96 2,268 1.01
Total Asian 2,502 2,352 1.06 2,340 1.07
nonMPA
(European/Other) 23,886 22,629 1.06 23,088 1.03
Waikato Region Total NZ Mäori 1,386 1,377 1.01 1,275 1.09
Total Pacific 147 150 0.98 141 1.04
Total Asian 159 138 1.15 138 1.15
nonMPA
(European/Other) 9,207 8,832 1.04 8,673 1.06
Bay of Plenty Region Total NZ Mäori 1,413 1,410 1.00 1,329 1.06
Total Pacific 87 87 1.00 84 1.04
Total Asian 93 69 1.35 75 1.24
nonMPA
(European/Other) 7,575 7,449 1.02 7,548 1.00
Gisborne Region Total NZ Mäori 432 444 0.97 423 1.02
nonMPA
(European/Other) 939 930 1.01 951 0.99
Hawke's Bay Region Total NZ Mäori 660 681 0.97 633 1.04
Total Pacific 60 63 0.95 51 1.18
Total Asian 48 36 1.33 36 1.33
nonMPA
(European/Other) 4,008 3,804 1.05 3,876 1.03
Taranaki Region Total NZ Mäori 264 285 0.93 264 1.00
Total Pacific 9 9 1.00 6 1.50
Total Asian 24 21 1.14 21 1.14

95
Regional
Health
Authority
Regional
Council Total Ethnicity
Census
Ethnicity
First
Cancer
Register
Eth
Census
to
Cancer
Ratio
NHI
Eth
Census
to
NHI
Ratio
nonMPA
(European/Other) 2,988 2,901 1.03 2,937 1.02
Manawatu-Wanganui
Region Total NZ Mäori 810 789 1.03 732 1.11
Total Pacific 60 48 1.25 45 1.33
Total Asian 81 72 1.13 60 1.35
nonMPA
(European/Other) 6,237 6,048 1.03 5,721 1.09
Wellington Region Total NZ Mäori 897 948 0.95 873 1.03
Total Pacific 450 480 0.94 459 0.98
Total Asian 447 420 1.06 405 1.10
nonMPA
(European/Other) 8,937 8,598 1.04 8,631 1.04
West Coast Region Total NZ Mäori 60 66 0.91 60 1.00
nonMPA
(European/Other) 933 921 1.01 921 1.01
Canterbury Region Total NZ Mäori 729 675 1.08 630 1.16
Total Pacific 147 156 0.94 135 1.09
Total Asian 303 273 1.11 249 1.22
nonMPA
(European/Other) 16,020 15,696 1.02 15,651 1.02
Otago Region Total NZ Mäori 177 165 1.07 150 1.18
Total Pacific 39 45 0.87 39 1.00
Total Asian 63 51 1.24 51 1.24
nonMPA
(European/Other) 5,463 5,415 1.01 5,403 1.01
Southland Region Total NZ Mäori 195 189 1.03 159 1.23
Total Pacific 21 18 1.17 18 1.17
nonMPA
(European/Other) 2,268 2,238 1.01 2,268 1.00
Tasman Region Total NZ Mäori 57 45 1.27 54 1.06
nonMPA
(European/Other) 1,335 1,314 1.02 1,314 1.02
Nelson Region Total NZ Mäori 48 42 1.14 42 1.14
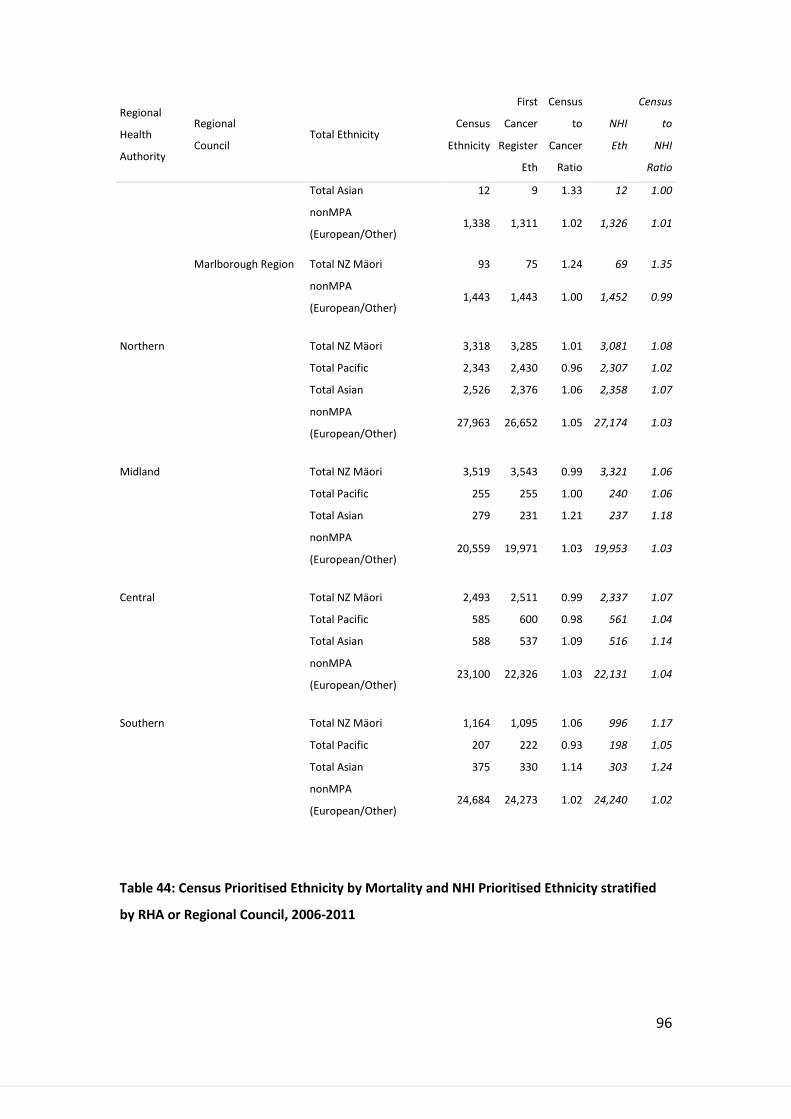
96
Regional
Health
Authority
Regional
Council Total Ethnicity
Census
Ethnicity
First
Cancer
Register
Eth
Census
to
Cancer
Ratio
NHI
Eth
Census
to
NHI
Ratio
Total Asian 12 9 1.33 12 1.00
nonMPA
(European/Other) 1,338 1,311 1.02 1,326 1.01
Marlborough Region Total NZ Mäori 93 75 1.24 69 1.35
nonMPA
(European/Other) 1,443 1,443 1.00 1,452 0.99
Northern Total NZ Mäori 3,318 3,285 1.01 3,081 1.08
Total Pacific 2,343 2,430 0.96 2,307 1.02
Total Asian 2,526 2,376 1.06 2,358 1.07
nonMPA
(European/Other) 27,963 26,652 1.05 27,174 1.03
Midland Total NZ Mäori 3,519 3,543 0.99 3,321 1.06
Total Pacific 255 255 1.00 240 1.06
Total Asian 279 231 1.21 237 1.18
nonMPA
(European/Other) 20,559 19,971 1.03 19,953 1.03
Central Total NZ Mäori 2,493 2,511 0.99 2,337 1.07
Total Pacific 585 600 0.98 561 1.04
Total Asian 588 537 1.09 516 1.14
nonMPA
(European/Other) 23,100 22,326 1.03 22,131 1.04
Southern Total NZ Mäori 1,164 1,095 1.06 996 1.17
Total Pacific 207 222 0.93 198 1.05
Total Asian 375 330 1.14 303 1.24
nonMPA
(European/Other) 24,684 24,273 1.02 24,240 1.02
Table 44: Census Prioritised Ethnicity by Mortality and NHI Prioritised Ethnicity stratified
by RHA or Regional Council, 2006-2011

97
Regional
Health
Authority
Regional
Council Prioritised Ethnicity
Census
Deaths
Mortality
Deaths
Census
to
Mortality
Ratio
NHI
Deaths
Census
to
NHI
Ratio
Not
Applicable Northland Region Mäori 1,446 1,479 0.98 1,374 1.05
Pacific People 39 39 1.00 30 1.30
NonMäoriNonPac 4,503 4,593 0.98 4,548 0.99
Asian 18 15 1.20 12 1.50
NonMäoriNonPacNonAs 4,485 4,578 0.98 4,533 0.99
Auckland Region Mäori 2,793 2,799 1.00 2,613 1.07
Pacific People 3,105 3,267 0.95 3,066 1.01
NonMäoriNonPac 28,311 28,674 0.99 27,324 1.04
Asian 1,812 1,707 1.06 1,635 1.11
NonMäoriNonPacNonAs 26,499 26,964 0.98 25,689 1.03
Waikato Region Mäori 2,073 1,965 1.05 1,938 1.07
Pacific People 177 192 0.92 177 1.00
NonMäoriNonPac 11,181 11,442 0.98 10,842 1.03
Asian 138 120 1.15 123 1.12
NonMäoriNonPacNonAs 11,043 11,325 0.98 10,719 1.03
Bay of Plenty Region Mäori 1,929 1,926 1.00 1,896 1.02
Pacific People 120 114 1.05 117 1.03
NonMäoriNonPac 8,691 8,838 0.98 8,595 1.01
Asian 78 72 1.08 63 1.24
NonMäoriNonPacNonAs 8,613 8,769 0.98 8,532 1.01
Gisborne Region Mäori 663 711 0.93 672 0.99
NonMäoriNonPac 1,140 1,128 1.01 1,137 1.00
NonMäoriNonPacNonAs 1,134 1,119 1.01 1,128 1.01
Hawke's Bay Region Mäori 948 885 1.07 891 1.06
Pacific People 72 75 0.96 60 1.20

98
Regional
Health
Authority
Regional
Council Prioritised Ethnicity
Census
Deaths
Mortality
Deaths
Census
to
Mortality
Ratio
NHI
Deaths
Census
to
NHI
Ratio
NonMäoriNonPac 5,016 5,103 0.98 4,830 1.04
Asian 54 48 1.13 42 1.29
NonMäoriNonPacNonAs 4,959 5,052 0.98 4,788 1.04
Taranaki Region Mäori 390 390 1.00 354 1.10
Pacific People 12 18 0.67 9 1.33
NonMäoriNonPac 3,813 3,906 0.98 3,690 1.03
Asian 12 15 0.80 12 1.00
NonMäoriNonPacNonAs 3,801 3,891 0.98 3,675 1.03
Manawatu-
Wanganui Region Mäori 1,029 1,050 0.98 912 1.13
Pacific People 51 48 1.06 39 1.31
NonMäoriNonPac 7,788 7,848 0.99 7,137 1.09
Asian 69 75 0.92 66 1.05
NonMäoriNonPacNonAs 7,719 7,770 0.99 7,071 1.09
Wellington Region Mäori 996 1,023 0.97 900 1.11
Pacific People 540 537 1.01 516 1.05
NonMäoriNonPac 11,859 12,036 0.99 11,397 1.04
Asian 387 378 1.02 357 1.08
NonMäoriNonPacNonAs 11,469 11,661 0.98 11,040 1.04
West Coast Region Mäori 63 69 0.91 57 1.11
NonMäoriNonPac 1,233 1,254 0.98 1,230 1.00
NonMäoriNonPacNonAs 1,230 1,251 0.98 1,227 1.00
Canterbury Region Mäori 696 615 1.13 555 1.25
Pacific People 150 144 1.04 132 1.14
NonMäoriNonPac 19,737 20,043 0.98 19,062 1.04
Asian 213 198 1.08 171 1.25

99
Regional
Health
Authority
Regional
Council Prioritised Ethnicity
Census
Deaths
Mortality
Deaths
Census
to
Mortality
Ratio
NHI
Deaths
Census
to
NHI
Ratio
NonMäoriNonPacNonAs 19,521 19,848 0.98 18,891 1.03
Otago Region Mäori 180 168 1.07 144 1.25
Pacific People 36 39 0.92 30 1.20
NonMäoriNonPac 7,458 7,590 0.98 7,449 1.00
Asian 54 57 0.95 51 1.06
NonMäoriNonPacNonAs 7,404 7,533 0.98 7,398 1.00
Southland Region Mäori 261 249 1.05 204 1.28
Pacific People 21 24 0.88 24 0.88
NonMäoriNonPac 3,486 3,567 0.98 3,528 0.99
NonMäoriNonPacNonAs 3,477 3,558 0.98 3,525 0.99
Tasman Region Mäori 45 51 0.88 39 1.15
NonMäoriNonPac 1,491 1,497 1.00 1,479 1.01
NonMäoriNonPacNonAs 1,488 1,497 0.99 1,476 1.01
Nelson Region Mäori 60 36 1.67 30 2.00
Pacific People 12 9 1.33 9 1.33
NonMäoriNonPac 1,725 1,803 0.96 1,767 0.98
NonMäoriNonPacNonAs 1,716 1,794 0.96 1,758 0.98
Marlborough Region Mäori 105 96 1.09 90 1.17
NonMäoriNonPac 1,674 1,707 0.98 1,674 1.00
NonMäoriNonPacNonAs 1,671 1,701 0.98 1,671 1.00
Northern Mäori 4,308 4,362 0.99 4,065 1.06
Pacific People 3,144 3,309 0.95 3,096 1.02
NonMäoriNonPac 33,120 33,567 0.99 32,160 1.03
Asian 1,833 1,725 1.06 1,650 1.11
NonMäoriNonPacNonAs 31,287 31,842 0.98 30,510 1.03

100
Regional
Health
Authority
Regional
Council Prioritised Ethnicity
Census
Deaths
Mortality
Deaths
Census
to
Mortality
Ratio
NHI
Deaths
Census
to
NHI
Ratio
Midland Mäori 5,103 5,028 1.01 4,899 1.04
Pacific People 318 327 0.97 306 1.04
NonMäoriNonPac 24,771 25,266 0.98 24,207 1.02
Asian 237 213 1.11 207 1.14
NonMäoriNonPacNonAs 24,534 25,053 0.98 24,000 1.02
Central Mäori 3,075 3,033 1.01 2,757 1.12
Pacific People 678 678 1.00 627 1.08
NonMäoriNonPac 29,307 29,751 0.99 28,056 1.04
Asian 525 516 1.02 474 1.11
NonMäoriNonPacNonAs 28,782 29,235 0.98 27,582 1.04
Southern Mäori 1,200 1,104 1.09 963 1.25
Pacific People 210 210 1.00 189 1.11
NonMäoriNonPac 31,914 32,454 0.98 31,275 1.02
Asian 282 270 1.04 234 1.21
NonMäoriNonPacNonAs 31,635 32,187 0.98 31,041 1.02
Table 45: Census Prioritised Ethnicity by Cancer Registration and NHI Prioritised Ethnicity
stratified by RHA or Regional Council, 2006-2011
Regional
Health
Authority
Regional
Council Prioritised Ethnicity
Census
Ethnicity
First
Cancer
Register
Eth
Census
to
Cancer
Ratio
NHI
Eth
Census
to
NHI
Ratio
Not
Applicable Northland Region Mäori 900 936 0.96 870 1.03
Pacific People 39 33 1.18 30 1.30
NonMäoriNonPac 3,741 3,702 1.01 3,756 1.00
Asian 15 18 0.83 15 1.00

101
Regional
Health
Authority
Regional
Council Prioritised Ethnicity
Census
Ethnicity
First
Cancer
Register
Eth
Census
to
Cancer
Ratio
NHI
Eth
Census
to
NHI
Ratio
NonMäoriNonPacNonAs 3,726 3,687 1.01 3,741 1.00
8,421 8,376 4.99 8,412 5.33 Auckland Region Mäori 2,364 2,295 1.03 2,160 1.09
Pacific People 2,208 2,286 0.97 2,211 1.00
NonMäoriNonPac 26,298 24,852 1.06 25,353 1.04
Asian 2,415 2,226 1.08 2,262 1.07
NonMäoriNonPacNonAs 23,886 22,629 1.06 23,088 1.03
57,171 54,288 5.20 55,074 5.23 Waikato Region Mäori 1,386 1,377 1.01 1,275 1.09
Pacific People 126 126 1.00 132 0.95
NonMäoriNonPac 9,360 8,961 1.04 8,805 1.06
Asian 150 129 1.16 132 1.14
NonMäoriNonPacNonAs 9,207 8,832 1.04 8,673 1.06
20,229 19,425 5.25 19,017 5.30 Bay of Plenty Region Mäori 1,413 1,410 1.00 1,329 1.06
Pacific People 60 66 0.91 63 0.95
NonMäoriNonPac 7,662 7,512 1.02 7,623 1.01
Asian 87 63 1.38 75 1.16
NonMäoriNonPacNonAs 7,575 7,449 1.02 7,548 1.00
16,797 16,500 5.33 16,638 5.18 Gisborne Region Mäori 432 444 0.97 423 1.02
NonMäoriNonPac 948 936 1.01 957 0.99
NonMäoriNonPacNonAs 939 930 1.01 951 0.99
2,319 2,310 2.99 2,331 3.00 Hawke's Bay Region Mäori 660 681 0.97 633 1.04
Pacific People 48 51 0.94 48 1.00
NonMäoriNonPac 4,050 3,840 1.05 3,909 1.04
Asian 45 33 1.36 33 1.36
NonMäoriNonPacNonAs 4,008 3,804 1.05 3,876 1.03
8,811 8,409 5.37 8,499 5.47 Taranaki Region Mäori 264 285 0.93 264 1.00

102
Regional
Health
Authority
Regional
Council Prioritised Ethnicity
Census
Ethnicity
First
Cancer
Register
Eth
Census
to
Cancer
Ratio
NHI
Eth
Census
to
NHI
Ratio
NonMäoriNonPac 3,009 2,922 1.03 2,958 1.02
Asian 24 21 1.14 21 1.14
NonMäoriNonPacNonAs 2,988 2,901 1.03 2,937 1.02
6,285 6,129 4.13 6,180 4.18
Manawatu-Wanganui
Region Mäori 810 789 1.03 732 1.11
Pacific People 51 39 1.31 42 1.21
NonMäoriNonPac 6,306 6,117 1.03 5,778 1.09
Asian 72 69 1.04 60 1.20
NonMäoriNonPacNonAs 6,237 6,048 1.03 5,721 1.09
13,476 13,062 5.44 12,333 5.70 Wellington Region Mäori 897 948 0.95 873 1.03
Pacific People 435 456 0.95 444 0.98
NonMäoriNonPac 9,366 8,994 1.04 9,027 1.04
Asian 429 396 1.08 396 1.08
NonMäoriNonPacNonAs 8,937 8,598 1.04 8,631 1.04
20,064 19,392 5.06 19,371 5.17 West Coast Region Mäori 60 66 0.91 60 1.00
NonMäoriNonPac 936 921 1.02 924 1.01
NonMäoriNonPacNonAs 933 921 1.01 921 1.01
1,929 1,908 2.94 1,905 3.02 Canterbury Region Mäori 729 675 1.08 630 1.16
Pacific People 135 144 0.94 129 1.05
NonMäoriNonPac 16,305 15,963 1.02 15,894 1.03
Asian 285 267 1.07 246 1.16
NonMäoriNonPacNonAs 16,020 15,696 1.02 15,651 1.02
33,474 32,745 5.13 32,550 5.42 Otago Region Mäori 177 165 1.07 150 1.18
Pacific People 39 39 1.00 39 1.00
NonMäoriNonPac 5,526 5,463 1.01 5,451 1.01
Asian 60 51 1.18 51 1.18

103
Regional
Health
Authority
Regional
Council Prioritised Ethnicity
Census
Ethnicity
First
Cancer
Register
Eth
Census
to
Cancer
Ratio
NHI
Eth
Census
to
NHI
Ratio
NonMäoriNonPacNonAs 5,463 5,415 1.01 5,403 1.01
11,265 11,133 5.27 11,094 5.38 Southland Region Mäori 195 189 1.03 159 1.23
Pacific People 21 18 1.17 18 1.17
NonMäoriNonPac 2,271 2,244 1.01 2,271 1.00
NonMäoriNonPacNonAs 2,268 2,238 1.01 2,268 1.00
4,755 4,689 4.22 4,716 4.40 Tasman Region Mäori 57 45 1.27 54 1.06
NonMäoriNonPac 1,338 1,320 1.01 1,317 1.02
NonMäoriNonPacNonAs 1,335 1,314 1.02 1,314 1.02
2,730 2,679 3.30 2,685 3.10 Nelson Region Mäori 48 42 1.14 42 1.14
NonMäoriNonPac 1,350 1,317 1.03 1,335 1.01
Asian 12 9 1.33 12 1.00
NonMäoriNonPacNonAs 1,338 1,311 1.02 1,326 1.01
2,748 2,679 4.52 2,715 4.16 Marlborough Region Mäori 93 75 1.24 69 1.35
NonMäoriNonPac 1,446 1,446 1.00 1,455 0.99
NonMäoriNonPacNonAs 1,443 1,443 1.00 1,452 0.99
2,982 2,964 3.24 2,976 3.33 213,456 206,688 72.38 206,496 73.37 Northern Mäori 3,318 3,285 1.01 3,081 1.08
Pacific People 2,250 2,316 0.97 2,244 1.00
NonMäoriNonPac 30,396 28,899 1.05 29,457 1.03
Asian 2,436 2,247 1.08 2,283 1.07
NonMäoriNonPacNonAs 27,963 26,652 1.05 27,174 1.03
66,363 63,399 5.16 64,239 5.21 66,363 63,399 5.16 64,239 5.21 Midland Mäori 3,519 3,543 0.99 3,321 1.06
Pacific People 201 207 0.97 207 0.97
NonMäoriNonPac 20,820 20,184 1.03 20,184 1.03
Asian 264 213 1.24 231 1.14
NonMäoriNonPacNonAs 20,559 19,971 1.03 19,953 1.03
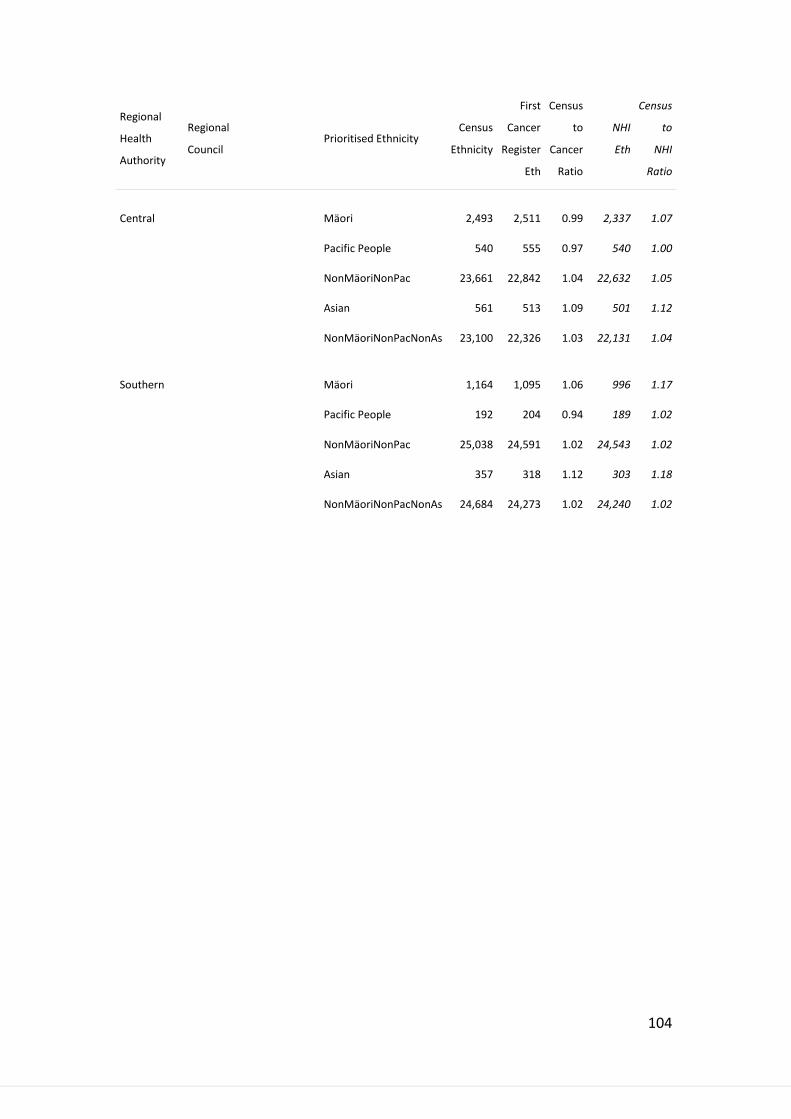
104
Regional
Health
Authority
Regional
Council Prioritised Ethnicity
Census
Ethnicity
First
Cancer
Register
Eth
Census
to
Cancer
Ratio
NHI
Eth
Census
to
NHI
Ratio
45,363 44,118 5.26 43,896 5.23 45,363 44,118 5.26 43,896 5.23 Central Mäori 2,493 2,511 0.99 2,337 1.07
Pacific People 540 555 0.97 540 1.00
NonMäoriNonPac 23,661 22,842 1.04 22,632 1.05
Asian 561 513 1.09 501 1.12
NonMäoriNonPacNonAs 23,100 22,326 1.03 22,131 1.04
50,355 48,747 5.12 48,141 5.28 50,355 48,747 5.12 48,141 5.28 Southern Mäori 1,164 1,095 1.06 996 1.17
Pacific People 192 204 0.94 189 1.02
NonMäoriNonPac 25,038 24,591 1.02 24,543 1.02
Asian 357 318 1.12 303 1.18
NonMäoriNonPacNonAs 24,684 24,273 1.02 24,240 1.02

105
Unlock Ratios Stratified by District Health Board (DHB)
Table 46: Census Total Ethnicity by Mortality and NHI Total Ethnicity stratified by DHB,
2006-2011
DHB Total Ethnicity Census
Deaths
Mortality
Deaths
Census to
Mortality
Ratio
NHI
Deaths
Census to
NHI Ratio
Northland Total NZ Mäori 1,446 1,479 0.98 1,374 1.05
Total Pacific 51 48 1.06 36 1.42
Total Asian 24 21 1.14 18 1.33
nonMPA (European/Other) 4,485 4,578 0.98 4,533 0.99
Waitemata Total NZ Mäori 684 678 1.01 627 1.09
Total Pacific 483 525 0.92 474 1.02
Total Asian 456 447 1.02 420 1.09
nonMPA (European/Other) 11,115 11,253 0.99 10,572 1.05
Auckland Total NZ Mäori 708 681 1.04 651 1.09
Total Pacific 1,137 1,185 0.96 1,107 1.03
Total Asian 771 762 1.01 711 1.08
nonMPA (European/Other) 8,592 8,841 0.97 8,559 1.00
Counties Manukau Total NZ Mäori 1,470 1,521 0.97 1,410 1.04
Total Pacific 1,569 1,617 0.97 1,524 1.03
Total Asian 648 609 1.06 576 1.13
nonMPA (European/Other) 7,095 7,173 0.99 6,846 1.04
Waikato Total NZ Mäori 1,827 1,686 1.08 1,695 1.08
Total Pacific 189 195 0.97 180 1.05
Total Asian 150 129 1.16 123 1.22
nonMPA (European/Other) 10,002 10,302 0.97 9,729 1.03
Lakes Total NZ Mäori 909 951 0.96 900 1.01
Total Pacific 99 96 1.03 90 1.10
Total Asian 21 24 0.88 21 1.00
nonMPA (European/Other) 2,601 2,613 1.00 2,541 1.02
Bay of Plenty Total NZ Mäori 1,314 1,290 1.02 1,281 1.03
Total Pacific 48 39 1.23 39 1.23
Total Asian 63 51 1.24 48 1.31
nonMPA (European/Other) 6,990 7,125 0.98 6,924 1.01
Tairawhiti Total NZ Mäori 663 711 0.93 672 0.99

106
DHB Total Ethnicity Census
Deaths
Mortality
Deaths
Census to
Mortality
Ratio
NHI
Deaths
Census to
NHI Ratio
nonMPA (European/Other) 1,134 1,119 1.01 1,128 1.01
Taranaki Total NZ Mäori 390 393 0.99 354 1.10
Total Pacific 18 18 1.00 9 2.00
Total Asian 12 15 0.80 12 1.00
nonMPA (European/Other) 3,807 3,894 0.98 3,681 1.03
Hawke's Bay Total NZ Mäori 963 897 1.07 906 1.06
Total Pacific 78 81 0.96 66 1.18
Total Asian 60 51 1.18 42 1.43
nonMPA (European/Other) 4,965 5,061 0.98 4,794 1.04
Whanganui Total NZ Mäori 420 441 0.95 384 1.09
Total Pacific 21 18 1.17 18 1.17
Total Asian 18 12 1.50 12 1.50
nonMPA (European/Other) 2,403 2,412 1.00 2,415 1.00
Midcentral Total NZ Mäori 534 528 1.01 447 1.19
Total Pacific 39 30 1.30 27 1.44
Total Asian 63 63 1.00 54 1.17
nonMPA (European/Other) 5,349 5,403 0.99 4,680 1.14
Hutt Total NZ Mäori 375 396 0.95 354 1.06
Total Pacific 165 162 1.02 153 1.08
Total Asian 117 108 1.08 108 1.08
nonMPA (European/Other) 3,681 3,774 0.98 3,633 1.01
Capital and Coast Total NZ Mäori 438 441 0.99 381 1.15
Total Pacific 369 369 1.00 360 1.03
Total Asian 267 264 1.01 243 1.10
nonMPA (European/Other) 6,063 6,138 0.99 5,763 1.05
Wairarapa Total NZ Mäori 141 141 1.00 129 1.09
Total Pacific 15 15 1.00 15 1.00
Total Asian 12 12 1.00 12 1.00
nonMPA (European/Other) 1,443 1,455 0.99 1,386 1.04
Nelson Marlborough Total NZ Mäori 210 186 1.13 162 1.30
Total Pacific 21 18 1.17 12 1.75
Total Asian 15 15 1.00 15 1.00
nonMPA (European/Other) 4,875 4,995 0.98 4,908 0.99
West Coast Total NZ Mäori 63 69 0.91 57 1.11
nonMPA (European/Other) 1,230 1,251 0.98 1,227 1.00
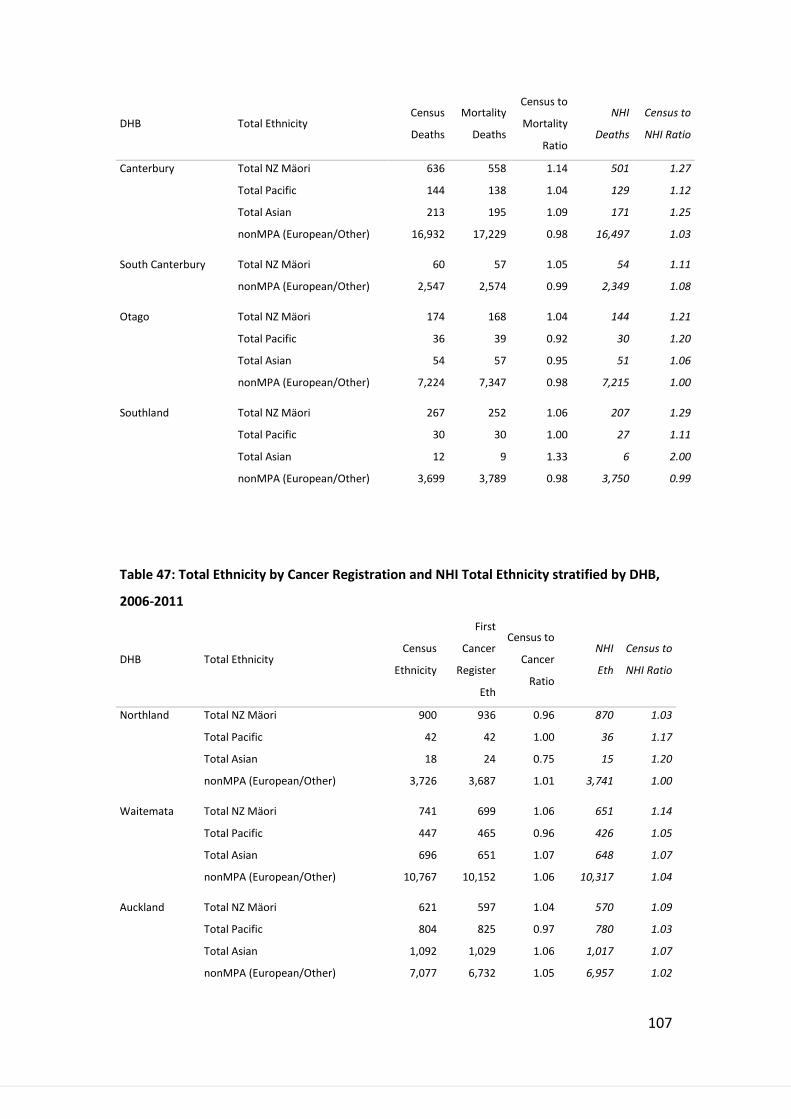
107
DHB Total Ethnicity Census
Deaths
Mortality
Deaths
Census to
Mortality
Ratio
NHI
Deaths
Census to
NHI Ratio
Canterbury Total NZ Mäori 636 558 1.14 501 1.27
Total Pacific 144 138 1.04 129 1.12
Total Asian 213 195 1.09 171 1.25
nonMPA (European/Other) 16,932 17,229 0.98 16,497 1.03
South Canterbury Total NZ Mäori 60 57 1.05 54 1.11
nonMPA (European/Other) 2,547 2,574 0.99 2,349 1.08
Otago Total NZ Mäori 174 168 1.04 144 1.21
Total Pacific 36 39 0.92 30 1.20
Total Asian 54 57 0.95 51 1.06
nonMPA (European/Other) 7,224 7,347 0.98 7,215 1.00
Southland Total NZ Mäori 267 252 1.06 207 1.29
Total Pacific 30 30 1.00 27 1.11
Total Asian 12 9 1.33 6 2.00
nonMPA (European/Other) 3,699 3,789 0.98 3,750 0.99
Table 47: Total Ethnicity by Cancer Registration and NHI Total Ethnicity stratified by DHB,
2006-2011
DHB Total Ethnicity Census
Ethnicity
First
Cancer
Register
Eth
Census to
Cancer
Ratio
NHI
Eth
Census to
NHI Ratio
Northland Total NZ Mäori 900 936 0.96 870 1.03
Total Pacific 42 42 1.00 36 1.17
Total Asian 18 24 0.75 15 1.20
nonMPA (European/Other) 3,726 3,687 1.01 3,741 1.00
Waitemata Total NZ Mäori 741 699 1.06 651 1.14
Total Pacific 447 465 0.96 426 1.05
Total Asian 696 651 1.07 648 1.07
nonMPA (European/Other) 10,767 10,152 1.06 10,317 1.04
Auckland Total NZ Mäori 621 597 1.04 570 1.09
Total Pacific 804 825 0.97 780 1.03
Total Asian 1,092 1,029 1.06 1,017 1.07
nonMPA (European/Other) 7,077 6,732 1.05 6,957 1.02

108
DHB Total Ethnicity Census
Ethnicity
First
Cancer
Register
Eth
Census to
Cancer
Ratio
NHI
Eth
Census to
NHI Ratio
Counties
Manukau Total NZ Mäori 1,062 1,053 1.01 993 1.07
Total Pacific 1,050 1,098 0.96 1,062 0.99
Total Asian 717 675 1.06 681 1.05
nonMPA (European/Other) 6,390 6,084 1.05 6,165 1.04
Waikato Total NZ Mäori 1,233 1,218 1.01 1,128 1.09
Total Pacific 141 141 1.00 135 1.04
Total Asian 150 129 1.16 132 1.14
nonMPA (European/Other) 8,160 7,827 1.04 7,656 1.07
Lakes Total NZ Mäori 600 624 0.96 594 1.01
Total Pacific 60 51 1.18 57 1.05
Total Asian 30 24 1.25 21 1.43
nonMPA (European/Other) 2,250 2,178 1.03 2,187 1.03
Bay of Plenty Total NZ Mäori 987 969 1.02 912 1.08
Total Pacific 33 42 0.79 36 0.92
Total Asian 69 51 1.35 54 1.28
nonMPA (European/Other) 6,216 6,126 1.01 6,219 1.00
Tairawhiti Total NZ Mäori 432 444 0.97 423 1.02
nonMPA (European/Other) 939 930 1.01 951 0.99
Taranaki Total NZ Mäori 264 285 0.93 264 1.00
Total Pacific 9 9 1.00 6 1.50
Total Asian 24 21 1.14 21 1.14
nonMPA (European/Other) 2,994 2,907 1.03 2,943 1.02
Hawke's Bay Total NZ Mäori 666 690 0.97 639 1.04
Total Pacific 60 63 0.95 51 1.18
Total Asian 48 36 1.33 36 1.33
nonMPA (European/Other) 4,011 3,810 1.05 3,879 1.03
Whanganui Total NZ Mäori 306 312 0.98 297 1.03
Total Pacific 15 9 1.67 15 1.00
Total Asian 15 12 1.25 12 1.25
nonMPA (European/Other) 1,875 1,818 1.03 1,857 1.01
Midcentral Total NZ Mäori 483 447 1.08 405 1.19
Total Pacific 42 39 1.08 33 1.27
Total Asian 66 57 1.16 48 1.38

109
DHB Total Ethnicity Census
Ethnicity
First
Cancer
Register
Eth
Census to
Cancer
Ratio
NHI
Eth
Census to
NHI Ratio
nonMPA (European/Other) 4,422 4,287 1.03 3,921 1.13
Hutt Total NZ Mäori 333 357 0.93 333 1.00
Total Pacific 111 117 0.95 114 0.97
Total Asian 138 132 1.05 126 1.10
nonMPA (European/Other) 2,724 2,646 1.03 2,658 1.02
Capital and
Coast Total NZ Mäori 396 423 0.94 390 1.02
Total Pacific 327 348 0.94 333 0.98
Total Asian 294 276 1.07 270 1.09
nonMPA (European/Other) 4,848 4,635 1.05 4,659 1.04
Wairarapa Total NZ Mäori 108 117 0.92 108 1.00
Total Pacific 9 12 0.75 12 0.75
Total Asian 9 12 0.75 9 1.00
nonMPA (European/Other) 1,104 1,065 1.04 1,065 1.04
Nelson
Marlborough Total NZ Mäori 201 165 1.22 168 1.20
Total Pacific 15 9 1.67 6 2.50
Total Asian 18 18 1.00 15 1.20
nonMPA (European/Other) 4,113 4,065 1.01 4,089 1.01
West Coast Total NZ Mäori 60 66 0.91 60 1.00
nonMPA (European/Other) 933 921 1.01 921 1.01
Canterbury Total NZ Mäori 666 621 1.07 576 1.16
Total Pacific 141 153 0.92 132 1.07
Total Asian 285 261 1.09 234 1.22
nonMPA (European/Other) 13,962 13,644 1.02 13,668 1.02
South
Canterbury Total NZ Mäori 60 54 1.11 48 1.25
Total Asian 18 12 1.50 12 1.50
nonMPA (European/Other) 2,010 2,007 1.00 1,935 1.04
Otago Total NZ Mäori 174 165 1.05 147 1.18
Total Pacific 39 45 0.87 39 1.00
Total Asian 60 48 1.25 48 1.25
nonMPA (European/Other) 5,238 5,190 1.01 5,172 1.01
Southland Total NZ Mäori 201 195 1.03 165 1.22
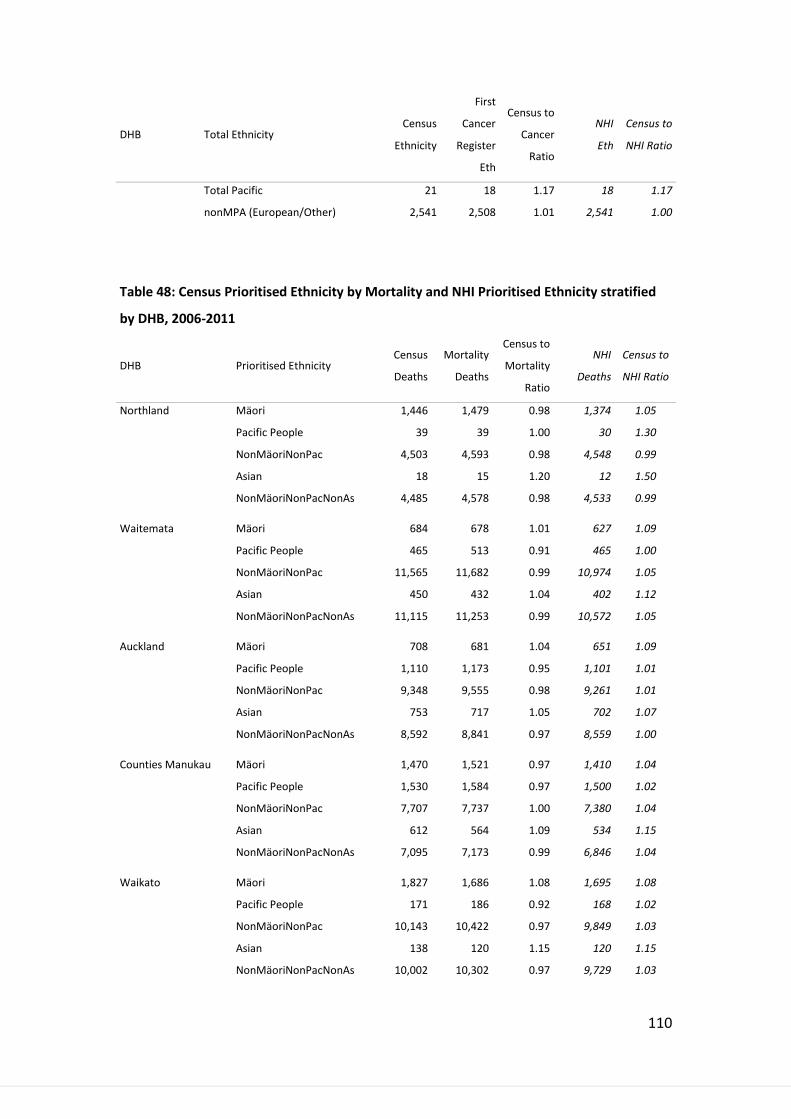
110
DHB Total Ethnicity Census
Ethnicity
First
Cancer
Register
Eth
Census to
Cancer
Ratio
NHI
Eth
Census to
NHI Ratio
Total Pacific 21 18 1.17 18 1.17
nonMPA (European/Other) 2,541 2,508 1.01 2,541 1.00
Table 48: Census Prioritised Ethnicity by Mortality and NHI Prioritised Ethnicity stratified
by DHB, 2006-2011
DHB Prioritised Ethnicity Census
Deaths
Mortality
Deaths
Census to
Mortality
Ratio
NHI
Deaths
Census to
NHI Ratio
Northland Mäori 1,446 1,479 0.98 1,374 1.05
Pacific People 39 39 1.00 30 1.30
NonMäoriNonPac 4,503 4,593 0.98 4,548 0.99
Asian 18 15 1.20 12 1.50
NonMäoriNonPacNonAs 4,485 4,578 0.98 4,533 0.99
Waitemata Mäori 684 678 1.01 627 1.09
Pacific People 465 513 0.91 465 1.00
NonMäoriNonPac 11,565 11,682 0.99 10,974 1.05
Asian 450 432 1.04 402 1.12
NonMäoriNonPacNonAs 11,115 11,253 0.99 10,572 1.05
Auckland Mäori 708 681 1.04 651 1.09
Pacific People 1,110 1,173 0.95 1,101 1.01
NonMäoriNonPac 9,348 9,555 0.98 9,261 1.01
Asian 753 717 1.05 702 1.07
NonMäoriNonPacNonAs 8,592 8,841 0.97 8,559 1.00
Counties Manukau Mäori 1,470 1,521 0.97 1,410 1.04
Pacific People 1,530 1,584 0.97 1,500 1.02
NonMäoriNonPac 7,707 7,737 1.00 7,380 1.04
Asian 612 564 1.09 534 1.15
NonMäoriNonPacNonAs 7,095 7,173 0.99 6,846 1.04
Waikato Mäori 1,827 1,686 1.08 1,695 1.08
Pacific People 171 186 0.92 168 1.02
NonMäoriNonPac 10,143 10,422 0.97 9,849 1.03
Asian 138 120 1.15 120 1.15
NonMäoriNonPacNonAs 10,002 10,302 0.97 9,729 1.03
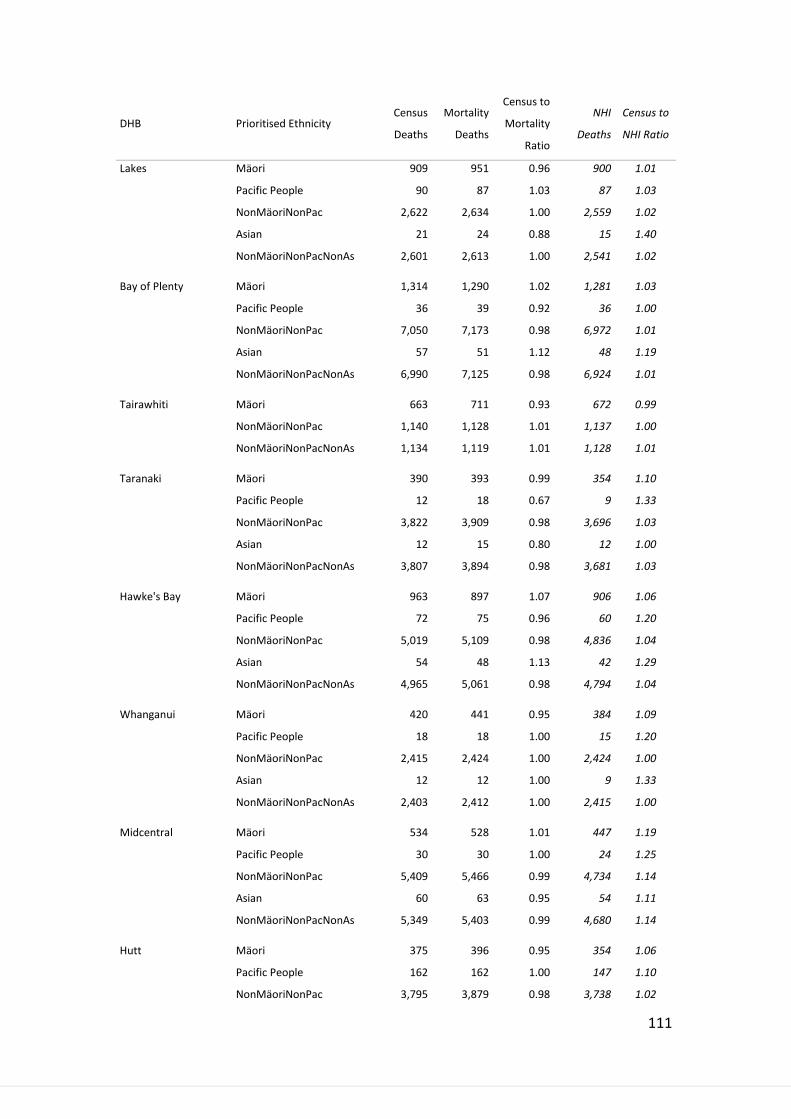
111
DHB Prioritised Ethnicity Census
Deaths
Mortality
Deaths
Census to
Mortality
Ratio
NHI
Deaths
Census to
NHI Ratio
Lakes Mäori 909 951 0.96 900 1.01
Pacific People 90 87 1.03 87 1.03
NonMäoriNonPac 2,622 2,634 1.00 2,559 1.02
Asian 21 24 0.88 15 1.40
NonMäoriNonPacNonAs 2,601 2,613 1.00 2,541 1.02
Bay of Plenty Mäori 1,314 1,290 1.02 1,281 1.03
Pacific People 36 39 0.92 36 1.00
NonMäoriNonPac 7,050 7,173 0.98 6,972 1.01
Asian 57 51 1.12 48 1.19
NonMäoriNonPacNonAs 6,990 7,125 0.98 6,924 1.01
Tairawhiti Mäori 663 711 0.93 672 0.99
NonMäoriNonPac 1,140 1,128 1.01 1,137 1.00
NonMäoriNonPacNonAs 1,134 1,119 1.01 1,128 1.01
Taranaki Mäori 390 393 0.99 354 1.10
Pacific People 12 18 0.67 9 1.33
NonMäoriNonPac 3,822 3,909 0.98 3,696 1.03
Asian 12 15 0.80 12 1.00
NonMäoriNonPacNonAs 3,807 3,894 0.98 3,681 1.03
Hawke's Bay Mäori 963 897 1.07 906 1.06
Pacific People 72 75 0.96 60 1.20
NonMäoriNonPac 5,019 5,109 0.98 4,836 1.04
Asian 54 48 1.13 42 1.29
NonMäoriNonPacNonAs 4,965 5,061 0.98 4,794 1.04
Whanganui Mäori 420 441 0.95 384 1.09
Pacific People 18 18 1.00 15 1.20
NonMäoriNonPac 2,415 2,424 1.00 2,424 1.00
Asian 12 12 1.00 9 1.33
NonMäoriNonPacNonAs 2,403 2,412 1.00 2,415 1.00
Midcentral Mäori 534 528 1.01 447 1.19
Pacific People 30 30 1.00 24 1.25
NonMäoriNonPac 5,409 5,466 0.99 4,734 1.14
Asian 60 63 0.95 54 1.11
NonMäoriNonPacNonAs 5,349 5,403 0.99 4,680 1.14
Hutt Mäori 375 396 0.95 354 1.06
Pacific People 162 162 1.00 147 1.10
NonMäoriNonPac 3,795 3,879 0.98 3,738 1.02

112
DHB Prioritised Ethnicity Census
Deaths
Mortality
Deaths
Census to
Mortality
Ratio
NHI
Deaths
Census to
NHI Ratio
Asian 117 108 1.08 105 1.11
NonMäoriNonPacNonAs 3,681 3,774 0.98 3,633 1.01
Capital and Coast Mäori 438 441 0.99 381 1.15
Pacific People 360 360 1.00 357 1.01
NonMäoriNonPac 6,324 6,396 0.99 6,003 1.05
Asian 261 261 1.00 240 1.09
NonMäoriNonPacNonAs 6,063 6,138 0.99 5,763 1.05
Wairarapa Mäori 141 141 1.00 129 1.09
Pacific People 15 12 1.25 12 1.25
NonMäoriNonPac 1,452 1,464 0.99 1,395 1.04
NonMäoriNonPacNonAs 1,443 1,455 0.99 1,386 1.04
Nelson Marlborough Mäori 210 186 1.13 162 1.30
Pacific People 21 18 1.17 12 1.75
NonMäoriNonPac 4,893 5,010 0.98 4,923 0.99
Asian 15 15 1.00 15 1.00
NonMäoriNonPacNonAs 4,875 4,995 0.98 4,908 0.99
West Coast Mäori 63 69 0.91 57 1.11
NonMäoriNonPac 1,233 1,254 0.98 1,230 1.00
NonMäoriNonPacNonAs 1,230 1,251 0.98 1,227 1.00
Canterbury Mäori 636 558 1.14 501 1.27
Pacific People 141 138 1.02 126 1.12
NonMäoriNonPac 17,145 17,421 0.98 16,665 1.03
Asian 207 195 1.06 168 1.23
NonMäoriNonPacNonAs 16,932 17,229 0.98 16,497 1.03
South Canterbury Mäori 60 57 1.05 54 1.11
NonMäoriNonPac 2,550 2,580 0.99 2,352 1.08
NonMäoriNonPacNonAs 2,547 2,574 0.99 2,349 1.08
Otago Mäori 174 168 1.04 144 1.21
Pacific People 30 36 0.83 30 1.00
NonMäoriNonPac 7,278 7,404 0.98 7,263 1.00
Asian 54 57 0.95 51 1.06
NonMäoriNonPacNonAs 7,224 7,347 0.98 7,215 1.00
Southland Mäori 267 252 1.06 207 1.29
Pacific People 24 27 0.89 24 1.00
NonMäoriNonPac 3,708 3,798 0.98 3,759 0.99

113
DHB Prioritised Ethnicity Census
Deaths
Mortality
Deaths
Census to
Mortality
Ratio
NHI
Deaths
Census to
NHI Ratio
NonMäoriNonPacNonAs 3,699 3,789 0.98 3,750 0.99
Table 49: Census Prioritised Ethnicity by Cancer Registration and NHI Prioritised Ethnicity
stratified by DHB, 2006-2011
DHB Prioritised Ethnicity Census
Ethnicity
First
Cancer
Register
Eth
Census to
Cancer
Ratio
NHI
Eth
Census to
NHI Ratio
Northland Mäori 900 936 0.96 870 1.03
Pacific People 39 33 1.18 30 1.30
NonMäoriNonPac 3,741 3,702 1.01 3,756 1.00
Asian 15 18 0.83 15 1.00
NonMäoriNonPacNonAs 3,726 3,687 1.01 3,741 1.00
Waitemata Mäori 741 699 1.06 651 1.14
Pacific People 426 432 0.99 411 1.04
NonMäoriNonPac 11,448 10,782 1.06 10,956 1.04
Asian 678 630 1.08 639 1.06
NonMäoriNonPacNonAs 10,767 10,152 1.06 10,317 1.04
Auckland Mäori 621 597 1.04 570 1.09
Pacific People 774 801 0.97 765 1.01
NonMäoriNonPac 8,139 7,716 1.05 7,950 1.02
Asian 1,059 987 1.07 996 1.06
NonMäoriNonPacNonAs 7,077 6,732 1.05 6,957 1.02
Counties Manukau Mäori 1,062 1,053 1.01 993 1.07
Pacific People 1,014 1,050 0.97 1,041 0.97
NonMäoriNonPac 7,068 6,693 1.06 6,795 1.04
Asian 681 612 1.11 633 1.08
NonMäoriNonPacNonAs 6,390 6,084 1.05 6,165 1.04
Waikato Mäori 1,233 1,218 1.01 1,128 1.09
Pacific People 123 123 1.00 129 0.95
NonMäoriNonPac 8,301 7,950 1.04 7,782 1.07
Asian 141 123 1.15 126 1.12
NonMäoriNonPacNonAs 8,160 7,827 1.04 7,656 1.07
Lakes Mäori 600 624 0.96 594 1.01

114
DHB Prioritised Ethnicity Census
Ethnicity
First
Cancer
Register
Eth
Census to
Cancer
Ratio
NHI
Eth
Census to
NHI Ratio
Pacific People 42 39 1.08 45 0.93
NonMäoriNonPac 2,274 2,196 1.04 2,205 1.03
Asian 27 21 1.29 21 1.29
NonMäoriNonPacNonAs 2,250 2,178 1.03 2,187 1.03
Bay of Plenty Mäori 987 969 1.02 912 1.08
Pacific People 21 33 0.64 24 0.88
NonMäoriNonPac 6,282 6,168 1.02 6,273 1.00
Asian 66 45 1.47 54 1.22
NonMäoriNonPacNonAs 6,216 6,126 1.01 6,219 1.00
Tairawhiti Mäori 432 444 0.97 423 1.02
NonMäoriNonPac 948 936 1.01 957 0.99
NonMäoriNonPacNonAs 939 930 1.01 951 0.99
Taranaki Mäori 264 285 0.93 264 1.00
NonMäoriNonPac 3,018 2,928 1.03 2,964 1.02
Asian 24 21 1.14 21 1.14
NonMäoriNonPacNonAs 2,994 2,907 1.03 2,943 1.02
Hawke's Bay Mäori 666 690 0.97 639 1.04
Pacific People 48 51 0.94 48 1.00
NonMäoriNonPac 4,056 3,843 1.06 3,915 1.04
Asian 45 33 1.36 33 1.36
NonMäoriNonPacNonAs 4,011 3,810 1.05 3,879 1.03
Whanganui Mäori 306 312 0.98 297 1.03
Pacific People 12 6 2.00 9 1.33
NonMäoriNonPac 1,890 1,830 1.03 1,869 1.01
Asian 12 12 1.00 12 1.00
NonMäoriNonPacNonAs 1,875 1,818 1.03 1,857 1.01
Midcentral Mäori 483 447 1.08 405 1.19
Pacific People 39 33 1.18 30 1.30
NonMäoriNonPac 4,485 4,344 1.03 3,969 1.13
Asian 63 57 1.11 48 1.31
NonMäoriNonPacNonAs 4,422 4,287 1.03 3,921 1.13
Hutt Mäori 333 357 0.93 333 1.00
Pacific People 102 108 0.94 108 0.94
NonMäoriNonPac 2,853 2,766 1.03 2,778 1.03
Asian 129 120 1.08 120 1.08
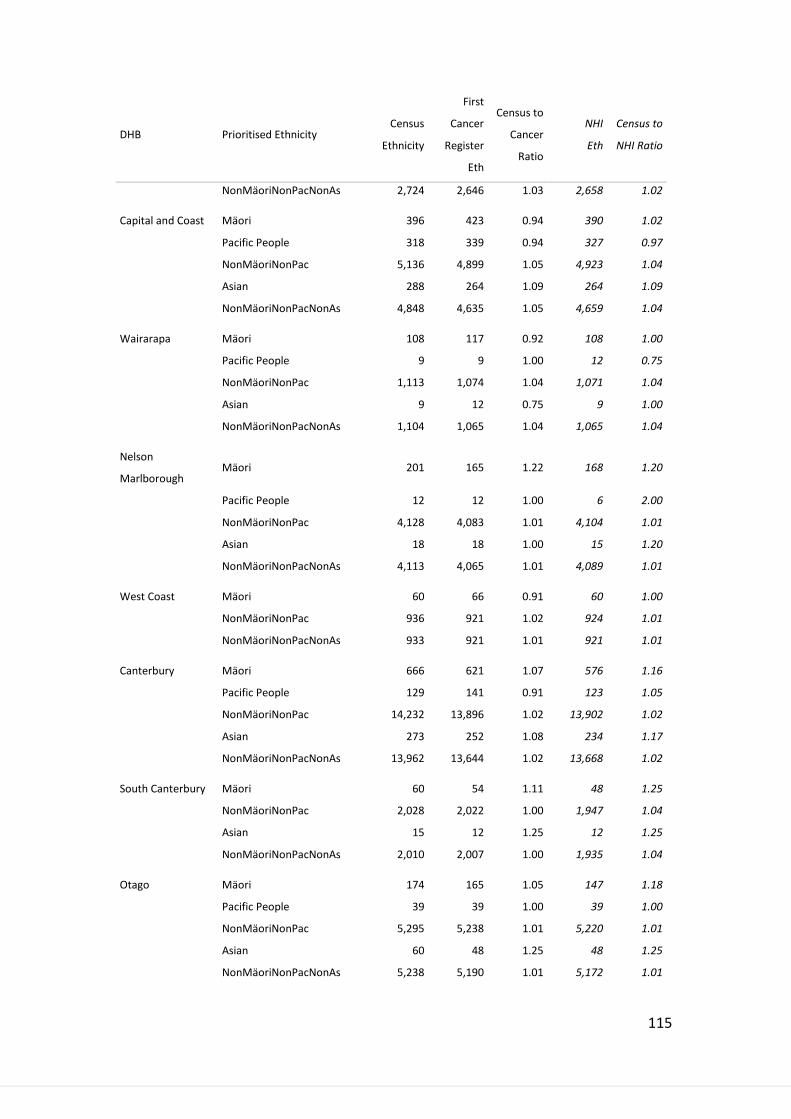
115
DHB Prioritised Ethnicity Census
Ethnicity
First
Cancer
Register
Eth
Census to
Cancer
Ratio
NHI
Eth
Census to
NHI Ratio
NonMäoriNonPacNonAs 2,724 2,646 1.03 2,658 1.02
Capital and Coast Mäori 396 423 0.94 390 1.02
Pacific People 318 339 0.94 327 0.97
NonMäoriNonPac 5,136 4,899 1.05 4,923 1.04
Asian 288 264 1.09 264 1.09
NonMäoriNonPacNonAs 4,848 4,635 1.05 4,659 1.04
Wairarapa Mäori 108 117 0.92 108 1.00
Pacific People 9 9 1.00 12 0.75
NonMäoriNonPac 1,113 1,074 1.04 1,071 1.04
Asian 9 12 0.75 9 1.00
NonMäoriNonPacNonAs 1,104 1,065 1.04 1,065 1.04
Nelson
Marlborough Mäori 201 165 1.22 168 1.20
Pacific People 12 12 1.00 6 2.00
NonMäoriNonPac 4,128 4,083 1.01 4,104 1.01
Asian 18 18 1.00 15 1.20
NonMäoriNonPacNonAs 4,113 4,065 1.01 4,089 1.01
West Coast Mäori 60 66 0.91 60 1.00
NonMäoriNonPac 936 921 1.02 924 1.01
NonMäoriNonPacNonAs 933 921 1.01 921 1.01
Canterbury Mäori 666 621 1.07 576 1.16
Pacific People 129 141 0.91 123 1.05
NonMäoriNonPac 14,232 13,896 1.02 13,902 1.02
Asian 273 252 1.08 234 1.17
NonMäoriNonPacNonAs 13,962 13,644 1.02 13,668 1.02
South Canterbury Mäori 60 54 1.11 48 1.25
NonMäoriNonPac 2,028 2,022 1.00 1,947 1.04
Asian 15 12 1.25 12 1.25
NonMäoriNonPacNonAs 2,010 2,007 1.00 1,935 1.04
Otago Mäori 174 165 1.05 147 1.18
Pacific People 39 39 1.00 39 1.00
NonMäoriNonPac 5,295 5,238 1.01 5,220 1.01
Asian 60 48 1.25 48 1.25
NonMäoriNonPacNonAs 5,238 5,190 1.01 5,172 1.01

116
DHB Prioritised Ethnicity Census
Ethnicity
First
Cancer
Register
Eth
Census to
Cancer
Ratio
NHI
Eth
Census to
NHI Ratio
Southland Mäori 201 195 1.03 165 1.22
Pacific People 21 18 1.17 18 1.17
NonMäoriNonPac 2,550 2,514 1.01 2,550 1.00
NonMäoriNonPacNonAs 2,541 2,508 1.01 2,541 1.00

117
Unlock Ratios Stratified by Rurality
Table 50: Census Total Ethnicity by Mortality and NHI Total Ethnicity stratified by Rurality,
2006-2011.
Rurality
Grp1
Rurality
Grp2 Ethnicity
Census
Deaths
Mortality
Deaths
Census
to
Mortality
Ratio
NHI
Deaths
Census
to
NHI
Ratio
Main Urban Total NZ Mäori 7,851 7,785 1.01 7,254 1.08
Total Pacific 4,431 4,581 0.97 4,260 1.04
Total Asian 2,946 2,853 1.03 2,649 1.11
nonMPA (European/Other) 80,835 82,218 0.98 78,882 1.02
Secondary Urban
Area Total NZ Mäori 999 1,026 0.97 951 1.05
Total Pacific 27 21 1.29 12 2.25
nonMPA (European/Other) 10,941 11,070 0.99 10,449 1.05
Minor Urban Area Total NZ Mäori 2,379 2,310 1.03 2,184 1.09
Total Pacific 39 12 3.25 15 2.60
Total Asian 24 6 4.00 3 8.00
nonMPA (European/Other) 13,983 14,313 0.98 13,620 1.03
Rural Total NZ Mäori 2,457 2,406 1.02 2,298 1.07
Total Pacific 36 21 1.71 18 2.00
Total Asian 12 3 4.00 . .
nonMPA (European/Other) 10,473 10,722 0.98 10,182 1.03
All Urban Total NZ Mäori 11,229 11,127 1.01 10,389 1.08
Total Pacific 4,518 4,611 0.98 4,287 1.05
Total Asian 2,988 2,850 1.05 2,652 1.13
nonMPA (European/Other) 105,726 107,601 0.98 102,942 1.03
Rural Total NZ Mäori 2,457 2,400 1.02 2,289 1.07

118
Rurality
Grp1
Rurality
Grp2 Ethnicity
Census
Deaths
Mortality
Deaths
Census
to
Mortality
Ratio
NHI
Deaths
Census
to
NHI
Ratio
Total Pacific 12 21 0.57 15 0.80
Total Asian 6 15 0.40 6 1.00
nonMPA (European/Other) 10,506 10,719 0.98 10,191 1.03
Table 51: Census Total Ethnicity by Cancer Registration and NHI Total Ethnicity stratified by
Rurality, 2006-2011
Rurality
Grp1
Rurality
Grp2 Ethnicity
Census
Ethnicity
First
Cancer
Register
Eth
Census
to
Cancer
Ratio
NHI
Eth
Census
to
NHI
Ratio
Main Urban Total NZ Mäori 6,426 6,396 1.00 5,946 1.08
Total Pacific 3,282 3,450 0.95 3,258 1.01
Total Asian 3,732 3,471 1.08 3,414 1.09
nonMPA
(European/Other) 65,361 62,916 1.04 63,387 1.03
Secondary Urban Area Total NZ Mäori 684 684 1.00 639 1.07
Total Pacific 21 18 1.17 9 2.33
nonMPA
(European/Other) 7,905 7,779 1.02 7,641 1.03
Minor Urban Area Total NZ Mäori 1,614 1,620 1.00 1,509 1.07
Total Pacific 45 21 2.14 18 2.50
Total Asian 18 6 3.00 3 6.00
nonMPA
(European/Other) 10,245 10,074 1.02 10,023 1.02
Rural Total NZ Mäori 1,773 1,734 1.02 1,635 1.08
Total Pacific 36 21 1.71 21 1.71
Total Asian 15 3 5.00 . .
nonMPA
(European/Other) 12,792 12,453 1.03 12,453 1.03
All
Urban Total NZ Mäori 8,724 8,700 1.00 8,097 1.08
Total Pacific 3,354 3,489 0.96 3,285 1.02
Total Asian 3,750 3,477 1.08 3,417 1.10

119
Rurality
Grp1
Rurality
Grp2 Ethnicity
Census
Ethnicity
First
Cancer
Register
Eth
Census
to
Cancer
Ratio
NHI
Eth
Census
to
NHI
Ratio
nonMPA
(European/Other) 83,511 80,769 1.03 81,048 1.03
Rural Total NZ Mäori 1,773 1,734 1.02 1,635 1.08
Total Pacific 36 21 1.71 21 1.71
Total Asian 15 3 5.00 . .
nonMPA
(European/Other) 12,792 12,453 1.03 12,453 1.03
Table 52: Census Prioritised Ethnicity by Mortality and NHI Prioritised Ethnicity stratified
by Rurality, 2006-2011
Rurality
Grp1
Rurality
Grp2 Prioritised Ethnicity
Census
Deaths
Mortality
Deaths
Census
to
Mortality
Ratio
NHI
Deaths
Census
to
NHI
Ratio
Main Urban Mäori 7,851 7,785 1.01 7,254 1.08
Pacific People 4,284 4,494 0.95 4,194 1.02
NonMäoriNonPac 83,697 84,939 0.99 81,447 1.03
Asian 2,859 2,721 1.05 2,565 1.11
NonMäoriNonPacNonAs 80,835 82,218 0.98 78,882 1.02
179,526 182,157 4.98 174,342 5.26 Secondary Urban Area Mäori 999 1,026 0.97 951 1.05
Pacific People 15 12 1.25 3 5.00
NonMäoriNonPac 10,947 11,070 0.99 10,449 1.05
NonMäoriNonPacNonAs 10,941 11,070 0.99 10,449 1.05
22,902 23,178 4.20 21,852 8.15 Minor Urban Area Mäori 2,379 2,310 1.03 2,184 1.09
Pacific People 24 9 2.67 6 4.00
NonMäoriNonPac 13,995 14,316 0.98 13,623 1.03
Asian 12 3 4.00 3 4.00
NonMäoriNonPacNonAs 13,983 14,313 0.98 13,620 1.03
30,393 30,951 9.66 29,436 11.15

120
Rurality
Grp1
Rurality
Grp2 Prioritised Ethnicity
Census
Deaths
Mortality
Deaths
Census
to
Mortality
Ratio
NHI
Deaths
Census
to
NHI
Ratio
Rural Mäori 2,457 2,406 1.02 2,298 1.07
Pacific People 24 9 2.67 12 2.00
NonMäoriNonPac 10,476 10,722 0.98 10,182 1.03
NonMäoriNonPacNonAs 10,473 10,722 0.98 10,182 1.03
23,430 23,859 5.65 22,674 5.13 256,251 260,145 24.49 248,304 29.69 All Urban Mäori 11,229 11,127 1.01 10,389 1.08
Pacific People 4,347 4,515 0.96 4,206 1.03
NonMäoriNonPac 108,609 110,310 0.98 105,504 1.03
Asian 2,880 2,709 1.06 2,559 1.13
NonMäoriNonPacNonAs 105,726 107,601 0.98 102,942 1.03
232,791 236,262 4.99 225,600 5.30 232,791 236,262 4.99 225,600 5.30 Rural Mäori 2,457 2,400 1.02 2,289 1.07
NonMäoriNonPac 10,506 10,731 0.98 10,194 1.03
Asian . 12 . 6 .
NonMäoriNonPacNonAs 10,506 10,719 0.98 10,191 1.03
Table 53: Census Prioritised Ethnicity by Cancer Registration and NHI Prioritised Ethnicity
stratified by Rurality, 2006-2011
Rurality
Grp1
Rurality
Grp2 Prioritised Ethnicity
Census
Ethnicity
First
Cancer
Register
Eth
Census
to
Cancer
Ratio
NHI
Eth
Census
to
NHI
Ratio
Main Urban Mäori 6,426 6,396 1.00 5,946 1.08
Pacific People 3,120 3,282 0.95 3,165 0.99
NonMäoriNonPac 68,961 66,207 1.04 66,699 1.03
Asian 3,597 3,291 1.09 3,315 1.09
NonMäoriNonPacNonAs 65,361 62,916 1.04 63,387 1.03
Secondary Urban Area Mäori 684 684 1.00 639 1.07
Pacific People 12 . . 3 4.00
NonMäoriNonPac 7,908 7,779 1.02 7,641 1.03

121
Rurality
Grp1
Rurality
Grp2 Prioritised Ethnicity
Census
Ethnicity
First
Cancer
Register
Eth
Census
to
Cancer
Ratio
NHI
Eth
Census
to
NHI
Ratio
NonMäoriNonPacNonAs 7,905 7,779 1.02 7,641 1.03
Minor Urban Area Mäori 1,614 1,620 1.00 1,509 1.07
Pacific People 24 . . 3 8.00
NonMäoriNonPac 10,251 10,074 1.02 10,023 1.02
NonMäoriNonPacNonAs 10,245 10,074 1.02 10,023 1.02
Rural Mäori 1,773 1,734 1.02 1,635 1.08
Pacific People 24 3 8.00 9 2.67
NonMäoriNonPac 12,801 12,453 1.03 12,453 1.03
NonMäoriNonPacNonAs 12,792 12,453 1.03 12,453 1.03
All Mäori 8,724 8,700 1.00 8,097 1.08
Urban Pacific People 3,156 3,282 0.96 3,174 0.99
NonMäoriNonPac 87,117 84,063 1.04 84,363 1.03
Asian 3,603 3,294 1.09 3,315 1.09
NonMäoriNonPacNonAs 83,511 80,769 1.03 81,048 1.03
Rural Mäori 1,773 1,734 1.02 1,635 1.08
Pacific People 24 3 8.00 9 2.67
NonMäoriNonPac 12,801 12,453 1.03 12,453 1.03
NonMäoriNonPacNonAs 12,792 12,453 1.03 12,453 1.03

122
Unlock Ratios Stratified by Cause of Death
Table 54: Census Total Ethnicity by Mortality and NHI Total Ethnicity stratified by Cause of
Death Groupings, 2006-2011
Cause of Death Total Ethnicity Census
Deaths
Mortality
Deaths
Census
to
Mortality
Ratio
NHI
Deaths
Census
to
NHI
Ratio
Cancer Total NZ Mäori 4,254 4,137 1.03 4,011 1.06
Total Pacific 1,302 1,332 0.98 1,254 1.04
Total Asian 999 960 1.04 906 1.10
nonMPA (European/Other) 34,974 35,550 0.98 34,059 1.03
Respiratory Total NZ Mäori 1,086 1,080 1.01 1,014 1.07
Total Pacific 261 276 0.95 261 1.00
Total Asian 132 123 1.07 114 1.16
nonMPA (European/Other) 8,220 8,370 0.98 8,091 1.02
Congenital, Perinatal, SIDS Total NZ Mäori 102 99 1.03 93 1.10
Total Pacific 36 33 1.09 36 1.00
Total Asian 30 30 1.00 30 1.00
nonMPA (European/Other) 462 474 0.97 462 1.00
Other Causes Total NZ Mäori 2,436 2,406 1.01 2,289 1.06
Total Pacific 1,071 1,122 0.95 1,047 1.02
Total Asian 621 597 1.04 549 1.13
nonMPA (European/Other) 22,503 22,977 0.98 22,086 1.02
Unintentional Injury, Total NZ Mäori 1,521 1,482 1.03 1,353 1.12
Suicide, Violent Total Pacific 357 324 1.10 279 1.28
Total Asian 255 231 1.10 210 1.21
nonMPA (European/Other) 6,417 6,576 0.98 6,102 1.05
CVD & IHD Total NZ Mäori 4,290 4,323 0.99 3,921 1.09
Total Pacific 1,503 1,545 0.97 1,425 1.05
Total Asian 954 930 1.03 852 1.12
nonMPA (European/Other) 43,659 44,373 0.98 42,333 1.03

123
Table 55: Census Total Ethnicity by Cancer Registration and NHI Total Ethnicity stratified by
First Cancer Registration, 2006-2011
Ethnicity Cancer Grouping Ethnicity Census
Ethnicity
First
Cancer
Register
Eth
Census
to
Cancer
Ratio
NHI
Eth
Census
to
NHI
Ratio
Total
Ethnicity C00X Lip, oral cavity and pharynx Total NZ Mäori 120 111 1.08 102 1.18
Total Pacific 81 87 0.93 75 1.08
Total Asian 78 81 0.96 81 0.96
nonMPA
(European/Other) 1,326 1,293 1.03 1,290 1.03
1,605 1,572 4.00 1,548 4.25 C15- Oesophagus Total NZ Mäori 78 84 0.93 72 1.08
Total Pacific 18 21 0.86 18 1.00
Total Asian 24 18 1.33 21 1.14
nonMPA
(European/Other) 1,155 1,161 0.99 1,119 1.03
1,275 1,284 4.11 1,230 4.25 C16- Stomach Total NZ Mäori 312 327 0.95 300 1.04
Total Pacific 120 129 0.93 123 0.98
Total Asian 96 93 1.03 87 1.10
nonMPA
(European/Other) 1,107 1,089 1.02 1,077 1.03
1,635 1,638 3.93 1,587 4.15 C180 Caecum Total NZ Mäori 51 63 0.81 57 0.89
Total Pacific 15 18 0.83 18 0.83
Total Asian 24 24 1.00 24 1.00
nonMPA
(European/Other) 1,605 1,581 1.02 1,560 1.03
1,695 1,686 3.66 1,659 3.75 C182 Ascending colon Total NZ Mäori 54 51 1.06 48 1.13
Total Pacific 15 15 1.00 9 1.67
Total Asian 36 33 1.09 33 1.09
nonMPA
(European/Other) 1,656 1,629 1.02 1,635 1.01
1,761 1,728 4.17 1,725 4.90 C183 Hepatic flexure Total NZ Mäori 24 21 1.14 18 1.33
nonMPA
(European/Other) 435 426 1.02 426 1.02
459 447 2.16 444 2.35 C184 Transverse colon Total NZ Mäori 45 39 1.15 36 1.25
Total Asian 24 18 1.33 18 1.33
nonMPA
(European/Other) 804 807 1.00 789 1.02

124
Ethnicity Cancer Grouping Ethnicity Census
Ethnicity
First
Cancer
Register
Eth
Census
to
Cancer
Ratio
NHI
Eth
Census
to
NHI
Ratio
873 864 3.48 843 3.60 C185 Splenic flexure Total NZ Mäori 12 18 0.67 12 1.00
nonMPA
(European/Other) 258 255 1.01 255 1.01
270 273 1.68 267 2.01 C186 Descending colon Total NZ Mäori 18 24 0.75 21 0.86
Total Asian 15 12 1.25 9 1.67
nonMPA
(European/Other) 438 429 1.02 429 1.02
471 465 3.02 459 3.55 C187 Sigmoid Total NZ Mäori 153 147 1.04 132 1.16
Total Pacific 45 42 1.07 39 1.15
Total Asian 90 90 1.00 87 1.03
nonMPA
(European/Other) 2,304 2,286 1.01 2,277 1.01
2,592 2,565 4.12 2,535 4.35
C188&C181 Overlapping and
appendix Total NZ Mäori 15 15 1.00 15 1.00
nonMPA
(European/Other) 192 186 1.03 183 1.05
207 201 2.03 198 2.05 C189 Unspecified Colon Total NZ Mäori 30 36 0.83 27 1.11
Total Pacific 9 12 0.75 12 0.75
nonMPA
(European/Other) 459 459 1.00 444 1.03
498 507 2.58 483 2.89 C19- Rectosigmoid junction Total NZ Mäori 45 48 0.94 39 1.15
Total Pacific 12 15 0.80 12 1.00
Total Asian 24 21 1.14 24 1.00
nonMPA
(European/Other) 786 780 1.01 780 1.01
867 864 3.89 855 4.16 C20- Rectum Total NZ Mäori 201 204 0.99 180 1.12
Total Pacific 81 90 0.90 81 1.00
Total Asian 105 102 1.03 102 1.03
nonMPA
(European/Other) 2,745 2,703 1.02 2,676 1.03
3,132 3,099 3.94 3,039 4.18 C21- Anus and anal canal Total NZ Mäori 24 30 0.80 27 0.89
nonMPA
(European/Other) 198 189 1.05 192 1.03
222 219 1.85 219 1.92
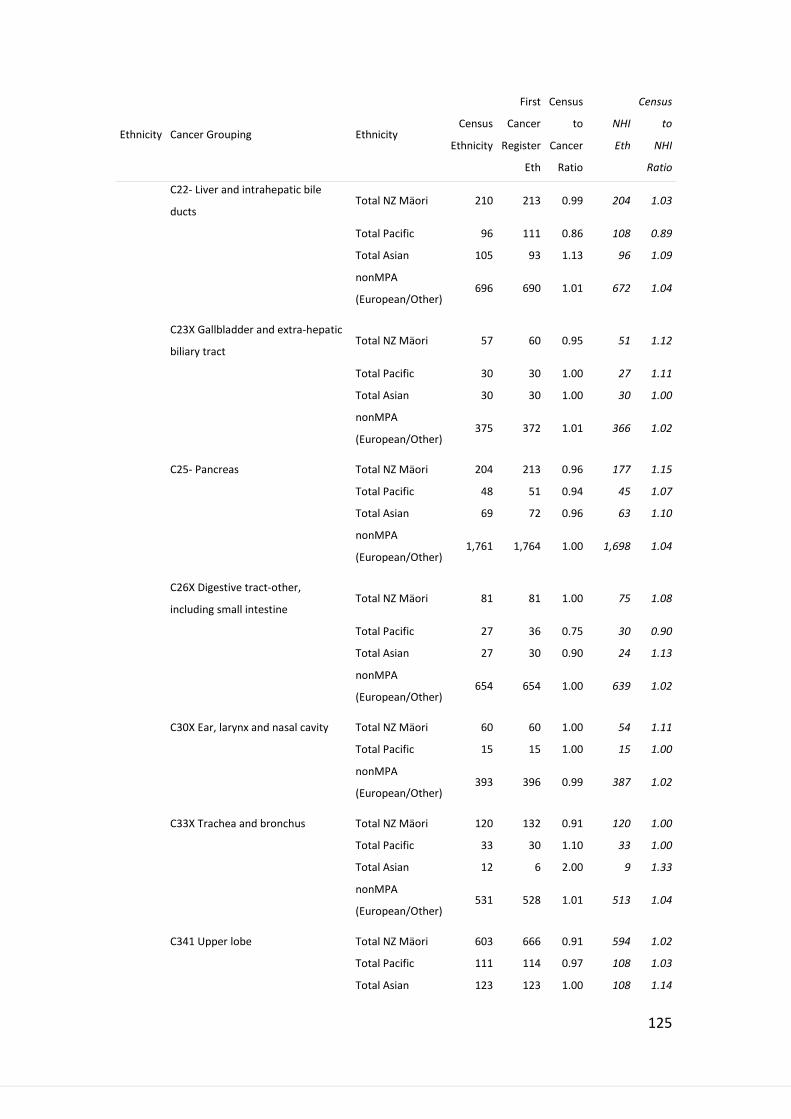
125
Ethnicity Cancer Grouping Ethnicity Census
Ethnicity
First
Cancer
Register
Eth
Census
to
Cancer
Ratio
NHI
Eth
Census
to
NHI
Ratio
C22- Liver and intrahepatic bile
ducts Total NZ Mäori 210 213 0.99 204 1.03
Total Pacific 96 111 0.86 108 0.89
Total Asian 105 93 1.13 96 1.09
nonMPA
(European/Other) 696 690 1.01 672 1.04
1,107 1,107 3.99 1,080 4.05
C23X Gallbladder and extra-hepatic
biliary tract Total NZ Mäori 57 60 0.95 51 1.12
Total Pacific 30 30 1.00 27 1.11
Total Asian 30 30 1.00 30 1.00
nonMPA
(European/Other) 375 372 1.01 366 1.02
492 492 3.96 474 4.25 C25- Pancreas Total NZ Mäori 204 213 0.96 177 1.15
Total Pacific 48 51 0.94 45 1.07
Total Asian 69 72 0.96 63 1.10
nonMPA
(European/Other) 1,761 1,764 1.00 1,698 1.04
2,082 2,100 3.86 1,983 4.36
C26X Digestive tract-other,
including small intestine Total NZ Mäori 81 81 1.00 75 1.08
Total Pacific 27 36 0.75 30 0.90
Total Asian 27 30 0.90 24 1.13
nonMPA
(European/Other) 654 654 1.00 639 1.02
789 801 3.65 768 4.13 C30X Ear, larynx and nasal cavity Total NZ Mäori 60 60 1.00 54 1.11
Total Pacific 15 15 1.00 15 1.00
nonMPA
(European/Other) 393 396 0.99 387 1.02
468 471 2.99 456 3.13 C33X Trachea and bronchus Total NZ Mäori 120 132 0.91 120 1.00
Total Pacific 33 30 1.10 33 1.00
Total Asian 12 6 2.00 9 1.33
nonMPA
(European/Other) 531 528 1.01 513 1.04
696 696 5.02 675 4.37 C341 Upper lobe Total NZ Mäori 603 666 0.91 594 1.02
Total Pacific 111 114 0.97 108 1.03
Total Asian 123 123 1.00 108 1.14

126
Ethnicity Cancer Grouping Ethnicity Census
Ethnicity
First
Cancer
Register
Eth
Census
to
Cancer
Ratio
NHI
Eth
Census
to
NHI
Ratio
nonMPA
(European/Other) 2,277 2,247 1.01 2,253 1.01
3,114 3,150 3.89 3,063 4.20 C342 Middle lobe Total NZ Mäori 60 69 0.87 60 1.00
Total Pacific 12 9 1.33 9 1.33
Total Asian 12 12 1.00 15 0.80
nonMPA
(European/Other) 255 249 1.02 249 1.02
339 339 4.22 333 4.15 C343 Lower lobe Total NZ Mäori 189 213 0.89 177 1.07
Total Pacific 60 69 0.87 63 0.95
Total Asian 60 63 0.95 54 1.11
nonMPA
(European/Other) 1,188 1,170 1.02 1,161 1.02
1,497 1,515 3.73 1,455 4.15
C348 Unspecified and overlapping
lung Total NZ Mäori 426 468 0.91 420 1.01
Total Pacific 78 93 0.84 78 1.00
Total Asian 81 84 0.96 75 1.08
nonMPA
(European/Other) 2,202 2,181 1.01 2,127 1.04
2,787 2,826 3.72 2,700 4.13 C40X Bone and articular cartilage Total NZ Mäori 24 30 0.80 30 0.80
Total Pacific 15 15 1.00 9 1.67
nonMPA
(European/Other) 120 120 1.00 114 1.05
159 165 2.80 153 3.52 C43- Melanoma Total NZ Mäori 189 129 1.47 120 1.58
Total Pacific 27 30 0.90 24 1.13
Total Asian 30 9 3.33 6 5.00
nonMPA
(European/Other) 10,419 9,759 1.07 9,897 1.05
10,665 9,927 6.77 10,047 8.76 C44- Other skin Total NZ Mäori 39 33 1.18 33 1.18
nonMPA
(European/Other) 519 513 1.01 522 0.99
558 546 2.19 555 2.17 C45- Mesothelioma Total NZ Mäori 18 15 1.20 12 1.50
nonMPA
(European/Other) 390 393 0.99 384 1.02
408 408 2.19 396 2.52

127
Ethnicity Cancer Grouping Ethnicity Census
Ethnicity
First
Cancer
Register
Eth
Census
to
Cancer
Ratio
NHI
Eth
Census
to
NHI
Ratio
C46X Mesothelial and soft tissue
(except mesothelioma) Total NZ Mäori 105 105 1.00 96 1.09
Total Pacific 42 45 0.93 45 0.93
Total Asian 27 24 1.13 24 1.13
nonMPA
(European/Other) 537 516 1.04 516 1.04
711 690 4.10 681 4.19 C50- Breast Total NZ Mäori 1,584 1,587 1.00 1,509 1.05
Total Pacific 558 585 0.95 543 1.03
Total Asian 627 603 1.04 588 1.07
nonMPA
(European/Other) 10,002 9,816 1.02 9,798 1.02
12,771 12,591 4.01 12,438 4.17 C51X Other female genital organs Total NZ Mäori 45 51 0.88 48 0.94
Total Pacific 12 12 1.00 9 1.33
Total Asian 12 12 1.00 12 1.00
nonMPA
(European/Other) 366 360 1.02 363 1.01
435 435 3.90 432 4.28 C53- Cervix Total NZ Mäori 150 147 1.02 141 1.06
Total Pacific 48 51 0.94 54 0.89
Total Asian 54 48 1.13 48 1.13
nonMPA
(European/Other) 417 417 1.00 405 1.03
669 663 4.09 648 4.11 C54- Uterus Total NZ Mäori 261 267 0.98 261 1.00
Total Pacific 225 237 0.95 231 0.97
Total Asian 87 84 1.04 81 1.07
nonMPA
(European/Other) 1,362 1,332 1.02 1,326 1.03
1,935 1,920 3.99 1,899 4.07 C56- Ovary Total NZ Mäori 144 147 0.98 141 1.02
Total Pacific 51 57 0.89 57 0.89
Total Asian 45 39 1.15 33 1.36
nonMPA
(European/Other) 1,014 1,008 1.01 1,005 1.01
1,254 1,251 4.03 1,236 4.28 C61- Prostate Total NZ Mäori 846 756 1.12 720 1.18
Total Pacific 330 336 0.98 327 1.01
Total Asian 318 270 1.18 282 1.13

128
Ethnicity Cancer Grouping Ethnicity Census
Ethnicity
First
Cancer
Register
Eth
Census
to
Cancer
Ratio
NHI
Eth
Census
to
NHI
Ratio
nonMPA
(European/Other) 12,009 11,184 1.07 11,421 1.05
13,503 12,546 4.35 12,750 4.37 C62- Testes Total NZ Mäori 186 195 0.95 189 0.98
Total Pacific 30 21 1.43 24 1.25
Total Asian 21 15 1.40 15 1.40
nonMPA
(European/Other) 501 456 1.10 480 1.04
738 687 4.88 708 4.67 C64- Kidney, except renal pelvis Total NZ Mäori 204 207 0.99 189 1.08
Total Pacific 69 72 0.96 66 1.05
Total Asian 60 60 1.00 54 1.11
nonMPA
(European/Other) 1,728 1,698 1.02 1,677 1.03
2,061 2,037 3.97 1,986 4.27
C65X Renal pelvis, ureter,
other/unspec. urinary organs Total NZ Mäori 15 12 1.25 15 1.00
nonMPA
(European/Other) 252 249 1.01 243 1.04
267 261 2.26 258 2.04 C67- Bladder Total NZ Mäori 90 87 1.03 81 1.11
Total Pacific 36 39 0.92 36 1.00
Total Asian 15 24 0.63 24 0.63
nonMPA
(European/Other) 1,392 1,380 1.01 1,371 1.02
1,533 1,530 3.59 1,512 3.76 C69X Eye, meninges and rest of CNS Total NZ Mäori 18 15 1.20 15 1.20
nonMPA
(European/Other) 276 279 0.99 279 0.99
294 294 2.19 294 2.19 C71- Brain Total NZ Mäori 90 108 0.83 90 1.00
Total Pacific 51 51 1.00 48 1.06
Total Asian 42 36 1.17 33 1.27
nonMPA
(European/Other) 1,119 1,101 1.02 1,095 1.02
1,302 1,296 4.02 1,266 4.35 C73- Thyroid Total NZ Mäori 198 183 1.08 189 1.05
Total Pacific 75 90 0.83 84 0.89
Total Asian 144 132 1.09 135 1.07
nonMPA
(European/Other) 693 678 1.02 678 1.02
1,110 1,083 4.02 1,086 4.03

129
Ethnicity Cancer Grouping Ethnicity Census
Ethnicity
First
Cancer
Register
Eth
Census
to
Cancer
Ratio
NHI
Eth
Census
to
NHI
Ratio
C76X Ill defined, secondary or
unspecified sites Total NZ Mäori 156 174 0.90 159 0.98
Total Pacific 69 81 0.85 75 0.92
Total Asian 24 24 1.00 18 1.33
nonMPA
(European/Other) 1,680 1,677 1.00 1,617 1.04
1,929 1,956 3.75 1,869 4.27 C81- Hodgkin's Disease Total NZ Mäori 30 33 0.91 33 0.91
Total Pacific 24 27 0.89 27 0.89
Total Asian 24 21 1.14 18 1.33
nonMPA
(European/Other) 381 381 1.00 378 1.01
459 462 3.94 456 4.14
C82- Follicular Non-Hodgkin's
Disease Total NZ Mäori 39 39 1.00 39 1.00
Total Pacific 9 9 1.00 12 0.75
Total Asian 21 21 1.00 24 0.88
nonMPA
(European/Other) 711 687 1.03 693 1.03
780 756 4.03 768 3.66 C83- Diffuse NHL Total NZ Mäori 153 153 1.00 147 1.04
Total Pacific 54 54 1.00 54 1.00
Total Asian 75 75 1.00 72 1.04
nonMPA
(European/Other) 1,548 1,512 1.02 1,503 1.03
1,830 1,794 4.02 1,776 4.11
C84- Peripheral and T cell
lymphoma Total NZ Mäori 18 21 0.86 15 1.20
Total Pacific 12 15 0.80 12 1.00
Total Asian 9 9 1.00 9 1.00
nonMPA
(European/Other) 219 210 1.04 213 1.03
258 255 3.70 249 4.23 C85- Other NHL Total NZ Mäori 36 42 0.86 33 1.09
Total Pacific 15 15 1.00 15 1.00
Total Asian 27 24 1.13 24 1.13
nonMPA
(European/Other) 534 519 1.03 522 1.02
612 600 4.02 594 4.24 C900 Multiple myeloma Total NZ Mäori 111 108 1.03 96 1.16
Total Pacific 66 72 0.92 66 1.00
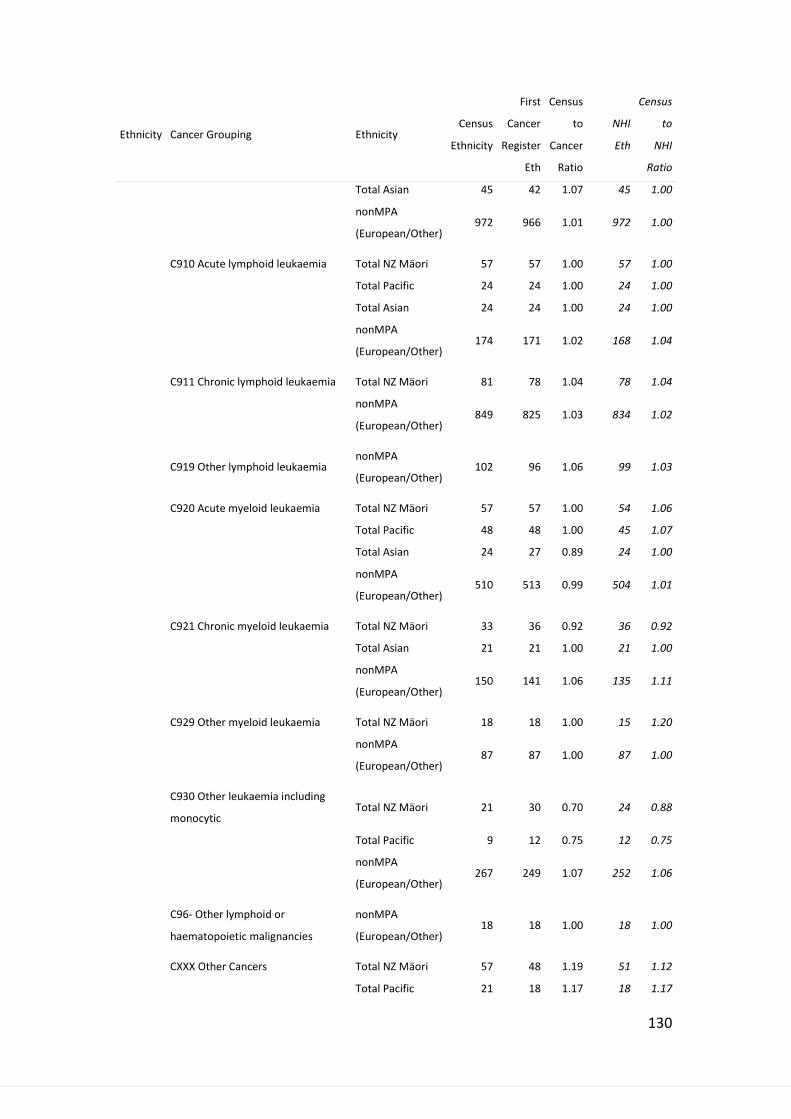
130
Ethnicity Cancer Grouping Ethnicity Census
Ethnicity
First
Cancer
Register
Eth
Census
to
Cancer
Ratio
NHI
Eth
Census
to
NHI
Ratio
Total Asian 45 42 1.07 45 1.00
nonMPA
(European/Other) 972 966 1.01 972 1.00
1,194 1,188 4.03 1,179 4.16 C910 Acute lymphoid leukaemia Total NZ Mäori 57 57 1.00 57 1.00
Total Pacific 24 24 1.00 24 1.00
Total Asian 24 24 1.00 24 1.00
nonMPA
(European/Other) 174 171 1.02 168 1.04
279 276 4.02 273 4.04 C911 Chronic lymphoid leukaemia Total NZ Mäori 81 78 1.04 78 1.04
nonMPA
(European/Other) 849 825 1.03 834 1.02
930 903 2.07 912 2.06
C919 Other lymphoid leukaemia nonMPA
(European/Other) 102 96 1.06 99 1.03
102 96 1.06 99 1.03 C920 Acute myeloid leukaemia Total NZ Mäori 57 57 1.00 54 1.06
Total Pacific 48 48 1.00 45 1.07
Total Asian 24 27 0.89 24 1.00
nonMPA
(European/Other) 510 513 0.99 504 1.01
639 645 3.88 627 4.14 C921 Chronic myeloid leukaemia Total NZ Mäori 33 36 0.92 36 0.92
Total Asian 21 21 1.00 21 1.00
nonMPA
(European/Other) 150 141 1.06 135 1.11
204 198 2.98 192 3.03 C929 Other myeloid leukaemia Total NZ Mäori 18 18 1.00 15 1.20
nonMPA
(European/Other) 87 87 1.00 87 1.00
105 105 2.00 102 2.20
C930 Other leukaemia including
monocytic Total NZ Mäori 21 30 0.70 24 0.88
Total Pacific 9 12 0.75 12 0.75
nonMPA
(European/Other) 267 249 1.07 252 1.06
297 291 2.52 288 2.69
C96- Other lymphoid or
haematopoietic malignancies
nonMPA
(European/Other) 18 18 1.00 18 1.00
18 18 1.00 18 1.00 CXXX Other Cancers Total NZ Mäori 57 48 1.19 51 1.12
Total Pacific 21 18 1.17 18 1.17
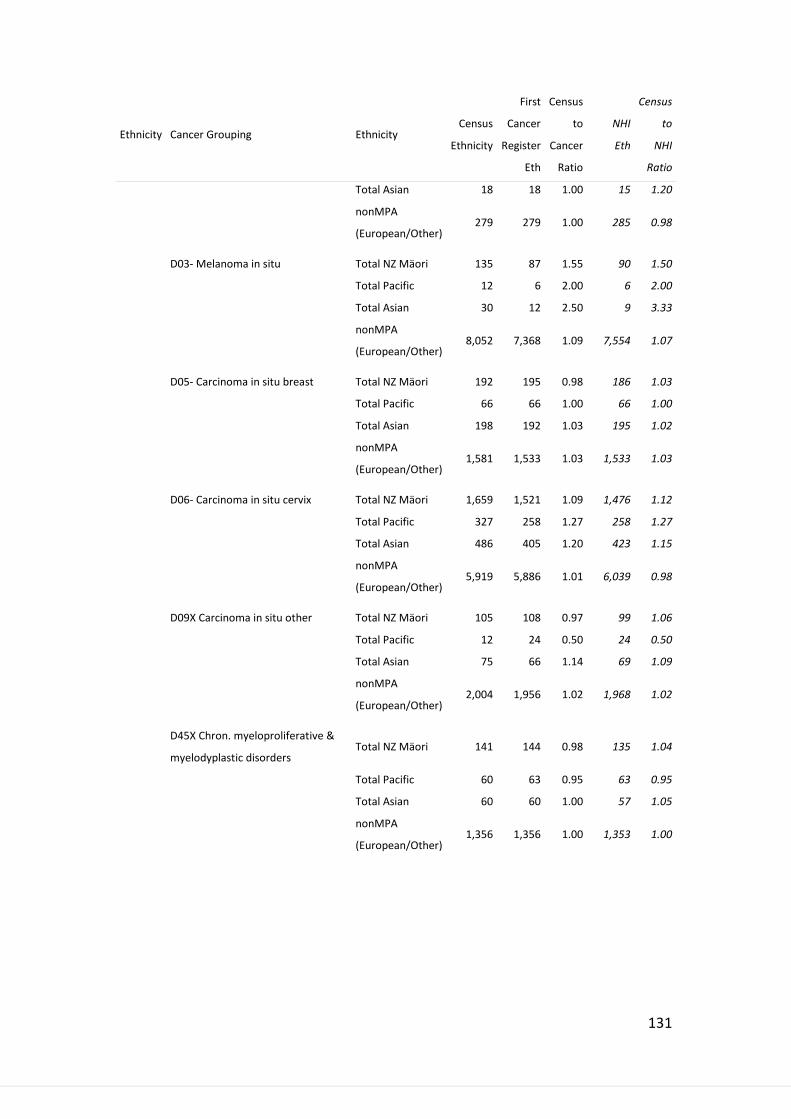
131
Ethnicity Cancer Grouping Ethnicity Census
Ethnicity
First
Cancer
Register
Eth
Census
to
Cancer
Ratio
NHI
Eth
Census
to
NHI
Ratio
Total Asian 18 18 1.00 15 1.20
nonMPA
(European/Other) 279 279 1.00 285 0.98
375 363 4.36 369 4.47 D03- Melanoma in situ Total NZ Mäori 135 87 1.55 90 1.50
Total Pacific 12 6 2.00 6 2.00
Total Asian 30 12 2.50 9 3.33
nonMPA
(European/Other) 8,052 7,368 1.09 7,554 1.07
8,229 7,473 7.14 7,659 7.90 D05- Carcinoma in situ breast Total NZ Mäori 192 195 0.98 186 1.03
Total Pacific 66 66 1.00 66 1.00
Total Asian 198 192 1.03 195 1.02
nonMPA
(European/Other) 1,581 1,533 1.03 1,533 1.03
2,037 1,986 4.04 1,980 4.08 D06- Carcinoma in situ cervix Total NZ Mäori 1,659 1,521 1.09 1,476 1.12
Total Pacific 327 258 1.27 258 1.27
Total Asian 486 405 1.20 423 1.15
nonMPA
(European/Other) 5,919 5,886 1.01 6,039 0.98
8,391 8,070 4.57 8,196 4.52 D09X Carcinoma in situ other Total NZ Mäori 105 108 0.97 99 1.06
Total Pacific 12 24 0.50 24 0.50
Total Asian 75 66 1.14 69 1.09
nonMPA
(European/Other) 2,004 1,956 1.02 1,968 1.02
2,196 2,154 3.63 2,160 3.67
D45X Chron. myeloproliferative &
myelodyplastic disorders Total NZ Mäori 141 144 0.98 135 1.04
Total Pacific 60 63 0.95 63 0.95
Total Asian 60 60 1.00 57 1.05
nonMPA
(European/Other) 1,356 1,356 1.00 1,353 1.00
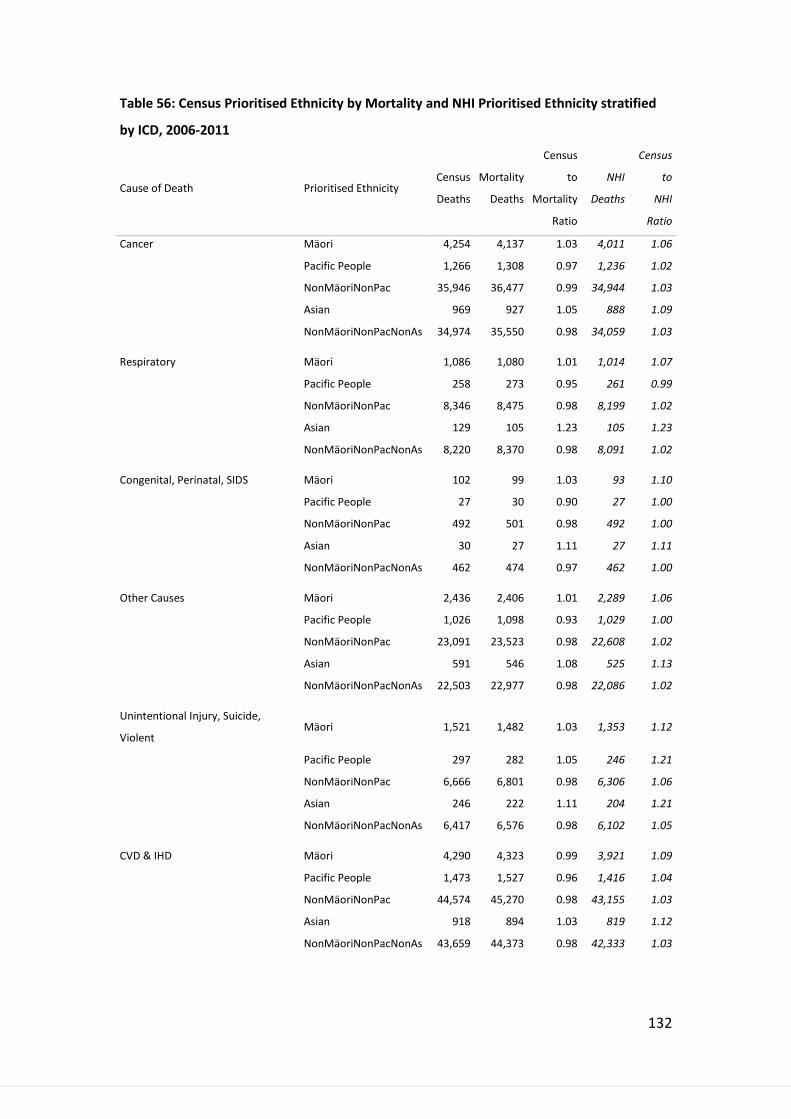
132
Table 56: Census Prioritised Ethnicity by Mortality and NHI Prioritised Ethnicity stratified
by ICD, 2006-2011
Cause of Death Prioritised Ethnicity Census
Deaths
Mortality
Deaths
Census
to
Mortality
Ratio
NHI
Deaths
Census
to
NHI
Ratio
Cancer Mäori 4,254 4,137 1.03 4,011 1.06
Pacific People 1,266 1,308 0.97 1,236 1.02
NonMäoriNonPac 35,946 36,477 0.99 34,944 1.03
Asian 969 927 1.05 888 1.09
NonMäoriNonPacNonAs 34,974 35,550 0.98 34,059 1.03
Respiratory Mäori 1,086 1,080 1.01 1,014 1.07
Pacific People 258 273 0.95 261 0.99
NonMäoriNonPac 8,346 8,475 0.98 8,199 1.02
Asian 129 105 1.23 105 1.23
NonMäoriNonPacNonAs 8,220 8,370 0.98 8,091 1.02
Congenital, Perinatal, SIDS Mäori 102 99 1.03 93 1.10
Pacific People 27 30 0.90 27 1.00
NonMäoriNonPac 492 501 0.98 492 1.00
Asian 30 27 1.11 27 1.11
NonMäoriNonPacNonAs 462 474 0.97 462 1.00
Other Causes Mäori 2,436 2,406 1.01 2,289 1.06
Pacific People 1,026 1,098 0.93 1,029 1.00
NonMäoriNonPac 23,091 23,523 0.98 22,608 1.02
Asian 591 546 1.08 525 1.13
NonMäoriNonPacNonAs 22,503 22,977 0.98 22,086 1.02
Unintentional Injury, Suicide,
Violent Mäori 1,521 1,482 1.03 1,353 1.12
Pacific People 297 282 1.05 246 1.21
NonMäoriNonPac 6,666 6,801 0.98 6,306 1.06
Asian 246 222 1.11 204 1.21
NonMäoriNonPacNonAs 6,417 6,576 0.98 6,102 1.05
CVD & IHD Mäori 4,290 4,323 0.99 3,921 1.09
Pacific People 1,473 1,527 0.96 1,416 1.04
NonMäoriNonPac 44,574 45,270 0.98 43,155 1.03
Asian 918 894 1.03 819 1.12
NonMäoriNonPacNonAs 43,659 44,373 0.98 42,333 1.03

133
Table 57: Census Prioritised Ethnicity by Cancer Registration and NHI Prioritised Ethnicity
stratified by first Cancer Registration, 2006-2011
Ethnicity Cancer Grouping Prioritised Ethnicity Census
Ethnicity
First
Cancer
Register
Eth
Census
to
Cancer
Ratio
NHI
Eth
Census
to
NHI
Ratio
Prioritised
Ethnicity
C00X Lip, oral cavity and
pharynx Mäori 120 111 1.08 102 1.18
Pacific People 78 81 0.96 75 1.04
NonMäoriNonPac 1,404 1,365 1.03 1,368 1.03
Asian 75 75 1.00 78 0.96
NonMäoriNonPacNonAs 1,326 1,293 1.03 1,290 1.03
3,003 2,925 5.10 2,913 5.24 C15- Oesophagus Mäori 78 84 0.93 72 1.08
Pacific People 18 18 1.00 18 1.00
NonMäoriNonPac 1,179 1,179 1.00 1,140 1.03
Asian 21 18 1.17 21 1.00
NonMäoriNonPacNonAs 1,155 1,161 0.99 1,119 1.03
2,451 2,460 5.09 2,370 5.14 C16- Stomach Mäori 312 327 0.95 300 1.04
Pacific People 120 120 1.00 120 1.00
NonMäoriNonPac 1,194 1,179 1.01 1,158 1.03
Asian 90 90 1.00 87 1.03
NonMäoriNonPacNonAs 1,107 1,089 1.02 1,077 1.03
2,823 2,805 4.98 2,742 5.13 C180 Caecum Mäori 51 63 0.81 57 0.89
Pacific People 15 18 0.83 18 0.83
NonMäoriNonPac 1,626 1,605 1.01 1,584 1.03
Asian 21 24 0.88 21 1.00
NonMäoriNonPacNonAs 1,605 1,581 1.02 1,560 1.03
3,318 3,291 4.55 3,240 4.78 C182 Ascending colon Mäori 54 51 1.06 48 1.13
Pacific People 15 12 1.25 9 1.67
NonMäoriNonPac 1,689 1,659 1.02 1,671 1.01
Asian 36 33 1.09 36 1.00
NonMäoriNonPacNonAs 1,656 1,629 1.02 1,635 1.01
3,450 3,384 5.44 3,399 5.82 C183 Hepatic flexure Mäori 24 21 1.14 18 1.33
NonMäoriNonPac 438 435 1.01 432 1.01
NonMäoriNonPacNonAs 435 426 1.02 426 1.02
897 882 3.17 876 3.36 C184 Transverse colon Mäori 45 39 1.15 36 1.25
NonMäoriNonPac 828 828 1.00 810 1.02
Asian 24 18 1.33 18 1.33
NonMäoriNonPacNonAs 804 807 1.00 789 1.02

134
Ethnicity Cancer Grouping Prioritised Ethnicity Census
Ethnicity
First
Cancer
Register
Eth
Census
to
Cancer
Ratio
NHI
Eth
Census
to
NHI
Ratio
1,701 1,692 4.48 1,653 4.62 C185 Splenic flexure Mäori 12 18 0.67 12 1.00
NonMäoriNonPac 261 261 1.00 261 1.00
NonMäoriNonPacNonAs 258 255 1.01 255 1.01
531 534 2.68 528 3.01 C186 Descending colon Mäori 18 24 0.75 21 0.86
NonMäoriNonPac 453 441 1.03 435 1.04
Asian 15 12 1.25 9 1.67
NonMäoriNonPacNonAs 438 429 1.02 429 1.02
924 906 4.05 894 4.59 C187 Sigmoid Mäori 153 147 1.04 132 1.16
Pacific People 39 42 0.93 39 1.00
NonMäoriNonPac 2,388 2,370 1.01 2,361 1.01
Asian 84 84 1.00 84 1.00
NonMäoriNonPacNonAs 2,304 2,286 1.01 2,277 1.01
4,968 4,929 4.99 4,893 5.18
C188&C181 Overlapping
and appendix Mäori 15 15 1.00 15 1.00
NonMäoriNonPac 195 189 1.03 186 1.05
NonMäoriNonPacNonAs 192 186 1.03 183 1.05
402 390 3.06 384 3.10 C189 Unspecified Colon Mäori 30 36 0.83 27 1.11
Pacific People 9 12 0.75 12 0.75
NonMäoriNonPac 465 465 1.00 450 1.03
NonMäoriNonPacNonAs 459 459 1.00 444 1.03
963 972 3.58 933 3.92 C19- Rectosigmoid junction Mäori 45 48 0.94 39 1.15
Pacific People 12 15 0.80 12 1.00
NonMäoriNonPac 810 801 1.01 801 1.01
Asian 24 21 1.14 24 1.00
NonMäoriNonPacNonAs 786 780 1.01 780 1.01
1,677 1,665 4.90 1,656 5.17 C20- Rectum Mäori 201 204 0.99 180 1.12
Pacific People 78 81 0.96 81 0.96
NonMäoriNonPac 2,844 2,796 1.02 2,766 1.03
Asian 102 93 1.10 93 1.10
NonMäoriNonPacNonAs 2,745 2,703 1.02 2,676 1.03
5,970 5,877 5.09 5,796 5.24 C21- Anus and anal canal Mäori 24 30 0.80 27 0.89
NonMäoriNonPac 198 192 1.03 195 1.02
NonMäoriNonPacNonAs 198 189 1.05 192 1.03
420 411 2.88 414 2.94

135
Ethnicity Cancer Grouping Prioritised Ethnicity Census
Ethnicity
First
Cancer
Register
Eth
Census
to
Cancer
Ratio
NHI
Eth
Census
to
NHI
Ratio
C22- Liver and intrahepatic
bile ducts Mäori 210 213 0.99 204 1.03
Pacific People 93 108 0.86 102 0.91
NonMäoriNonPac 798 777 1.03 765 1.04
Asian 102 87 1.17 90 1.13
NonMäoriNonPacNonAs 696 690 1.01 672 1.04
1,899 1,875 5.06 1,833 5.15
C23X Gallbladder and extra-
hepatic biliary tract Mäori 57 60 0.95 51 1.12
Pacific People 30 30 1.00 27 1.11
NonMäoriNonPac 402 402 1.00 393 1.02
Asian 30 27 1.11 30 1.00
NonMäoriNonPacNonAs 375 372 1.01 366 1.02
894 891 5.07 867 5.27 C25- Pancreas Mäori 204 213 0.96 177 1.15
Pacific People 48 48 1.00 42 1.14
NonMäoriNonPac 1,830 1,836 1.00 1,761 1.04
Asian 66 69 0.96 63 1.05
NonMäoriNonPacNonAs 1,761 1,764 1.00 1,698 1.04
3,909 3,930 4.92 3,741 5.42
C26X Digestive tract-other,
including small intestine Mäori 81 81 1.00 75 1.08
Pacific People 27 36 0.75 30 0.90
NonMäoriNonPac 684 681 1.00 663 1.03
Asian 27 24 1.13 24 1.13
NonMäoriNonPacNonAs 654 654 1.00 639 1.02
1,473 1,476 4.88 1,431 5.16
C30X Ear, larynx and nasal
cavity Mäori 60 60 1.00 54 1.11
Pacific People 15 12 1.25 15 1.00
NonMäoriNonPac 402 405 0.99 399 1.01
NonMäoriNonPacNonAs 393 396 0.99 387 1.02
870 873 4.23 855 4.14 C33X Trachea and bronchus Mäori 120 132 0.91 120 1.00
Pacific People 33 27 1.22 33 1.00
NonMäoriNonPac 543 534 1.02 522 1.04
Asian 12 6 2.00 9 1.33
NonMäoriNonPacNonAs 531 528 1.01 513 1.04
1,239 1,227 6.16 1,197 5.41 C341 Upper lobe Mäori 603 666 0.91 594 1.02
Pacific People 108 105 1.03 105 1.03
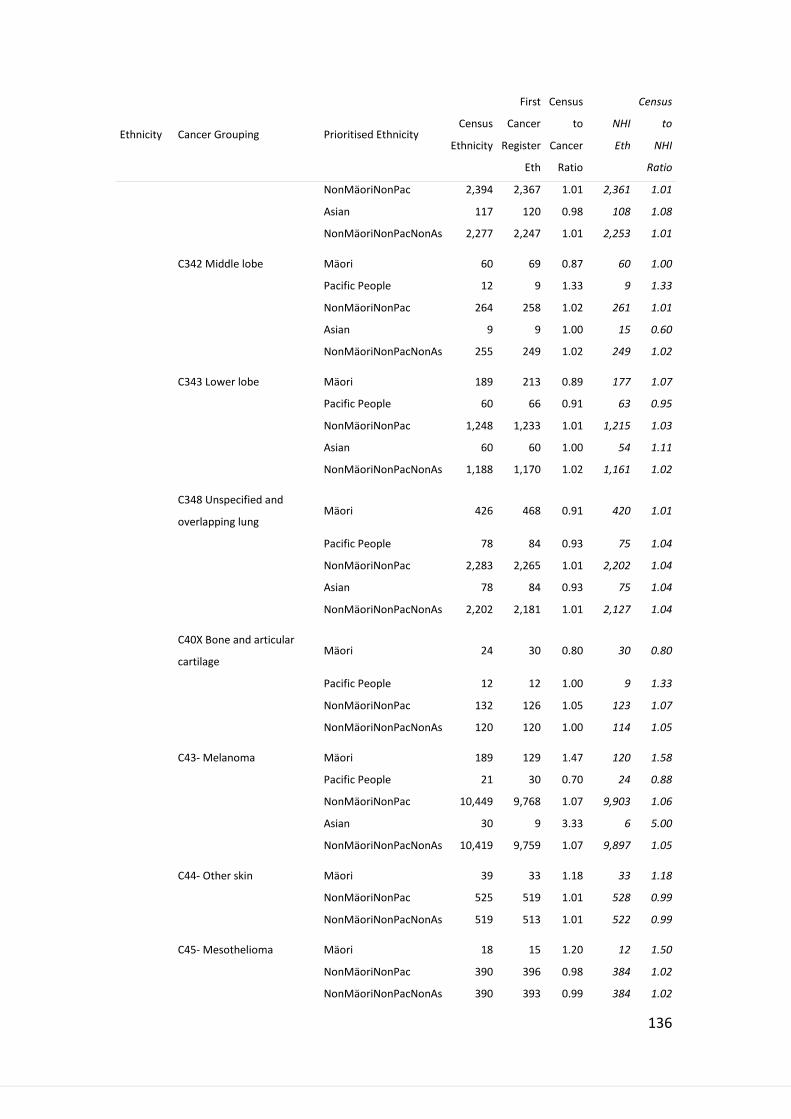
136
Ethnicity Cancer Grouping Prioritised Ethnicity Census
Ethnicity
First
Cancer
Register
Eth
Census
to
Cancer
Ratio
NHI
Eth
Census
to
NHI
Ratio
NonMäoriNonPac 2,394 2,367 1.01 2,361 1.01
Asian 117 120 0.98 108 1.08
NonMäoriNonPacNonAs 2,277 2,247 1.01 2,253 1.01
5,499 5,505 4.94 5,421 5.15 C342 Middle lobe Mäori 60 69 0.87 60 1.00
Pacific People 12 9 1.33 9 1.33
NonMäoriNonPac 264 258 1.02 261 1.01
Asian 9 9 1.00 15 0.60
NonMäoriNonPacNonAs 255 249 1.02 249 1.02
600 594 5.24 594 4.96 C343 Lower lobe Mäori 189 213 0.89 177 1.07
Pacific People 60 66 0.91 63 0.95
NonMäoriNonPac 1,248 1,233 1.01 1,215 1.03
Asian 60 60 1.00 54 1.11
NonMäoriNonPacNonAs 1,188 1,170 1.02 1,161 1.02
2,745 2,742 4.83 2,670 5.18
C348 Unspecified and
overlapping lung Mäori 426 468 0.91 420 1.01
Pacific People 78 84 0.93 75 1.04
NonMäoriNonPac 2,283 2,265 1.01 2,202 1.04
Asian 78 84 0.93 75 1.04
NonMäoriNonPacNonAs 2,202 2,181 1.01 2,127 1.04
5,067 5,082 4.79 4,899 5.17
C40X Bone and articular
cartilage Mäori 24 30 0.80 30 0.80
Pacific People 12 12 1.00 9 1.33
NonMäoriNonPac 132 126 1.05 123 1.07
NonMäoriNonPacNonAs 120 120 1.00 114 1.05
288 288 3.85 276 4.25 C43- Melanoma Mäori 189 129 1.47 120 1.58
Pacific People 21 30 0.70 24 0.88
NonMäoriNonPac 10,449 9,768 1.07 9,903 1.06
Asian 30 9 3.33 6 5.00
NonMäoriNonPacNonAs 10,419 9,759 1.07 9,897 1.05
21,108 19,695 7.64 19,950 9.57 C44- Other skin Mäori 39 33 1.18 33 1.18
NonMäoriNonPac 525 519 1.01 528 0.99
NonMäoriNonPacNonAs 519 513 1.01 522 0.99
1,083 1,065 3.20 1,083 3.16 C45- Mesothelioma Mäori 18 15 1.20 12 1.50
NonMäoriNonPac 390 396 0.98 384 1.02
NonMäoriNonPacNonAs 390 393 0.99 384 1.02
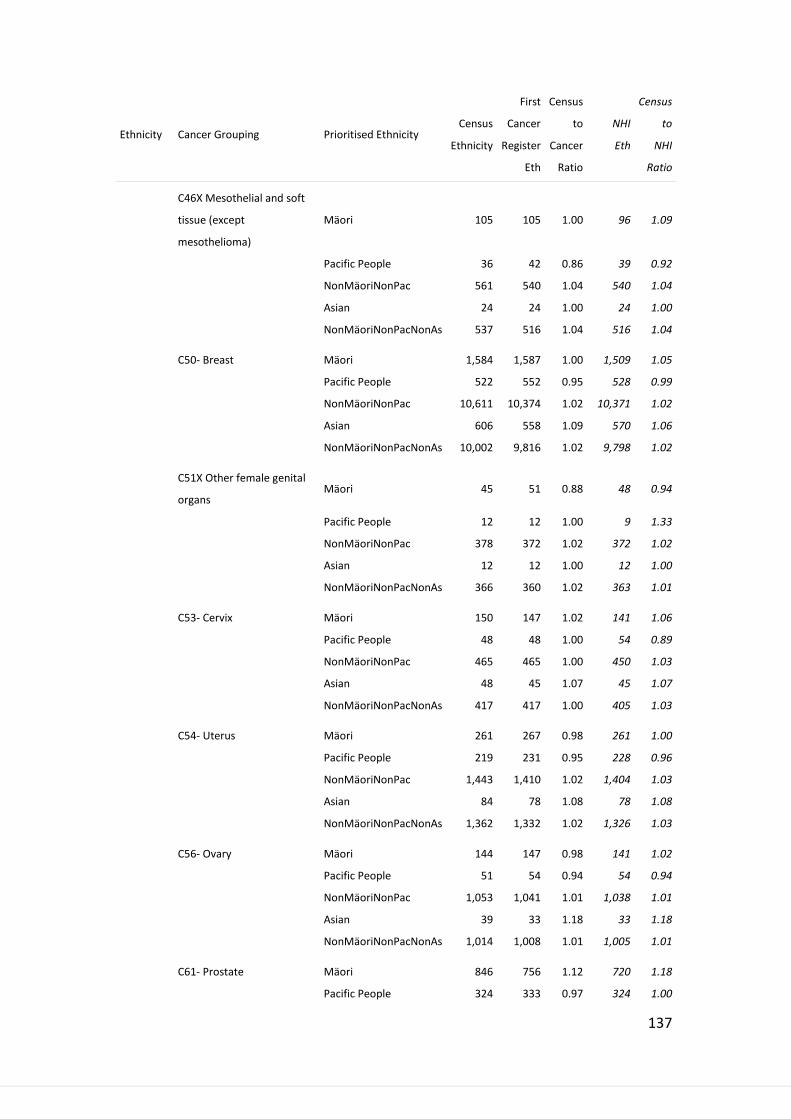
137
Ethnicity Cancer Grouping Prioritised Ethnicity Census
Ethnicity
First
Cancer
Register
Eth
Census
to
Cancer
Ratio
NHI
Eth
Census
to
NHI
Ratio
798 804 3.17 780 3.54
C46X Mesothelial and soft
tissue (except
mesothelioma)
Mäori 105 105 1.00 96 1.09
Pacific People 36 42 0.86 39 0.92
NonMäoriNonPac 561 540 1.04 540 1.04
Asian 24 24 1.00 24 1.00
NonMäoriNonPacNonAs 537 516 1.04 516 1.04
1,263 1,227 4.94 1,215 5.09 C50- Breast Mäori 1,584 1,587 1.00 1,509 1.05
Pacific People 522 552 0.95 528 0.99
NonMäoriNonPac 10,611 10,374 1.02 10,371 1.02
Asian 606 558 1.09 570 1.06
NonMäoriNonPacNonAs 10,002 9,816 1.02 9,798 1.02
23,325 22,887 5.08 22,776 5.14
C51X Other female genital
organs Mäori 45 51 0.88 48 0.94
Pacific People 12 12 1.00 9 1.33
NonMäoriNonPac 378 372 1.02 372 1.02
Asian 12 12 1.00 12 1.00
NonMäoriNonPacNonAs 366 360 1.02 363 1.01
813 807 4.92 804 5.30 C53- Cervix Mäori 150 147 1.02 141 1.06
Pacific People 48 48 1.00 54 0.89
NonMäoriNonPac 465 465 1.00 450 1.03
Asian 48 45 1.07 45 1.07
NonMäoriNonPacNonAs 417 417 1.00 405 1.03
1,128 1,122 5.09 1,095 5.08 C54- Uterus Mäori 261 267 0.98 261 1.00
Pacific People 219 231 0.95 228 0.96
NonMäoriNonPac 1,443 1,410 1.02 1,404 1.03
Asian 84 78 1.08 78 1.08
NonMäoriNonPacNonAs 1,362 1,332 1.02 1,326 1.03
3,369 3,318 5.05 3,297 5.10 C56- Ovary Mäori 144 147 0.98 141 1.02
Pacific People 51 54 0.94 54 0.94
NonMäoriNonPac 1,053 1,041 1.01 1,038 1.01
Asian 39 33 1.18 33 1.18
NonMäoriNonPacNonAs 1,014 1,008 1.01 1,005 1.01
2,301 2,283 5.12 2,271 5.16 C61- Prostate Mäori 846 756 1.12 720 1.18
Pacific People 324 333 0.97 324 1.00
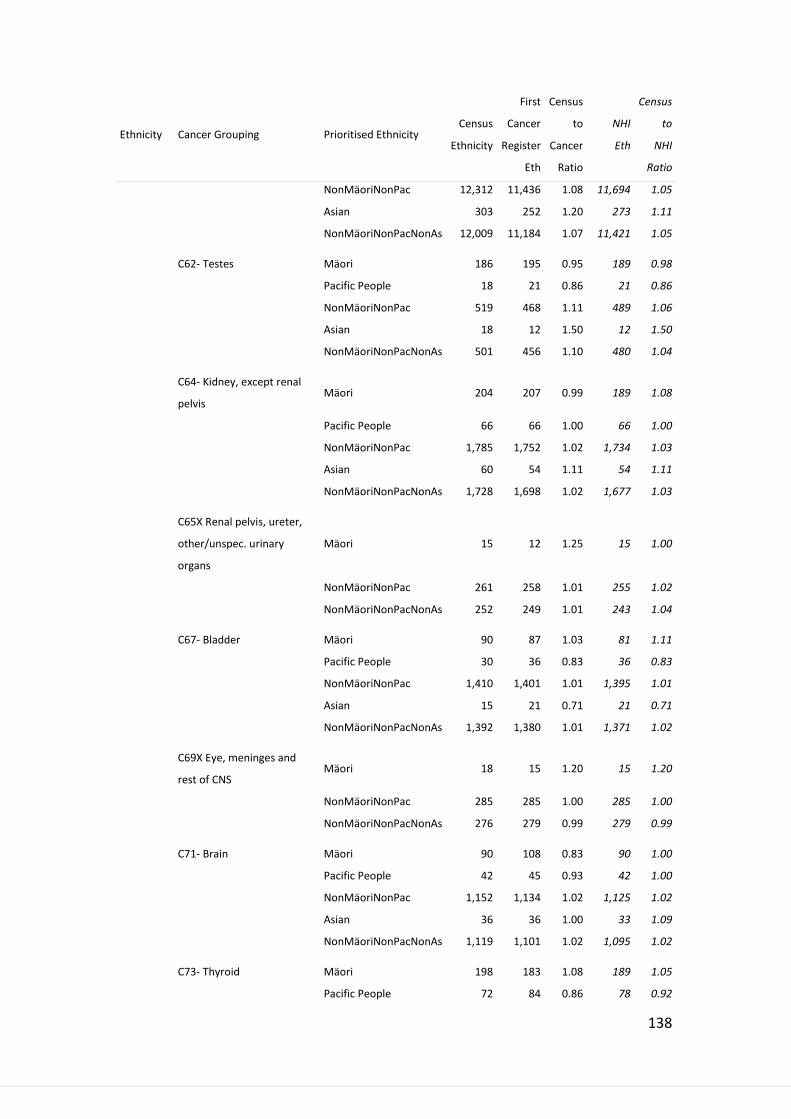
138
Ethnicity Cancer Grouping Prioritised Ethnicity Census
Ethnicity
First
Cancer
Register
Eth
Census
to
Cancer
Ratio
NHI
Eth
Census
to
NHI
Ratio
NonMäoriNonPac 12,312 11,436 1.08 11,694 1.05
Asian 303 252 1.20 273 1.11
NonMäoriNonPacNonAs 12,009 11,184 1.07 11,421 1.05
25,794 23,961 5.44 24,432 5.39 C62- Testes Mäori 186 195 0.95 189 0.98
Pacific People 18 21 0.86 21 0.86
NonMäoriNonPac 519 468 1.11 489 1.06
Asian 18 12 1.50 12 1.50
NonMäoriNonPacNonAs 501 456 1.10 480 1.04
1,242 1,152 5.52 1,191 5.44
C64- Kidney, except renal
pelvis Mäori 204 207 0.99 189 1.08
Pacific People 66 66 1.00 66 1.00
NonMäoriNonPac 1,785 1,752 1.02 1,734 1.03
Asian 60 54 1.11 54 1.11
NonMäoriNonPacNonAs 1,728 1,698 1.02 1,677 1.03
3,843 3,777 5.14 3,720 5.25
C65X Renal pelvis, ureter,
other/unspec. urinary
organs
Mäori 15 12 1.25 15 1.00
NonMäoriNonPac 261 258 1.01 255 1.02
NonMäoriNonPacNonAs 252 249 1.01 243 1.04
528 519 3.27 513 3.06 C67- Bladder Mäori 90 87 1.03 81 1.11
Pacific People 30 36 0.83 36 0.83
NonMäoriNonPac 1,410 1,401 1.01 1,395 1.01
Asian 15 21 0.71 21 0.71
NonMäoriNonPacNonAs 1,392 1,380 1.01 1,371 1.02
2,937 2,925 4.59 2,904 4.68
C69X Eye, meninges and
rest of CNS Mäori 18 15 1.20 15 1.20
NonMäoriNonPac 285 285 1.00 285 1.00
NonMäoriNonPacNonAs 276 279 0.99 279 0.99
579 579 3.19 579 3.19 C71- Brain Mäori 90 108 0.83 90 1.00
Pacific People 42 45 0.93 42 1.00
NonMäoriNonPac 1,152 1,134 1.02 1,125 1.02
Asian 36 36 1.00 33 1.09
NonMäoriNonPacNonAs 1,119 1,101 1.02 1,095 1.02
2,439 2,424 4.80 2,385 5.13 C73- Thyroid Mäori 198 183 1.08 189 1.05
Pacific People 72 84 0.86 78 0.92

139
Ethnicity Cancer Grouping Prioritised Ethnicity Census
Ethnicity
First
Cancer
Register
Eth
Census
to
Cancer
Ratio
NHI
Eth
Census
to
NHI
Ratio
NonMäoriNonPac 837 810 1.03 810 1.03
Asian 144 129 1.12 135 1.07
NonMäoriNonPacNonAs 693 678 1.02 678 1.02
1,944 1,884 5.11 1,890 5.09
C76X Ill defined, secondary
or unspecified sites Mäori 156 174 0.90 159 0.98
Pacific People 69 81 0.85 75 0.92
NonMäoriNonPac 1,707 1,698 1.01 1,638 1.04
Asian 24 21 1.14 18 1.33
NonMäoriNonPacNonAs 1,680 1,677 1.00 1,617 1.04
3,636 3,651 4.90 3,507 5.31 C81- Hodgkin's Disease Mäori 30 33 0.91 33 0.91
Pacific People 24 24 1.00 24 1.00
NonMäoriNonPac 402 399 1.01 393 1.02
Asian 21 18 1.17 18 1.17
NonMäoriNonPacNonAs 381 381 1.00 378 1.01
858 855 5.09 846 5.11
C82- Follicular Non-
Hodgkin's Disease Mäori 39 39 1.00 39 1.00
Pacific People 9 9 1.00 12 0.75
NonMäoriNonPac 735 708 1.04 714 1.03
Asian 21 21 1.00 24 0.88
NonMäoriNonPacNonAs 711 687 1.03 693 1.03
1,515 1,464 5.07 1,482 4.69 C83- Diffuse NHL Mäori 153 153 1.00 147 1.04
Pacific People 51 51 1.00 51 1.00
NonMäoriNonPac 1,623 1,590 1.02 1,575 1.03
Asian 72 75 0.96 72 1.00
NonMäoriNonPacNonAs 1,548 1,512 1.02 1,503 1.03
3,447 3,381 5.00 3,348 5.10
C84- Peripheral and T cell
lymphoma Mäori 18 21 0.86 15 1.20
Pacific People 12 12 1.00 12 1.00
NonMäoriNonPac 228 219 1.04 222 1.03
Asian 9 9 1.00 9 1.00
NonMäoriNonPacNonAs 219 210 1.04 213 1.03
486 471 4.94 471 5.26 C85- Other NHL Mäori 36 42 0.86 33 1.09
Pacific People 15 12 1.25 12 1.25
NonMäoriNonPac 564 543 1.04 549 1.03
Asian 27 24 1.13 24 1.13

140
Ethnicity Cancer Grouping Prioritised Ethnicity Census
Ethnicity
First
Cancer
Register
Eth
Census
to
Cancer
Ratio
NHI
Eth
Census
to
NHI
Ratio
NonMäoriNonPacNonAs 534 519 1.03 522 1.02
1,176 1,140 5.31 1,140 5.52 C900 Multiple myeloma Mäori 111 108 1.03 96 1.16
Pacific People 66 72 0.92 66 1.00
NonMäoriNonPac 1,017 1,005 1.01 1,014 1.00
Asian 45 39 1.15 45 1.00
NonMäoriNonPacNonAs 972 966 1.01 972 1.00
2,211 2,190 5.12 2,193 5.16
C910 Acute lymphoid
leukaemia Mäori 57 57 1.00 57 1.00
Pacific People 18 24 0.75 24 0.75
NonMäoriNonPac 198 195 1.02 195 1.02
Asian 24 24 1.00 24 1.00
NonMäoriNonPacNonAs 174 171 1.02 168 1.04
471 471 4.79 468 4.81
C911 Chronic lymphoid
leukaemia Mäori 81 78 1.04 78 1.04
NonMäoriNonPac 855 828 1.03 840 1.02
NonMäoriNonPacNonAs 849 825 1.03 834 1.02
1,785 1,731 3.10 1,752 3.08
C919 Other lymphoid
leukaemia NonMäoriNonPac 102 99 1.03 99 1.03
NonMäoriNonPacNonAs 102 96 1.06 99 1.03
204 195 2.09 198 2.06
C920 Acute myeloid
leukaemia Mäori 57 57 1.00 54 1.06
Pacific People 48 45 1.07 45 1.07
NonMäoriNonPac 534 537 0.99 525 1.02
Asian 24 27 0.89 24 1.00
NonMäoriNonPacNonAs 510 513 0.99 504 1.01
1,173 1,179 4.94 1,152 5.16
C921 Chronic myeloid
leukaemia Mäori 33 36 0.92 36 0.92
NonMäoriNonPac 171 159 1.08 156 1.10
Asian 21 18 1.17 21 1.00
NonMäoriNonPacNonAs 150 141 1.06 135 1.11
375 354 4.23 348 4.13
C929 Other myeloid
leukaemia Mäori 18 18 1.00 15 1.20
NonMäoriNonPac 93 93 1.00 93 1.00
NonMäoriNonPacNonAs 87 87 1.00 87 1.00
198 198 3.00 195 3.20
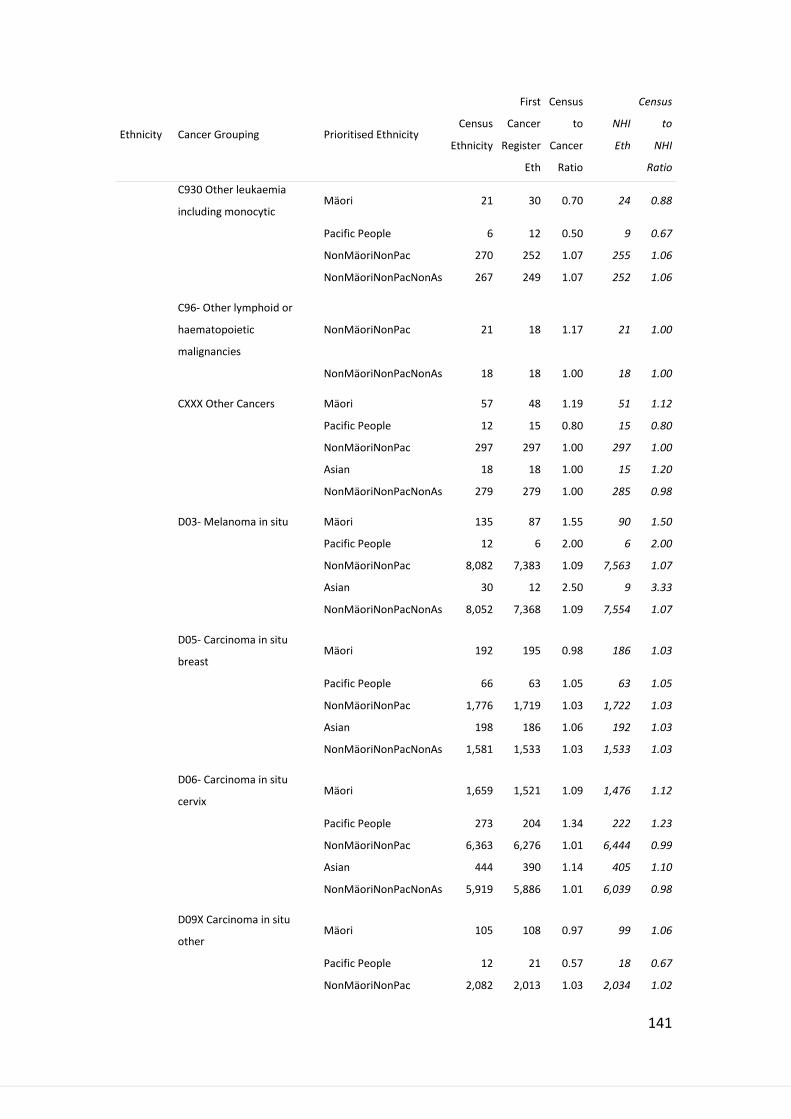
141
Ethnicity Cancer Grouping Prioritised Ethnicity Census
Ethnicity
First
Cancer
Register
Eth
Census
to
Cancer
Ratio
NHI
Eth
Census
to
NHI
Ratio
C930 Other leukaemia
including monocytic Mäori 21 30 0.70 24 0.88
Pacific People 6 12 0.50 9 0.67
NonMäoriNonPac 270 252 1.07 255 1.06
NonMäoriNonPacNonAs 267 249 1.07 252 1.06
564 543 3.34 540 3.67
C96- Other lymphoid or
haematopoietic
malignancies
NonMäoriNonPac 21 18 1.17 21 1.00
NonMäoriNonPacNonAs 18 18 1.00 18 1.00
39 36 2.17 39 2.00 CXXX Other Cancers Mäori 57 48 1.19 51 1.12
Pacific People 12 15 0.80 15 0.80
NonMäoriNonPac 297 297 1.00 297 1.00
Asian 18 18 1.00 15 1.20
NonMäoriNonPacNonAs 279 279 1.00 285 0.98
663 657 4.99 663 5.10 D03- Melanoma in situ Mäori 135 87 1.55 90 1.50
Pacific People 12 6 2.00 6 2.00
NonMäoriNonPac 8,082 7,383 1.09 7,563 1.07
Asian 30 12 2.50 9 3.33
NonMäoriNonPacNonAs 8,052 7,368 1.09 7,554 1.07
16,311 14,856 8.23 15,222 8.97
D05- Carcinoma in situ
breast Mäori 192 195 0.98 186 1.03
Pacific People 66 63 1.05 63 1.05
NonMäoriNonPac 1,776 1,719 1.03 1,722 1.03
Asian 198 186 1.06 192 1.03
NonMäoriNonPacNonAs 1,581 1,533 1.03 1,533 1.03
3,813 3,696 5.15 3,696 5.17
D06- Carcinoma in situ
cervix Mäori 1,659 1,521 1.09 1,476 1.12
Pacific People 273 204 1.34 222 1.23
NonMäoriNonPac 6,363 6,276 1.01 6,444 0.99
Asian 444 390 1.14 405 1.10
NonMäoriNonPacNonAs 5,919 5,886 1.01 6,039 0.98
14,658 14,277 5.59 14,586 5.42
D09X Carcinoma in situ
other Mäori 105 108 0.97 99 1.06
Pacific People 12 21 0.57 18 0.67
NonMäoriNonPac 2,082 2,013 1.03 2,034 1.02

142
Ethnicity Cancer Grouping Prioritised Ethnicity Census
Ethnicity
First
Cancer
Register
Eth
Census
to
Cancer
Ratio
NHI
Eth
Census
to
NHI
Ratio
Asian 75 57 1.32 66 1.14
NonMäoriNonPacNonAs 2,004 1,956 1.02 1,968 1.02
4,278 4,155 4.91 4,185 4.91
D45X Chron.
myeloproliferative &
myelodyplastic disorders
Mäori 141 144 0.98 135 1.04
Pacific People 60 63 0.95 63 0.95
NonMäoriNonPac 1,413 1,413 1.00 1,410 1.00
Asian 60 60 1.00 57 1.05
NonMäoriNonPacNonAs 1,356 1,356 1.00 1,353 1.00

143
Appendix C
/*Read QualityStage Files for NZCMS/CT linkage*/
/*File ReadQSFiles.sas 22.5.2014*/
options papersize=A4;
libname PDefault
"\\stats.govt.nz\sas\02bau\SocPopStats\Census\NZCMS_CT2006Linkage\QSDatasets\Pass1NoCu
toffs";
libname P1MB1NC
"\\stats.govt.nz\sas\02bau\SocPopStats\Census\NZCMS_CT2006Linkage\QSDatasets\Pass1MB1N
oCutoffs";
libname P1_3MBWC
"\\stats.govt.nz\sas\02bau\SocPopStats\Census\NZCMS_CT2006Linkage\QSDatasets\Pass1_3MB
1_3Cut16_5";
libname P4AU1NC
"\\stats.govt.nz\sas\02bau\SocPopStats\Census\NZCMS_CT2006Linkage\QSDatasets\Pass4NoCu
toffs";
libname P1_7WC
"\\stats.govt.nz\sas\02bau\SocPopStats\Census\NZCMS_CT2006Linkage\QSDatasets\Pass1_7MB
1_3AU1_4";
libname TryRunNC
"\\stats.govt.nz\sas\02bau\SocPopStats\Census\NZCMS_CT2006Linkage\QSDatasets\TryRunsNC
";
libname FinLinks
"\\stats.govt.nz\sas\02bau\SocPopStats\Census\NZCMS_CT2006Linkage\QSDatasets\FinalLink
s";
x "cd \\stats.govt.nz\sas\02bau\SocPopStats\Census\NZCMS_CT2006Linkage\outputs";
%macro
ReadDat(libn=P1MB1NC,passdir=Pass1NoCutoffs,fnname=MatchesPass1,dsname=MatchesPass1,
basedir=\\stats.govt.nz\sas\02bau\SocPopStats\Census\NZCMS_CT2006Linkage\QSDatasets\);
DATA &libn..&dsname;
LENGTH
persID 8
sexa 8
mb 8
au 8
cob1x 8
DayA 8
MonthA 8
YearA 8
maoriA 8
pacifA 8
asianA 8

144
melaaA 8
nonmpaA 8
pacfix 8
asnfix 8
age 8
agemtor 8
BirthCC 8
COB2X 8
Resdnt 8
SexMtor 8
YrOrig 8
temp $ 1
patid $ 8
sexm 8
mb1 8
mb2 8
mb3 8
mb4 8
mb5 8
auopt01 8
auopt02 8
auopt03 8
auopt04 8
auopt05 8
auopt06 8
auopt07 8
auopt08 8
cobm 8
maorim 8
pacifm 8
asianm 8
melaam 8
nonmpam 8
pacfixm 8
asnfixm 8
nummbs 8
numaus 8
numdobs 8
numMgen 8
numFgen 8
numUgen 8
tempm $ 1
qsMatchRefID 8
qsMatchType $ 2
qsMatchWeight 8
qsMatchPattern 8
qsMatchLRFlag $ 1
qsMatchExactFlag $ 1
qsMatchPassNumber 8
qsMatchSetID 8
qsMatchDataID 8

145
dobdd0 8
dobdd1 8
dobdd2 8
dobdd3 8
dobdd4 8
dobmm0 8
dobmm1 8
dobmm2 8
dobmm3 8
dobmm4 8
dobyy0 8
dobyy1 8
dobyy2 8
dobyy3 8
dobyy4 8 ;
FORMAT
persID BEST7.
sexa BEST1.
mb BEST7.
au BEST6.
cob1x BEST1.
DayA BEST2.
MonthA BEST2.
YearA BEST4.
maoriA BEST1.
pacifA BEST1.
asianA BEST1.
melaaA BEST1.
nonmpaA BEST1.
pacfix BEST1.
asnfix BEST1.
age BEST3.
agemtor BEST1.
BirthCC BEST4.
COB2X BEST2.
Resdnt BEST1.
SexMtor BEST1.
YrOrig BEST4.
temp $CHAR1.
patid $CHAR8.
sexm BEST1.
mb1 BEST7.
mb2 BEST7.
mb3 BEST7.
mb4 BEST7.
mb5 BEST7.
auopt01 BEST6.
auopt02 BEST6.
auopt03 BEST6.
auopt04 BEST6.
auopt05 BEST6.
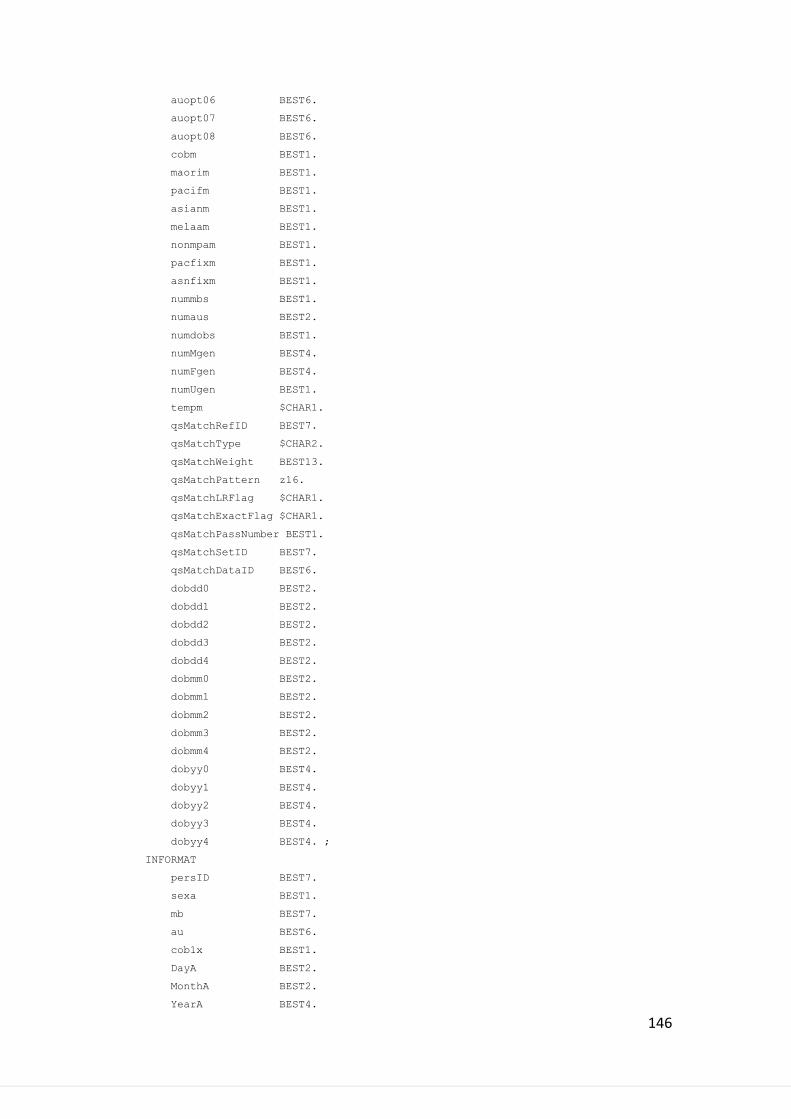
146
auopt06 BEST6.
auopt07 BEST6.
auopt08 BEST6.
cobm BEST1.
maorim BEST1.
pacifm BEST1.
asianm BEST1.
melaam BEST1.
nonmpam BEST1.
pacfixm BEST1.
asnfixm BEST1.
nummbs BEST1.
numaus BEST2.
numdobs BEST1.
numMgen BEST4.
numFgen BEST4.
numUgen BEST1.
tempm $CHAR1.
qsMatchRefID BEST7.
qsMatchType $CHAR2.
qsMatchWeight BEST13.
qsMatchPattern z16.
qsMatchLRFlag $CHAR1.
qsMatchExactFlag $CHAR1.
qsMatchPassNumber BEST1.
qsMatchSetID BEST7.
qsMatchDataID BEST6.
dobdd0 BEST2.
dobdd1 BEST2.
dobdd2 BEST2.
dobdd3 BEST2.
dobdd4 BEST2.
dobmm0 BEST2.
dobmm1 BEST2.
dobmm2 BEST2.
dobmm3 BEST2.
dobmm4 BEST2.
dobyy0 BEST4.
dobyy1 BEST4.
dobyy2 BEST4.
dobyy3 BEST4.
dobyy4 BEST4. ;
INFORMAT
persID BEST7.
sexa BEST1.
mb BEST7.
au BEST6.
cob1x BEST1.
DayA BEST2.
MonthA BEST2.
YearA BEST4.

147
maoriA BEST1.
pacifA BEST1.
asianA BEST1.
melaaA BEST1.
nonmpaA BEST1.
pacfix BEST1.
asnfix BEST1.
age BEST3.
agemtor BEST1.
BirthCC BEST4.
COB2X BEST2.
Resdnt BEST1.
SexMtor BEST1.
YrOrig BEST4.
temp $CHAR1.
patid $CHAR8.
sexm BEST1.
mb1 BEST7.
mb2 BEST7.
mb3 BEST7.
mb4 BEST7.
mb5 BEST7.
auopt01 BEST6.
auopt02 BEST6.
auopt03 BEST6.
auopt04 BEST6.
auopt05 BEST6.
auopt06 BEST6.
auopt07 BEST6.
auopt08 BEST6.
cobm BEST1.
maorim BEST1.
pacifm BEST1.
asianm BEST1.
melaam BEST1.
nonmpam BEST1.
pacfixm BEST1.
asnfixm BEST1.
nummbs BEST1.
numaus BEST2.
numdobs BEST1.
numMgen BEST4.
numFgen BEST4.
numUgen BEST1.
tempm $CHAR1.
qsMatchRefID BEST7.
qsMatchType $CHAR2.
qsMatchWeight BEST13.
qsMatchPattern BEST16.
qsMatchLRFlag $CHAR1.
qsMatchExactFlag $CHAR1.
148
qsMatchPassNumber BEST1.
qsMatchSetID BEST7.
qsMatchDataID BEST6.
dobdd0 BEST2.
dobdd1 BEST2.
dobdd2 BEST2.
dobdd3 BEST2.
dobdd4 BEST2.
dobmm0 BEST2.
dobmm1 BEST2.
dobmm2 BEST2.
dobmm3 BEST2.
dobmm4 BEST2.
dobyy0 BEST4.
dobyy1 BEST4.
dobyy2 BEST4.
dobyy3 BEST4.
dobyy4 BEST4. ;
INFILE "&basedir.&passdir\&fnname..csv"
LRECL=1000
FIRSTOBS=2
ENCODING="WLATIN1"
DLM='2c'x
MISSOVER
DSD ;
INPUT
persID : ?? BEST7.
sexa : ?? BEST1.
mb : ?? BEST7.
au : ?? BEST6.
cob1x : ?? BEST1.
DayA : ?? BEST2.
MonthA : ?? BEST2.
YearA : ?? BEST4.
maoriA : ?? BEST1.
pacifA : ?? BEST1.
asianA : ?? BEST1.
melaaA : ?? BEST1.
nonmpaA : ?? BEST1.
pacfix : ?? BEST1.
asnfix : ?? BEST1.
age : ?? BEST3.
agemtor : ?? BEST1.
BirthCC : ?? BEST4.
COB2X : ?? BEST2.
Resdnt : ?? BEST1.
SexMtor : ?? BEST1.
YrOrig : ?? BEST4.
temp : $CHAR1.
patid : $CHAR8.
sexm : ?? BEST1.

149
mb1 : ?? BEST7.
mb2 : ?? BEST7.
mb3 : ?? BEST7.
mb4 : ?? BEST7.
mb5 : ?? BEST7.
auopt01 : ?? BEST6.
auopt02 : ?? BEST6.
auopt03 : ?? BEST6.
auopt04 : ?? BEST6.
auopt05 : ?? BEST6.
auopt06 : ?? BEST6.
auopt07 : ?? BEST6.
auopt08 : ?? BEST6.
cobm : ?? BEST1.
maorim : ?? BEST1.
pacifm : ?? BEST1.
asianm : ?? BEST1.
melaam : ?? BEST1.
nonmpam : ?? BEST1.
pacfixm : ?? BEST1.
asnfixm : ?? BEST1.
nummbs : ?? BEST1.
numaus : ?? BEST2.
numdobs : ?? BEST1.
numMgen : ?? BEST4.
numFgen : ?? BEST4.
numUgen : ?? BEST1.
tempm : $CHAR1.
qsMatchRefID : ?? BEST7.
qsMatchType : $CHAR2.
qsMatchWeight : ?? COMMA13.
qsMatchPattern : ?? BEST16.
qsMatchLRFlag : $CHAR1.
qsMatchExactFlag : $CHAR1.
qsMatchPassNumber : ?? BEST1.
qsMatchSetID : ?? BEST7.
qsMatchDataID : ?? BEST6.
dobdd0 : ?? BEST2.
dobdd1 : ?? BEST2.
dobdd2 : ?? BEST2.
dobdd3 : ?? BEST2.
dobdd4 : ?? BEST2.
dobmm0 : ?? BEST2.
dobmm1 : ?? BEST2.
dobmm2 : ?? BEST2.
dobmm3 : ?? BEST2.
dobmm4 : ?? BEST2.
dobyy0 : ?? BEST4.
dobyy1 : ?? BEST4.
dobyy2 : ?? BEST4.
dobyy3 : ?? BEST4.

150
dobyy4 : ?? BEST4. ;
RUN;
%mend;
%macro
RdCenRes(libn=P1_7WC,passdir=Pass1_7MB1_3AU1_4,fnname=Cen_ResPass1_7,dsname=Cen_ResPas
s1_7,
basedir=\\stats.govt.nz\sas\02bau\SocPopStats\Census\NZCMS_CT2006Linkage\QSDatasets\);
DATA &libn..&dsname;
LENGTH
persID 8
sexa 8
mb 8
au 8
cob1x 8
DayA 8
MonthA 8
YearA 8
maoriA 8
pacifA 8
asianA 8
melaaA 8
nonmpaA 8
pacfix 8
asnfix 8
age 8
agemtor 8
BirthCC 8
COB2X 8
Resdnt 8
SexMtor 8
YrOrig 8
temp $ 1
qsMatchRefID 8
qsMatchType $ 2
;
FORMAT
persID BEST7.
sexa BEST1.
mb BEST7.
au BEST6.
cob1x BEST1.
DayA BEST2.
MonthA BEST2.
YearA BEST4.
maoriA BEST1.
pacifA BEST1.
asianA BEST1.
melaaA BEST1.

151
nonmpaA BEST1.
pacfix BEST1.
asnfix BEST1.
age BEST3.
agemtor BEST1.
BirthCC BEST4.
COB2X BEST2.
Resdnt BEST1.
SexMtor BEST1.
YrOrig BEST4.
temp $CHAR1.
qsMatchRefID BEST7.
qsMatchType $CHAR2.
;
INFORMAT
persID BEST7.
sexa BEST1.
mb BEST7.
au BEST6.
cob1x BEST1.
DayA BEST2.
MonthA BEST2.
YearA BEST4.
maoriA BEST1.
pacifA BEST1.
asianA BEST1.
melaaA BEST1.
nonmpaA BEST1.
pacfix BEST1.
asnfix BEST1.
age BEST3.
agemtor BEST1.
BirthCC BEST4.
COB2X BEST2.
Resdnt BEST1.
SexMtor BEST1.
YrOrig BEST4.
temp $CHAR1.
qsMatchRefID BEST7.
qsMatchType $CHAR2.
;
INFILE "&basedir.&passdir\&fnname..csv"
LRECL=1000
FIRSTOBS=2
ENCODING="WLATIN1"
DLM='2c'x
MISSOVER
DSD ;
INPUT
persID : ?? BEST7.
sexa : ?? BEST1.

152
mb : ?? BEST7.
au : ?? BEST6.
cob1x : ?? BEST1.
DayA : ?? BEST2.
MonthA : ?? BEST2.
YearA : ?? BEST4.
maoriA : ?? BEST1.
pacifA : ?? BEST1.
asianA : ?? BEST1.
melaaA : ?? BEST1.
nonmpaA : ?? BEST1.
pacfix : ?? BEST1.
asnfix : ?? BEST1.
age : ?? BEST3.
agemtor : ?? BEST1.
BirthCC : ?? BEST4.
COB2X : ?? BEST2.
Resdnt : ?? BEST1.
SexMtor : ?? BEST1.
YrOrig : ?? BEST4.
temp : $CHAR1.
qsMatchRefID : ?? BEST7.
qsMatchType : $CHAR2.
;
RUN;
%mend;
%macro
RdCTRes(libn=P1_7WC,passdir=Pass1_7MB1_3AU1_4,fnname=Ct_ResPass1_7,dsname=Ct_ResPass1_
7,
basedir=\\stats.govt.nz\sas\02bau\SocPopStats\Census\NZCMS_CT2006Linkage\QSDatasets\);
DATA &libn..&dsname;
LENGTH
patid $ 8
sexm 8
mb1 8
mb2 8
mb3 8
mb4 8
mb5 8
auopt01 8
auopt02 8
auopt03 8
auopt04 8
auopt05 8
auopt06 8
auopt07 8
auopt08 8

153
cobm 8
maorim 8
pacifm 8
asianm 8
melaam 8
nonmpam 8
pacfixm 8
asnfixm 8
nummbs 8
numaus 8
numdobs 8
numMgen 8
numFgen 8
numUgen 8
tempm $ 1
qsMatchDataID 8
qsMatchType $ 2
dobdd0 8
dobdd1 8
dobdd2 8
dobdd3 8
dobdd4 8
dobmm0 8
dobmm1 8
dobmm2 8
dobmm3 8
dobmm4 8
dobyy0 8
dobyy1 8
dobyy2 8
dobyy3 8
dobyy4 8 ;
FORMAT
patid $CHAR8.
sexm BEST1.
mb1 BEST7.
mb2 BEST7.
mb3 BEST7.
mb4 BEST7.
mb5 BEST7.
auopt01 BEST6.
auopt02 BEST6.
auopt03 BEST6.
auopt04 BEST6.
auopt05 BEST6.
auopt06 BEST6.
auopt07 BEST6.
auopt08 BEST6.
cobm BEST1.
maorim BEST1.
pacifm BEST1.

154
asianm BEST1.
melaam BEST1.
nonmpam BEST1.
pacfixm BEST1.
asnfixm BEST1.
nummbs BEST1.
numaus BEST2.
numdobs BEST1.
numMgen BEST4.
numFgen BEST4.
numUgen BEST1.
tempm $CHAR1.
qsMatchDataID BEST6.
qsMatchType $CHAR2.
dobdd0 BEST2.
dobdd1 BEST2.
dobdd2 BEST2.
dobdd3 BEST2.
dobdd4 BEST2.
dobmm0 BEST2.
dobmm1 BEST2.
dobmm2 BEST2.
dobmm3 BEST2.
dobmm4 BEST2.
dobyy0 BEST4.
dobyy1 BEST4.
dobyy2 BEST4.
dobyy3 BEST4.
dobyy4 BEST4. ;
INFORMAT
patid $CHAR8.
sexm BEST1.
mb1 BEST7.
mb2 BEST7.
mb3 BEST7.
mb4 BEST7.
mb5 BEST7.
auopt01 BEST6.
auopt02 BEST6.
auopt03 BEST6.
auopt04 BEST6.
auopt05 BEST6.
auopt06 BEST6.
auopt07 BEST6.
auopt08 BEST6.
cobm BEST1.
maorim BEST1.
pacifm BEST1.
asianm BEST1.
melaam BEST1.
nonmpam BEST1.
155
pacfixm BEST1.
asnfixm BEST1.
nummbs BEST1.
numaus BEST2.
numdobs BEST1.
numMgen BEST4.
numFgen BEST4.
numUgen BEST1.
tempm $CHAR1.
qsMatchDataID BEST6.
qsMatchType $CHAR2.
dobdd0 BEST2.
dobdd1 BEST2.
dobdd2 BEST2.
dobdd3 BEST2.
dobdd4 BEST2.
dobmm0 BEST2.
dobmm1 BEST2.
dobmm2 BEST2.
dobmm3 BEST2.
dobmm4 BEST2.
dobyy0 BEST4.
dobyy1 BEST4.
dobyy2 BEST4.
dobyy3 BEST4.
dobyy4 BEST4. ;
INFILE "&basedir.&passdir\&fnname..csv"
LRECL=1000
FIRSTOBS=2
ENCODING="WLATIN1"
DLM='2c'x
MISSOVER
DSD ;
INPUT
patid : $CHAR8.
sexm : ?? BEST1.
mb1 : ?? BEST7.
mb2 : ?? BEST7.
mb3 : ?? BEST7.
mb4 : ?? BEST7.
mb5 : ?? BEST7.
auopt01 : ?? BEST6.
auopt02 : ?? BEST6.
auopt03 : ?? BEST6.
auopt04 : ?? BEST6.
auopt05 : ?? BEST6.
auopt06 : ?? BEST6.
auopt07 : ?? BEST6.
auopt08 : ?? BEST6.
cobm : ?? BEST1.
maorim : ?? BEST1.

156
pacifm : ?? BEST1.
asianm : ?? BEST1.
melaam : ?? BEST1.
nonmpam : ?? BEST1.
pacfixm : ?? BEST1.
asnfixm : ?? BEST1.
nummbs : ?? BEST1.
numaus : ?? BEST2.
numdobs : ?? BEST1.
numMgen : ?? BEST4.
numFgen : ?? BEST4.
numUgen : ?? BEST1.
tempm : $CHAR1.
qsMatchDataID : ?? BEST6.
qsMatchType : $CHAR2.
dobdd0 : ?? BEST2.
dobdd1 : ?? BEST2.
dobdd2 : ?? BEST2.
dobdd3 : ?? BEST2.
dobdd4 : ?? BEST2.
dobmm0 : ?? BEST2.
dobmm1 : ?? BEST2.
dobmm2 : ?? BEST2.
dobmm3 : ?? BEST2.
dobmm4 : ?? BEST2.
dobyy0 : ?? BEST4.
dobyy1 : ?? BEST4.
dobyy2 : ?? BEST4.
dobyy3 : ?? BEST4.
dobyy4 : ?? BEST4. ;
RUN;
%mend;
%macro FindCut(libn=P1MB1NC,passdir=Pass1NoCutoffs,dsname=MatchesPass1,
basedir=\\stats.govt.nz\sas\02bau\SocPopStats\Census\NZCMS_CT2006Linkage\QSDatasets\,
plabel=Pass 1 No Cutoff,lowc=16,upc=20,fmtbase=5.0,fmtsub=5.1,dosub=Y);
%let dosub=%upcase(&dosub);
goptions papersize=a4;
options papersize=a4;
options orientation=portrait;
ods rtf file="&basedir.&passdir\&libn.freqs.rtf";
options orientation=portrait;
TITLE1 "NZCMS/CT 2006/11 : &plabel Distribution of Weights";
proc freq data=&libn..&dsname;
tables qsMatchType qsMatchPassNumber qsMatchLRFlag qsMatchExactFlag
/*qsMatchPattern*/;

157
run;
proc tabulate data=&libn..&dsname;
class qsMatchPassNumber qsMatchPattern;
var qsMatchWeight;
table all qsMatchPassNumber qsmatchpattern,n qsMatchWeight*(min p1 p5 p10 p25 mean
median P75 p90 p95 p99 max)*f=5.2;
run;
ods rtf close;
proc sort data=&libn..&dsname out=&dsname.sorted;
by qsMatchPassNumber descending qsmatchweight qsmatchpattern;
run;
ods graphics on/width=280mm height=200mm;
options orientation=landscape;
ods rtf file="&basedir.&passdir\WeightDist.rtf";
options orientation=landscape;
TITLE1 "NZCMS/CT 2006/11 : &plabel Distribution of Weights";
PROC sgplot DATA=&libn..&dsname;
histogram qsMatchWeight
;
RUN; QUIT;
proc tabulate data=&libn..&dsname;
class qsMatchPassNumber qsmatchpattern qsmatchweight;
format qsmatchweight &fmtbase;
table all qsMatchPassNumber qsmatchpattern,(all qsmatchweight)*n=''*f=6.;
run;
%if "&dosub" eq "Y" %then %do;
proc tabulate data=&libn..&dsname;
where qsmatchweight ge &lowc and qsmatchweight le &upc;
class qsMatchPassNumber qsmatchpattern qsmatchweight;
format qsmatchweight &fmtsub;
table all qsMatchPassNumber qsmatchpattern,(all qsmatchweight)*n=''*f=6.;
run;
PROC sgplot DATA=&libn..&dsname;
where qsmatchweight ge &lowc and qsmatchweight le &upc;
histogram qsMatchWeight
;
RUN; QUIT;
ods rtf close;
data look;
set &dsname.sorted;

158
where qsmatchweight ge &lowc and qsmatchweight le &upc;
run;
%end;
title;
%mend;
%ReadDat(libn=P1MB1NC,passdir=Pass1MB1NoCutoffs,fnname=MatchesPass1,dsname=MatchesPass
1,
basedir=\\stats.govt.nz\sas\02bau\SocPopStats\Census\NZCMS_CT2006Linkage\QSDatasets\);
%FindCut(libn=P1MB1NC,passdir=Pass1MB1NoCutoffs,dsname=MatchesPass1,
basedir=\\stats.govt.nz\sas\02bau\SocPopStats\Census\NZCMS_CT2006Linkage\QSDatasets\,
plabel=Pass 1 No Cutoff,lowc=15,upc=16.9,fmtbase=5.0,fmtsub=5.1);
/*Make cutoff 16.499 for meshblock passes (Later changed to 16 because of QualityStage
issues - doesn't make much difference)*/
%ReadDat(libn=P1_3MBWC,passdir=Pass1_3MB1_3Cut16_5,fnname=MatchesPass1,dsname=MatchesP
ass1);
%FindCut(libn=P1_3MBWC,passdir=Pass1_3MB1_3Cut16_5,dsname=MatchesPass1,
plabel=Passes 1 to 3 MB1-MB3 Cutoff
16.5,lowc=16,upc=20,fmtbase=5.0,fmtsub=5.1,dosub=Y);
%ReadDat(libn=P4AU1NC,passdir=Pass4NoCutoffs,fnname=AUMatchesPass4,dsname=AUMatchesPas
s4);
%FindCut(libn=P4AU1NC,passdir=Pass4NoCutoffs,dsname=AUMatchesPass4,
plabel=Passes 4 AU1 No Cutoff,lowc=14,upc=15.9,fmtbase=5.0,fmtsub=5.1,dosub=Y);
%ReadDat(libn=P1_7WC,passdir=Pass1_7MB1_3AU1_4,fnname=MatchesPass1_7,dsname=MatchesPas
s1_7);
%RdCenRes(libn=P1_7WC,passdir=Pass1_7MB1_3AU1_4,fnname=Cen_ResPass1_7,dsname=Cen_ResPa
ss1_7,
basedir=\\stats.govt.nz\sas\02bau\SocPopStats\Census\NZCMS_CT2006Linkage\QSDatasets\);
%RdCTRes(libn=P1_7WC,passdir=Pass1_7MB1_3AU1_4,fnname=Ct_ResPass1_7,dsname=Ct_ResPass1
_7,
basedir=\\stats.govt.nz\sas\02bau\SocPopStats\Census\NZCMS_CT2006Linkage\QSDatasets\);
data look;
set p1_7wc.ct_respass1_7;
where abs(nummgen-numfgen-numugen) ne sum(nummgen,numfgen,numugen);
run;
proc freq data=p1_7wc.ct_respass1_7;
tables nummbs numaus numdobs;
159
run;
/*Look at possible matches*/
%ReadDat(libn=TryRunNC,passdir=TryRunsNC,fnname=TryMB1,dsname=TryMB1,
basedir=\\stats.govt.nz\sas\02bau\SocPopStats\Census\NZCMS_CT2006Linkage\QSDatasets\);
%ReadDat(libn=TryRunNC,passdir=TryRunsNC,fnname=TryMB2,dsname=TryMB2,
basedir=\\stats.govt.nz\sas\02bau\SocPopStats\Census\NZCMS_CT2006Linkage\QSDatasets\);
%ReadDat(libn=TryRunNC,passdir=TryRunsNC,fnname=TryMB3,dsname=TryMB3,
basedir=\\stats.govt.nz\sas\02bau\SocPopStats\Census\NZCMS_CT2006Linkage\QSDatasets\);
%ReadDat(libn=TryRunNC,passdir=TryRunsNC,fnname=TryMB4,dsname=TryMB4,
basedir=\\stats.govt.nz\sas\02bau\SocPopStats\Census\NZCMS_CT2006Linkage\QSDatasets\);
%ReadDat(libn=TryRunNC,passdir=TryRunsNC,fnname=MatchesTryAU1,dsname=TryAU1nc,
basedir=\\stats.govt.nz\sas\02bau\SocPopStats\Census\NZCMS_CT2006Linkage\QSDatasets\);
%ReadDat(libn=TryRunNC,passdir=TryRunsNC,fnname=MatchesTryAU1wb,dsname=TryAU1wb,
basedir=\\stats.govt.nz\sas\02bau\SocPopStats\Census\NZCMS_CT2006Linkage\QSDatasets\);
%ReadDat(libn=TryRunNC,passdir=TryRunsNC,fnname=MatchesTryAU2wb,dsname=TryAU2wb,
basedir=\\stats.govt.nz\sas\02bau\SocPopStats\Census\NZCMS_CT2006Linkage\QSDatasets\);
%ReadDat(libn=TryRunNC,passdir=TryRunsNC,fnname=MatchesTryAU3wb,dsname=TryAU3wb,
basedir=\\stats.govt.nz\sas\02bau\SocPopStats\Census\NZCMS_CT2006Linkage\QSDatasets\);
%ReadDat(libn=TryRunNC,passdir=TryRunsNC,fnname=MatchesTryAU4wb,dsname=TryAU4wb,
basedir=\\stats.govt.nz\sas\02bau\SocPopStats\Census\NZCMS_CT2006Linkage\QSDatasets\);
%ReadDat(libn=TryRunNC,passdir=TryRunsNC,fnname=MatchesTryAU5wb,dsname=TryAU5wb,
basedir=\\stats.govt.nz\sas\02bau\SocPopStats\Census\NZCMS_CT2006Linkage\QSDatasets\);
%ReadDat(libn=TryRunNC,passdir=TryRunsNC,fnname=MatchesTryAU6wb,dsname=TryAU6wb,
basedir=\\stats.govt.nz\sas\02bau\SocPopStats\Census\NZCMS_CT2006Linkage\QSDatasets\);
%ReadDat(libn=TryRunNC,passdir=TryRunsNC,fnname=MatchesTryAU7wb,dsname=TryAU7wb,
basedir=\\stats.govt.nz\sas\02bau\SocPopStats\Census\NZCMS_CT2006Linkage\QSDatasets\);
%ReadDat(libn=TryRunNC,passdir=TryRunsNC,fnname=MatchesTryAU8wb,dsname=TryAU8wb,
basedir=\\stats.govt.nz\sas\02bau\SocPopStats\Census\NZCMS_CT2006Linkage\QSDatasets\);
TITLE1 "NZCMS/CT 2006/11 : TryMB1 No Cutoff Distribution of Weights";
PROC sgplot DATA=TryRunNC.TryMB1;
histogram qsMatchWeight;
RUN; QUIT;
TITLE1 "NZCMS/CT 2006/11 : TryMB2 No Cutoff Distribution of Weights";
PROC sgplot DATA=TryRunNC.TryMB2;
histogram qsMatchWeight;
RUN; QUIT;
160
TITLE1 "NZCMS/CT 2006/11 : TryMB3 No Cutoff Distribution of Weights";
PROC sgplot DATA=TryRunNC.TryMB3;
histogram qsMatchWeight;
RUN; QUIT;
TITLE1 "NZCMS/CT 2006/11 : TryMB4 No Cutoff Distribution of Weights";
PROC sgplot DATA=TryRunNC.TryMB4;
histogram qsMatchWeight;
RUN; QUIT;
TITLE1 "NZCMS/CT 2006/11 : TryAU1nc No Cutoff Distribution of Weights";
PROC sgplot DATA=TryRunNC.TryAU1nc;
histogram qsMatchWeight;
RUN; QUIT;
TITLE1 "NZCMS/CT 2006/11 : TryAU1wb No Cutoff Distribution of Weights";
PROC sgplot DATA=TryRunNC.TryAU1wb;
histogram qsMatchWeight;
RUN; QUIT;
TITLE1 "NZCMS/CT 2006/11 : TryAU2wb No Cutoff Distribution of Weights";
PROC sgplot DATA=TryRunNC.TryAU2wb;
histogram qsMatchWeight;
RUN; QUIT;
TITLE1 "NZCMS/CT 2006/11 : TryAU3wb No Cutoff Distribution of Weights";
PROC sgplot DATA=TryRunNC.TryAU3wb;
histogram qsMatchWeight;
RUN; QUIT;
TITLE1 "NZCMS/CT 2006/11 : TryAU4wb No Cutoff Distribution of Weights";
PROC sgplot DATA=TryRunNC.TryAU4wb;
histogram qsMatchWeight;
RUN; QUIT;
TITLE1 "NZCMS/CT 2006/11 : TryAU5wb No Cutoff Distribution of Weights";
PROC sgplot DATA=TryRunNC.TryAU5wb;
histogram qsMatchWeight;
RUN; QUIT;
TITLE1 "NZCMS/CT 2006/11 : TryAU6wb No Cutoff Distribution of Weights";
PROC sgplot DATA=TryRunNC.TryAU6wb;
histogram qsMatchWeight;
RUN; QUIT;
TITLE1 "NZCMS/CT 2006/11 : TryAU7wb No Cutoff Distribution of Weights";
PROC sgplot DATA=TryRunNC.TryAU7wb;
histogram qsMatchWeight;
RUN; QUIT;
TITLE1 "NZCMS/CT 2006/11 : TryAU8wb No Cutoff Distribution of Weights";
PROC sgplot DATA=TryRunNC.TryAU8wb;
histogram qsMatchWeight;
RUN; QUIT;
title;
/*For MB passes, blocked on MB
in qsmatchpattern : 1=sex, 2=dob DD, 3=MM, 4=YY, 5=COB, 6=Maori, 7=Pacific, 8=Asian,
9=nonMPA, 10=PacFix, 11=AsianFix, 12=MELAA 13-16 all 0*/
data possibleMBs;

161
set tryrunnc.trymb1(in=a) tryrunnc.trymb2(in=b) tryrunnc.trymb3(in=c)
tryrunnc.trymb4(in=d);
where qsmatchweight ge 13;
format qsmatchpassnumber;
if a then qsMatchpassnumber=11;
else if b then qsMatchpassnumber=12;
else if c then qsMatchpassnumber=13;
else if d then qsMatchpassnumber=14;
keepmatch=.;
if qsmatchweight ge 16 then keepmatch=1;
else if qsmatchweight ge 13 and qsmatchpattern in (3333333331130000,
3333333001130000,3333330301130000,3333303301130000,3333233331130000,
3333233301100000,3333233001230000,3333233001130000,3333230301130000,
3333203301130000,3333033331130000,3332333331130000,3332333331030000,
3323333331130000,3303333331130000,3233333331130000,3033333331130000,
3033333330130000,3033330332130000,3033233331130000,0333333331130000,
0333233331130000,0333033332130000,0333033331230000,0333033331130000,
3033333331030000,3033333331100000,3233233331130000,3303333330130000,
3303333331030000,3323033331130000,3323233331130000,
0333333330130000,0333333331030000,3333033331100000)
then keepmatch=1;
else keepmatch=0;
run;
options orientation=landscape;
ods rtf file="PossibleMBs.rtf";
options orientation=landscape;
TITLE1 "NZCMS/CT 2006/11 : Possible MB passes Distribution of Weights";
proc tabulate data=possibleMBs;
class qsMatchPassNumber qsmatchpattern qsmatchweight keepmatch;
format qsmatchweight 5.1;
table keepmatch,all qsMatchPassNumber qsmatchpattern,(all qsmatchweight)*n=''*f=6.;
run;
ods rtf close;
data tryrunnc.KeepMBmatches(drop=keepmatch);
set possiblembs;
where keepmatch eq 1;
run;
/*Look at difference between AU1 with sex block and without sex block*/
data matchau1options(keep=persid patid sexa sexm numfgen numugen qsmatchweight
qsmatchpattern source);
set tryrunnc.tryau1nc(in=a) tryrunnc.tryau1wb(in=b);
if a then source=1; else if b then source=2;
run;
proc sort data=matchau1options;

162
by persid patid source qsmatchpattern;
run;
data matchau1pairs(drop=qsmatchweight qsmatchpattern source);
set matchau1options;
by persid patid source;
retain ncweight ncmatchpattern wbweight wbmatchpattern status;
length ncmatchpattern wbmatchpattern $16;
if first.patid then do;
ncweight=.; ncmatchpattern=''; wbweight=.; wbmatchpattern=''; status=0;
end;
if source eq 1 then do;
ncweight=qsmatchweight; ncmatchpattern=qsmatchpattern;status+10;
end;
else if source eq 2 then do;
wbweight=qsmatchweight; wbmatchpattern=qsmatchpattern;status+1;
end;
if last.patid then output;
run;
proc freq data=matchau1pairs;
table status;
run;
data diffaupair sameaupair;
set matchau1pairs;
diffweight=ncweight-wbweight;
if status in (1,10) then output diffaupair;
else if status eq 11 then output sameaupair;
run;
proc summary data=diffaupair(keep=persid patid ncweight wbweight) chartype;
class persid patid;
types persid patid;
var ncweight wbweight;
output out=checkfreq min=minncwgt minwbwgt max=maxncwgt maxwbwgt;
run;
data multpairs;
set checkfreq;
where _freq_ gt 1;
run;
/*Above shows that for most one of the duplicates has a much lower weight than the
other*/
/*suggest look at possible pairs separately for AU1nc, and au1wb-au8wb and then look
to see
if there are duplicates*/
/*For AU passes, blocked on AU but not sex
weight is 1.01 higher for males and 0.94 higher for females

163
in qsmatchpattern : 1=sex, 2=dob DD, 3=MM, 4=YY, 5=COB, 6=Maori, 7=Pacific, 8=Asian,
9=nonMPA, 10=PacFix, 11=AsianFix, 12=MELAA 13-16 all 0*/
data possibleAUsNC;
set tryrunnc.tryau1nc(in=a);
where qsmatchweight ge 13;
format qsmatchpassnumber;
qsMatchpassnumber=30;
keepmatch=.;
if qsmatchweight ge 16 then keepmatch=1;
else if qsmatchweight ge 13 and qsmatchpattern in (3333333331130000,
3333333001130000,3333330301130000,3333303301130000,3333233331130000,
3333233301100000,3333233001230000,3333233001130000,3333230301130000,
3333203301130000,3333033331130000,3332333331130000,3332333331030000,
3323333331130000,3303333331130000,3233333331130000,3033333331130000,
3033333330130000,3033330332130000,3033233331130000,0333333331130000,
0333233331130000,0333033332130000,0333033331230000,0333033331130000,
3033333331030000,3033333331100000,3233233331130000,3303333330130000,
3303333331030000,3323033331130000,3323233331130000,
0333333330130000,0333333331030000,3333033331100000)
then keepmatch=1;
else keepmatch=0;
run;
options orientation=landscape;
ods rtf file="PossibleAUsnc.rtf";
options orientation=landscape;
TITLE1 "NZCMS/CT 2006/11 : Possible AU (no sex block) passes Distribution of
Weights";
proc tabulate data=possibleAUsNC;
class qsMatchPassNumber qsmatchpattern qsmatchweight keepmatch;
format qsmatchweight 5.1;
table keepmatch,all qsMatchPassNumber qsmatchpattern,(all qsmatchweight)*n=''*f=6.;
run;
ods rtf close;
data tryrunnc.KeepAUncmatches(drop=keepmatch);
set possibleAUsNC;
where keepmatch eq 1;
run;
/*For AU passes, blocked on AU and on sex
in qsmatchpattern : 1=dob DD, 2=MM, 3=YY, 4=COB, 5=Maori, 6=Pacific, 7=Asian,
8=nonMPA, 9=PacFix, 10=AsianFix, 11=MELAA 12-16 all 0*/
data possibleAUsWB;
set tryrunnc.tryau1wb(in=a) tryrunnc.tryau2wb(in=b) tryrunnc.tryau3wb(in=c)
tryrunnc.tryau4wb(in=d) tryrunnc.tryau5wb(in=e) tryrunnc.tryau6wb(in=f)
tryrunnc.tryau7wb(in=g) tryrunnc.tryau8wb(in=h);
where qsmatchweight ge 12;
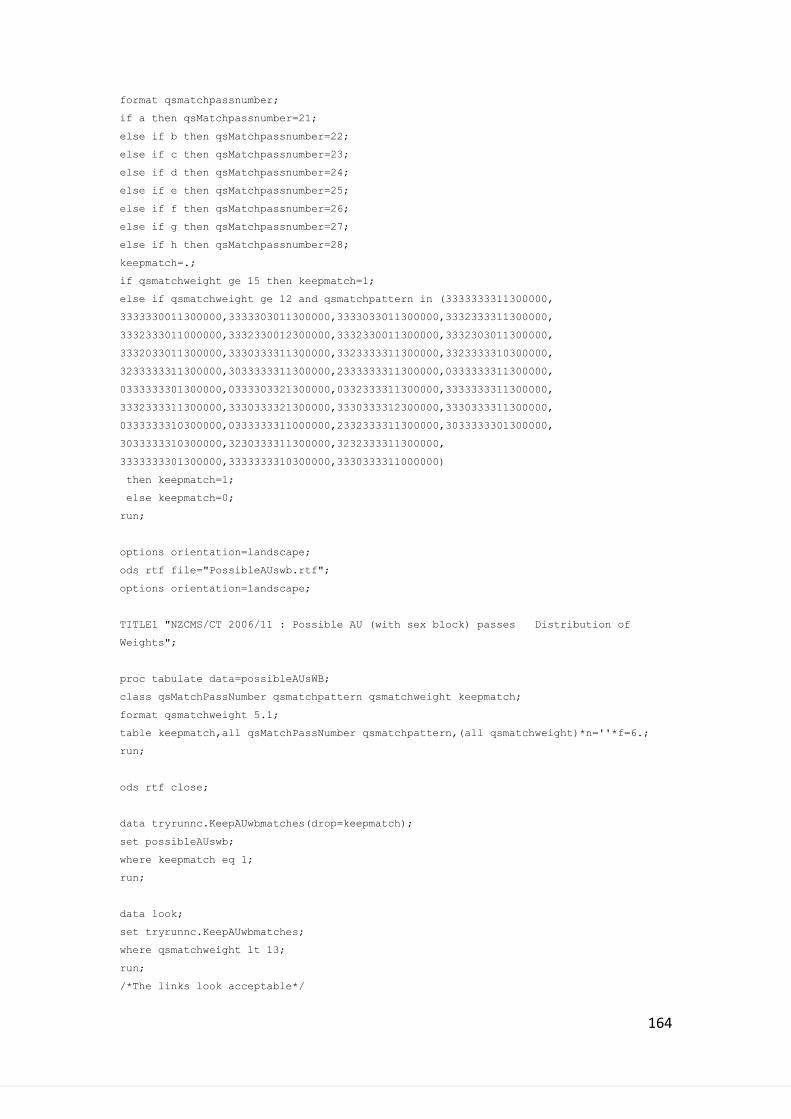
164
format qsmatchpassnumber;
if a then qsMatchpassnumber=21;
else if b then qsMatchpassnumber=22;
else if c then qsMatchpassnumber=23;
else if d then qsMatchpassnumber=24;
else if e then qsMatchpassnumber=25;
else if f then qsMatchpassnumber=26;
else if g then qsMatchpassnumber=27;
else if h then qsMatchpassnumber=28;
keepmatch=.;
if qsmatchweight ge 15 then keepmatch=1;
else if qsmatchweight ge 12 and qsmatchpattern in (3333333311300000,
3333330011300000,3333303011300000,3333033011300000,3332333311300000,
3332333011000000,3332330012300000,3332330011300000,3332303011300000,
3332033011300000,3330333311300000,3323333311300000,3323333310300000,
3233333311300000,3033333311300000,2333333311300000,0333333311300000,
0333333301300000,0333303321300000,0332333311300000,3333333311300000,
3332333311300000,3330333321300000,3330333312300000,3330333311300000,
0333333310300000,0333333311000000,2332333311300000,3033333301300000,
3033333310300000,3230333311300000,3232333311300000,
3333333301300000,3333333310300000,3330333311000000)
then keepmatch=1;
else keepmatch=0;
run;
options orientation=landscape;
ods rtf file="PossibleAUswb.rtf";
options orientation=landscape;
TITLE1 "NZCMS/CT 2006/11 : Possible AU (with sex block) passes Distribution of
Weights";
proc tabulate data=possibleAUsWB;
class qsMatchPassNumber qsmatchpattern qsmatchweight keepmatch;
format qsmatchweight 5.1;
table keepmatch,all qsMatchPassNumber qsmatchpattern,(all qsmatchweight)*n=''*f=6.;
run;
ods rtf close;
data tryrunnc.KeepAUwbmatches(drop=keepmatch);
set possibleAUswb;
where keepmatch eq 1;
run;
data look;
set tryrunnc.KeepAUwbmatches;
where qsmatchweight lt 13;
run;
/*The links look acceptable*/
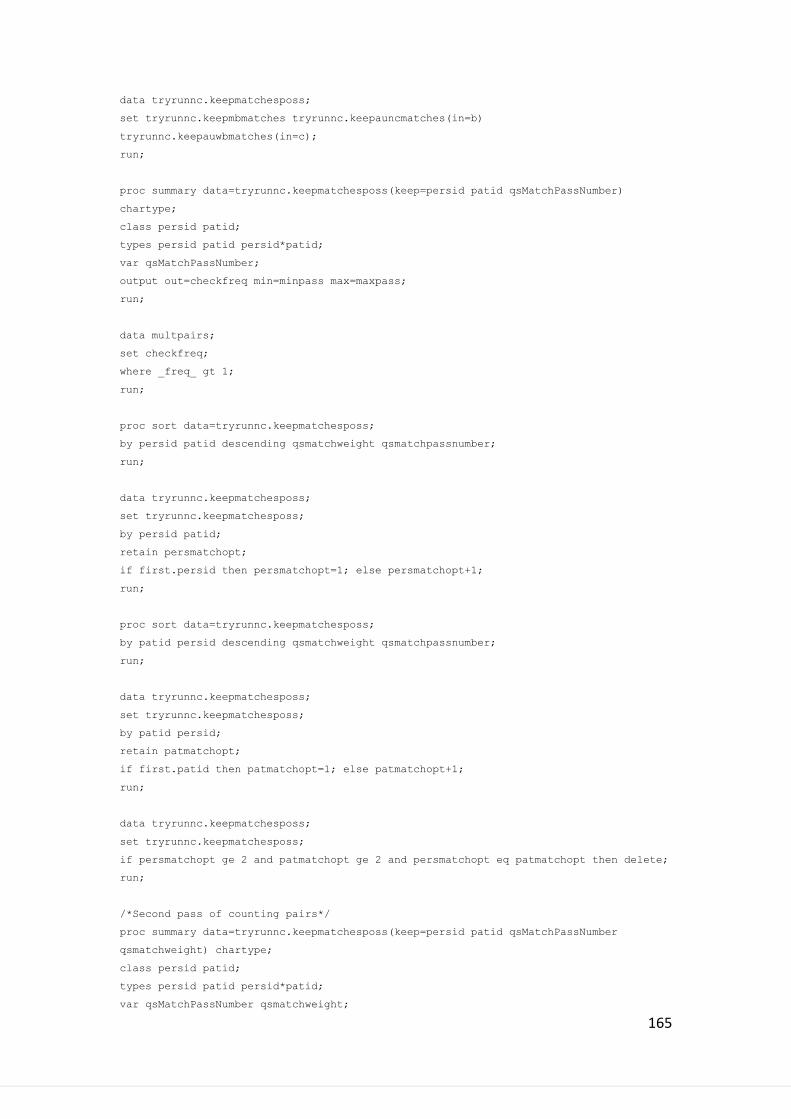
165
data tryrunnc.keepmatchesposs;
set tryrunnc.keepmbmatches tryrunnc.keepauncmatches(in=b)
tryrunnc.keepauwbmatches(in=c);
run;
proc summary data=tryrunnc.keepmatchesposs(keep=persid patid qsMatchPassNumber)
chartype;
class persid patid;
types persid patid persid*patid;
var qsMatchPassNumber;
output out=checkfreq min=minpass max=maxpass;
run;
data multpairs;
set checkfreq;
where _freq_ gt 1;
run;
proc sort data=tryrunnc.keepmatchesposs;
by persid patid descending qsmatchweight qsmatchpassnumber;
run;
data tryrunnc.keepmatchesposs;
set tryrunnc.keepmatchesposs;
by persid patid;
retain persmatchopt;
if first.persid then persmatchopt=1; else persmatchopt+1;
run;
proc sort data=tryrunnc.keepmatchesposs;
by patid persid descending qsmatchweight qsmatchpassnumber;
run;
data tryrunnc.keepmatchesposs;
set tryrunnc.keepmatchesposs;
by patid persid;
retain patmatchopt;
if first.patid then patmatchopt=1; else patmatchopt+1;
run;
data tryrunnc.keepmatchesposs;
set tryrunnc.keepmatchesposs;
if persmatchopt ge 2 and patmatchopt ge 2 and persmatchopt eq patmatchopt then delete;
run;
/*Second pass of counting pairs*/
proc summary data=tryrunnc.keepmatchesposs(keep=persid patid qsMatchPassNumber
qsmatchweight) chartype;
class persid patid;
types persid patid persid*patid;
var qsMatchPassNumber qsmatchweight;

166
output out=checkfreq min=minpass minwgt max=maxpass maxwgt;
run;
data multpairs;
set checkfreq;
where _freq_ gt 1;
run;
proc sort data=tryrunnc.keepmatchesposs;
by persid patid descending qsmatchweight qsmatchpassnumber;
run;
data tryrunnc.keepmatchesposs;
set tryrunnc.keepmatchesposs(drop=persmatchopt patmatchopt);
by persid patid;
retain persmatchopt;
if first.persid then persmatchopt=1; else persmatchopt+1;
run;
proc sort data=tryrunnc.keepmatchesposs;
by patid persid descending qsmatchweight qsmatchpassnumber;
run;
data tryrunnc.keepmatchesposs;
set tryrunnc.keepmatchesposs;
by patid persid;
retain patmatchopt;
if first.patid then patmatchopt=1; else patmatchopt+1;
run;
data tryrunnc.keepmatchesposs;
set tryrunnc.keepmatchesposs;
if persmatchopt ge 2 and patmatchopt ge 2 and persmatchopt eq patmatchopt then delete;
run;
proc summary data=tryrunnc.keepmatchesposs chartype nway;
class persid;
var qsmatchweight;
output out=totpersids(rename=(_freq_=NumPersId) drop=_type_) min=minperswgt
max=maxperswgt;
run;
proc summary data=tryrunnc.keepmatchesposs chartype nway;
class patid;
var qsmatchweight;
output out=totpatids(rename=(_freq_=NumPatid) drop=_type_) min=minpatwgt
max=maxpatwgt;
run;
proc sort data=tryrunnc.keepmatchesposs;
by persid;
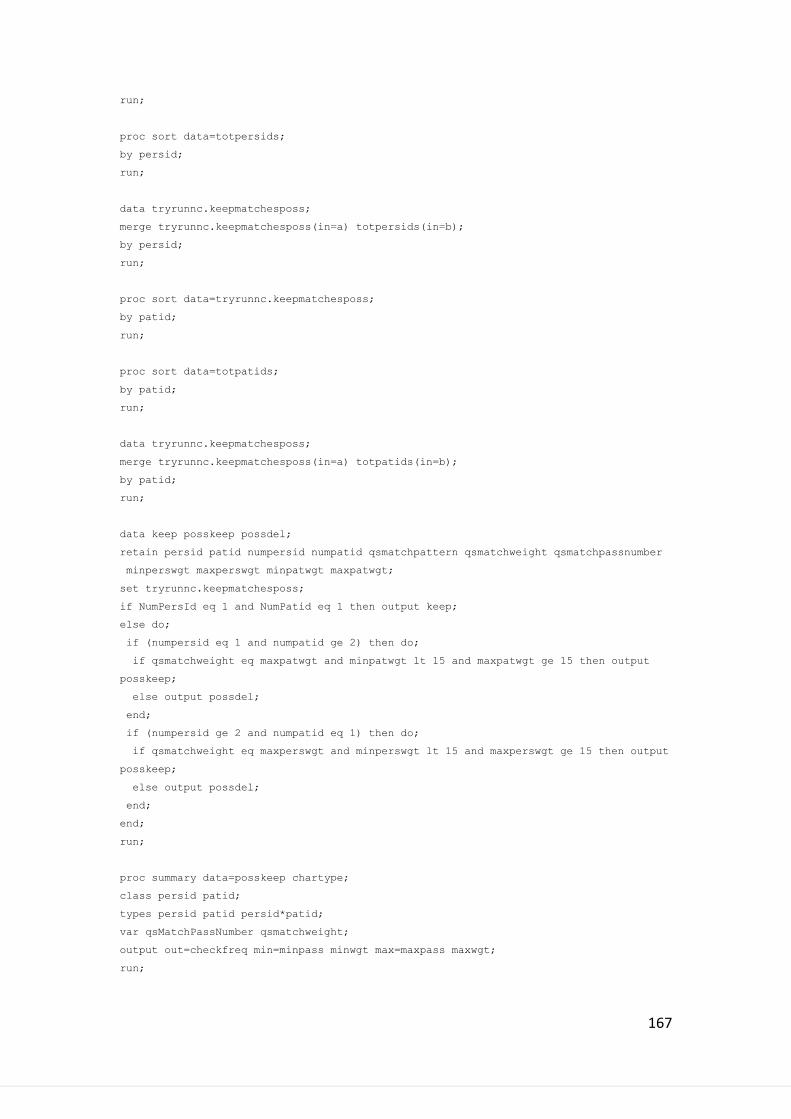
167
run;
proc sort data=totpersids;
by persid;
run;
data tryrunnc.keepmatchesposs;
merge tryrunnc.keepmatchesposs(in=a) totpersids(in=b);
by persid;
run;
proc sort data=tryrunnc.keepmatchesposs;
by patid;
run;
proc sort data=totpatids;
by patid;
run;
data tryrunnc.keepmatchesposs;
merge tryrunnc.keepmatchesposs(in=a) totpatids(in=b);
by patid;
run;
data keep posskeep possdel;
retain persid patid numpersid numpatid qsmatchpattern qsmatchweight qsmatchpassnumber
minperswgt maxperswgt minpatwgt maxpatwgt;
set tryrunnc.keepmatchesposs;
if NumPersId eq 1 and NumPatid eq 1 then output keep;
else do;
if (numpersid eq 1 and numpatid ge 2) then do;
if qsmatchweight eq maxpatwgt and minpatwgt lt 15 and maxpatwgt ge 15 then output
posskeep;
else output possdel;
end;
if (numpersid ge 2 and numpatid eq 1) then do;
if qsmatchweight eq maxperswgt and minperswgt lt 15 and maxperswgt ge 15 then output
posskeep;
else output possdel;
end;
end;
run;
proc summary data=posskeep chartype;
class persid patid;
types persid patid persid*patid;
var qsMatchPassNumber qsmatchweight;
output out=checkfreq min=minpass minwgt max=maxpass maxwgt;
run;

168
data tryrunnc.keepTryMatches(drop=numpersid numpatid minperswgt maxperswgt minpatwgt
maxpatwgt);
set keep posskeep;
run;
data finlinks.finallinksCT2006;
set P1_7WC.MatchesPass1_7 tryrunnc.keepTryMatches;
format qsmatchpassnumber 3.;
run;
options orientation=landscape;
ods rtf file="NZCMSCT2006LinkStats.rtf";
options orientation=landscape;
TITLE1 "NZCMS/CT 2006/11 : Linkage Details Distribution of Weights";
proc tabulate data=finlinks.finallinksCT2006;
class qsMatchPassNumber qsmatchpattern;
var qsMatchWeight;
table all qsMatchPassNumber,n*f=comma9. qsMatchWeight*(min p1 p5 p10 p25 mean median
P75 p90 p95 p99 max)*f=5.2;
table all qsmatchpattern,(all qsMatchPassNumber)*n=''*f=7.;
run;
proc tabulate data=finlinks.finallinksCT2006;
class qsMatchPassNumber qsmatchpattern qsmatchweight;
format qsmatchweight 5.0;
table all qsMatchPassNumber qsmatchpattern,(all qsmatchweight)*n=''*f=6.;
run;
ods rtf close;

169
Appendix D
Match Specification Description
WPRDQS02:lcf_study Project:
NZCMS MB Passes 1-3 Match Specification Report Name:
16:45:08 2014-05-23 Report Generated:
UTC +12:00 Time Zone:
null null User:
NZCMS_MBPasses1_3 Match Specification:
Introduction
The Match Specification Description presents the contents of a match specification that was created in the Match Designer. This report also describes all the active match passes (passes that are not in the holding area) that are contained in the match specification. For more information about match specifications, match passes, and other information related to defining and testing match criteria, refer to the IBM InfoSphere QualityStage User Guide.
The following terms are referenced throughout this report and are defined as follows:
Blocking Columns
Subsets of columns that you define as a block because they have a certain data value within the columns that is the same. Each match pass then searches for matching records in your data source or between data sources but only within the specified block of columns. This restriction is pivotal to the success of your match because it allows for efficient and manageable processing.
Comparison Type
Provides different ways to match values. Comparison types provide a means to score records by using various criteria that contribute to the determination of a match.
NUMERIC
Performs an algebraic comparison of two numbers. Leading spaces are converted to zeros and the numbers are then compared.
Cutoffs
Match Cutoff
The composite weight at or above which a pair of values is considered a match. In other words, any record pair that receives a composite weight that is greater than or equal to this cutoff is considered a match.
Clerical Cutoff
The composite weight at or above which a pair of values is marked for clerical review. In other words, any record pair that receives a composite weight that is lower than this cutoff is considered a non-match, while a record pair that receives a composite weight that is greater than or equal to this cutoff but less than the match cutoff is considered for clerical review. Records marked for clerical review fall between the clerical and match cutoffs.
Duplicate Cutoff
For a reference match only, the weight at or above which a pair of values is considered a duplicate. In other words, any record pair that receives a composite weight that is greater than or equal to this cutoff is considered a duplicate. The duplicate cutoff must be greater than the match cutoff.
Default Handling for Missing Weights
Sets the default score for a column when one or both values are missing in a comparison.
IBM, the IBM logo, and IBM InfoSphere Information Server are trademarks of International Business Machines Corporation in the United States, other countries or both. IBM InfoSphere Information Server 1 / 8

170
Match Specification Description
Introduction
Match Command
The set of parameters within a match pass that define the type of matching that occurs and the adjustments that are applied to the results. A match pass can contain multiple match commands.
Match Pass
A named collection of matching criteria that are applied during a single pass through the match specification input data. A match specification can contain multiple match passes.
Match Type
Reference Match
A match that has two input sources: a data source and a reference source. The match type defines the way that the reference match uses the input sources.
One-to-one
Matches only one data source record to one reference source record. In other words, each reference source record can match only one data source record.
Reverse
A match option that assigns the agreement weight when the columns disagree and the disagreement weight when the columns agree.
Vector
A matching option that you must select when the column values that you want to match consist of one-dimensional data arrays (vectors).
Default Handling for Missing Weights
Match Specification
Maximum Frequency Match Type Name
Zero (default) NZCMS_MBPasses1_3 0 Reference One-to-one
Match Pass #1
Match Cutoff Reference Overflow
Data Overflow Duplicate Cutoff Clerical Cutoff Name
NZCMS_MBPass1 10000 10000 - 16 16
Block Name
Blocking Columns
Reference Column Name Data Column Name Comparison Type
mb mb1 NUMERIC mb1 And mb
Match Commands
Comparison Type Reference Column Name Command Name Data Column Name
sexa sexm NUMERIC sexm And sexa
m-prob u-prob Vector Reverse Parameter(s)/Mode
0.99 0.5 No No -
Comparison Type Reference Column Name Command Name Data Column Name
- dobdd, DayA NUMERIC dobdd And DayA
IBM, the IBM logo, and IBM InfoSphere Information Server are trademarks of International Business Machines Corporation in the United States, other countries or both.
IBM InfoSphere Information Server 2 / 8

171
Match Specification Description
m-prob u-prob Vector Reverse Parameter(s)/Mode
0.97 0.033 Yes No -
Comparison Type Reference Column Name Command Name Data Column Name
- dobmm, MonthA NUMERIC dobmm And MonthA
m-prob u-prob Vector Reverse Parameter(s)/Mode
0.98 0.083 Yes No -
Comparison Type Reference Column Name Command Name Data Column Name
- dobyy, YearA NUMERIC dobyy And YearA
m-prob u-prob Vector Reverse Parameter(s)/Mode
0.99 0.013 Yes No -
Comparison Type Reference Column Name Command Name Data Column Name
cob1x cobm NUMERIC cobm And cob1x
m-prob u-prob Vector Reverse Parameter(s)/Mode
0.85 0.4 No No -
Comparison Type Reference Column Name Command Name Data Column Name
maoriA maorim NUMERIC maorim And maoriA
m-prob u-prob Vector Reverse Parameter(s)/Mode
0.8 0.5 No No -
Comparison Type Reference Column Name Command Name Data Column Name
pacifA pacifm NUMERIC pacifm And pacifA
m-prob u-prob Vector Reverse Parameter(s)/Mode
0.8 0.5 No No -
Comparison Type Reference Column Name Command Name Data Column Name
asianA asianm NUMERIC asianm And asianA
m-prob u-prob Vector Reverse Parameter(s)/Mode
0.8 0.5 No No -
Comparison Type Reference Column Name Command Name Data Column Name
nonmpaA nonmpam NUMERIC nonmpam And nonmpaA
m-prob u-prob Vector Reverse Parameter(s)/Mode
0.8 0.5 No No -
Comparison Type Reference Column Name Command Name Data Column Name
pacfix pacfixm NUMERIC pacfixm And pacfix
m-prob u-prob Vector Reverse Parameter(s)/Mode
0.92 0.033 No No -
Comparison Type Reference Column Name Command Name Data Column Name
asnfix asnfixm NUMERIC asnfixm And asnfix
m-prob u-prob Vector Reverse Parameter(s)/Mode
0.92 0.033 No No -
Comparison Type Reference Column Name Command Name Data Column Name
melaaA melaam NUMERIC melaam And melaaA
m-prob u-prob Vector Reverse Parameter(s)/Mode
IBM, the IBM logo, and IBM InfoSphere Information Server are trademarks of International Business Machines Corporation in the United States, other countries or both.
IBM InfoSphere Information Server 3 / 8

172
Match Specification Description
0.8 0.5 No No -
Match Pass #2
Match Cutoff Reference Overflow
Data Overflow Duplicate Cutoff Clerical Cutoff Name
NZCMS_MBPass2 10000 10000 - 16 16
Block Name
Blocking Columns
Reference Column Name Data Column Name Comparison Type
mb mb2 NUMERIC mb2 And mb
Match Commands
Comparison Type Reference Column Name Command Name Data Column Name
sexa sexm NUMERIC sexm And sexa
m-prob u-prob Vector Reverse Parameter(s)/Mode
0.99 0.5 No No -
Comparison Type Reference Column Name Command Name Data Column Name
- dobdd, DayA NUMERIC dobdd And DayA
m-prob u-prob Vector Reverse Parameter(s)/Mode
0.97 0.033 Yes No -
Comparison Type Reference Column Name Command Name Data Column Name
- dobmm, MonthA NUMERIC dobmm And MonthA
m-prob u-prob Vector Reverse Parameter(s)/Mode
0.98 0.083 Yes No -
Comparison Type Reference Column Name Command Name Data Column Name
- dobyy, YearA NUMERIC dobyy And YearA
m-prob u-prob Vector Reverse Parameter(s)/Mode
0.99 0.013 Yes No -
Comparison Type Reference Column Name Command Name Data Column Name
cob1x cobm NUMERIC cobm And cob1x
m-prob u-prob Vector Reverse Parameter(s)/Mode
0.85 0.4 No No -
Comparison Type Reference Column Name Command Name Data Column Name
maoriA maorim NUMERIC maorim And maoriA
m-prob u-prob Vector Reverse Parameter(s)/Mode
0.8 0.5 No No -
Comparison Type Reference Column Name Command Name Data Column Name
pacifA pacifm NUMERIC pacifm And pacifA
m-prob u-prob Vector Reverse Parameter(s)/Mode
0.8 0.5 No No -
Comparison Type Reference Column Name Command Name Data Column Name
asianA asianm NUMERIC asianm And asianA
m-prob u-prob Vector Reverse Parameter(s)/Mode
IBM, the IBM logo, and IBM InfoSphere Information Server are trademarks of International Business Machines Corporation in the United States, other countries or both.
IBM InfoSphere Information Server 4 / 8

173
Match Specification Description
0.8 0.5 No No -
Comparison Type Reference Column Name Command Name Data Column Name
nonmpaA nonmpam NUMERIC nonmpam And nonmpaA
m-prob u-prob Vector Reverse Parameter(s)/Mode
0.8 0.5 No No -
Comparison Type Reference Column Name Command Name Data Column Name
pacfix pacfixm NUMERIC pacfixm And pacfix
m-prob u-prob Vector Reverse Parameter(s)/Mode
0.92 0.033 No No -
Comparison Type Reference Column Name Command Name Data Column Name
asnfix asnfixm NUMERIC asnfixm And asnfix
m-prob u-prob Vector Reverse Parameter(s)/Mode
0.92 0.033 No No -
Comparison Type Reference Column Name Command Name Data Column Name
melaaA melaam NUMERIC melaam And melaaA
m-prob u-prob Vector Reverse Parameter(s)/Mode
0.8 0.5 No No -
Match Pass #3
Match Cutoff Reference Overflow
Data Overflow Duplicate Cutoff Clerical Cutoff Name
NZCMS_MBPass3 10000 10000 - 16 16
Block Name
Blocking Columns
Reference Column Name Data Column Name Comparison Type
mb mb3 NUMERIC mb3 And mb
Match Commands
Comparison Type Reference Column Name Command Name Data Column Name
sexa sexm NUMERIC sexm And sexa
m-prob u-prob Vector Reverse Parameter(s)/Mode
0.99 0.5 No No -
Comparison Type Reference Column Name Command Name Data Column Name
- dobdd, DayA NUMERIC dobdd And DayA
m-prob u-prob Vector Reverse Parameter(s)/Mode
0.97 0.033 Yes No -
Comparison Type Reference Column Name Command Name Data Column Name
- dobmm, MonthA NUMERIC dobmm And MonthA
m-prob u-prob Vector Reverse Parameter(s)/Mode
0.98 0.083 Yes No -
Comparison Type Reference Column Name Command Name Data Column Name
- dobyy, YearA NUMERIC dobyy And YearA
m-prob u-prob Vector Reverse Parameter(s)/Mode
IBM, the IBM logo, and IBM InfoSphere Information Server are trademarks of International Business Machines Corporation in the United States, other countries or both.
IBM InfoSphere Information Server 5 / 8

174
Match Specification Description
0.99 0.013 Yes No -
Comparison Type Reference Column Name Command Name Data Column Name
cob1x cobm NUMERIC cobm And cob1x
m-prob u-prob Vector Reverse Parameter(s)/Mode
0.85 0.4 No No -
Comparison Type Reference Column Name Command Name Data Column Name
maoriA maorim NUMERIC maorim And maoriA
m-prob u-prob Vector Reverse Parameter(s)/Mode
0.8 0.5 No No -
Comparison Type Reference Column Name Command Name Data Column Name
pacifA pacifm NUMERIC pacifm And pacifA
m-prob u-prob Vector Reverse Parameter(s)/Mode
0.8 0.5 No No -
Comparison Type Reference Column Name Command Name Data Column Name
asianA asianm NUMERIC asianm And asianA
m-prob u-prob Vector Reverse Parameter(s)/Mode
0.8 0.5 No No -
Comparison Type Reference Column Name Command Name Data Column Name
nonmpaA nonmpam NUMERIC nonmpam And nonmpaA
m-prob u-prob Vector Reverse Parameter(s)/Mode
0.8 0.5 No No -
Comparison Type Reference Column Name Command Name Data Column Name
pacfix pacfixm NUMERIC pacfixm And pacfix
m-prob u-prob Vector Reverse Parameter(s)/Mode
0.92 0.033 No No -
Comparison Type Reference Column Name Command Name Data Column Name
asnfix asnfixm NUMERIC asnfixm And asnfix
m-prob u-prob Vector Reverse Parameter(s)/Mode
0.92 0.033 No No -
Comparison Type Reference Column Name Command Name Data Column Name
melaaA melaam NUMERIC melaam And melaaA
m-prob u-prob Vector Reverse Parameter(s)/Mode
0.8 0.5 No No -
Data Table Definition: CTLinkafterDDMMYY
Used in Pass #n Commands
Used in Pass #n Blocks
SQL Type Nullable Description Length Column Name
- - Yes - 8 VarChar patid
1 - Yes - 10 Integer sexm
- 1 Yes - 10 Integer mb1
- 2 Yes - 10 Integer mb2
IBM, the IBM logo, and IBM InfoSphere Information Server are trademarks of International Business Machines Corporation in the United States, other countries or both.
IBM InfoSphere Information Server 6 / 8
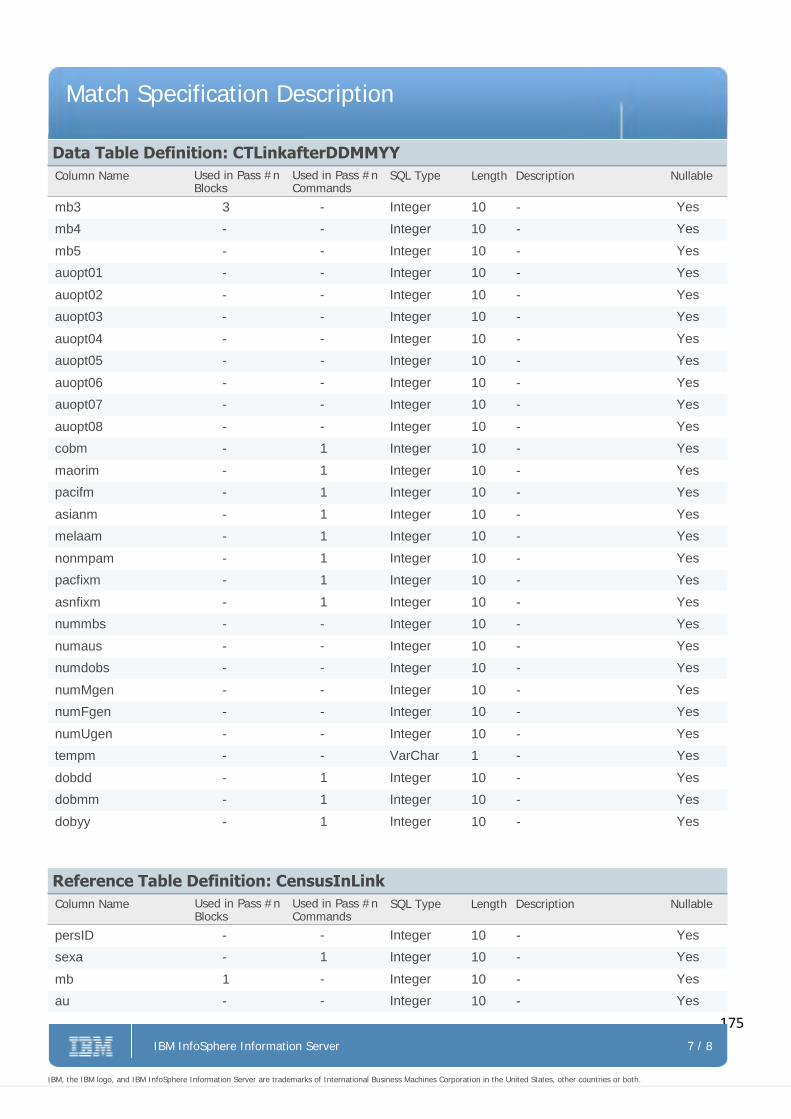
175
Match Specification Description
Data Table Definition: CTLinkafterDDMMYY
Used in Pass #n Commands
Used in Pass #n Blocks
SQL Type Nullable Description Length Column Name
- 3 Yes - 10 Integer mb3
- - Yes - 10 Integer mb4
- - Yes - 10 Integer mb5
- - Yes - 10 Integer auopt01
- - Yes - 10 Integer auopt02
- - Yes - 10 Integer auopt03
- - Yes - 10 Integer auopt04
- - Yes - 10 Integer auopt05
- - Yes - 10 Integer auopt06
- - Yes - 10 Integer auopt07
- - Yes - 10 Integer auopt08
1 - Yes - 10 Integer cobm
1 - Yes - 10 Integer maorim
1 - Yes - 10 Integer pacifm
1 - Yes - 10 Integer asianm
1 - Yes - 10 Integer melaam
1 - Yes - 10 Integer nonmpam
1 - Yes - 10 Integer pacfixm
1 - Yes - 10 Integer asnfixm
- - Yes - 10 Integer nummbs
- - Yes - 10 Integer numaus
- - Yes - 10 Integer numdobs
- - Yes - 10 Integer numMgen
- - Yes - 10 Integer numFgen
- - Yes - 10 Integer numUgen
- - Yes - 1 VarChar tempm
1 - Yes - 10 Integer dobdd
1 - Yes - 10 Integer dobmm
1 - Yes - 10 Integer dobyy
Reference Table Definition: CensusInLink
Used in Pass #n Commands
Used in Pass #n Blocks
SQL Type Nullable Description Length Column Name
- - Yes - 10 Integer persID
1 - Yes - 10 Integer sexa
- 1 Yes - 10 Integer mb
- - Yes - 10 Integer au
IBM, the IBM logo, and IBM InfoSphere Information Server are trademarks of International Business Machines Corporation in the United States, other countries or both.
IBM InfoSphere Information Server 7 / 8
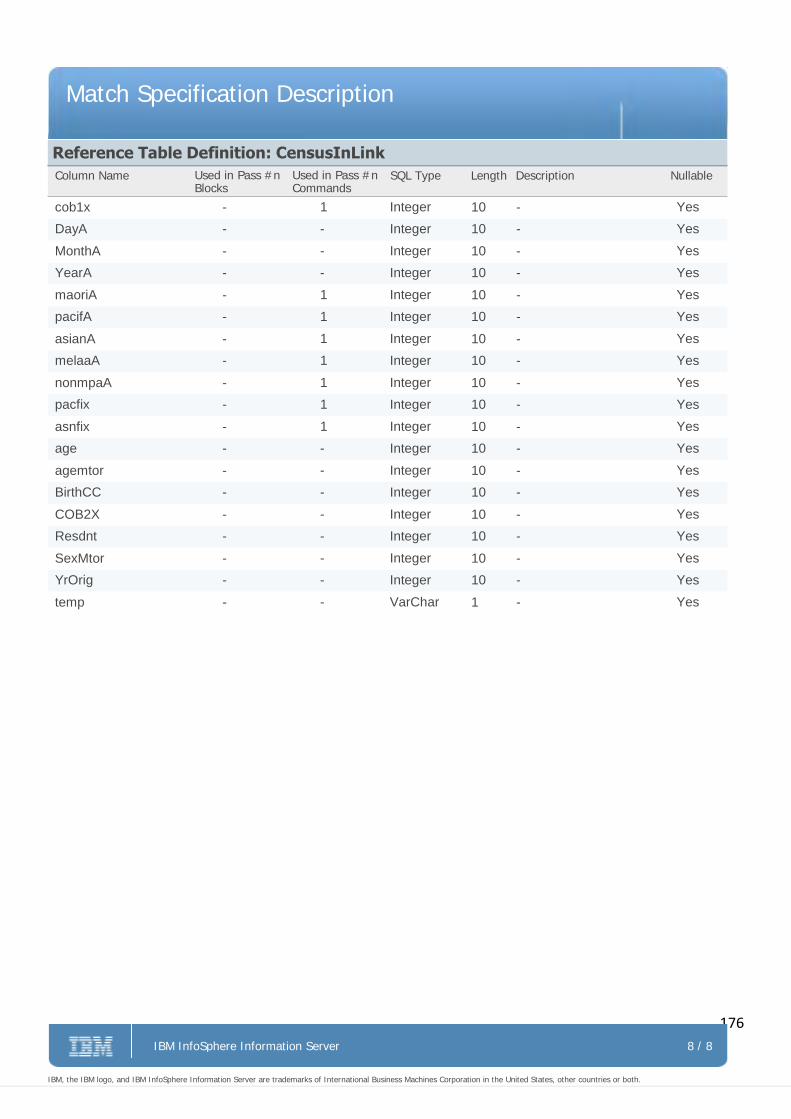
176
Match Specification Description
Reference Table Definition: CensusInLink
Used in Pass #n Commands
Used in Pass #n Blocks
SQL Type Nullable Description Length Column Name
1 - Yes - 10 Integer cob1x
- - Yes - 10 Integer DayA
- - Yes - 10 Integer MonthA
- - Yes - 10 Integer YearA
1 - Yes - 10 Integer maoriA
1 - Yes - 10 Integer pacifA
1 - Yes - 10 Integer asianA
1 - Yes - 10 Integer melaaA
1 - Yes - 10 Integer nonmpaA
1 - Yes - 10 Integer pacfix
1 - Yes - 10 Integer asnfix
- - Yes - 10 Integer age
- - Yes - 10 Integer agemtor
- - Yes - 10 Integer BirthCC
- - Yes - 10 Integer COB2X
- - Yes - 10 Integer Resdnt
- - Yes - 10 Integer SexMtor
- - Yes - 10 Integer YrOrig
- - Yes - 1 VarChar temp
IBM, the IBM logo, and IBM InfoSphere Information Server are trademarks of International Business Machines Corporation in the United States, other countries or both.
IBM InfoSphere Information Server 8 / 8