Reclaim PVD: Mapping Abandoned & Vacated Properties In Providence, RI
24
Reclaim PVD: Mapping Abandoned & Vacated Properties in Providence, RI By Jonathan Lax, RWU Graduate, Community Development program Presentation for Rhode Island Housing June 25, 2015
-
Upload
jlax315 -
Category
Data & Analytics
-
view
23 -
download
2
Transcript of Reclaim PVD: Mapping Abandoned & Vacated Properties In Providence, RI

Reclaim PVD: Mapping Abandoned & Vacated Properties in Providence, RI By Jonathan Lax, RWU Graduate, Community Development program
Presentation for Rhode Island Housing
June 25, 2015

In the Beginning: PVD HOLC Map 1935source: LaDale Winling www.orbanoasis.org
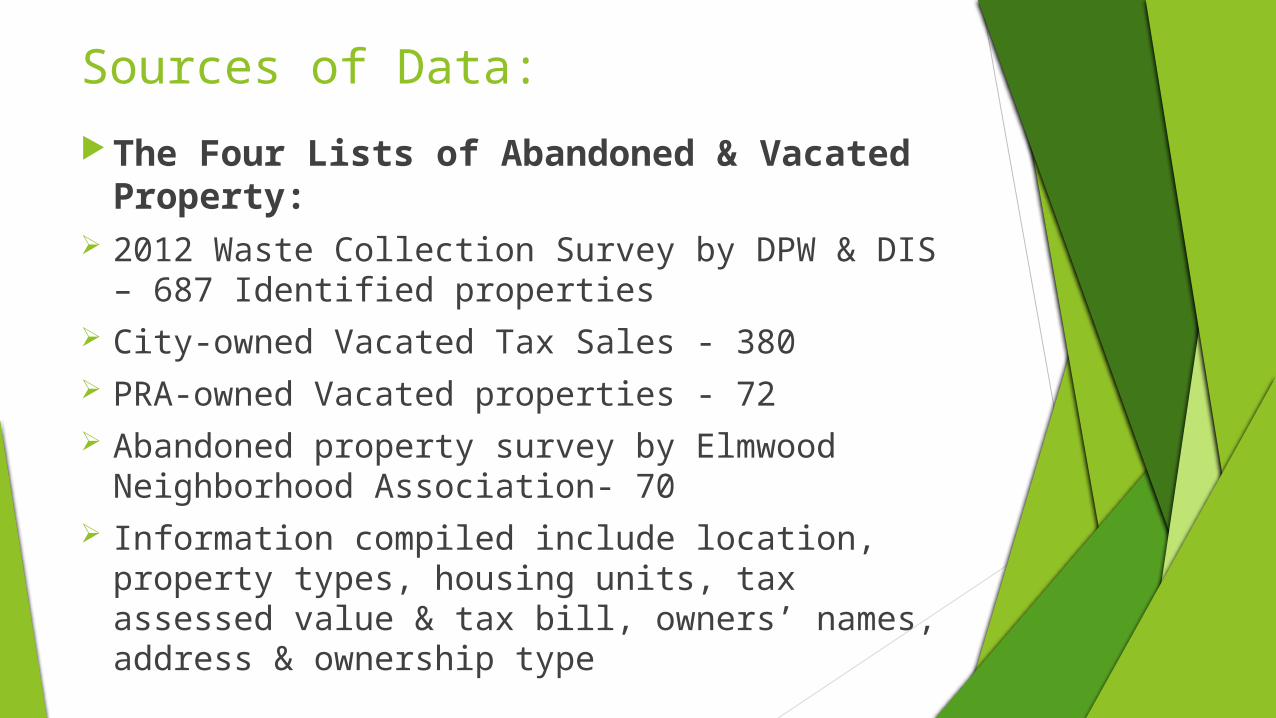
Sources of Data:
The Four Lists of Abandoned & Vacated Property:
2012 Waste Collection Survey by DPW & DIS – 687 Identified properties
City-owned Vacated Tax Sales - 380 PRA-owned Vacated properties - 72 Abandoned property survey by Elmwood
Neighborhood Association- 70 Information compiled include location, property
types, housing units, tax assessed value & tax bill, owners’ names, address & ownership type

From the late 1990s to 2008, widespread subprime lending and low interest rates fueled an immense housing bubble across the United States. In the West End, 2-5 Family homes rose 409% from 1997 – 2005.
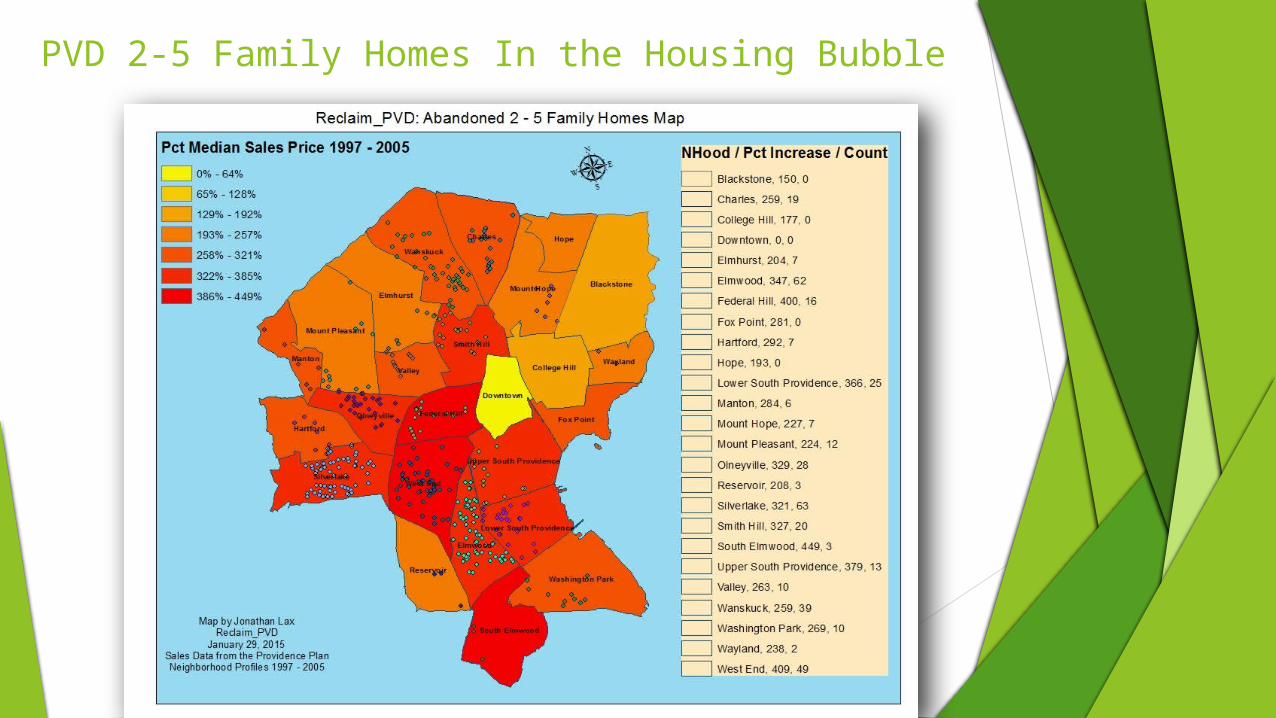
PVD 2-5 Family Homes In the Housing Bubble

PVD Abandoned / Vacated Properties & Subprime Lending

Compare: Subprime Lending vs Foreclosure Rate
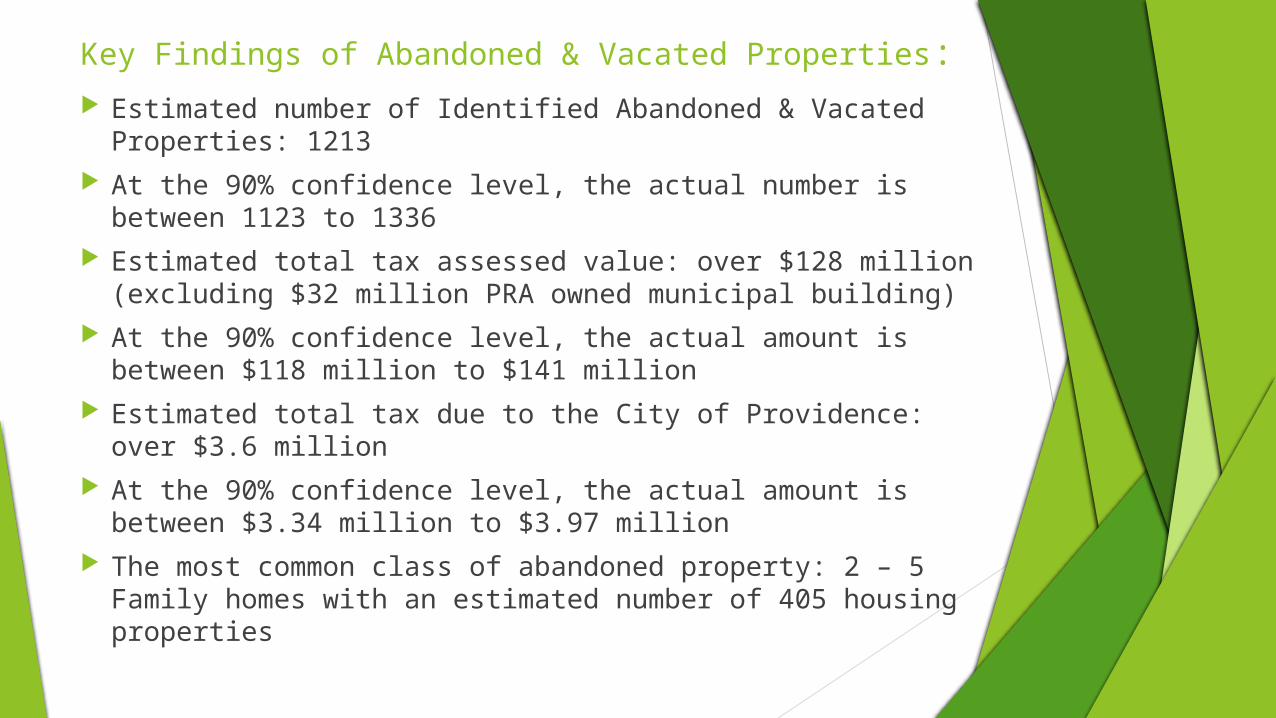
Key Findings of Abandoned & Vacated Properties: Estimated number of Identified Abandoned & Vacated
Properties: 1213 At the 90% confidence level, the actual number is between
1123 to 1336 Estimated total tax assessed value: over $128 million
(excluding $32 million PRA owned municipal building) At the 90% confidence level, the actual amount is between
$118 million to $141 million Estimated total tax due to the City of Providence: over $3.6
million At the 90% confidence level, the actual amount is between
$3.34 million to $3.97 million The most common class of abandoned property: 2 – 5 Family
homes with an estimated number of 405 housing properties
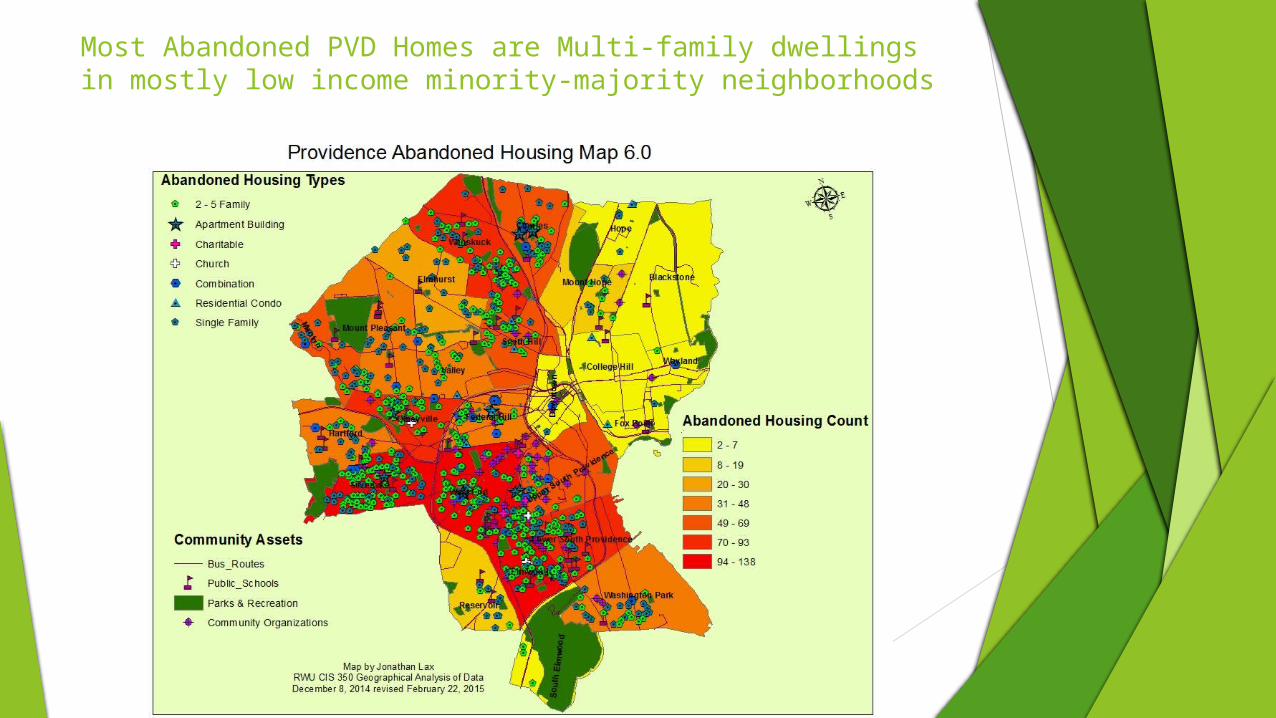
Most Abandoned PVD Homes are Multi-family dwellings in mostly low income minority-majority neighborhoods
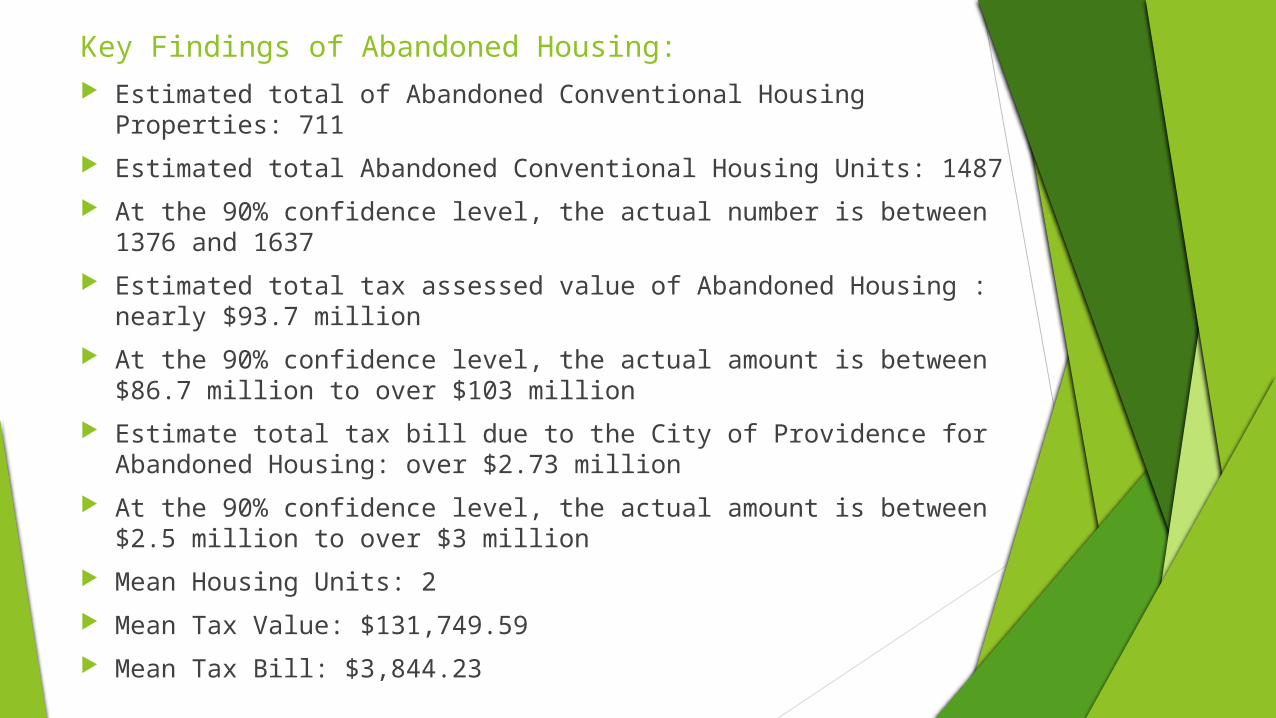
Key Findings of Abandoned Housing: Estimated total of Abandoned Conventional Housing Properties:
711
Estimated total Abandoned Conventional Housing Units: 1487
At the 90% confidence level, the actual number is between 1376 and 1637
Estimated total tax assessed value of Abandoned Housing : nearly $93.7 million
At the 90% confidence level, the actual amount is between $86.7 million to over $103 million
Estimate total tax bill due to the City of Providence for Abandoned Housing: over $2.73 million
At the 90% confidence level, the actual amount is between $2.5 million to over $3 million
Mean Housing Units: 2
Mean Tax Value: $131,749.59
Mean Tax Bill: $3,844.23
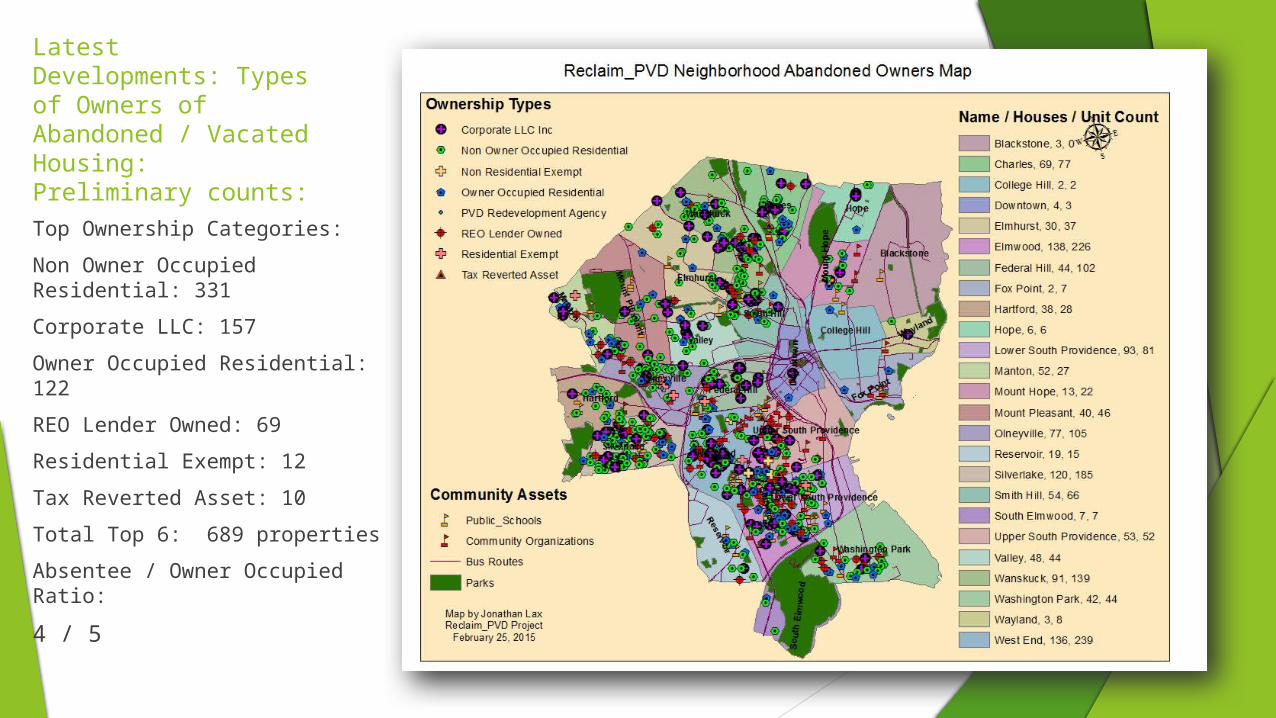
Latest Developments: Types of Owners of Abandoned / Vacated Housing: Preliminary counts: Top Ownership Categories:
Non Owner Occupied Residential: 331
Corporate LLC: 157
Owner Occupied Residential: 122
REO Lender Owned: 69
Residential Exempt: 12
Tax Reverted Asset: 10
Total Top 6: 689 properties
Absentee / Owner Occupied Ratio:
4 / 5

Reclaim PVD: Preliminary Conclusions A review of the data shows that most abandoned and
vacated property in Providence is residential in character, with an estimated number of identified housing properties at 711 and residential vacated lots at 370.
That total of 1081 is over 89% of the total identified abandoned and vacated properties.
Multi-unit dwellings make up over 63% of the identified abandoned housing properties.
The main factors driving abandonment appear to be elevated subprime lending coupled with aggressive foreclosure, skyrocketing appreciation and absentee ownership in low income majority minority areas.
Over 64% of the identified abandoned properties are clustered in just 8 of the 25 Providence neighborhoods.
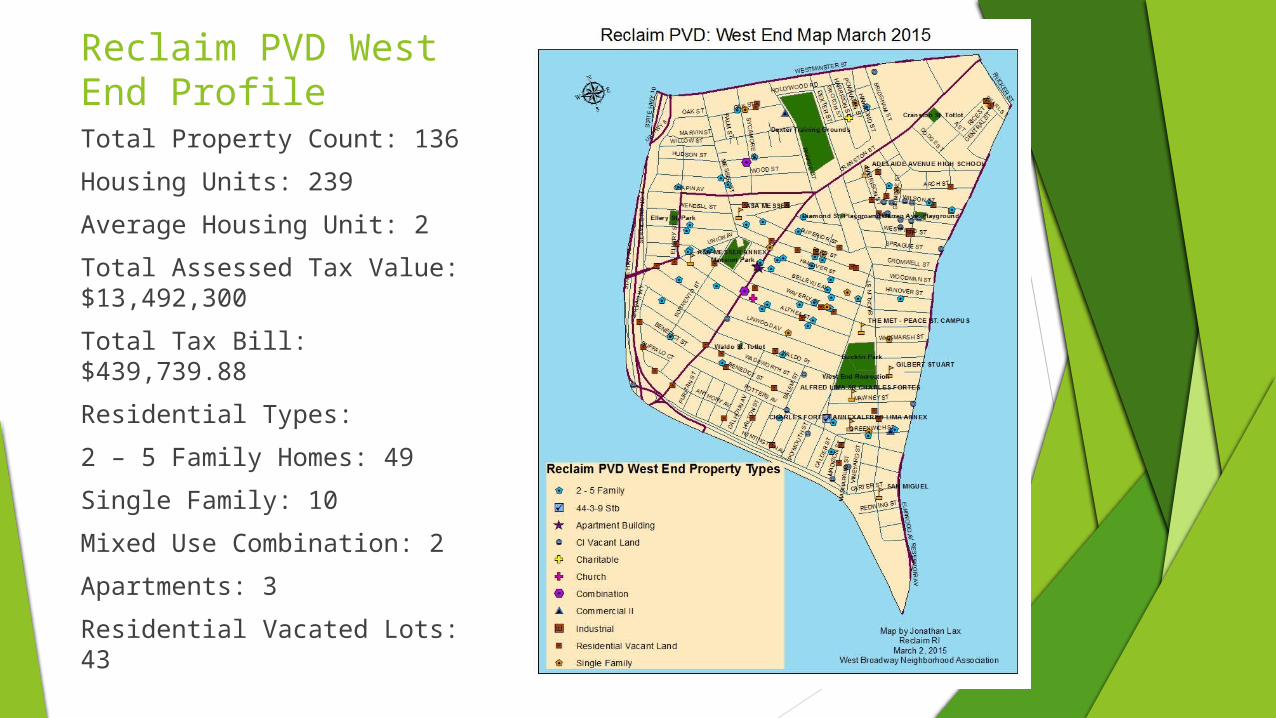
Reclaim PVD West End ProfileTotal Property Count: 136
Housing Units: 239
Average Housing Unit: 2
Total Assessed Tax Value: $13,492,300
Total Tax Bill: $439,739.88
Residential Types:
2 – 5 Family Homes: 49
Single Family: 10
Mixed Use Combination: 2
Apartments: 3
Residential Vacated Lots: 43

City Of Providence Efforts to Reclaim Abandoned Property:Under Rhode Island law, municipalities are empowered to take owners of abandoned property to court for maintaining a public nuisance. If the owner of such properties fail to abate the public nuisance, then the court can appoint a receiver to take possession of the property to rehabilitate it back into the community.
Taking advantage of this statute, Mayor Taveras launched the Providence Receivership program in August 2014, in which abandoned properties and their owners and interested parties are taken to court with the goal of either abating the public nuisance or having the property placed under receivership for redevelopment.
The conditions of abandonment and public nuisance are defined by statute, as is the process of determining those conditions and the standards the court requires of those who would be appointed as receivers.

Policy Challenges for Receivership Program There is a policy gap between how
the City is acquiring the abandoned homes and their policy goals. The Receivership Law is biased towards private investors and not for affordable homeownership.
The city is in competition with private real estate operators to acquire the better housing units. Since the real estate market is recovering, time is running out to get those homes on favorable terms.
It may be challenging to make the rehab numbers work out on many of these multi-unit homes
The City needs to continue to engage neighborhood groups.

Acknowledgements:
City of Providence
Brian Hull, Director of Community Development
Elyse’ Pare, Deputy Tax Assessor
Sean Creegan, Assistant City Solicitor
Jim Silveria, Chief Information Officer
Providence Plan
Ryan Kelly, Urban Information Specialist
Brown University
Bruce Boucek, Social Science Data Librarian
Roger Williams University
Jamie Scurry, Dean of School of Continuing Studies
Professor Jorge Elorza, School of Law
Professor Mark Brickley, Gabelli School of Business
Professor Eric Jacobs, Director of Community Development Program
Elizabeth Debs, Instructor
State of Rhode Island
Raymond Neirinckx, Housing Resource Coordinator, RI Housing Commission

RI Housing Scope of Work: Research work will transition from a housing
only to place focused, asset-based sustainable community development utilizing ArcGIS mapping
Fully support existing policy research under direction of staff as detailed in the RIH Consolidated Plan 2015-2019
Reclaim PVD Reclaim RI: expand abandoned housing work to RI Urban Core
Extend work of Housing Network of RI Developer’s Report 2006 - 2012
Explore alternative funding for community development, such as investment pools drawn from public pension & NGO funds

Place MattersPlace focused research
Proximity to Community Assets
Include human development metrics
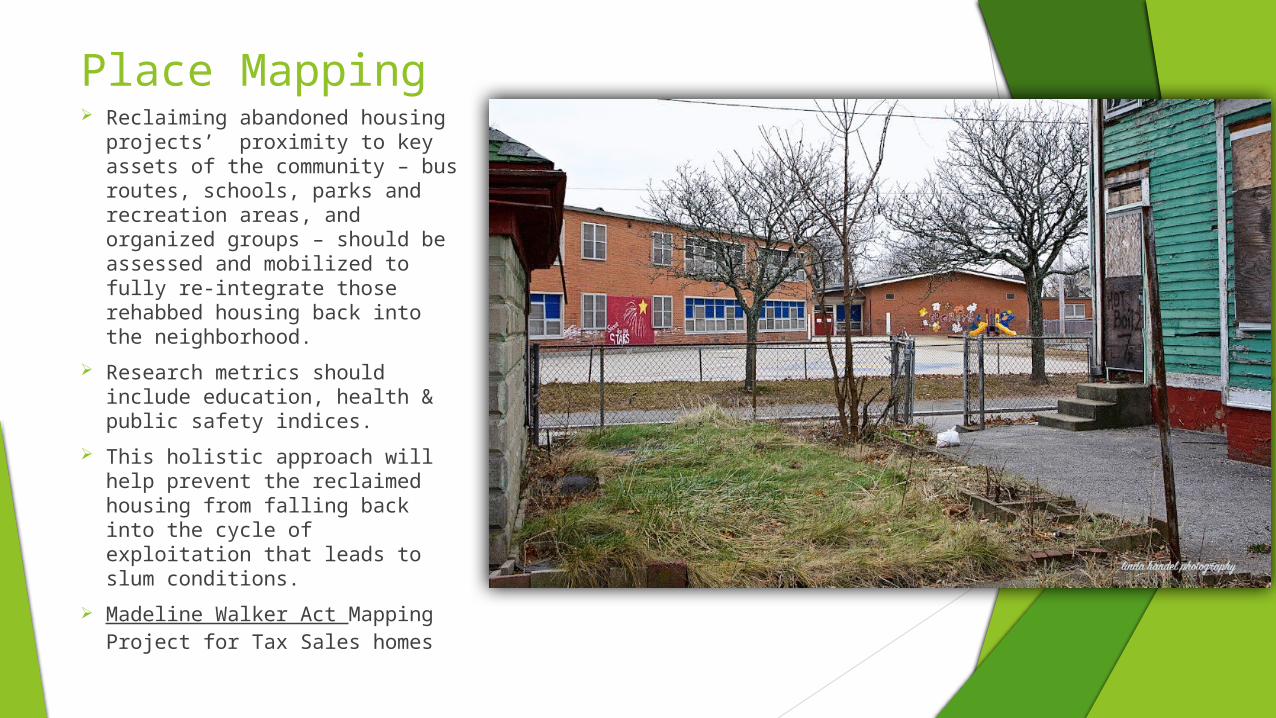
Place Mapping Reclaiming abandoned housing
projects’ proximity to key assets of the community – bus routes, schools, parks and recreation areas, and organized groups – should be assessed and mobilized to fully re-integrate those rehabbed housing back into the neighborhood.
Research metrics should include education, health & public safety indices.
This holistic approach will help prevent the reclaimed housing from falling back into the cycle of exploitation that leads to slum conditions.
Madeline Walker Act Mapping Project for Tax Sales homes

Support Con Plan 2015 - 2019

Reclaim PVD Reclaim RI: Integrated Approach for Neighborhood Revitalization
Expand abandoned housing work to RI Urban Core: Woonsocket, Pawtucket, Central Falls, North Providence, East Providence, Cranston, Warwick, West Warwick
Place focused research with proximity analysis of abandoned homes with community assets: schools, bus routes, parks and recreation, libraries, service agencies & organized groups, public safety stations
Extend work of Housing Network of RI Developer’s Report: assessing impacts of RI CDCs on health, education and public safety utilizing census data 1990 – 2010 and create online interactive ArcGIS story maps of projects

Alt Investment Pools Since 2007, this abandoned Potters
Street 3 Decker has been owned by Wall Street banks (JP Morgan and currently CitiMortgage) and speculators
Many localities are using alternative investment pools drawn from public pensions and the endowments of large NGOs such as universities and hospitals for affordable housing, health care facilities, food co-ops and Farmer’s Markets
Typically these pools make up between 2 – 5 percent of their funds’ assets but cumulatively it adds up
The community development projects funded aim for a 5 - 7 percent return on investment

Job Tool Kit
A job as Community Development Research Analyst (potential grant from RI Foundation)
Esri ArcGIS advanced license for spatial & statistical analysis.
Wide Computer Screen for presentationsOn the Job Training Grant available from
Workforce Solutions of Providence / Cranston