Recess, Physical Education, and Elementary …pirate.shu.edu/~rotthoku/papers/Recess.pdfRecess,...
33
1 Recess, Physical Education, and Elementary School Student Outcomes 1 Angela K. Dills Providence College Hillary Morgan Drew University Kurt Rotthoff Seton Hall University April 4, 2011 Abstract Today’s children experience a decreased amount of time at recess and fewer physical education (PE) classes throughout the school day. Breaks for physical activity limit class time for academics, potentially reducing learning. However, breaks may improve alertness and achievement. Using the Early Childhood Longitudinal Survey Kindergarten Class of 1998-1999, we evaluate how recess and PE in elementary school influence children’s learning. We find no statistically significant or economically significant impacts of weekly recess or PE time on student learning for kindergarteners through fifth graders. For example, in kindergarten, adding an hour a week of recess reduces the average test score gain in reading by a statistically insignificant 0.01 standard deviations. An additional 49 minutes per week of PE in kindergarten improves reading test score gains by a statistically insignificant 0.05 standard deviations. We find no statistical difference in the male and female students’ response to recess and PE. Evidence suggests that recess and PE do not harm student outcomes. Keywords: recess, physical education, test scores JEL: I18, I21, I28 1 Angela Dills can be contacted at 1 Cunningham Square, Department of Economics, Providence, RI, 02918; (401) 865-2590; or [email protected]. Hillary Morgan can be contacted at 36 Madison Ave, Madison, NJ 07940; (973) 761-9102; or [email protected]. Kurt W Rotthoff can be contacted at 400 South Orange Ave, JH 621, South Orange, NJ 07079; [email protected]; or (973) 761-9102. We thank Sean Mulholland, session participants at the Southern Economics Association, two anonymous referees, and the editors of this volume for their helpful comments. Any remaining errors are our own.
Transcript of Recess, Physical Education, and Elementary …pirate.shu.edu/~rotthoku/papers/Recess.pdfRecess,...

1
Recess, Physical Education, and Elementary School Student Outcomes1
Angela K. Dills
Providence College
Hillary Morgan
Drew University
Kurt Rotthoff
Seton Hall University
April 4, 2011
Abstract
Today’s children experience a decreased amount of time at recess and fewer physical
education (PE) classes throughout the school day. Breaks for physical activity limit class time for
academics, potentially reducing learning. However, breaks may improve alertness and
achievement. Using the Early Childhood Longitudinal Survey Kindergarten Class of 1998-1999,
we evaluate how recess and PE in elementary school influence children’s learning. We find no
statistically significant or economically significant impacts of weekly recess or PE time on
student learning for kindergarteners through fifth graders. For example, in kindergarten, adding
an hour a week of recess reduces the average test score gain in reading by a statistically
insignificant 0.01 standard deviations. An additional 49 minutes per week of PE in kindergarten
improves reading test score gains by a statistically insignificant 0.05 standard deviations. We
find no statistical difference in the male and female students’ response to recess and PE.
Evidence suggests that recess and PE do not harm student outcomes.
Keywords: recess, physical education, test scores
JEL: I18, I21, I28
1 Angela Dills can be contacted at 1 Cunningham Square, Department of Economics, Providence, RI, 02918; (401)
865-2590; or [email protected]. Hillary Morgan can be contacted at 36 Madison Ave, Madison, NJ 07940;
(973) 761-9102; or [email protected]. Kurt W Rotthoff can be contacted at 400 South Orange Ave, JH
621, South Orange, NJ 07079; [email protected]; or (973) 761-9102. We thank Sean Mulholland, session
participants at the Southern Economics Association, two anonymous referees, and the editors of this volume for
their helpful comments. Any remaining errors are our own.

2
I. Introduction
Public opinion and school policies on physical activity have come full circle. Five to ten
years ago, forty percent of school districts in the U.S. were reducing or eliminating recess to
devote more time to teaching and learning (Zygmunt-Fillwalk & Bilello, 2005). Growing cities
like Atlanta built new elementary schools with no playgrounds (Schools becoming all work and
no play, 2001). School districts were beginning to implement “no recess” policies claiming that
recess wasted time better spent on academics (Johnson, 1998). More recently, rising concern
over childhood obesity has shifted attention towards helping children become more physically
active (Hellmich, 2010).
Much of the research on school-based physical activity focuses on childhood obesity and
overweight youth (for example, Cawley, Meyerhoefer, & Newhouse, 2007; Datar & Sturm,
2004; Ogden, Flegal, Carroll, & Johnson, 2002; and Simons-Morton, Taylor, & Snider, 1993).
Recess and physical education (PE) classes, however, may also affect schoolchildren’s academic
achievement. On one hand, these active times reduce the school time available for learning
academic subjects. On the other hand, they may improve classroom behavior, increasing young
students’ comprehension (Jarrett, Hoge, Davies, Yetley, & Dickerson, 1998).
We evaluate how recess and PE in elementary school influence children’s learning. We
test whether these activities help or hinder students in the classroom. Considering how recess and
PE affect student outcomes should influence optimal school-level curricula and inform
administrators as to the importance of recess and PE.
Using a nationally representative sample of kindergarteners through fifth graders, we find
no statistically significant or economically significant impact of weekly recess or PE time on
student learning. We test this relationship in many ways: with student-, teacher-, and school-

3
level controls, with state fixed effects, and with instrumental variables. Time allocated to
physical activity at school has no statistically significant affect on student test scores. We include
controls for possible substitutes such as time spent on academic subjects. We continue to find
insignificant results. The next section overviews recess and PE policies and the extant literature.
Sections III and IV discuss the methodology and data. Section V reports the results, followed by
the conclusion and policy implications.
II. Recess and PE policies and prior literature
Today’s children experience less recess and fewer PE classes throughout the school day
than children in the 1970s (Wingert, 2000). The National Association for Sport and Physical
Education (NASPE) advises that “regular physical activity” add up to about one hour per day,
every day. A majority of states mandate physical education, although most do not specify the
amount of instructional time. According to the NASPE & American Heart Association (2010),
only three states (Alabama, Florida, and Louisiana) require the nationally recommended 150
minutes or more per week of physical education. Just 18 percent of states require elementary
schools to provide daily recess; exemptions in about half of these states reduce the mandates’
effectiveness.
Recess and PE both provide opportunities for physical play outside the classroom.
However, they are not the same. During recess, children socialize without restraint, choose levels
of physical activity, and develop their own games.2 PE typically compels more rigorous physical
activity, especially for female students. Because of these differences, the NASPE recommends
both PE classes and recess as regular parts of elementary school curricula.
2 See the papers cited in Jarrett (2002).
4
There are costs to spending part of the school day in recess and PE. These periods
potentially reduce time available for educational material and may also reduce time spent on
non-tested subjects like art and music activities. Under state accountability programs, if recess or
PE time takes away from learning, states could reduce funding (Schacher, 2005; Zygmunt-
Fillwalk & Bilello, 2005). Further, recess may disrupt classroom work patterns (Pellegrini,
1995); Klein (2004) finds temporary declines in achievement immediately after recess.
There are also possible benefits: breaks are considered essential for alertness and
achievement (Jarrett, 2002). In particular, young children comprehend material more thoroughly
and quickly when material is presented with short breaks (Pellegrini & Bjorkland, 1997;
Dempster, 1988). Jarrett, Hoge, Davies, Maxwell, Yetley, & Dickerson (1998) show that recess
increases the amount of work completed and improves classroom behavior by reducing fidgeting
and listlessness. Pellegrini and Davis (1993) and Pellegrini, Huberty, and Jones (1995) find that
elementary school children become increasingly distracted when recess is delayed, which results
in additional active play when recess occurs. The costs and benefits of recess and PE suggest an
optimal duration and frequency of these breaks.
The Center for Disease Control and Prevention (CDCP, 2010) summarizes the research
on school-based physical activity and academic performance. The literature review concludes
that neither recess nor PE worsen academic performance and may improve it. However, most of
the included studies examine the effectiveness of specific interventions, such as a new
curriculum for physical education; many others focus on classroom behavior after physical
activity.
A few studies focus specifically on PE and academic achievement. In Massachusetts, an
elementary school with twice as much PE time produces higher English and language arts test

5
scores than a comparison school (Tremarche, Robinson and Graham, 2007). However, the school
with more PE also enrolls a greater proportion of white students, has lower dropout rates, and
higher teacher salaries. As the authors conduct a simple t-test of test scores, the estimated effect
of PE is likely upwards biased. In South Australia, controlling for student demographics,
Dollman, Boshoff, and Dodd (2006) estimate that PE time is unrelated to literacy and numeracy
test scores. Carlson et al. (2008) use ECLS data and find that moving from 0-35 minutes per
week of PE to 70-300 minutes per week raises girls’ test scores but not boys’.
None of the surveyed studies in CDCP (2010) consider time in recess and academic
achievement. Recess studies focus on how recess affects behavior (for example, Barros, Silver,
& Stein, 2009). Although classroom behavior is an important input in the educational process,
ultimately, we care about student outcomes (Jarrett, Hoge, Davies, Maxwell, Yetley, &
Dickerson, 1998; Pellegrini & Bohn, 2005). Other studies focus on how students’ choices of
recess activity affect later classroom behavior (for example, Pellegrini, Kato, Blatchford, &
Baines, 2002). The relevant policy intervention is, most likely, a change in time dedicated to
recess rather than a change in the choices children make. Further, Pellegrini and Bohn (2005)
find that adult-directed behavior in recess has negative effects on first grade achievement.
We are particularly interested in whether recess and PE may explain the changing gender
gap. In the last thirty years, girls have excelled in the classroom with female gains across all age
groups and ethnic backgrounds (Mortenson, 1999). Schools have shifted away from recess and
PE and towards extra instructional time. The conventional wisdom suggests that boys may
benefit more from these physical activities, potentially explaining some of the shift in relative
performance. The effects of recess and PE may depend on children’s activity choices. Vigorous
recess play is negatively correlated with attentiveness after recess; moderate playground activity

6
is positively correlated with post-recess attentiveness (Jarrett, Hoge, Davies, Maxwell, Yetley, &
Dickerson, 1998). Recess is more likely to have distinct effects for boys and girls than PE
because boys and girls use their time differently. Girls tend to choose less strenuous playground
activity; boys tend to be physically active (Boyle, Marshall, & Robeson, 2003). Contrary to
conventional wisdom, recess likely reduces boys’ post-recess attentiveness and increases girls’
attentiveness. PE involves more rigorous physical activity and involves both genders at an equal
level of physical activity (Sarkin, McKenzie, & Sallis, 1997).
III. Methodology
To measure the effects of PE and recess on test scores, we estimate the following:
ijijijij XPErecesstestscore εβββ +++=∆ 321 )()( (1)
The dependent variable is the change in test scores between different grade levels for student i in
school j. The two variables of interest are measures of time spent in recess and PE. We control
for a variety of factors that may be correlated with recess or PE and student test scores. The data,
described below, provide rich measures of student, classroom, and school characteristics. The X
vector includes measures of school quality, teacher attributes, and student demographics.
Student-level control variables include age, sex, race, ethnicity, socio-economic status (SES),
maternal education, household composition including the presence of parents and siblings, and
the time-interval since the last assessment. Classroom-level control variables include class size
and teacher tenure. School-level variables include an indicator variable for whether the school is
public or private, the percent of the students identified as minority students, the size of the
school, the urbanicity of the school, and state or regional fixed effects. In specifications without
state fixed effects, we also include the state average score on the National Assessment of

7
Educational Progress (NAEP). These variables control for various student, teacher, school, and
state characteristics that may be correlated with curriculum policy as well as test scores to
minimize omitted variable bias.
In some specifications, we include interaction terms to allow the effects of recess and PE
to differ by sex; we include, for example, the interaction between an indicator for whether the
student is male and the length of recess. Statistically significant coefficients on these interaction
terms would indicate a sex difference in the effect of recess on test score gains. We follow a
similar procedure for PE.
Recess and PE are not randomly assigned interventions. To obtain unbiased causal
estimates of the effects of these breaks on student test scores, the recess and PE variables must be
uncorrelated with the error term. Bias would arise, for example, if schools base their decision on
how much recess to offer per day on student gains in test scores. Low quality schools may enjoy
many recesses and little value-added, biasing estimates of β1 downwards. Alternatively, schools
with low-performing students may limit recess in an effort to raise test scores, biasing estimates
of β1 upwards.
We address this possibility in two ways. First, we include a rich set of student-, class-,
and school-level controls including state fixed effects to minimize omitted variable bias. Second,
we address this potential bias using two-stage least squares (2SLS). We use state-level policies
on recess and PE to instrument for teacher-reported time spent in these activities, following
Cawley, Meyerhoefer, and Newhouse (2007). These instruments are less likely to be
endogeneous to a particular student’s achievement.

8
IV. Data
Estimating the role that recess and PE play on student learning requires longitudinal data
on student test scores, curricula, measures of school quality, and student demographics. We use a
nationally representative sample of children, the Early Childhood Longitudinal Survey
Kindergarten Class of 1998-1999 (ECLS-K). The ECLS-K surveyed students in the fall and
spring of kindergarten (Fall 1998 and Spring 1999), the fall and spring of first grade (Fall 1999
and Spring 2000), spring of third grade (Spring 2002), and spring of fifth grade (Spring 2004).
We measure changes in the proficiency of students over different grade levels: between fifth and
third grade, third and first grade, first and kindergarten, and within kindergarten. We also
measure changes over a longer amount of time: between fifth grade and kindergarten. Each
survey contains direct child assessments of reading (language and literacy) and mathematical
thinking.
Cognitive assessments in the ECLS-K are developed to provide longitudinal scales. The
assessments rely on adaptive testing, minimizing floor and ceiling effects (Pollack, Atkins-
Burnett, Najarian, & Rock, 2005).3 The ECLS prepares two aggregate scores appropriate for our
analysis: IRT scores and t-scores.4 We use the standardized scores (t-scores). These scores
indicate how an individual ranks relative to the national average at each grade level. The t-scores
are scaled annually to the population of a given grade level with a mean of 50 and a standard
3 Because adaptive testing allows different questions depending on prior performance, it is better able to
distinguish among the highest achieving students and among the lowest achieving students. Ceiling effects, for
example, result from students of varying ability scoring the same score of 100 percent.
4 The NCES went to great lengths to ensure the reliability and validity of the child cognitive assessments. Field
testing included comparing the ECLS-K cognitive ability measures to established measures (Tourangeau et al.
(2006), p. 54). Pollack, et al. (2005) also confirms the validity of the data.

9
deviation of 10. For example, if a student had a third grade reading score of 40 and a fifth grade
reading score of 50, the child moved from one standard deviation below the mean third grader in
the U.S. to the mean for fifth graders in the U.S. The norming forces the average change to be
zero. Changes in t-scores from one grade to the next measure how that student’s achievement has
changed relative to the student’s peers.
Our sample, shown in table 1, shows only slight average changes in t-scores, as one
would expect. For example, on average, a kindergartener in our sample improved slightly (0.53
on a mean of 50) relative to all U.S. kindergarteners. The summary statistics verify that our
sample is representative of the population in each grade level. The average change is small,
however, individual students experience large variations in the change in scores from one grade
to the next, providing a good sample to estimate the effects of recess and PE. Note that although
each grade is normed to a standard deviation of 10, the standard deviation of the change in test
scores is somewhat smaller.
The independent variables of interest are measures of the total weekly time spent in
recess or PE. We construct these measures from a series of questions posed to the teachers about
their students’ time use in the spring of each year (kindergarten, first grade, third grade, and fifth
grade). First, the survey asks how many times each week the children in their class usually have
physical education. Teachers may reply never, less than once a week, once or twice a week, three
or four times a week, and daily. The survey next inquires “How much time each day do your
class(es) usually spend when they participate in physical education?” The potential responses
are: do not participate in physical education; 1-15 minutes per day; 16-30 minutes per day; 31-60
minutes per day; and more than 60 minutes per day. The survey subsequently solicits how many
days a week the children have recess, with possible responses ranging from zero to five. Finally,

10
teachers are asked “In a typical day, how much time does your class spend in the following
activities?...Recess.” Teachers may select: none, 1-15 minutes, 16-30 minutes, 31-45 minutes,
and longer than 45 minutes.5
We calculate weekly time in each activity, multiplying the number of days per week by
the time spent per day using the midpoint of the categorical variable.6 Table 2 summarizes the
time spent in these activities. Most students have recess every day. The variation occurs in the
number of times per day and the length of each recess. The average student experiences 133.4
minutes of recess a week in kindergarten; by fifth grade, it decreases to 89.4 minutes. The
duration and frequency of PE classes exhibit more variation. Although most students attend PE
class one to two times a week, 25 to 35 percent attend PE class with more frequency. A PE class
typically lasts either 15-30 minutes or 31-60 minutes. While recess time decreases as students
progress through school, PE time increases slightly from 68.1 minutes in kindergarten to 78.9
minutes in fifth grade.
Using value-added test scores restricts our sample to students surveyed in at least two
different grades with reported test scores and recess and PE measures. We weight the regressions
using the longitudinal weights provided by the ECLS-K to generate nationally representative
results; these weights also adjust for students not resurveyed in a given wave. We exclude
5 The phrasing of the PE question “How much time…when they participate” makes the interpretation of the amount
of time spent each week in PE clear. Calculating weekly time in recess is less clear. The survey asks three questions:
How many times a day do you have recess?; How much time a day is spent at recess?; and how many days a week
does your class have recess? To calculate weekly time, we multiply how much time a day by how many days a
week. We test the frequency and times of both activities separately with similar results; results available upon
request.
6 We code the recess times as 0, 7.5, 23, 38, and 53 minutes; the PE times as 0, 8, 23, 45.5, and 75 minutes; and PE
classes per week as 0, 0.5, 1.5, 3.5, and 5.

11
students labeled as special education or provided with an individual education plan (IEP). We
consider each two-year or within-year test score gain separately to maximize the number of
observations. This allows us to include a student that was surveyed in kindergarten and first
grade for that comparison, even though they may not have been surveyed in the other grades.7
We also measure the difference in kindergarten and fifth grade to measure any long term
differences. We cluster standard errors at the school level to allow for correlation among students
at the same school.
Table 3 summarizes recess and PE time by school characteristics. Schools with lower
SES students have less recess per week and more PE time. Schools with larger minority
populations also have less recess time per week but more PE time per week. To the extent that
lower SES and minority students are concentrated in lower quality schools, estimates of the
effect of recess may be biased upwards and those of PE biased downwards. Controls for school
quality such as teacher characteristics and school-level variables such as percent minority help
minimize this potential bias. A full set of summary statistics for the dependent variables,
independent variables, and instrument variables appears in the Appendix.
In specifications without state fixed effects, we include the state’s average score on the
National Assessment of Educational Progress (NAEP). The NAEP provides a measure of
academic achievement comparable across states. The earliest tested grade is the fourth grade. In
the reading regressions, we include the 1998 reading test score for fourth graders. In the math
regressions, we include the 2000 math test score for fourth graders.
7 The samples include similar numbers of observations in the reading and math tests, except for the fifth grade. In all
years, one reading teaching and either a math or science teacher was surveyed. In the fifth grade, students are more
likely to have different teachers for different subjects, reducing the sample size. All sample sizes are rounded to the
nearest ten per policies of the restricted use data.

12
Some states mandate schools’ minimum recess and PE policies. The instrumental
variables are based on these policies. In 2000, the School Health Policies and Practices Study
(SHPPS) measured different types of state policies. The survey asked, for example, whether the
state PE standards are based on the national standards. The national standards delineate specific
physical skills children should acquire by each grade level. The survey also documents whether
the state requires (or recommends) regularly scheduled recess at elementary school and whether
the state requires (or recommends) elementary students to take a physical fitness test. In 2000,
two states required elementary schools to have regularly scheduled recess, while 11
recommended it. Seven states required physical fitness tests, while 10 recommended it. 29 states
based their PE standards on the national standards.8
V. Results
To measure the effects of PE and recess on test scores, we estimate the change in t-scores
on PE and recess controlling for a variety of factors. We first estimate a basic OLS model that
measures the value-added to the test scores from the time spent on recess and PE in the student’s
day. Table 4 presents the basic OLS model without controls. The coefficient estimates on PE and
recess are small, of mixed signs, and occasionally statistically significant. The largest estimated
effect of recess is its effect on reading between third and first grade, reported in column 5. Here,
an additional minute per week of recess increases the gain in reading t-score by 0.0077. The
dependent variable, the change in t-scores, has a mean of close to zero and a standard deviation
of 6.7. Increasing recess by one standard deviation (63 minutes), increases the gain in reading t-
scores by 0.485, or 0.07 standard deviations. The other estimated effects are much smaller; some
8 We test the state policies separately and also combine the required and recommended policies as one instrument.
The results are similar among the different specifications.

13
are negative. The largest estimated effect for PE is its effect on reading in kindergarten, reported
in column 1. An additional minute per week of PE in kindergarten increases the gain in math t-
score by 0.0121; a one standard deviation increase in PE time (about 49 minutes), increases the
gain in math t-scores by 0.59, or 0.09 standard deviations. The correlation of PE and recess time
with the socioeconomic status of students suggests that these estimates are likely to be biased.
Table 5 presents the basic OLS model adding a rich set of controls for student, teacher,
and school characteristics. Estimates on these controls, when statistically significant, are in the
expected direction. Boys learn more math in the early grades than girls. Hispanic students post
large reading gains in kindergarten and math gains in first grade. Black students, older students,
students with fewer days between tests, and half-day kindergarteners experience smaller test
score gains.
Both days between tests and whether a child attends half-day or full-day kindergarten
reflect time on task. An additional day between tests raises kindergarten test scores by about
0.05. On average, kindergarteners experienced 186 days between the fall and spring tests. A one
standard deviation increase in days between tests, about 3 weeks, increases the gain in
kindergarten test scores by about 0.18 standard deviations. The effect of days between tests
declines as students progress in school, consistent with additional days being more important for
students earlier in their school careers. For a kindergartener, an additional three weeks between
exams increases his or her exposure to formal schooling by almost 8%, while three weeks for a
fifth grader does not have nearly as great of an impact. Fitzpatrick, Grissmer, and Hastedt (2011)
estimate somewhat smaller results, finding that the passage of an additional school year results in
additional gains of about 1.2 standard deviations. Days between tests captures the additional time
in school as well as the maturation of the child.

14
The t-scores of full day kindergartners are 0.462 higher for reading and 0.3431 higher for
math. Students spending twice as much time per day in kindergarten, on average, experience
greater test score gains by 0.07 standard deviations in reading and 0.06 standard deviations in
math. DeCicca (2007) also uses the ECLS and estimates that full-day kindergarteners perform 10
to 20 percent better on the end-of-year test than half-day kindergarteners.
Adding the controls reduces the statistical significance of the estimates on recess and PE.
Without controls 6 of the 20 estimates were statistically greater than zero and one is statistically
less than zero; with the controls, only one remains statistically significant. The estimated effects
of recess are more negative (less positive) in 6 of the 10 regressions; the estimated effects of PE
are more negative (less positive) in 5 of the 10 regressions. Omitting covariates as in Table 4
may bias results somewhat upwards, although adding the controls does not clearly demonstrate
the direction of the bias.
With the controls, neither recess nor PE statistically significantly affect gains in test
scores. Further, the point estimates are quite small. For example, for kindergarten reading scores,
an additional minute of recess per week reduces the average t-score gain by 0.0016; an additional
minute of PE increases the average t-score gain by 0.0057. Similarly, a one standard deviation
increase in time spent in recess, almost one more hour of recess a week, reduces the average
reading t-score gain by 0.09 or about 0.01 standard deviations; a one standard deviation increase
in PE time, about 49 minutes, improves t-score gains by about 0.28 or 0.05 standard deviations.
To compare the magnitude of this effect to research on other school interventions, Krueger’s
(1999) analysis of the Tennessee STAR experiment estimates that students in their first year of
small classes gain four percentile points. Our estimates suggest, for example, that students
spending almost an hour more per week in PE gain 0.28 percentile points.

15
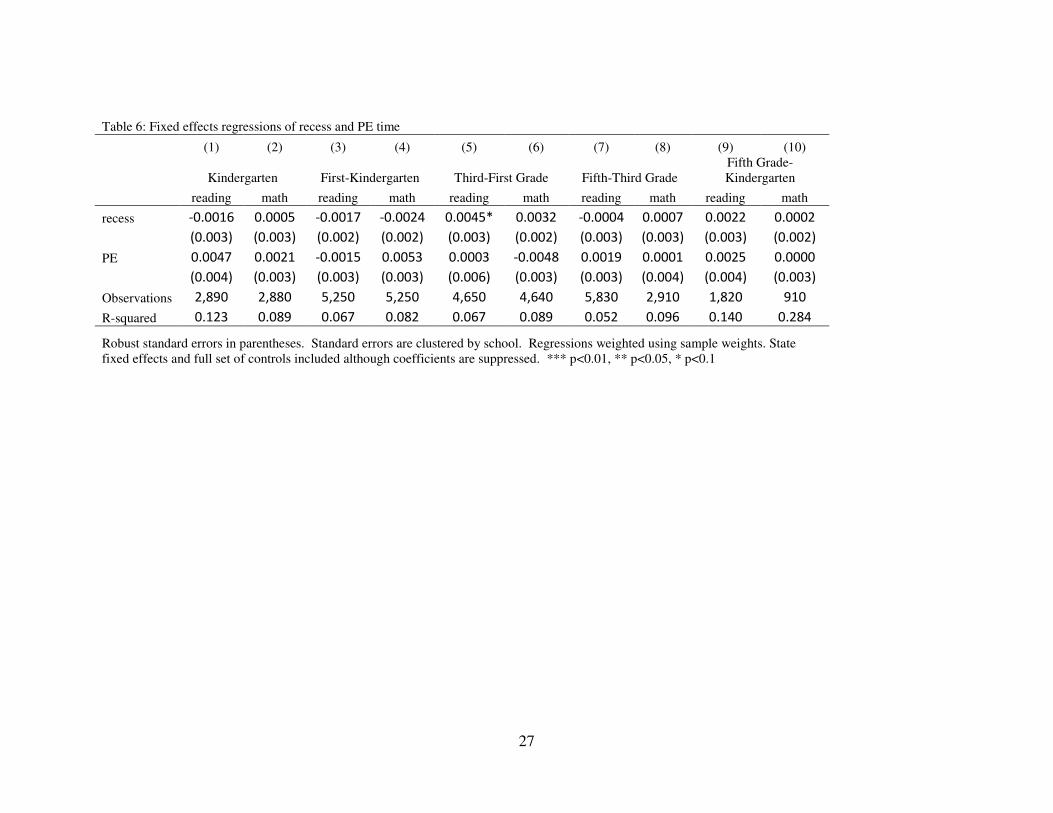
The restricted-use data set allows the inclusion of state fixed effects. This increases the
model’s power by controlling for state-level policies or other state-specific characteristics that
may be correlated with test score gains and with school-based physical activity. Including the
state fixed effects precludes controlling for average student achievement in that state. Including
the fixed effects leads to similar results (Table 6): the coefficient estimates on time in recess and
PE are statistically insignificant and economically small. This further suggests that omitted
variable bias is unlikely to be a substantial problem. Results are similar with and without
standard demographic and socioeconomic controls; results are similar with and without state
fixed effects.9
One motivation for considering school-based physical activity is to examine whether
these policies may differentially affect boys and girls. Table 7 reports results including
interaction terms of recess and PE with a male indicator variable. This allows boys’ and girls’
test scores to respond differently to having recess and PE during the school day. We find no
statistical difference in the male and female students’ response to recess and PE. This is in
contrast to the finding in Carlson et al. (2008) that girls, but not boys, benefit from a large
increase in PE time. Carlson et al. do not consider time in recess. Further, they include a more
limited set of demographic controls and do not include state fixed effects or a measure of state
academic quality.
With a lingering concern for policy endogeneity, we pursue 2SLS estimates. Some states
require recess and PE in elementary school, some recommend these policies, and other states
9 We consider two additional robustness checks on the specification. We separately include the number of times per
week and the duration of recess or PE. We allow for a quadratic in weekly recess and in weekly PE time. Results are
qualitatively similar and available upon request.

16
have no policies. We use state policies on recess and PE time as instrumental variables for these
curricular choices. The variables include indicators for whether the state claims that their PE
standards are based on national standards, whether the state requires elementary school recess,
whether the state recommends elementary school recess, and whether the state requires or
recommends a fitness test. Using the state policy variables preclude including state fixed effects.
To minimize concerns that state policy may differ with student achievement, we continue to
include state NAEP scores as a control variable in the 2SLS regressions.
Table 8 presents the first stage estimates of the 2SLS. State policies are correlated with
the amount of time schools spend at recess and PE. Those states that base their physical
education standards on the national standards, on average, have less PE. The national standards
are guidelines as to particular physical skills elementary school students should possess. States
that require elementary school recess experience fewer minutes of recess in a week. Many states’
requirements are quite low: in 2003, the two states that required recess mandated less than 20
minutes per day (100 minutes per week). This is below the mean recess time for students in all
but fifth grade. Recommending recess tends to increase recess time and decrease PE time,
relative to schools with no stated policy. States that recommend or require a fitness test have
significantly more recess and PE time, most likely to help students prepare for these evaluations.
The Cragg-Donald and Anderson tests for underidentification reject that the model is
underidentified. The Cragg-Donald F-statistic for weak identification suggests a weak
instruments problem for the kindergarten sample and the fifth-kindergarten sample. However,
the F-statistics for the other three grade levels suggest strong enough instruments. In the fifth-
third grade sample, the Hansen J-test for exogeneity rejects the exogeneity of the instruments; we
fail to reject exogeneity in the other four samples. The 2SLS estimates for between kindergarten

17
and first grade and between first and third grade are most likely to be valid. We present the 2SLS
estimates in Table 9 with this as a caution to the reader.
Using the state policies as instrumental variables requires any bias to stem from states
that choose more stringent recess policies, to be better (or worse) at raising test scores,
controlling for their average NAEP score. The instrumental variable estimates are more negative
(less positive) than the OLS estimates for both recess and PE. Our conclusion, however, remains
the same. Recess and PE have small, statistically insignificant effects on student learning.
Time on task ought to increase learning. For example, the literature on length of the
school year concludes that spending more time in school raises test scores.10
Time spent in recess
and PE may be productive time for learning. Young children may be better able to concentrate
when given opportunities for physical activity. For some grades, we are able to measure school
time spent on academic subjects. PE and recess do not appear to come at the expense of
academic time. In Table 10, we include academic time in the estimated regressions including
state fixed effects and the full set of controls. Because the samples are somewhat smaller than
those in Table 6, we present estimates excluding academic time measures for comparison.
Including academic time does not affect the estimated effects of recess and PE. Reassuringly,
time spent on reading boosts reading scores, particularly in lower grades. Time spent on math
improves math scores; time in math is more important for older students. We observe similar
effects when controlling explicitly for time spent in music or the arts. Including these terms does
not change the estimates for recess and PE.
10 See, for example, Marcotte (2007) or Pischke (2007).

18
VI. Conclusions and Policy Implications
The extant literature on recess and physical education (PE) finds varying impacts of
physical activity on student outcomes. Recess and PE can affect school children’s academic
achievement in two different ways: active time during the school day reduces the class time
available for academic learning but these breaks may improve classroom behavior, increasing
young students’ comprehension.
Using data from ECLS we evaluate how recess and PE impact students’ learning. After
controlling for a variety of student, classroom, and school characteristics we find that neither
recess nor PE have any statistically significant or economically significant impact on student
learning. Fixed effects estimation produces similarly small and statistically insignificant effects.
We also use state policies as instrumental variables to correct for potential policy endogeneity at
the school-level. The instrumental variable estimates are qualitatively similar to the fixed effects
and OLS estimates.
These results argue that changing the time spent in recess and PE is unlikely to affect
student test scores. This may be because gains in student concentration compensate for the time
spent in physical activities. Even holding constant academic time or time spent on the arts, recess
and PE have little effect on academic achievement in elementary school. This suggests that there
is little alertness effect to the physical activity. One possibility is that teachers allow for more
vigorous play within their classrooms when schools cut back on recess or PE. Detailed time-use
studies may shed light on teacher responses to changes in curricula.
19
Bibliography
Barros, R.M., Silver, E.J., & Stein, R.E. (2009). School Recess and Group Classroom Behavior.
Pediatrics, 123(2), 431–436.
Boyle, E., Marshall, N., & Robeson, W. (2003). Gender at Play: Fourth-Grade Girls and Boys
on the Playground. American Behavioral Scientist, 46(10), 1326-1345.
Carlson, S.A., Fulton, J.E., Lee, S.M., Maynard, L.M., Brown, D.R., Kohl, H.W. 3rd, & Dietz,
W.H. (2008). Physical Education and Academic Achievement in Elementary School:
Data from the Early Childhood Longitudinal Study. American Journal of Public Health,
98(4), 721–727.
Cawley, J., Meyerhoefer, C., & Newhouse, D. (2007). The Impact of State Physical Education
Requirements on Youth Physical Activity and Overweight. Health Economics, 16(12),
1287-1301.
Centers for Disease Control and Prevention. (2010) The Association Between School Based
Physical Activity, Including Physical Education, and Academic Performance. Atlanta,
GA: U.S. Department of Health and Human Services.
Datar, A., & Sturm, R. (2004). Physical Education in Elementary School and Body Mass Index:
Evidence from the Early Childhood Longitudinal Study. American Journal of Public
Health, 94(9).
DeCicca, Phillip (2007) “Does full-day kindergarten matter? Evidence from the first two years
of schooling,” Economics of Education Review, 26, 67-82.
Dempster, F.N. (1988). The Spacing Effect: A Case Study in the Failure to Apply the Results of
Psychological Research. American Psychologist, 43(8), 627-634.
Dollman J, Boshoff K, & Dodd G. (2006). The Relationship Between Curriculum Time for
Physical Education and Literacy and Numeracy Standards in South Australian Primary
Schools. European Physical Education Review, 12(2), 151–163.
Fitzpatrick, Maria D., David Grissmer, and Sarah Hastedt (2011) “What a difference a day
makes: Estimating daily learning gains during kindergarten and first grade using a natural
experiment,” Economics of Education Review, Vol. 30, no. 2.
Hellmich, N. (2010). Michelle Obama to Launch Initiative Fighting Child Obesity. USA Today,
(accessed June 15, 2010). http://www.usatoday.com/news/health/weightloss/2010-01-20-
michelle-obama-obesity_N.htm
Jarrett, O. (2002). Recess in Elementary School: What Does the Research Say? Eric Digest,
ED466331

20
Jarrett, O.S., Hoge, P., Davies, G., Maxwell, D., Yetley, A., & Dickerson, C. (1998). Impact of
Recess on Classroom Behavior: Group Effects and Individual Differences. Journal of
Educational Research, 92(2), 121-126.
Johnson, D. (1998). Many Schools Putting an End to Child's Play. New York Times, April 7, p.
A1, A16.
Klein, J. (2004). Planning Middle School Schedules for Improved Attention and Achievement.
Scandinavian Journal of Educational Research, 48(4), 441-450.
Krueger, Alan B (1999) Experimental estimates of education production functions," Quarterly
Journal of Economics, 114(2), May, 497-532
Marcotte, Dave E. (2007) “Schooling and test scores: A mother-natural experiment,” Economics
of Education Review, 26, 629-640.
Mortenson, T. (1999). Where are the Boys? The Growing Gender Gap in Higher Education. The
College Board Review, #188.
National Association for Sport and Physical Education & American Heart Association. (2010).
2010 Shape of the nation report: Status of physical education in the USA. Reston, VA:
National Association for Sport and Physical Education.
Ogden, C.L., Flegal, K.M., Carroll, M.D., & Johnson, C.L. (2002). Prevalence and Trends in
Overweight Among US Children and Adolescents, 1999-2000. Journal of American
Medical Association, 288(14), 1728-1732.
Pellegrini, A.D. (1995). School recess and playground behavior Albany: State University of
New York. ED 379 095.
Pellegrini, A.D. & Bjorklund, D. (1997). The Role of Recess in Children’s Cognitive
Performance. Educational Psychologist, 32(1), 35-40.
Pellegrini, A.D., & Bohn, C.M. (2005). The Role of Recess in Children's Cognitive
Performance and School Adjustment. Educational Researcher, 34: 13. DOI:
10.3102/0013189X034001013
Pellegrini, A.D., & Davis, P.L. (1993). Relations Between Children's Playground and
Classroom Behaviour. British Journal of Educational Psychology, 63(1), 88-95.
Pellegrini, A.D., Huberty, P.D., & Jones, I. (1995). The Effects of Recess Timing on Children's
Playground and Classroom Behaviors. American Educational Research Journal, 32(4),
845-864. EJ 520 960.
Pellegrini A.D., Kato, K., Blatchford, P., & Baines, E. (2002). A Short-Term Longitudinal
Study of Children’s Playground Games Across the First Year of School: Implications for

21
Social Competence and Adjustment to School. American Educational Research Journal,
39(4), 991–1015.
Pischke, Jörn-Steffen (2007) “The Impact of Length of the School Year on Student Performance
and Earnings: Evidence from the German Short School Years,” The Economic Journal,
117(523), 1216-1242.
Pollack, J.M., Atkins-Burnett, S., Najarian, M., & Rock, D.A. (2005). Early Childhood
Longitudinal Study, Kindergarten Class of 1998-99 (ECLS-K), Psychometric Report for
the Fifth Grade (NCES 2006-036), US Department of Education. Washington, DC:
National Center for Education Statistics.
Sarkin, J.A., McKenzie, T.L., & Sallis, J.F. (1997). Gender Differences in Physical Activity
During Fifth-Grade Physical Education and Recess Periods. Journal of Teaching and
Physical Education, 17(1), 99-106.
Schacher, R. (2005), The End of Recess. District Administration, 41(8), 36-41.
“Schools becoming all work and no play” (2001). The Journal of Physical Education.
Recreation & Dance, 72(9), 11.
“School Health Policies and Practices Study” (2000). National Center for Chronic Disease
Prevention and Health Promotion, SHPPS 2000 Data Files and Documentation – State
Level Physical Education and Activity.
Simons-Morton, B.G., Taylor, W.C., Snider, S.A., & Huang, I.W. (1993). The Physical Activity
of Fifth-Grade Students during Physical Education Classes. American Journal of Public
Health, February, Vol. 83, No. 2.
Tremarche, P.V., Robinson, E.M., & Graham, L.B. (2007). Physical Education and its Effect on
Elementary Testing Results. Physical Educator, 64(2), 58–64.
Wingert, P. (2000). Young and Overweight. Newsweek, 135, (24).
Zygmunt-Fillwalk, E. & Bilello, T. (2005). Parents’ Victory in Reclaiming Recess for Their
Children. Childhood Education, 82(1) 19-23.

22
Table 1: Summary Statistics of Test Score Gains
Difference in T-scores Subject Obs. Mean St. Dev. Min Max
Fall Kindergarten/Spring Kindergarten Reading 2890 0.53 6.32 -21.26 24.44
Math 2880 0.26 5.60 -37.65 23.17
First Grade/Kindergarten Reading 5250 -0.16 6.05 -39.39 31.70
Math 5250 0.42 6.28 -37.96 23.35
Third Grade/First Grade Reading 4650 0.18 6.68 -22.29 42.52
Math 4640 0.14 5.87 -25.74 29.54
Fifth Grade/Third Grade Reading 5830 0.33 5.30 -27.39 27.96
Math 2870 -0.02 4.90 -19.59 26.39
Fifth Grade/Kindergarten Reading 1820 0.52 8.98 -36.74 31.36
Math 910 -0.47 7.79 -22.21 30.08
Table 2 - Summary Statistics for School-Based Physical Activity
Kindergarten First Grade Third Grade Fifth Grade
Time per week in Recess Mean 133.4 122.6 119.1 89.4
(in minutes) [St. Dev.] [57.1] [63.3] [62.8] [58.8]
Time per week in PE Mean 68.1 66.7 68.8 78.9
(in minutes) [St. Dev.] [48.8] [43.4] [45.0] [50.7]

23
Table 3 - Recess and PE time by mean school demographics
Weekly Recess Time Weekly PE Time
by socioeconomic status
below median above median below median above median
Mean St. Dev. Mean St. Dev. Mean St. Dev. Mean St. Dev.
Kindergarten 130.0 55.4 136.5 58.4 70.9 47.1 65.6 50.2
First Grade 116.8 63.0 127.1 63.3 68.2 45.1 65.6 41.9
Third Grade 111.7 63.4 124.1 61.9 71.2 47.6 67.1 43.0
Fifth Grade 83.7 59.3 94.0 58.1 80.8 54.6 77.4 47.3
by race
non-white white non-white white
Kindergarten 127.7 50.4 136.2 59.9 69.4 49.7 67.5 48.4
First Grade 110.4 62.2 128.3 63.1 69.1 48.7 65.6 40.6
Third Grade 103.0 61.4 125.9 62.1 73.8 49.3 66.6 42.8
Fifth Grade 80.7 59.6 94.4 57.8 82.0 55.6 77.1 47.5
Summary statistics for fifth graders are based on the reading sample.

24
Table 4: OLS estimates with no control variables
(1) (2) (3) (4) (5) (6) (7) (8) (9) (10)
Kindergarten First-Kindergarten Third-First Grade Fifth-Third Grade Fifth-Kindergarten
reading math reading math reading math reading math reading math
Recess 0.0011 0.0011 -0.0024 -0.0035* 0.0077*** 0.0038* 0.0026 0.0024 0.0013 -0.0012
(0.003) (0.002) (0.002) (0.002) (0.002) (0.002) (0.003) (0.003) (0.002) (0.002)
PE 0.0121*** 0.0074** 0.0003 0.0071** -0.0006 -0.0033 0.0010 -0.0014 0.0036 0.0056**
(0.004) (0.003) (0.003) (0.004) (0.005) (0.003) (0.002) (0.003) (0.003) (0.003)
Constant -0.4467 -0.3931 0.6835* -0.228 -0.6391 -0.0445 0.021 -0.4471 -0.1110 -0.6488
(0.519) (0.408) (0.410) (0.402) (0.472) (0.374) (0.396) (1.393) (0.716) (1.644)
Observations 2,890 2,880 5,250 5,250 4,650 4,640 5,830 2,910 1,820 910
R-squared 0.009 0.004 0.001 0.004 0.005 0.003 0.001 0.001 0.007 0.024
Robust standard errors in parentheses. Standard errors are clustered by school. Regressions weighted
using sample weights. * significant at 5%; ** significant at 1%

25
Table 5: OLS regression with controls
(1) (2) (3) (4) (5) (6) (7) (8) (9) (10)
Kindergarten First-Kindergarten Third-First Grade Fifth-Third Grade Fifth Grade-Kindergarten
reading math reading math reading math reading math reading math
recess -0.0016 -0.0006 -0.0022 -0.0021 0.0045* 0.0032 0.0009 0.0009 0.0028 0.0005
(0.003) (0.003) (0.002) (0.002) (0.003) (0.002) (0.003) (0.003) (0.002) (0.002)
PE 0.0057 0.0027 -0.0022 0.0030 0.0009 -0.0032 0.0022 -0.0009 0.0005 0.0034
(0.004) (0.003) (0.003) (0.003) (0.005) (0.003) (0.002) (0.004) (0.003) (0.003)
state NAEP score -0.0042 -0.0022 -0.0020 -0.0075* -0.0025 -0.0008 -0.0045 -0.0026 0.0086 0.0131
(0.005) (0.003) (0.006) (0.004) (0.003) (0.004) (0.004) (0.003) (0.009) (0.010)
male -0.1758 0.622*** 0.2461 0.514** 0.3776 1.554*** 0.4938* -0.0637 0.5748 3.205***
(0.279) (0.222) (0.252) (0.218) (0.293) (0.245) (0.277) (0.285) (0.700) (0.599)
Hispanic 1.0035* 0.6561 0.3861 1.283*** -0.6689 -0.1465 0.4978 0.3573 1.9737* 1.4331
(0.558) (0.461) (0.545) (0.450) (0.507) (0.406) (0.459) (0.553) (1.121) (1.178)
black -1.1479** -1.671*** 0.4899 -0.0471 -1.778*** -0.5629 -0.5795 -0.4821 -1.1606 0.0545
(0.521) (0.526) (0.524) (0.486) (0.663) (0.535) (0.576) (0.611) (2.005) (1.503)
other 0.6593 0.9309** 0.1053 0.0756 -1.0747* -0.0355 0.6121 1.1723** 3.1910* 3.6278**
(0.530) (0.438) (0.442) (0.425) (0.569) (0.432) (0.637) (0.547) (1.626) (1.514)
Mother's Education
HS dropout -0.5216 -0.6192 -0.6198 0.5200 0.0076 -0.7775 -0.5093 1.3032* 1.4494 3.5041*
(0.669) (0.621) (0.649) (0.582) (0.926) (0.689) (0.664) (0.775) (2.268) (1.962)
high school grad -0.1667 -0.2191 -0.2004 -0.1313 -0.9121 -0.8415* -0.4438 0.1238 1.5257 -0.2440
(0.425) (0.436) (0.435) (0.416) (0.559) (0.448) (0.480) (0.472) (1.459) (1.199)
some college 0.3714 -0.1024 0.0945 -0.1490 -0.9804** -0.7727** -0.6562 0.0905 0.9964 -0.8870
(0.377) (0.345) (0.350) (0.318) (0.459) (0.365) (0.427) (0.431) (1.027) (0.921)
more than a BA 0.1569 0.5006 -0.1140 -0.0985 -0.5109 -0.5561 0.1085 0.4839 -0.8776 -2.0767*
(0.455) (0.424) (0.417) (0.448) (0.533) (0.480) (0.541) (0.587) (1.251) (1.181)
age -0.0057*** -0.005*** -0.005*** -0.006*** -0.0028** -0.0053*** -0.0016 -0.005*** -0.010*** -0.017***
(0.001) (0.001) (0.001) (0.001) (0.001) (0.001) (0.001) (0.001) (0.003) (0.003)
days between tests 0.0572*** 0.0456*** 0.0396*** 0.0401*** 0.0245*** 0.0250*** 0.0057 0.0258*** 0.0104 0.0190*
(0.007) (0.006) (0.007) (0.006) (0.008) (0.006) (0.006) (0.005) (0.013) (0.011)

26
siblings 0.0579 0.0593 0.5471*** 0.1862 -0.3594** 0.0939 0.1160 -0.2221 0.5257 0.5297*
(0.148) (0.112) (0.139) (0.131) (0.145) (0.138) (0.132) (0.142) (0.377) (0.313)
mom in household -1.4598 -1.2931 0.2876 -2.00*** -0.7040 0.3923 -1.5539 -0.7218 1.5798 0.3699
(1.030) (0.882) (0.763) (0.581) (1.283) (0.793) (1.039) (0.705) (2.594) (1.460)
dad in household 0.8203** 0.3693 -0.3462 0.5342 -0.0070 0.7326** 0.2931 0.3362 1.1323 -0.4833
(0.405) (0.353) (0.382) (0.335) (0.447) (0.342) (0.391) (0.458) (0.922) (0.880)
Socioecon. status -0.6874** -0.830*** -0.5226** -0.2581 0.5881* 0.3883 -0.0808 0.1214 1.6160** 0.3336
(0.292) (0.238) (0.240) (0.219) (0.322) (0.262) (0.324) (0.322) (0.795) (0.720)
school size -0.0003 -0.0005 -0.0005 0.0001 0.0004 -0.0002 0.0004 -0.0007 -0.0022 -0.0027
(0.001) (0.001) (0.001) (0.001) (0.001) (0.001) (0.001) (0.001) (0.002) (0.002)
school %minority 0.0075 -0.0004 -0.0086 -0.0009 0.0047 0.0083 0.0026 0.0028 0.0310* 0.0175
(0.006) (0.006) (0.006) (0.005) (0.008) (0.006) (0.007) (0.008) (0.017) (0.016)
private school -1.099*** -0.689** -0.0746 -0.6787** -0.7972* -1.6149*** 0.4676 0.5957 -2.2574** -2.1517**
(0.405) (0.336) (0.384) (0.322) (0.444) (0.375) (0.397) (0.526) (1.040) (0.918)
class size -0.0344 -0.0153 -0.0700** -0.0713** 0.0075 -0.0336 -0.0115 0.0041 0.2031*** 0.0639
(0.031) (0.024) (0.031) (0.029) (0.031) (0.023) (0.013) (0.018) (0.068) (0.054)
teacher tenure 0.6605* 0.6838** -0.0729 -0.0982 -0.2670 -0.4725 0.2806 0.980*** 0.2798 0.0121
(0.388) (0.297) (0.327) (0.291) (0.449) (0.304) (0.344) (0.374) (0.853) (0.858)
Suburbs & large
towns
0.4736 0.5792* 0.1315 -0.4785 -0.3799 -0.4354 0.1392 0.7853* 1.2239 1.1349
(0.412) (0.344) (0.563) (0.352) (0.495) (0.411) (0.425) (0.410) (0.988) (1.014)
small town & rural 0.0177 0.0022 0.0281* -0.0117 0.0095 -0.0104 0.0248 -0.0254 0.0180 -0.0718*
(0.022) (0.016) (0.015) (0.013) (0.018) (0.016) (0.021) (0.021) (0.054) (0.043)
Full-day
Kindergarten
0.4620*** 0.3431***
(0.132) (0.105)
Observations 2,890 2,880 5,250 5,250 4,650 4,640 5,830 2,910 1,820 910
R-squared 0.093 0.073 0.043 0.062 0.042 0.066 0.026 0.066 0.094 0.232
Robust standard errors in parentheses. Standard errors are clustered by school. Regressions weighted using sample weights. Four Census regional dummies included
although coefficients are suppressed. The omitted urbanicity category is "Large and mid-size city". *** p<0.01, ** p<0.05, * p<0.1
27
Table 6: Fixed effects regressions of recess and PE time
(1) (2) (3) (4) (5) (6) (7) (8) (9) (10)
Kindergarten First-Kindergarten Third-First Grade Fifth-Third Grade
Fifth Grade-
Kindergarten
reading math reading math reading math reading math reading math
recess -0.0016 0.0005 -0.0017 -0.0024 0.0045* 0.0032 -0.0004 0.0007 0.0022 0.0002
(0.003) (0.003) (0.002) (0.002) (0.003) (0.002) (0.003) (0.003) (0.003) (0.002)
PE 0.0047 0.0021 -0.0015 0.0053 0.0003 -0.0048 0.0019 0.0001 0.0025 0.0000
(0.004) (0.003) (0.003) (0.003) (0.006) (0.003) (0.003) (0.004) (0.004) (0.003)
Observations 2,890 2,880 5,250 5,250 4,650 4,640 5,830 2,910 1,820 910
R-squared 0.123 0.089 0.067 0.082 0.067 0.089 0.052 0.096 0.140 0.284
Robust standard errors in parentheses. Standard errors are clustered by school. Regressions weighted using sample weights. State
fixed effects and full set of controls included although coefficients are suppressed. *** p<0.01, ** p<0.05, * p<0.1

28
Table 7: Fixed effects regression with male interaction
(1) (2) (3) (4) (5) (6) (7) (8) (9) (10)
Kindergarten First-Kindergarten Third-First Grade Fifth-Third Grade Fifth-Kindergarten
reading math reading math reading math reading math reading math
recess -0.00276 -0.00257 -0.00195 -0.00206 0.00398 0.00361 -0.0015 0.0002 0.0039 -0.0017
(0.004) (0.003) (0.003) (0.002) (0.003) (0.003) (0.004) (0.003) (0.003) (0.003)
PE 0.00405 0.00370 -0.00021 0.00948** -0.00394 -0.00474 0.0022 0.0026 0.0044 -0.0005
(0.005) (0.004) (0.004) (0.004) (0.006) (0.005) (0.003) (0.004) (0.004) (0.003)
male -0.55722 0.06526 0.42021 1.15454** -0.36674 1.60399** 0.3751 0.2387 3.2415 1.5574
(0.703) (0.618) (0.607) (0.582) (0.839) (0.718) (0.716) (0.763) (2.538) (2.149)
recess*male 0.00227 0.00594 0.00051 -0.00037 0.00099 -0.00092 0.0023 0.0010 -0.0036 0.0039
(0.004) (0.004) (0.003) (0.003) (0.004) (0.004) (0.005) (0.005) (0.004) (0.003)
PE*male 0.00129 -0.00333 -0.00238 -0.00771 0.00798 -0.00011 -0.0006 -0.0047 -0.0034 0.0008
(0.006) (0.005) (0.005) (0.005) (0.009) (0.005) (0.004) (0.006) (0.005) (0.004)
Observations 2,890 2,880 5,250 5,250 4,650 4,640 5,830 2,910 1,820 910
R-squared 0.123 0.090 0.068 0.083 0.068 0.089 0.052 0.097 0.141 0.286
Robust standard errors in parentheses. Standard errors are clustered by school. Regressions weighted using sample weights. All columns include
the full set of controls and state fixed effects although coefficients are suppressed. *** p<0.01, ** p<0.05, * p<0.1

29
Table 8: First stage estimates using the math samples
(1) (2) (3) (4) (5) (6) (7) (8) (9) (10)
Kindergarten First-Kindergarten Third-First Grade Fifth-Third Grade Fifth-Kindergarten
recess PE recess PE recess PE recess PE recess PE
PE standards based on national
standards
2.666 -14.08** -2.334 -16.69*** 0.658 -31.0*** -1.733 -35.3*** -25.586 -98.3***
(5.722) (6.324) (5.305) (4.427) (4.813) (4.892) (4.863) (5.543) (20.389) (28.011)
State requires elementary recess -18.184 -6.346 -8.818 -10.050 -11.040 -11.007* -26.8*** -16.589** -112.4*** -68.77**
(12.50) (8.100) (8.833) (6.718) (7.925) (6.649) (10.274) (8.396) (36.086) (34.649)
State recommends elementary
recess
-3.764 -3.168 18.55*** -4.854 11.71** -5.422 13.133** -6.584 18.473 -58.3***
(6.773) (5.708) (5.903) (3.786) (5.449) (3.424) (5.893) (4.238) (22.342) (18.991)
State requires fitness test 7.663 16.753** 2.477 9.399* 3.520 11.128** 14.768** 16.910*** 57.890** 35.080
(6.863) (6.983) (6.278) (4.821) (6.013) (4.484) (7.292) (5.321) (24.666) (24.253)
State recommends fitness test 2.856 3.932 2.917 12.959*** 8.667 4.259 5.418 1.977 0.058 22.645
(6.990) (4.797) (6.342) (5.011) (5.412) (3.648) (6.801) (4.654) (23.979) (21.654)
F-test 0.93 1.51 3.02 6.00 2.58 9.83 5.27 9.57 2.99 7.41
p-value 0.4615 0.1843 0.0104 0.0000 0.0250 0.0000 0.0001 0.0000 0.0116 0.0000
Shea Partial R-squared 0.0089 0.0165 0.0140 0.0306 0.0142 0.0650 0.0306 0.0751 0.0483 0.0984
Underidentification tests
Cragg-Donald N*minEval stat. 25.99 72.59 53.52 86.18 46.24
p-value 0.0000 0.0000 0.0000 0.0000 0.0000
Anderson canon. Corr. LR 25.88 72.09 53.21 84.93 45.10
p-value 0.0000 0.0000 0.0000 0.0000 0.0000
Cragg-Donald (N-L)*minEval/L2
F-stat 5.14 14.43 10.63 17.05 8.93
(weak identification)
Stock-Yogo (2005) 5% critical value = 9.92
J 0.65 3.309 1.722 7.948 3.759
p-value 0.8849 0.3463 0.6320 0.0471 0.2887
Robust standard errors in parentheses. Standard errors are clustered by school. Regressions weighted using sample weights. All columns include the full set of
controls including four Census regional dummies although coefficients are suppressed. All columns use the math sample. *** p<0.01, ** p<0.05, * p<0.1

30
Table 9: Instrumental Variables estimates
(1) (2) (3) (4) (5) (6) (7) (8) (9) (10)
Kindergarten First-Kindergarten Third-First Grade Fifth-Third Grade Fifth-Kindergarten
reading math reading math reading math reading math reading math
recess -0.0692* -0.0594 -0.0218 0.0187 -0.0218 0.0111 0.0017 -0.0063 -0.0316 -0.0076
(0.041) (0.038) (0.021) (0.020) (0.026) (0.022) (0.018) (0.016) (0.024) (0.012)
PE 0.0105 0.0164 -0.0132 -0.0293 0.0035 -0.0067 -0.0040 -0.0165 -0.0191 -0.0043
(0.036) (0.031) (0.022) (0.022) (0.015) (0.012) (0.013) (0.012) (0.013) (0.008)
Observations 2,890 2,880 5,250 5,250 4,650 4,640 5,830 2,910 1,820 910
R-squared -0.165 -0.183 0.006 -0.031 -0.002 0.060 0.023 0.038 -0.216 0.197
Robust standard errors in parentheses. Standard errors are clustered by school. Regressions weighted using sample weights. All columns
include the full set of controls including four Census region dummies although coefficients are suppressed. *** p<0.01, ** p<0.05, *
p<0.1

31
Table 10: Fixed effects regressions of recess and PE time with time in academics
(1) (2) (3) (4) (5) (6) (7) (8) (9) (10) (11) (12)
Kindergarten Third-First Grade Fifth-Third Grade
reading math reading math reading math
Recess -0.0018 -0.0028 0.0008 0.0008 0.0059** 0.0057** 0.0031 0.0031 0.0043 0.0043 -0.0014 -0.0010
(0.003) (0.003) (0.003) (0.003) (0.003) (0.003) (0.002) (0.002) (0.003) (0.003) (0.003) (0.003)
PE 0.0058 0.0063 0.0022 0.0020 0.0011 0.0009 -0.0048 -0.0048 0.0014 0.0013 0.0072 0.0075*
(0.004) (0.004) (0.003) (0.003) (0.006) (0.006) (0.004) (0.004) (0.003) (0.003) (0.004) (0.004)
Reading 0.0040*** 0.0025* -0.0001
(0.001) (0.001) (0.001)
Academic (not reading) -0.0019** -0.0004 0.00001
(0.001) (0.001) (0.001)
Math -0.0001 0.0018 0.0042**
(0.001) (0.002) (0.002)
Academic (not math) 0.0006 -0.0004 -0.0003
(0.001) (0.001) (0.001)
Observations 2670 2670 2660 2660 4170 4170 4170 4170 5280 5280 2140 2140
R-squared 0.124 0.130 0.097 0.098 0.074 0.075 0.086 0.086 0.060 0.060 0.120 0.125
Robust standard errors in parentheses. Standard errors are clustered by school. Regressions weighted using sample weights. State fixed effects and full set of
controls included although coefficients are suppressed. *** p<0.01, ** p<0.05, * p<0.1

32
Appendix:
Kindergarten Spring (obs 2890) First Grade Spring (obs 5250)
Variable Mean Std. Dev. Min Max Mean Std. Dev. Min Max
PE standards based on national standards 0.68 0.46 0 1 0.67 0.47 0 1
State requires elementary recess 0.11 0.32 0 1 0.11 0.31 0 1
State recommends elementary recess 0.18 0.38 0 1 0.15 0.36 0 1
State requires fitness test 0.28 0.45 0 1 0.25 0.43 0 1
State recommends fitness test 0.16 0.37 0 1 0.15 0.36 0 1
state NAEP score (Reading) 9.66 44.14 0 211.34 5.31 33.08 0 211.34
state NAEP score (Math) 9.93 45.37 0 217.22 5.46 34.00 0 217.22
male 0.50 0.50 0 1 0.50 0.50 0 1
Hispanic 0.13 0.33 0 1 0.13 0.34 0 1
black 0.12 0.32 0 1 0.09 0.28 0 1
other 0.09 0.29 0 1 0.10 0.30 0 1
Mother's Education
HS dropout 0.08 0.27 0 1 0.08 0.26 0 1
high school grad 0.29 0.45 0 1 0.26 0.44 0 1
some college 0.33 0.47 0 1 0.35 0.48 0 1
more than a BA 0.11 0.31 0 1 0.11 0.31 0 1
age 2246.08 129.20 1747 2770 2612.59 129.75 2116 3303
days between tests 186.24 20.23 126 261 363.30 19.90 294 438
siblings 1.41 1.06 0 10 1.48 1.06 0 10
mom in house 0.98 0.13 0 1 0.99 0.12 0 1
dad in house 0.83 0.38 0 1 0.85 0.36 0 1
Socioecon. status 0.17 0.80 -4.75 2.75 0.19 0.79 -2.59 2.88
school size 463.52 237.23 75 875 485.86 240.53 75 875
school %minority 31.74 31.63 -9 100 29.93 30.48 -9 101.33
private school 0.25 0.43 0 1 0.25 0.43 0 1
class size 20.60 5.51 2 51 21.03 4.62 4 52
urbanicity type 3.68 2.11 1 7 3.54 1.97 1 7
teacher tenure 9.42 7.94 0.5 36 9.32 8.41 0.1 37
class hours 5.71 1.53 2.5 8

33
Third Grade (obs 4650) Fifth Grade (obs 5830)
Variable Mean Std. Dev. Min Max Mean Std. Dev. Min Max
PE standards based on national standards 0.70 0.46 0 1 0.67 0.47 0 1
State requires elementary recess 0.10 0.31 0 1 0.10 0.30 0 1
State recommends elementary recess 0.16 0.36 0 1 0.14 0.34 0 1
State requires fitness test 0.25 0.43 0 1 0.25 0.43 0 1
State recommends fitness test 0.17 0.38 0 1 0.17 0.37 0 1
state NAEP score (Reading) 4.87 31.70 0 211.34 5.70 34.23 0 211.34
state NAEP score (Math) 5.00 32.59 0 217.22 5.85 35.18 0 217.22
male 0.49 0.50 0 1 0.50 0.50 0 1
Hispanic 0.13 0.33 0 1 0.17 0.38 0 1
black 0.08 0.26 0 1 0.10 0.30 0 1
other 0.10 0.29 0 1 0.10 0.30 0 1
Mother's Education
HS dropout 0.07 0.26 0 1 0.09 0.29 0 1
high school grad 0.23 0.42 0 1 0.24 0.42 0 1
some college 0.36 0.48 0 1 0.35 0.48 0 1
more than a BA 0.12 0.33 0 1 0.13 0.33 0 1
age 3336.80 131.74 2630 4001 4041.22 132.27 3326 4962
days between tests 725.97 21.99 637 793 707.17 27.99 615 791
siblings 1.52 1.08 0 11 1.55 1.11 0 12
mom in house 0.99 0.12 0 1 0.98 0.13 0 1
dad in house 0.84 0.37 0 1 0.81 0.39 0 1
Socioecon. status 0.15 0.78 -2.49 2.58 0.08 0.81 -2.48 2.54
school size 461.13 223.66 75 875 483.09 218.35 75 875
school %minority 29.21 29.63 -9 100 35.61 31.59 -9 87.5
private school 0.26 0.44 0 1 0.21 0.41 0 1
class size 21.56 5.76 4 83 22.82 8.40 1 146
urbanicity type 3.63 1.99 1 7 1.86 0.77 1 3
teacher tenure 9.74 8.31 0.5 40.5 8.59 7.24 1 42