Recent developments on the fish markets in Russia and Ukraine ”Fishery today and tomorrow”...
35
Recent developments on the fish markets in Russia and Ukraine ”Fishery today and tomorrow” January 25, 2012 Tallinn, Estonia Ekaterina Tribilustova, Market Specialist, EUROFISH
-
Upload
anna-andrews -
Category
Documents
-
view
216 -
download
2
Transcript of Recent developments on the fish markets in Russia and Ukraine ”Fishery today and tomorrow”...
Recent developments on the fish markets in Russia
and Ukraine
”Fishery today and tomorrow”January 25, 2012 Tallinn, Estonia
Ekaterina Tribilustova, Market Specialist, EUROFISH
Structure of presentation
Russia- overview of the market
- trade- tendencies
Ukraine- market structure
- latest trade developments
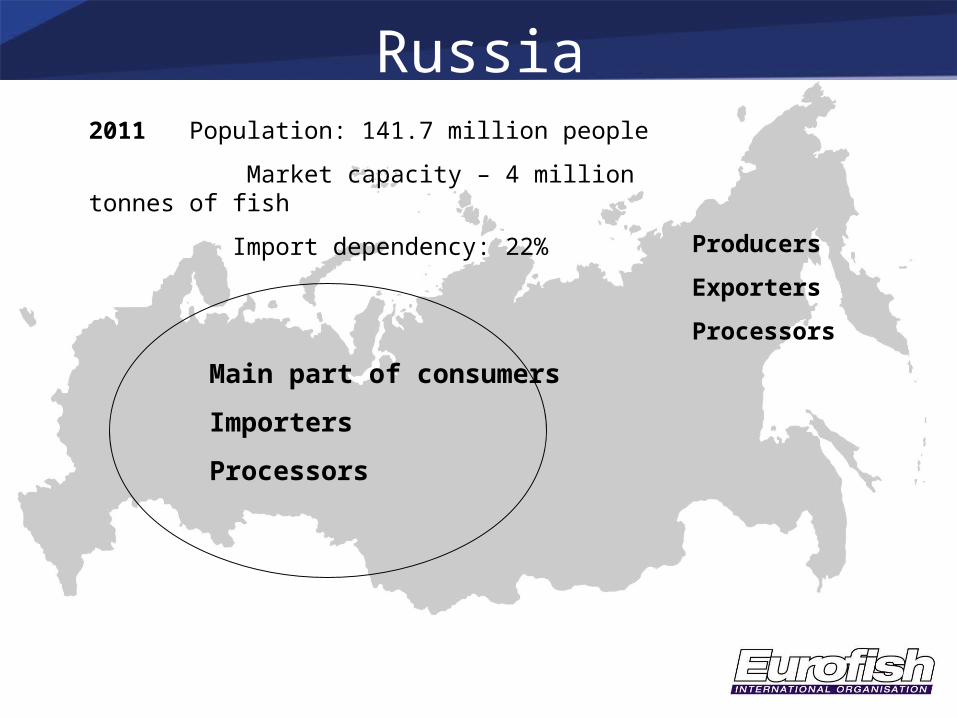
Russia2011 Population: 141.7 million people
Market capacity – 4 million tonnes of fish
Import dependency: 22%
Main part of consumers
Importers
Processors
Producers
Exporters
Processors
Russian market
Most important changes in the fishery sector since 2009:
- Transition to the allocation of TAC for a 10-years period;- Securing the right to use fish grounds up to a 20-years period;- Regulation for all fish caught in Russian EZ and its territorial
waters must be landed in Russian ports. 10% rate for using of bioresources when delivering fish to Russian ports and 100% when making calls to foreign ports;
- Waiting procedures in Russian ports decreased to 3 hours from several days;
- Decision to subsidize parts of the interest rates of Russian fish companies, etc.
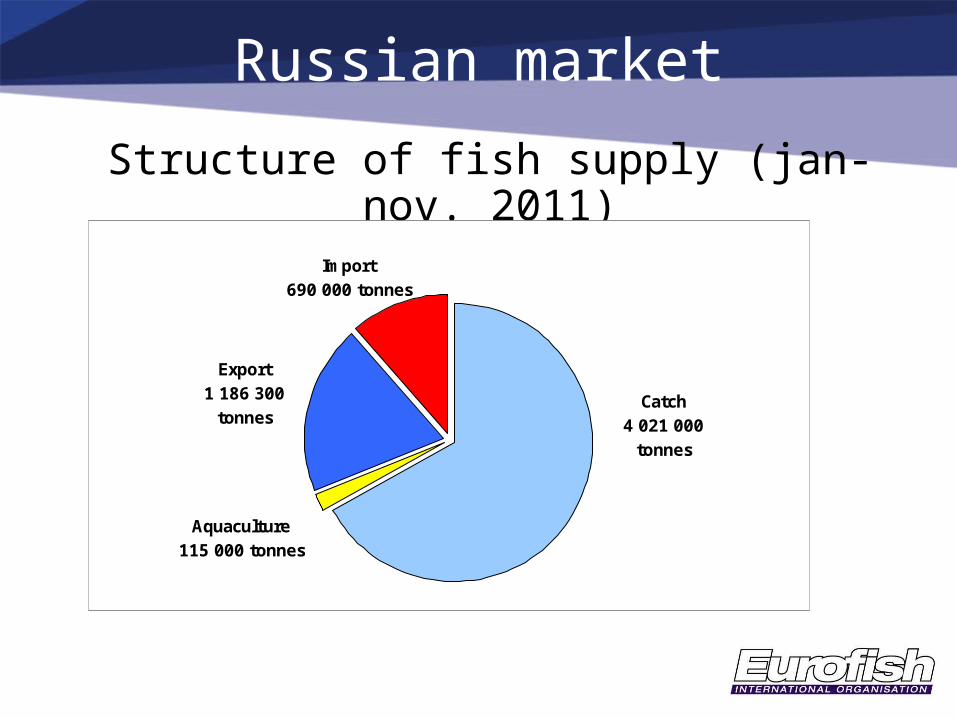
Russian market
Structure of fish supply (jan-nov. 2011)
Russian market
Catch 4 021 000
tonnes
Import 690 000 tonnes
Export 1 186 300
tonnes
Aquaculture 115 000 tonnes
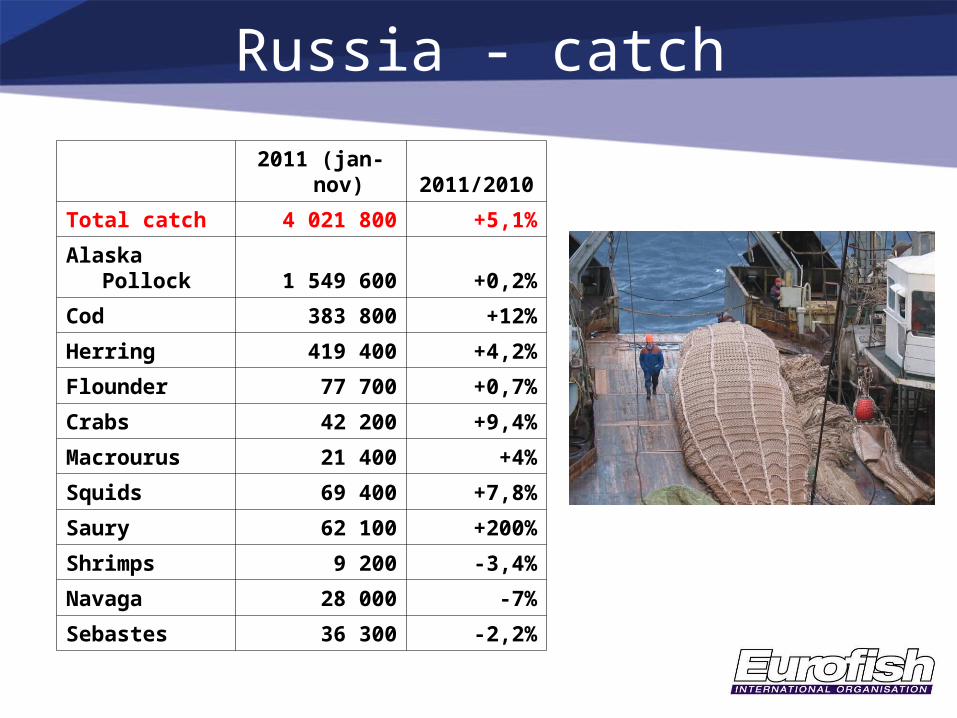
Russia - catch
2011 (jan-
nov)2011/201
0
Total catch 4 021 800 +5,1%
Alaska Pollock 1 549 600 +0,2%
Cod 383 800 +12%
Herring 419 400 +4,2%
Flounder 77 700 +0,7%
Crabs 42 200 +9,4%
Macrourus 21 400 +4%
Squids 69 400 +7,8%
Saury 62 100 +200%
Shrimps 9 200 -3,4%
Navaga 28 000 -7%
Sebastes 36 300 -2,2%
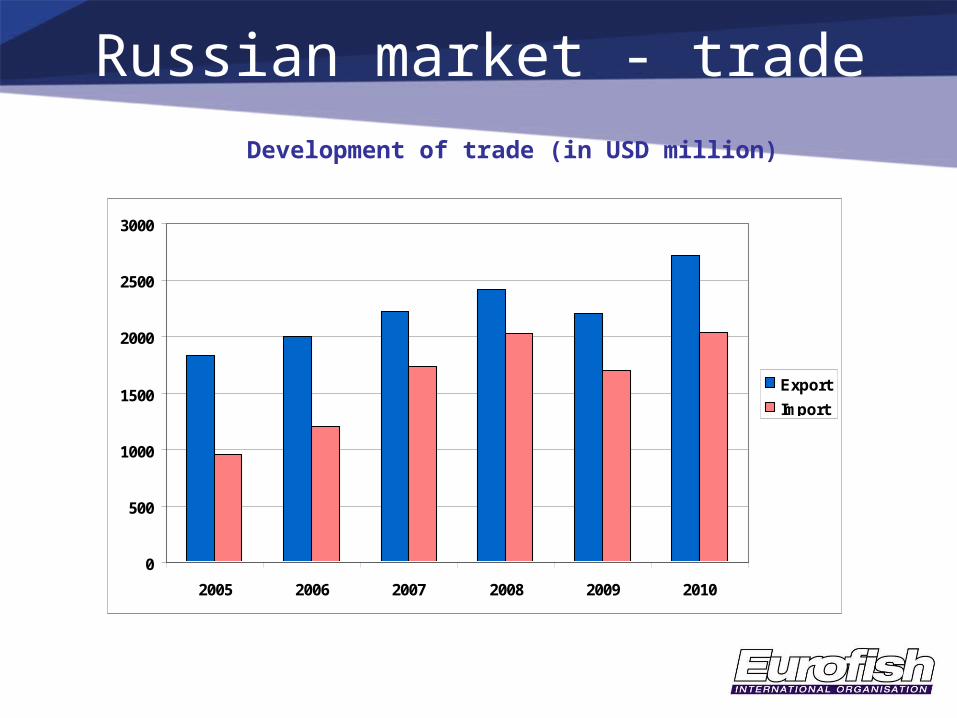
Russian market - tradeDevelopment of trade (in USD million)
0
500
1000
1500
2000
2500
3000
2005 2006 2007 2008 2009 2010
Export
Import
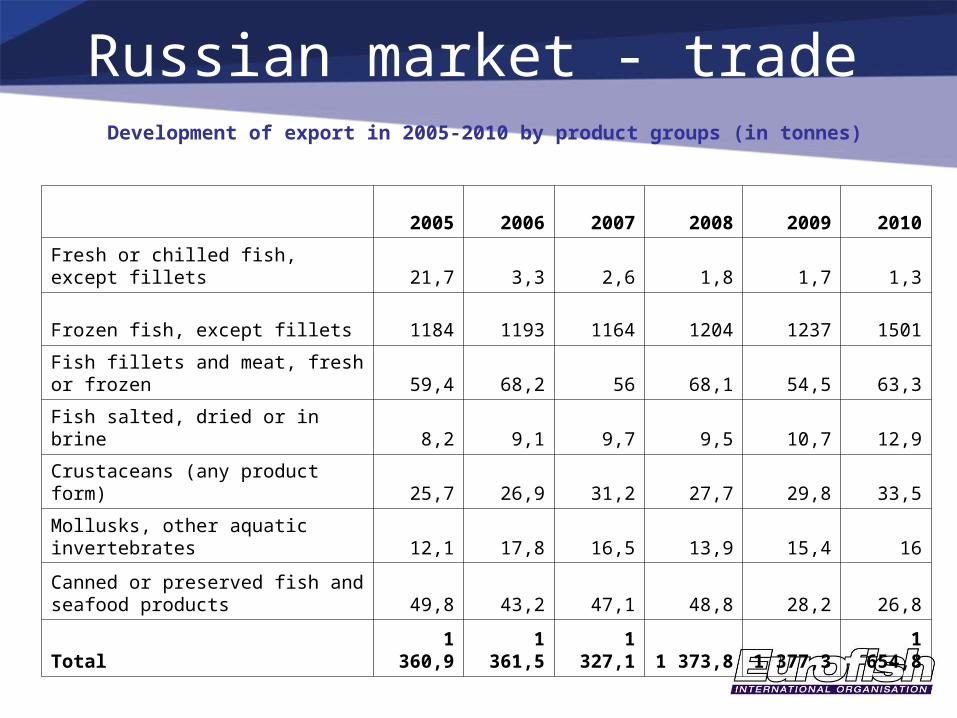
Russian market - tradeDevelopment of export in 2005-2010 by product groups (in tonnes)
2005 2006 2007 2008 2009 2010
Fresh or chilled fish, except fillets 21,7 3,3 2,6 1,8 1,7 1,3
Frozen fish, except fillets 1184 1193 1164 1204 1237 1501
Fish fillets and meat, fresh or frozen 59,4 68,2 56 68,1 54,5 63,3
Fish salted, dried or in brine 8,2 9,1 9,7 9,5 10,7 12,9
Crustaceans (any product form) 25,7 26,9 31,2 27,7 29,8 33,5
Mollusks, other aquatic invertebrates 12,1 17,8 16,5 13,9 15,4 16
Canned or preserved fish and seafood products 49,8 43,2 47,1 48,8 28,2 26,8
Total1
360,91
361,51
327,1 1 373,8 1 377,31
654,8
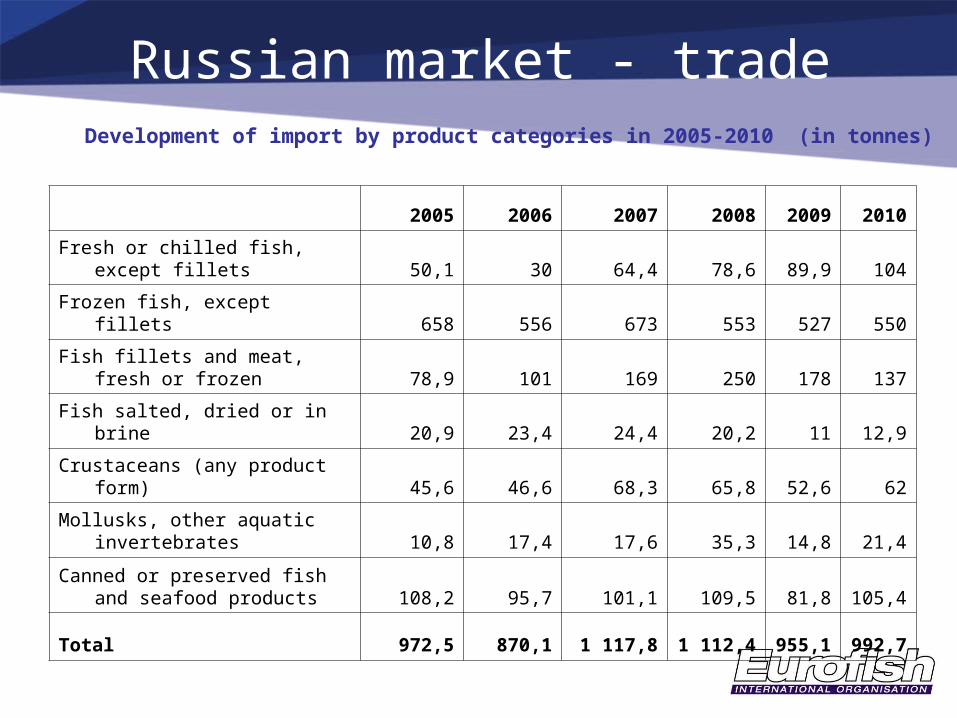
Russian market - tradeDevelopment of import by product categories in 2005-2010 (in tonnes)
2005 2006 2007 2008 2009 2010
Fresh or chilled fish, except fillets 50,1 30 64,4 78,6 89,9 104
Frozen fish, except fillets 658 556 673 553 527 550
Fish fillets and meat, fresh or frozen 78,9 101 169 250 178 137
Fish salted, dried or in brine 20,9 23,4 24,4 20,2 11 12,9
Crustaceans (any product form) 45,6 46,6 68,3 65,8 52,6 62
Mollusks, other aquatic invertebrates 10,8 17,4 17,6 35,3 14,8 21,4
Canned or preserved fish and seafood products 108,2 95,7 101,1 109,5 81,8 105,4
Total 972,5 870,1 1 117,8 1 112,4955,
1992,
7
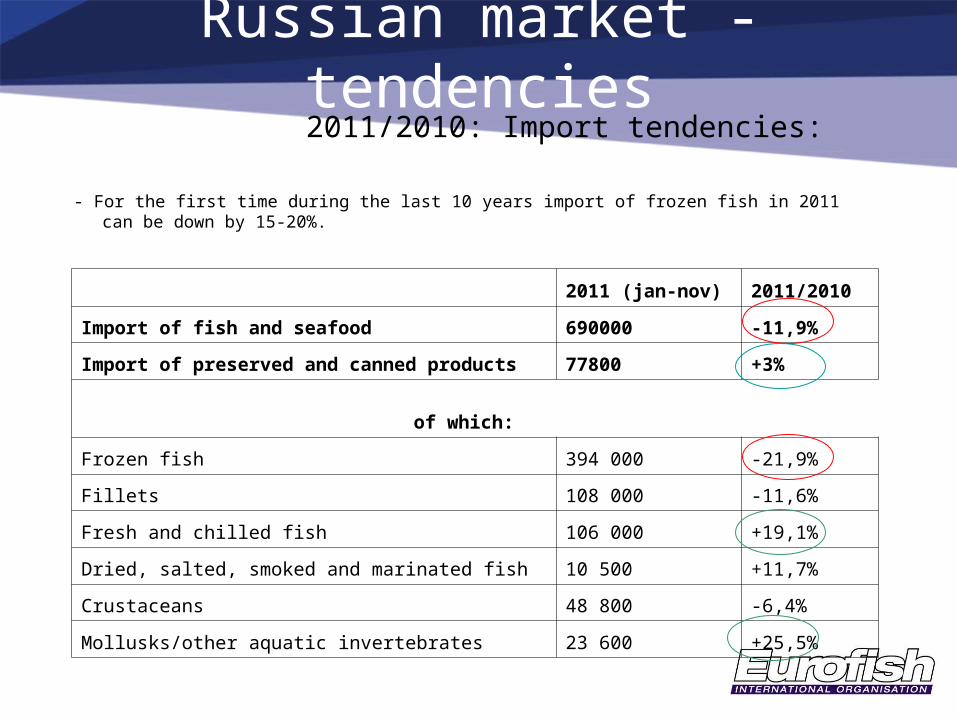
Russian market - tendencies 2011/2010: Import tendencies:
- For the first time during the last 10 years import of frozen fish in 2011 can be down by 15-20%.
2011 (jan-nov) 2011/2010
Import of fish and seafood 690000 -11,9%
Import of preserved and canned products 77800 +3%
of which:
Frozen fish 394 000 -21,9%
Fillets 108 000 -11,6%
Fresh and chilled fish 106 000 +19,1%
Dried, salted, smoked and marinated fish 10 500 +11,7%
Crustaceans 48 800 -6,4%
Mollusks/other aquatic invertebrates 23 600 +25,5%
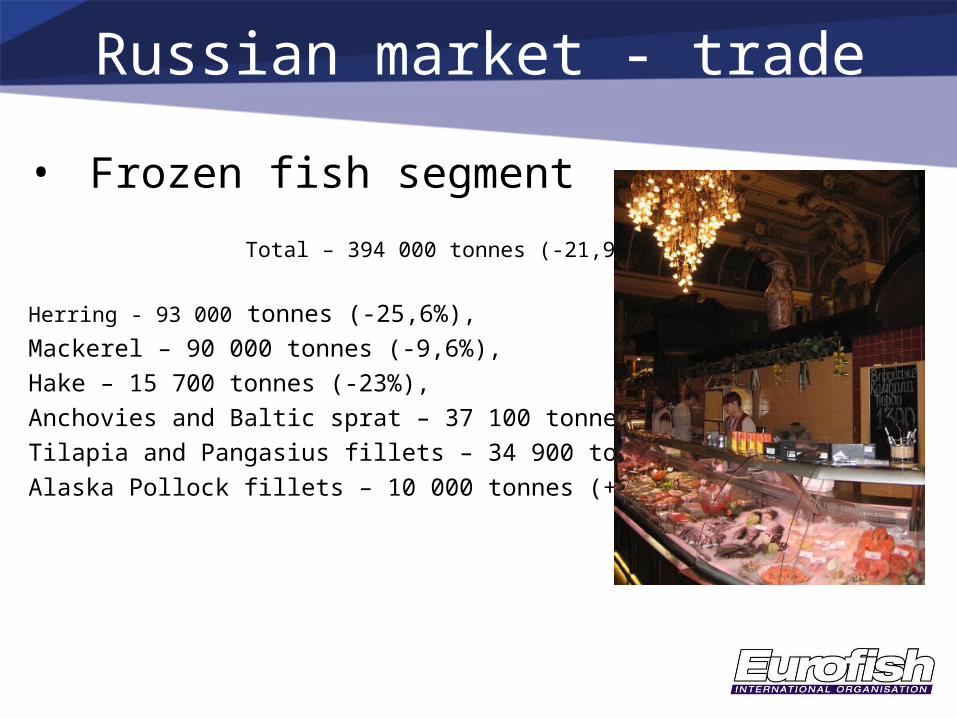
Russian market - trade
• Frozen fish segment
Total – 394 000 tonnes (-21,9%)
Herring - 93 000 tonnes (-25,6%),Mackerel – 90 000 tonnes (-9,6%),Hake – 15 700 tonnes (-23%),Anchovies and Baltic sprat – 37 100 tonnes (-20,9%),Tilapia and Pangasius fillets – 34 900 tonnes (- 19,2%) Alaska Pollock fillets – 10 000 tonnes (+250%)
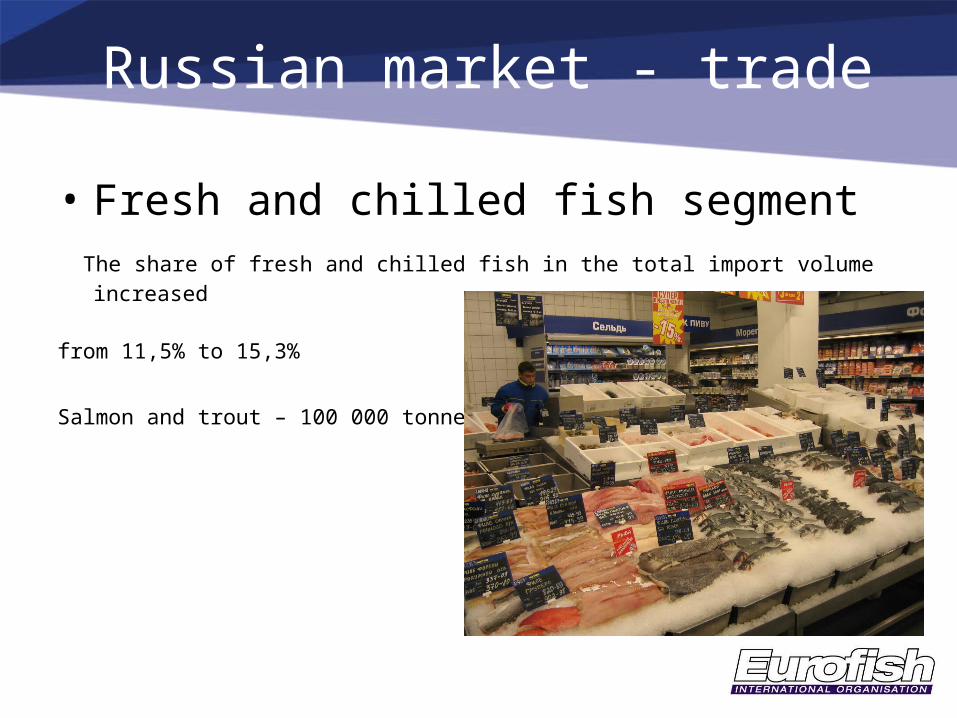
Russian market - trade
• Fresh and chilled fish segment The share of fresh and chilled fish in the total import volume increased
from 11,5% to 15,3%
Salmon and trout – 100 000 tonnes (+20%)
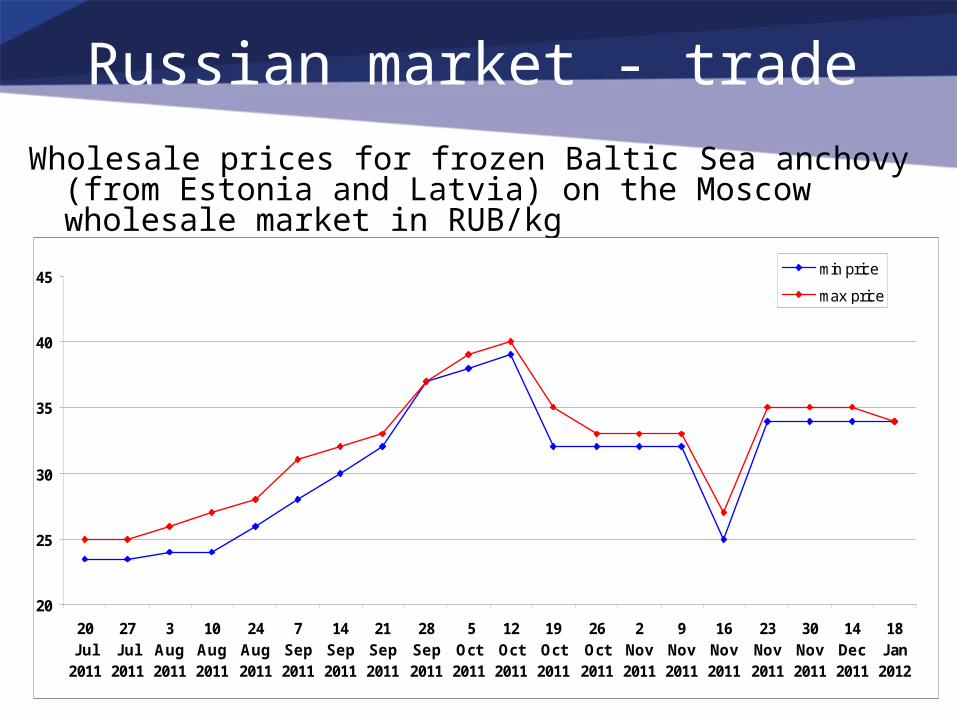
Russian market - trade
Wholesale prices for frozen Baltic Sea anchovy (from Estonia and Latvia) on the Moscow wholesale market in RUB/kg
20
25
30
35
40
45
20Jul
2011
27Jul
2011
3Aug2011
10Aug2011
24Aug2011
7Sep2011
14Sep2011
21Sep2011
28Sep2011
5Oct2011
12Oct2011
19Oct2011
26Oct2011
2Nov2011
9Nov2011
16Nov2011
23Nov2011
30Nov2011
14Dec2011
18Jan2012
min price
max price
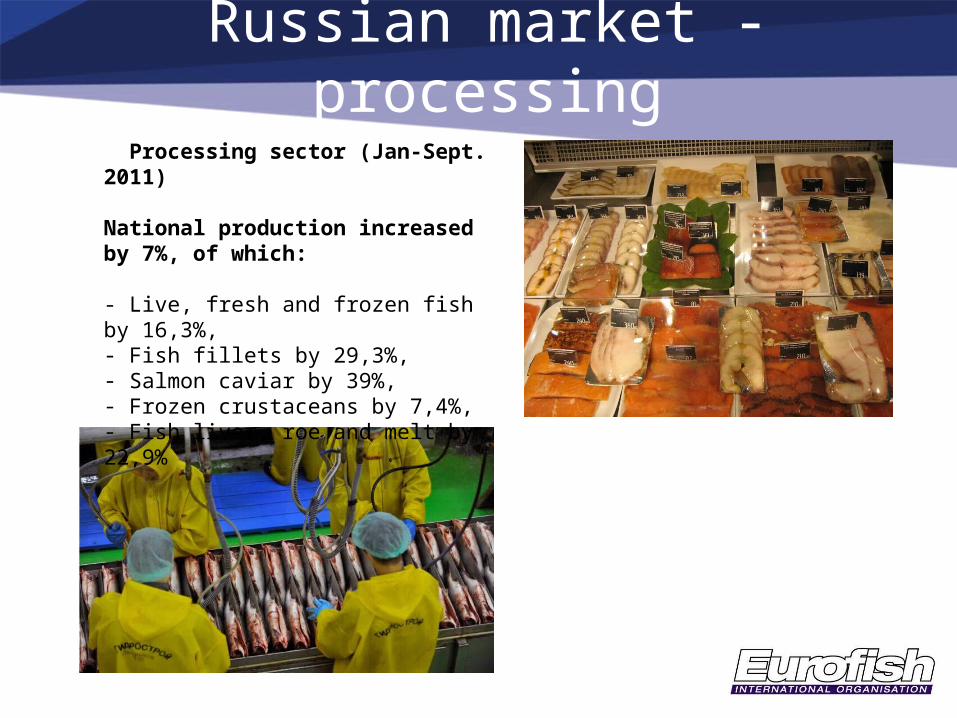
Russian market - processing Processing sector (Jan-Sept. 2011)
National production increased by 7%, of which:
- Live, fresh and frozen fish by 16,3%,- Fish fillets by 29,3%,- Salmon caviar by 39%,- Frozen crustaceans by 7,4%,- Fish liver, roe and melt by 22,9%
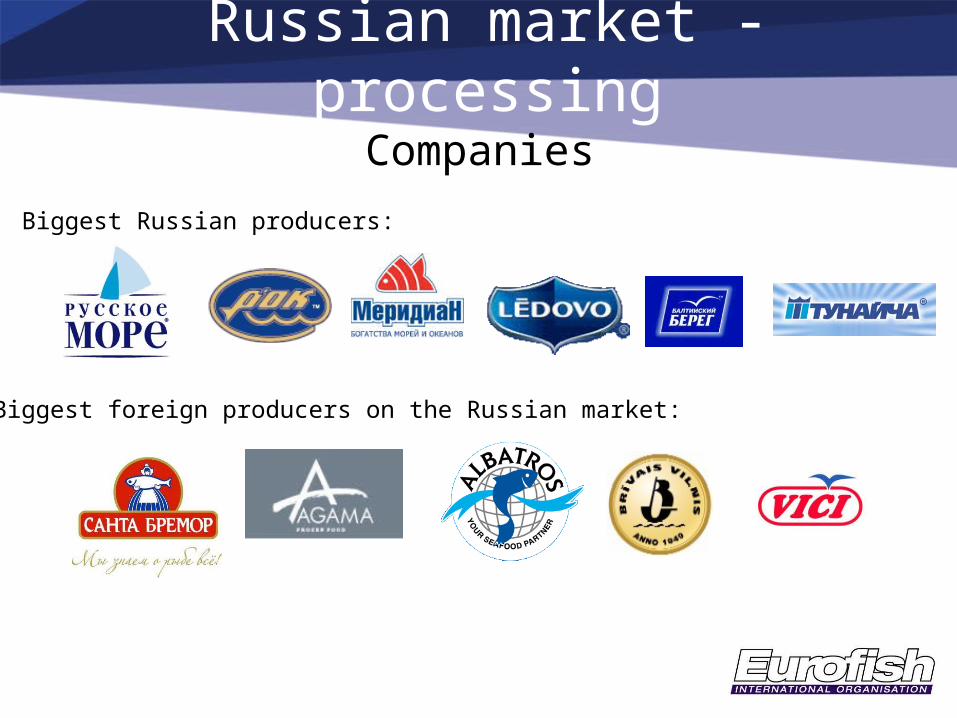
Companies
Russian market - processing
Biggest foreign producers on the Russian market:
Biggest Russian producers:
Russian market - tendencies
• Growing catch and export, while decreasing import. During the last 3 years - active import substituting tendency (target - 80:20). Current ratio is 78:20. Stable catch growth of 4-5% is displacing import.
• Falling import of frozen fish but increasing import of ready-to-eat canned and preserved products and fillets.
• Major part of import is ready products (frozen, fresh or canned) which goes directly to the retail (via importing companies) without processing.
Russian market - tendencies
• Average annual growth of retail sales of fish and seafood is 6-7% (jan-nov. 2011).
• Growing consumption – 26,4 - 26,9 kg per capita (salmon, flounder, cod, herring, mackerel, saury).
• Increasing consumption of fresh and chilled fish, fillets, fish liver, milt and caviar, and ready-to-eat products.
Structure of consumer purchases in Russia
- Fish and seafood – 1.7% of consumer spending,
- Fish and seafood – 5,7% of per capita food product spending,
- Central Federal District – the highest per capita spending for fish and seafood (6.3% or 215 RUB per month),
- Moscow – 7% or 309 RUB per month
Russian market - tendencies
Russian market - tendenciesWTO and the Russian market:
- Lower import tariffs for ready-to-eat fish product (from 15% to 12-12,5%);
- Lower import tariffs for raw material fish (form 10% to 6-8% and in some cases down to 5-3%);
- Consolidation of fishery industry and merging and enlargement of the main industry players.
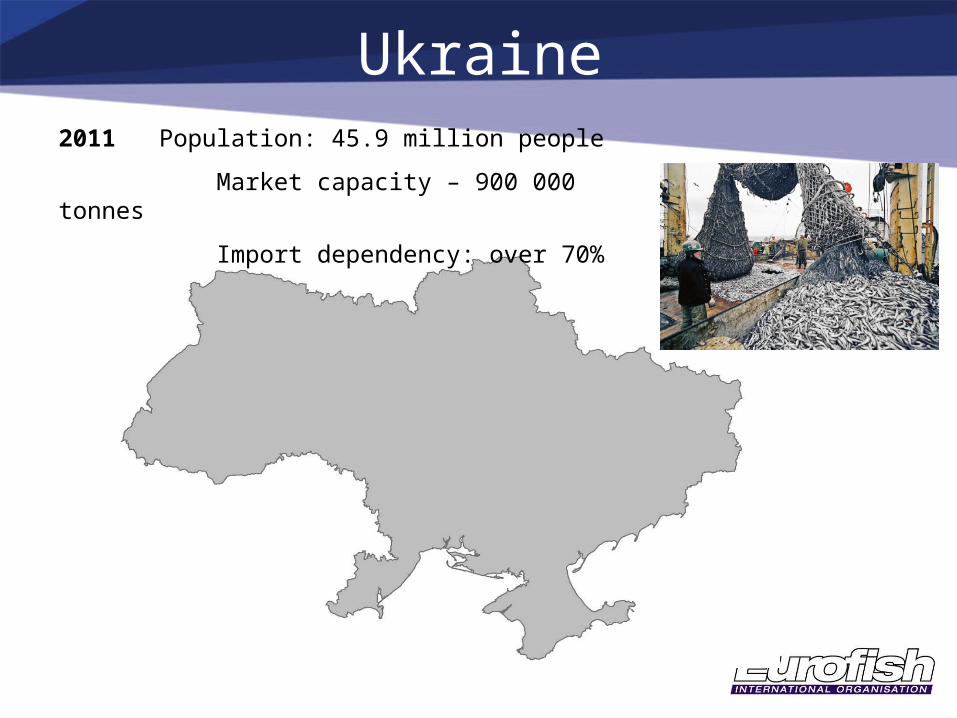
Ukraine2011 Population: 45.9 million people
Market capacity – 900 000 tonnes
Import dependency: over 70%
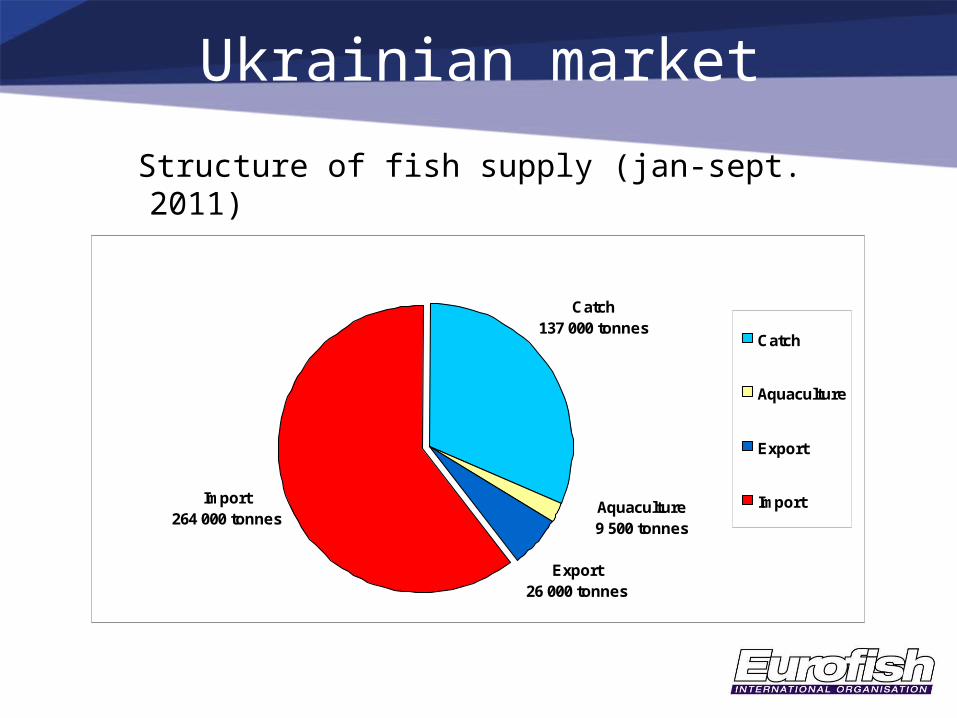
Ukrainian market
Structure of fish supply (jan-sept. 2011)
Import 264 000 tonnes
Catch 137 000 tonnes
Aquaculture 9 500 tonnes
Export 26 000 tonnes
Catch
Aquaculture
Export
Import
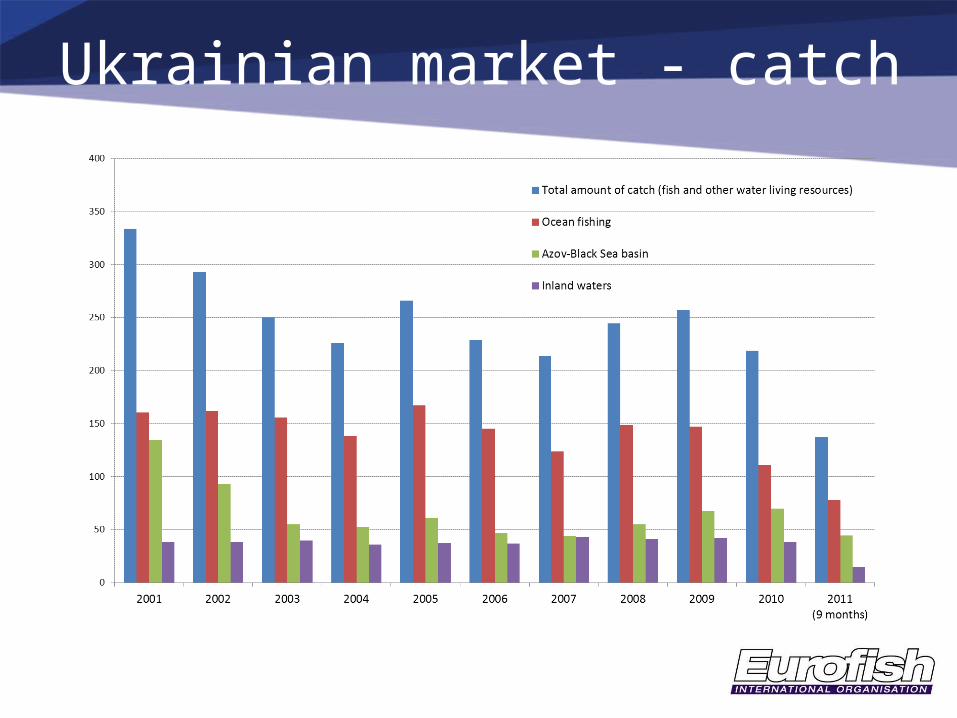
Ukrainian market - catch
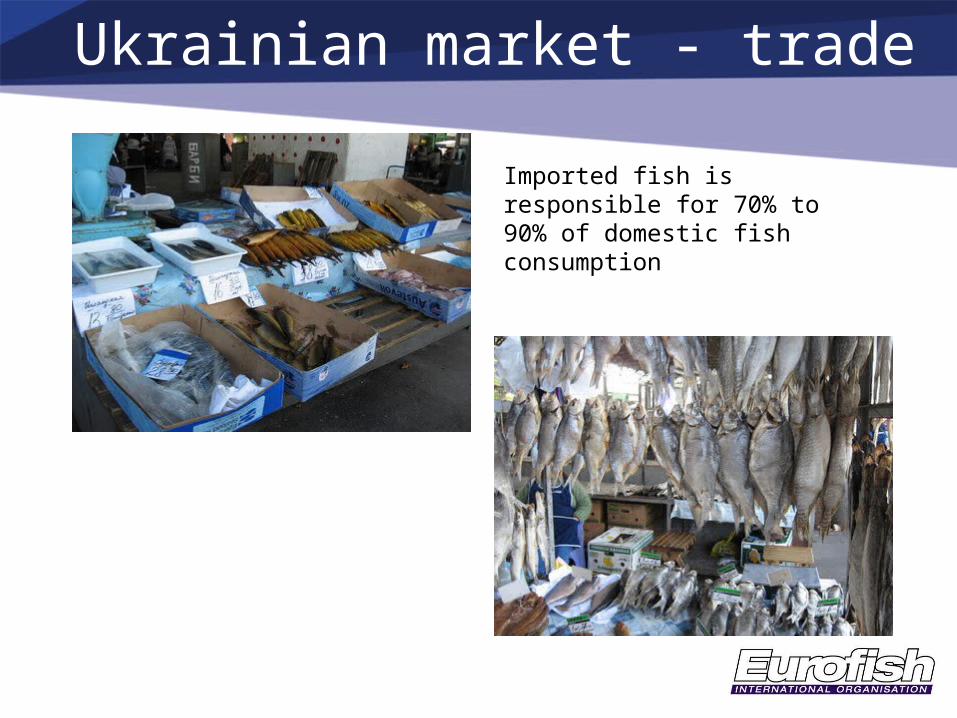
Ukrainian market - trade
Imported fish is responsible for 70% to 90% of domestic fish consumption
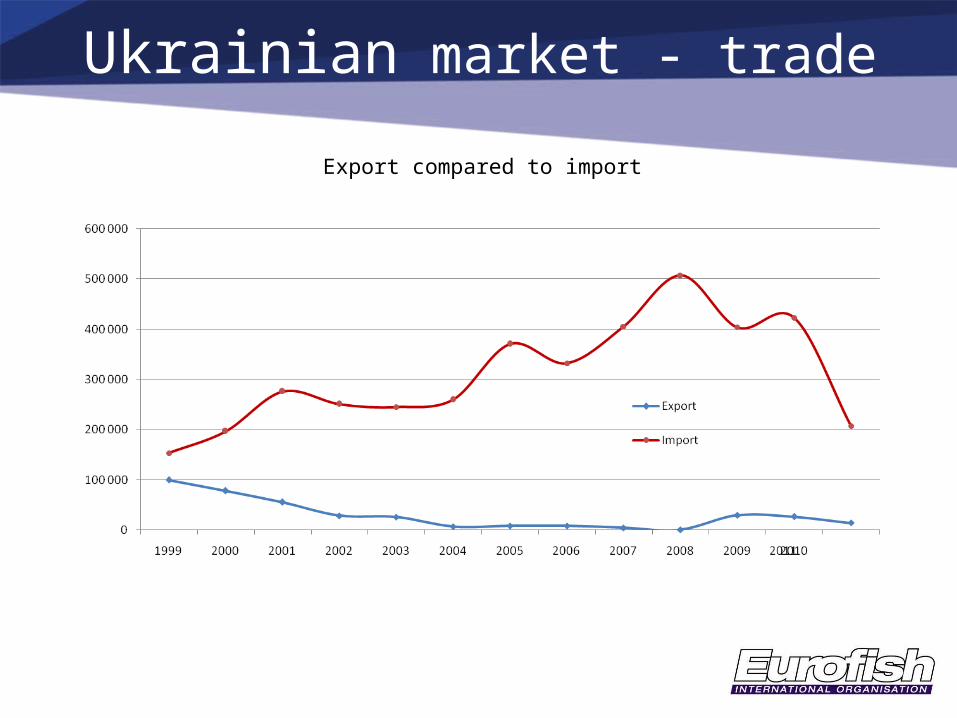
Ukrainian market - trade
Export compared to import
Ukrainian market - trade
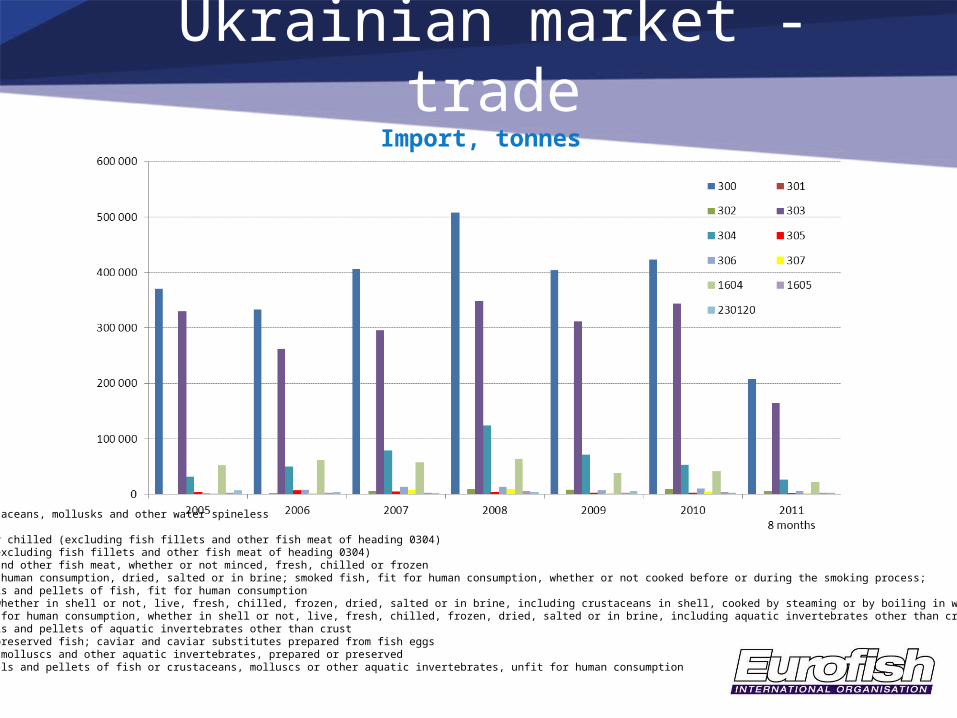
300 - Fish and crustaceans, mollusks and other water spineless301 - Live fish302 - Fish, fresh or chilled (excluding fish fillets and other fish meat of heading 0304)303 - Frozen fish (excluding fish fillets and other fish meat of heading 0304)304 - Fish fillets and other fish meat, whether or not minced, fresh, chilled or frozen305 - Fish, fit for human consumption, dried, salted or in brine; smoked fish, fit for human consumption, whether or not cooked before or during the smoking process; flours, meals and pellets of fish, fit for human consumption306 - Crustaceans, whether in shell or not, live, fresh, chilled, frozen, dried, salted or in brine, including crustaceans in shell, cooked by steaming or by boiling in water307 - Molluscs, fit for human consumption, whether in shell or not, live, fresh, chilled, frozen, dried, salted or in brine, including aquatic invertebrates other than crustaceans and molluscs; flours, meals and pellets of aquatic invertebrates other than crust1604 - Prepared or preserved fish; caviar and caviar substitutes prepared from fish eggs1605 - Crustaceans, molluscs and other aquatic invertebrates, prepared or preserved230120 - Flours, meals and pellets of fish or crustaceans, molluscs or other aquatic invertebrates, unfit for human consumption
Import, tonnes
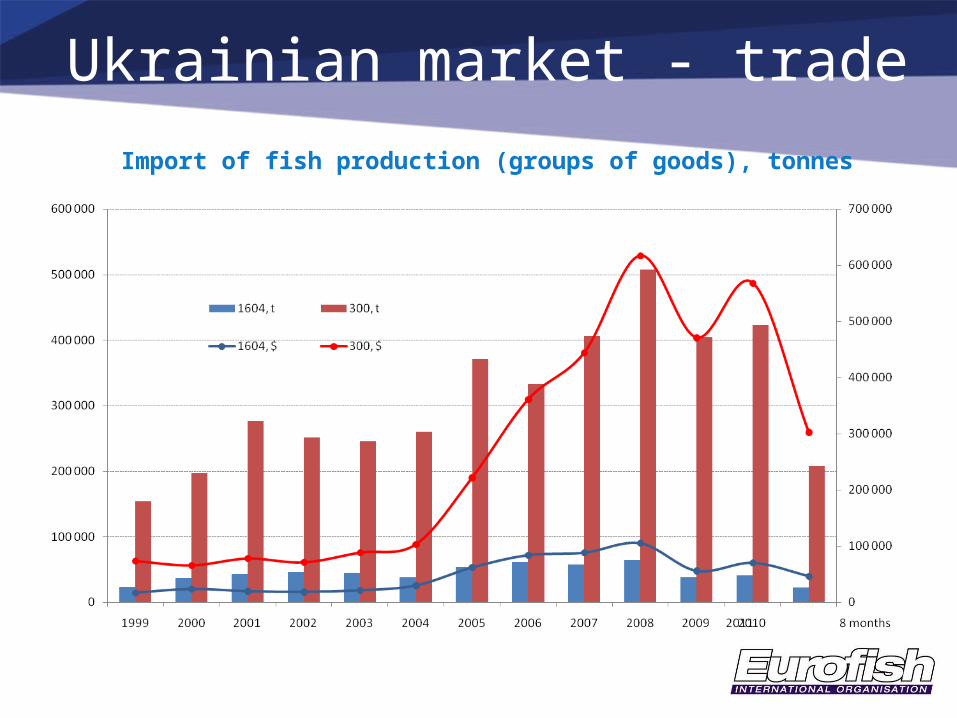
Ukrainian market - trade
Import of fish production (groups of goods), tonnes
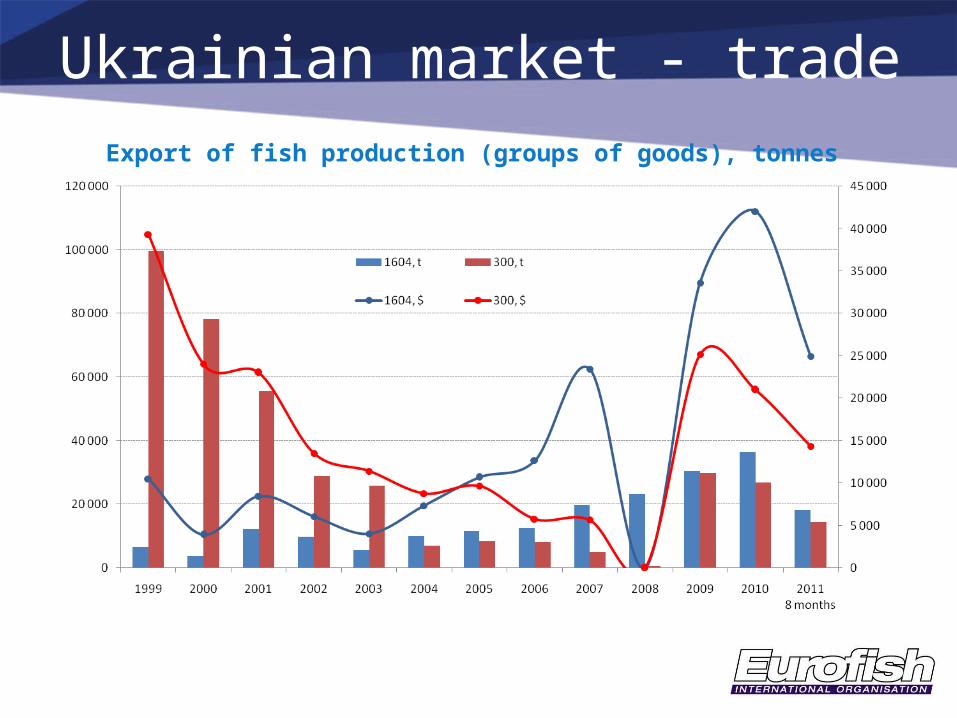
Ukrainian market - tradeExport of fish production (groups of goods), tonnes
Ukrainian market - trade
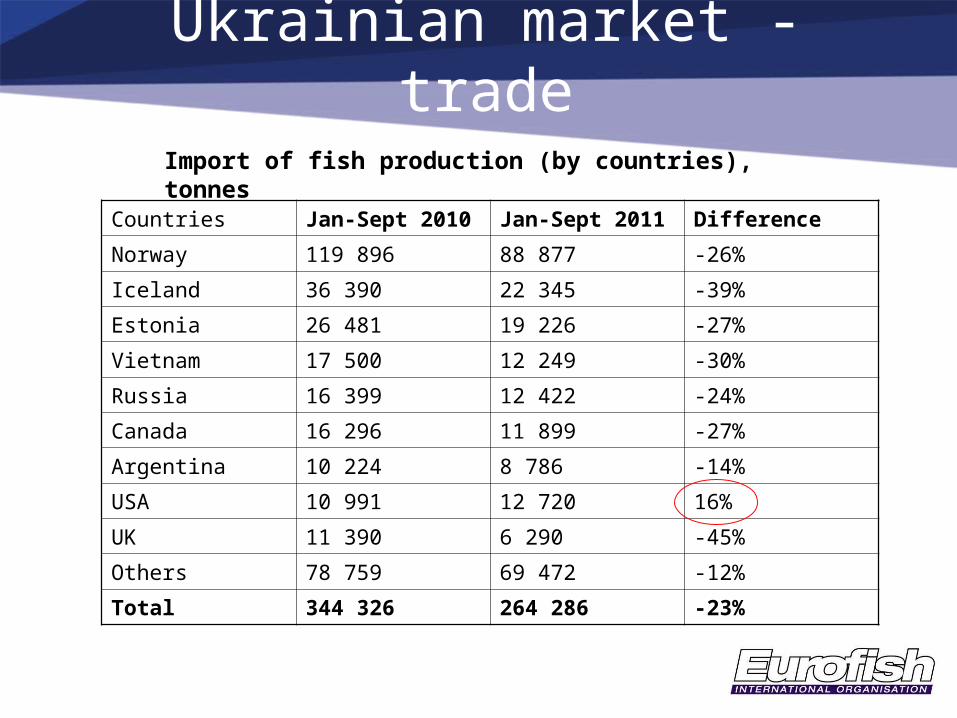
Import of fish production (by countries), tonnes
Countries Jan-Sept 2010 Jan-Sept 2011 Difference
Norway 119 896 88 877 -26%
Iceland 36 390 22 345 -39%
Estonia 26 481 19 226 -27%
Vietnam 17 500 12 249 -30%
Russia 16 399 12 422 -24%
Canada 16 296 11 899 -27%
Argentina 10 224 8 786 -14%
USA 10 991 12 720 16%
UK 11 390 6 290 -45%
Others 78 759 69 472 -12%
Total 344 326 264 286 -23%
Ukrainian market - trade
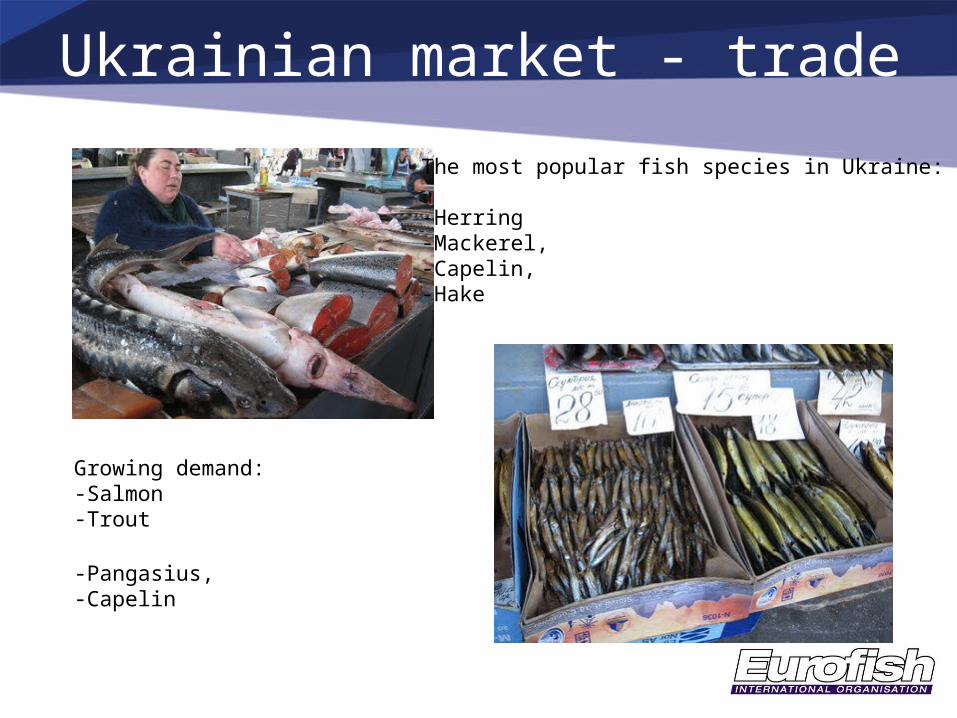
The most popular fish species in Ukraine:
-Herring-Mackerel,-Capelin,-Hake
Growing demand: -Salmon-Trout
-Pangasius,-Capelin
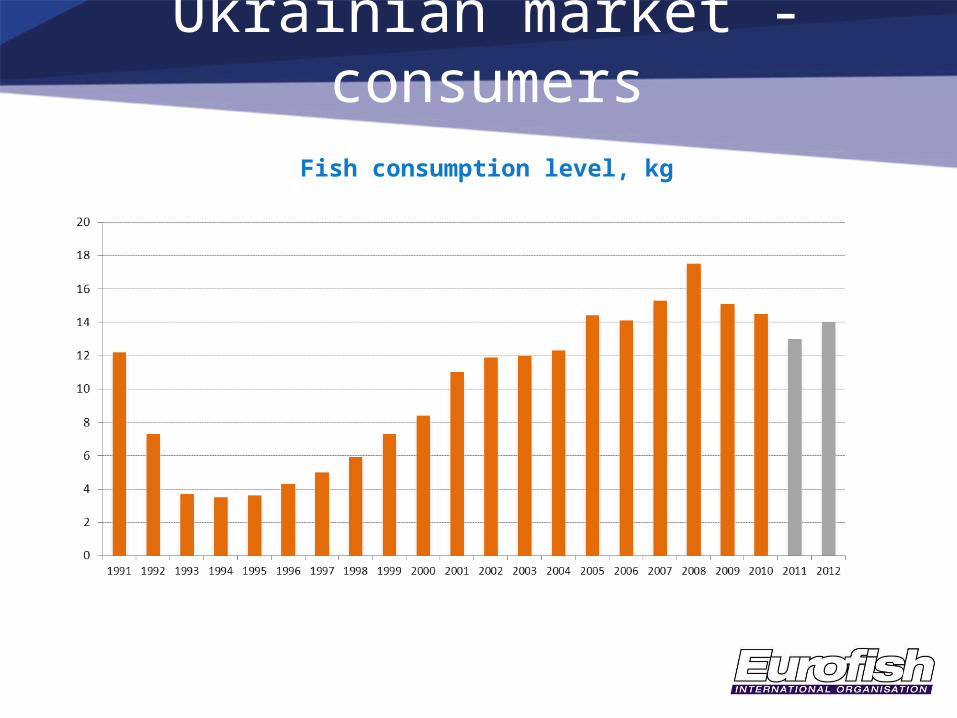
Ukrainian market - consumers
Fish consumption level, kg
• Decreasing catch due to the old catching fleet, lack of the admission to fish resources and fragmented regulation of the industry
• Continuing high import dependency (over 70%)
• Decreasing imports due to the high import prices
• Large importing companies create entire value chains for their products (from import to retail sales)
Ukrainian market - tendencies
Ukrainian market - tendencies
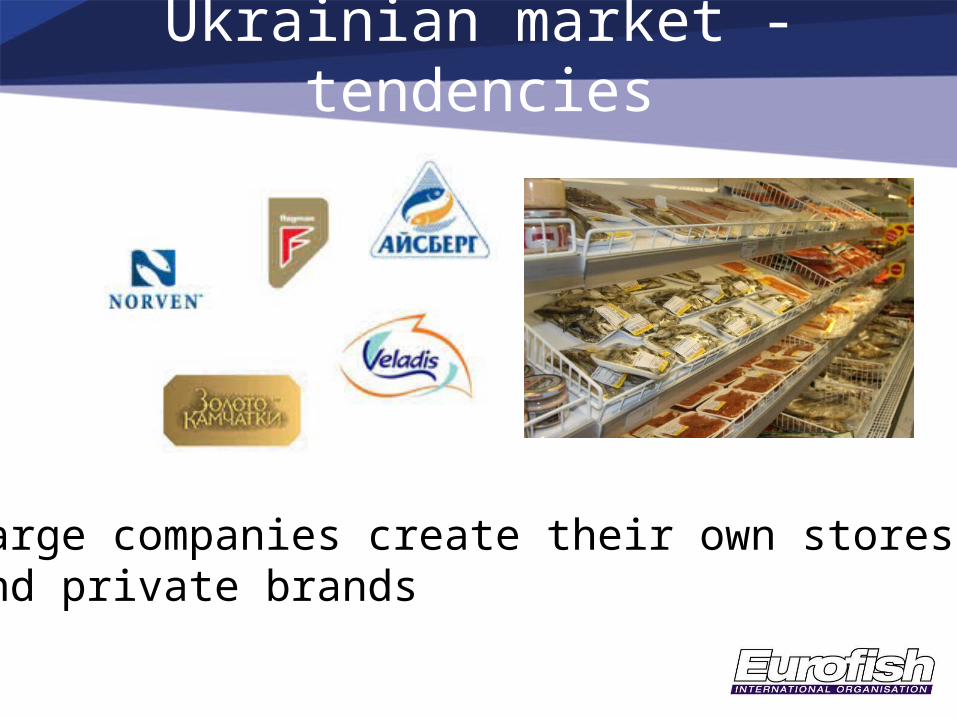
Large companies create their own stores and private brands
• Increasing prices for fish products (10%-35% depending on species)
• If inflation surpasses 15%, decrease of the national production output will continue. Possible drop of fish consumption will result in reduced number of the market players and following consolidation
Ukrainian market - tendencies
Ukrainian market - tendencies
• Common uncertainty depending on stability of UAH, the governmental policy towards importers and inflation rates
• While the Russian market is not affected by declining imports, the Ukrainian market has a deficit of fish products, enhanced by dropping supply and imports

Спасибо за внимание!
Tänan tähelepanu!
Спасибі за увагу!