Recent Developments in the Axial, Lateral and Torsional ...Recent Developments in the Axial, Lateral...
38
Recent Developments in the Axial, Lateral and Torsional Response of Drilled Shaft Foundations Armin W. Stuedlein, PhD P.E. Associate Professor Geotechnical Engineering
Transcript of Recent Developments in the Axial, Lateral and Torsional ...Recent Developments in the Axial, Lateral...

Recent Developments in the Axial, Lateral and Torsional Response of Drilled Shaft
Foundations
Armin W. Stuedlein, PhD P.E.Associate Professor
Geotechnical Engineering

Presentation Outline
Motivation and global objectives Project 1: Axial and Lateral Response of Shafts w/ High Strength
Bar and Steel Casing Project 2: Torsional Response of Shafts Axial and Lateral Response Experimental field test program Salient aspects of integrity test results Performance of Shafts to loading Torsional Response Experimental field test program Performance of Shafts to Loading Preview of forthcoming numerical model Summary and conclusions

Motivation and Global Objectives: Project 1Investigation of High Strength Bar and Steel Casing
• Research objectives driven by ODOT Bridge Design Group, with addition of ADSC WCC member firm suggestions
• Main Concern: Seismic. Increased seismic loads necessarily require increased steel reinforcement using current design specifications
• The density of steel in the rebar cage can cause difficulty during concreting, leading to voids and loss of cover
• Objectives:• Evaluate the use of high strength (80 ksi) steel • Evaluate use of permanent steel casing in design for flexure, lateral
load transfer• Evaluate use of hollow bar as dual purpose elements (structural, CSL
access), compare to TIP Thermal Wires

• Axial Load Transfer:• Develop t-z and q-z curves for Willamette Valley soils• Compare t-z and q-z curves between uncased and cased shafts• Compare t-z and q-z curves to FHWA recommendations
• Lateral Load Transfer:• Develop p-y curves for Willamette Valley soils• Compare p-y curves between uncased and cased shafts, and against
typical p-y curves available in commercial software• Compare development and location of plastic hinge across
experimental shafts
Motivation and Global Objectives: Project 1Investigation of High Strength Bar and Steel Casing

• Research objectives driven by ODOT Traffic Structures and Bridge Design Groups – Improve their understanding of torsional load transfer
• For DOTs, torsional loading typically due to:• Wind loading on cantilevered signs• Seismic loading of skewed bridges and flyovers
• Concerned about the lack of design guidance:• Very little full-scale test data exists• NO full-scale load transfer data exist (prior to this work)• No significant assessment of the accuracy of torsional load transfer
models exist• No reliable tools / software for modeling load transfer
available
Motivation and Global Objectives: Project 2Torsional Response of Drilled Shaft Foundations

[ Experimental Field Test Program ]

ShaftDrill
Diameter(in)
Casing Wall
Thickness(in)
Actual Volume of Concrete
(yd3)
Internal and External Steel
(%)
MIR 36 N/a 21.0 2.00
HSIR 36 N/a 20.0 1.50
CIR 36 0.5 17.4 7.20
CNIR 37 0.5 17.3 5.33
Four shafts considered:•MIR: the baseline shaft, constructed with 2% internal steel (60 ksi)
•HSIR: constructed with 1.5% internal steel (80 ksi)
•CIR: cased shaft, 37” OD with 0.5” wall; with 2% internal steel (60 ksi)
•CNIR: cased shaft, 37” OD with 0.5” wall; with 0.15% internal steel (60 ksi); drilled with 37” auger
MIR HSIR
Experimental Field Test ProgramTest Shafts and Experimental Variables

April 23, 2017
7
• Compare opening size in reinforcement cage (HSIR in foreground, MIR upper left corner).
• Hollow bar capped at base of shaft.
Experimental Field Test ProgramHSIR: high strength with hollow bar

April 23, 2017
8 0 10 20 30 40 50 60 70 80
0
10
20
30
40
50
60
70
80
90
0
5
10
15
20
25
30
Dep
th (f
t)
Dep
th (m
)
Distance (ft)
Stiff to very stiff, silty CLAY to clayey SILT
0 20 40qt (tsf)
Stiff to very stiff, silty CLAY to clayey SILT with a thin SAND lens
Uncased Shafts
Cased ShaftsCPT-1
West, A East, A'CPT-5CPT-3 CPT-4
0 20 40 60 80
0 20 400 20 40 0 20 400 20 40qt (tsf) qt (tsf) qt (tsf) qt (tsf)
?
?
CPT-2Atterberg Limits (%)
Stiff sandy SILT and medium dense silty SAND
with gravel
Subsurface Conditions

Construction: June 2015
April 23, 2017
9
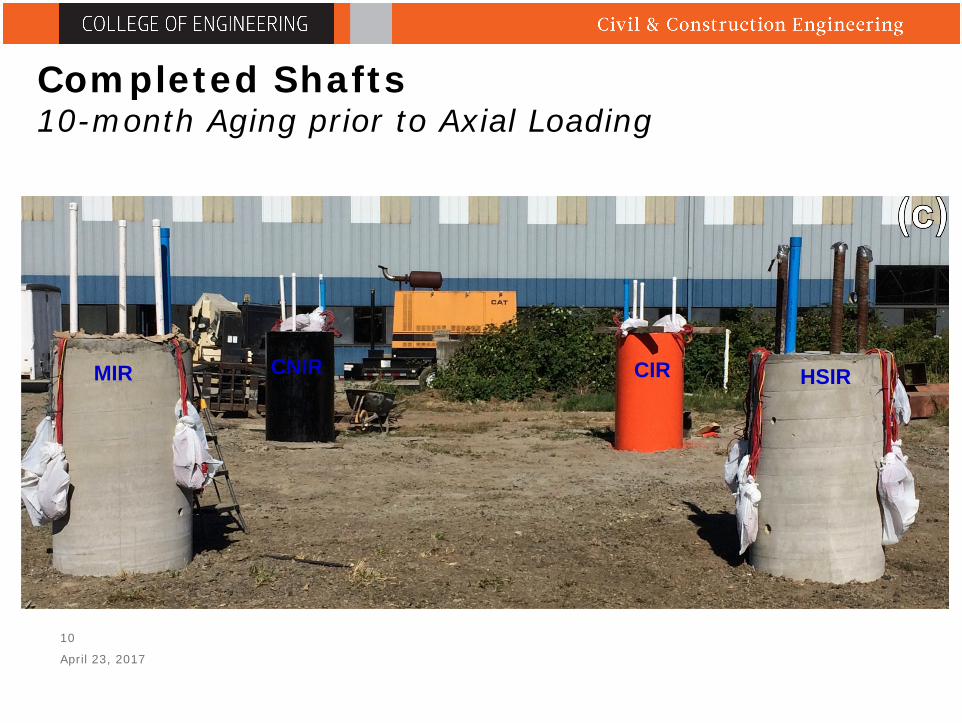
Completed Shafts10-month Aging prior to Axial Loading
April 23, 2017
10
MIR HSIRCNIR CIR

[ Integrity Tests Results ]

Integrity Tests and ResultsCrosshole Sonic Logging (CSL) Tests
• Advantages:• Widely accepted, standardized• Relatively quick, cheap• High resolution data
• Disadvantages:• Provides indicated in straight-line path
of wave (only)• Need to wait 7 to 10 days, then window
closes after ~21 to 28 days• No indication of concrete cover
thickness / quality
• CSL through hollow bar:• Theoretically should provide no
disadvantage• Threads should improve bond at
concrete/steel interface

Integrity Tests and ResultsCrosshole Sonic Logging (CSL) Tests
• Comparison of the p-wave signal received indicate clear difference in signal quality
• Signal through hollow bar is clear, undamped, regular• Signal through PVC is erratic, muddled• Observations reflected in the “waterfall” plots
-1000
-750
-500
-250
0
250
500
750
1000
0 50 100 150 200 250 300 350 400 450 500
Cros
shol
e Si
gnal
(mill
ivol
ts)
Time (microseconds)
CIR - PVC TubesHSIR - Hollow Bar

Integrity Tests and ResultsThermal Integrity Profiling (TIP) Thermal Wires
• Advantages:• Data captured in 12 to 48 hours following concreting
• Processing time short
• High resolution – measurements on one-foot intervals
• Can produce diameter profile – critical for instrumented shafts and interpreting measured strains
• Less cage congestion – no access tubes
• Disadvantages:• Care is necessary when handling cage – wires may be pinched or cut
• Care is necessary when torching cage stabilizers
• Shorter history with use
• Fewer specialists available with necessary expertise
• Information at base of shaft ??

Integrity Tests and ResultsThermal Integrity Profiling (TIP) Thermal Wires
• Shaft MIR shown here as example
• Time to reach peak heat of hydration: 46 hours
• Shaft diameter consistently larger than 36” auger dia.
• Cage is slightly off-center, as indicated by Wires 3 and 4 (slightly cooler)
• Off-centering ~3/4” max, but concrete cover > 3”

Integrity Tests and ResultsThermal Integrity Profiling (TIP) Thermal Wires
12 15 18 21 24Inferred Shaft Radius (inches)
Rei
nfor
cem
ent C
age
Ground Surface
-10
0
10
20
30
40
50
60
75 100 125 150
Embe
dmen
t Dep
th (f
t)
Mean Temperature (oF)
MIRHSIRCIR
Ground Surface
Dril
led
Sha
ft
(a) (b)
Steel casing
Sonotube
• Near surface temperature differences attributed to “form” used above ground
• Temperature variations in uncased shafts very similar, but indicates definitive differences
• One inch smaller radius for HSIR
• Temperature and inferred shaft radius for CIR indicates gap between soil and shaft
• Implications for load transfer

[ ]Overview of Axial and Lateral Loading Test Results

Axial Loading Tests
April 23, 2017
18

Axial Loading Tests: Response at Shaft Head
April 23, 2017
19
0.0
0.5
1.0
1.5
2.0
2.5
3.0
3.5
0 100 200 300 400 500
Shaf
t Hea
d D
ispl
acem
ent (
in)
Applied Load, Q (kips = 1,000 lbf)
CIR
CNIR
0.00
0.05
0.10
0.15
0.20
0 250 500 750 1000 1250 1500
Shaf
t Hea
d D
ispl
acem
ent (
in)
Applied Load, Q (kips = 1,000 lbf)
MIR
HSIR
Cased Shafts
Uncased Shafts
• Uncased shafts: nearly identical initial response, High-strength Shaft performed better despite having slightly smaller diameter
• 1400 kips at 0.15” • Cased Shafts: significantly
less capacity than uncased• Shaft CNIR was drilled with
37” auger, same as casing OD; Shaft CIR used 36” auger - substantial effect
0.0
0.5
1.0
1.5
2.0
2.5
3.0
3.5
0 250 500 750 1000 1250 1500
Shaf
t Hea
d D
ispl
acem
ent (
in)
Applied Load, Q (kips = 1,000 lbf)
MIR
HSIR
CIR
CNIR

Axial Loading Tests:Load Transfer
April 23, 2017
20
• Significant bending incurred in all four tests
• Load transfer attempted to be corrected for load transfer
• Cased shafts perform in a very stiff, rigid manner
• Effect of construction sequence and gap between casing and borehole apparent
• TIP can be used to identify need for post-grouting remediation
MIR HSIR
CIR CNIR

Axial Loading Tests: t-z response
April 23, 2017
21
UNCASED SHAFTS• Mostly hardening-type response
• Auger-induced belling at mid-shaft produced largest response
CASED SHAFTS• Much lower average shaft resistance
• CIR (smaller
MIR HSIR
CIR CNIR
auger) produced peak and softening
Cased Shafts: shallow t-z curves affected by bending and gapping

Lateral Loading Tests: Preliminary Results
April 23, 2017
22
CIR CNIR
MIR HSIR

April 23, 2017
23
• Initial response similar between cased and uncased shafts• Plastic hinge developed at about 200 kips for uncased shafts• Cased shafts perform well to 8”, no indication of hinge• CNIR stiffer
than CIR, surprising…
0
100
200
300
400
0 5 10 15 20
Shea
r For
ce (k
ip)
Applied Lateral Displacement (in)
MIR
HSIR
CIR
CNIR
Lateral Loading Tests: Preliminary Results

-10
0
10
20
30
40
50
60
-5 0 5 10 15 20 25
Dep
th (f
t)
Displacement (in)
HSIR @ 45.8 kips
HSIR @ 71.4 kips
HSIR @ 105 kips
HSIR @ 186 kips
HSIR @ 229 kips
HSIR @ 231 kips
Ground Surface
-5 0 5 10 15 20 25Displacement (in)
CNIR @ 48.9 kips
CNIR @ 72.9 kips
CNIR @ 108 kips
CNIR @ 190 kips
CNIR @ 245 kips
CNIR @ 403 kips
Ground Surface
-5 0 5 10 15 20 25Displacement (in)
CIR @ 48.9 kips
CIR @ 72.9 kips
CIR @ 108 kips
CIR @ 190 kips
CIR @ 245 kips
CIR @ 403 kips
Ground Surface
-5 0 5 10 15 20 25Displacement (in)
MIR @ 45.8 kips
MIR @ 71.4 kips
MIR @ 105 kips
MIR @ 186 kips
MIR @ 229 kips
MIR @ 231 kips
Ground Surface
April 23, 2017
24
• Lateral deflection profiles near-finalized• p-y curves not yet developed, will be generated using strain gages
and lateral deflection profiles • Cased shafts are significantly stiffer, HSIR stiffer than the baseline
shaft MIR; CNIR stiffer than CIR
MIRHSIR CIR CNIRDefinitive Hinge at
3.5D Point of bending at 8.5D
Also at 8.5D
Definitive Hinge at
3.5D
2.9” 2.7” 2.5” 2.0”9.7” 18.4” 3.6” 3.1”
Lateral Loading Tests: Preliminary Results

[ ]Project 2: Torsional Response of Drilled Shafts

Motivation for Work
• In the Pacific Northwest, wind speeds are not trivial
April 23, 2017
26
• December 2014: Peak gusts of 144 km/hr
• October 1934: Peak gusts of 145 km/hr
• October 1962: Peak gusts of 258 km/hr
In Kansas, Max wind gust speed recorded July 11, 1993: 162 km/hr, not trivial
April 23, 2017
27
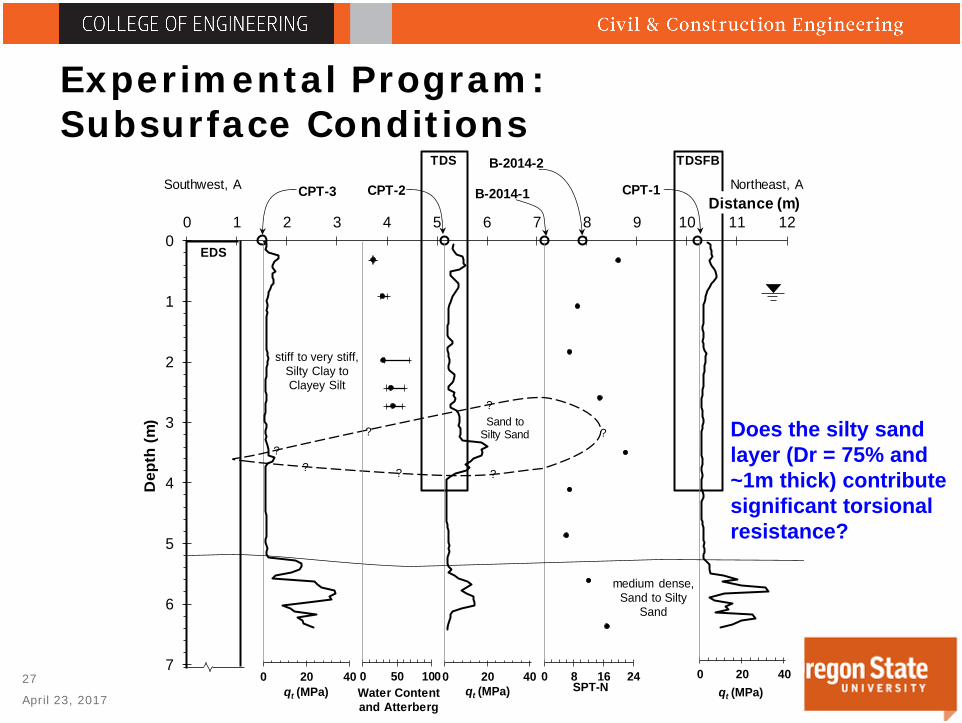
Experimental Program: Subsurface Conditions
0
1
2
3
4
5
6
7
0 1 2 3 4 5 6 7 8 9 10 11 12
Dep
th (m
)
0 20 400 20 40 0 20 40 0 8 16 24qt (MPa) SPT-Nqt (MPa) qt (MPa)
??
? ? ?
?Sand to
Silty Sand
stiff to very stiff, Silty Clay to Clayey Silt
medium dense, Sand to Silty
Sand
Distance (m)
EDS
TDS TDSFB
CPT-3 CPT-1CPT-2 B-2014-1Southwest, A Northeast, A'
?
B-2014-2
0 50 100Water Content and Atterberg
Does the silty sand layer (Dr = 75% and ~1m thick) contribute significant torsional resistance?

Experimental Program: Test Shafts
April 23, 2017
28
• Design signal pole and pole structure: SM3 (ODOT Standard Dwgs. TM651, TM653)• Design axial load: 4.75 kN• Shear: 10.5 kN• Moment: 187.6 kN-m• Torque: 112.4 kN-m
• ODOT design procedure: Using Broms (1964), in consideration of lateral resistance (only), choose shaft length that provides FS = 2.15
• Torsion not considered directly… (??!!)

Experimental Program: Loading Tests
April 23, 2017
29
Quasi-Static Loading
April 23, 2017
30
[ ]

Experimental Program: Quasi-Static
April 23, 2017
31
TDS
TDSFBApplied Rotation at Head vs. Developed Torque
0
50
100
150
200
0 2 4 6 8 10 12 14
Torq
ue, T
(kN
-m)
Rotation, θ (deg)
TDS
TDSFB
0
50
100
150
200
250
0.0 0.5 1.0 1.5 2.0
Torq
ue, T
(kN
-m)
Rotation, θ (deg)
TDSFB: MeasuredTDS: MeasuredTDS: Extrapolated

Experimental Program: Quasi-Static
April 23, 2017
32
Torsional shear strain profiles: with depth
0.9 1.0 1.1 1.2 1.3 1.4-1
0
1
2
3
40 10 20 30 40 50
Diameter, D (m)D
epth
(m)
Absolute Shear Strain, ε45°(microstrain)
0.021° 0.048°0.071° 0.086°0.092° 0.103°
D
0.9 1.0 1.1 1.2 1.3 1.4
0 10 20 30 40 50
Diameter, D (m)
Absolute Shear Strain, ε45°(microstrain)
0.02° 0.08°0.24° 0.51°1.07° 1.75°
(b)
D
50+ Unreliable Gages
TDS TDSFB

Experimental Program: Quasi-Static
April 23, 2017
33
Torsional Load Transfer Observed over Tributary Areas: with Depth
0 7 14 21
-1
0
1
2
3
4
5
0 50 100 150 200 250 300
qt (MPa)
Dep
th (m
)
Torque (kN-m)
Ground Surface
Unreliable Gages
CPT
TDS TDSFB

Experimental Program: Quasi-Static
April 23, 2017
34
Torsional Load Transfer Observed over Tributary Areas: with Rotation
0
30
60
90
120
Uni
t Sha
ft R
esis
tanc
e, τ
(kPa
) 0 to 0.18 m 0.18 to 1.1 m1.1 to 2.1 m 2.1 to 3.1 m3.1 to 4.1 m Extrapolated
(c)
0
30
60
90
120
0.0 0.5 1.0 1.5 2.0
Uni
t Sha
ft R
esis
tanc
e, τ
(kPa
)
Rotation, θ (deg)
0 to 0.18 m 0.18 to 1.1 m1.1 to 2.1 m 2.1 to 3.1 m3.1 to 4.0 m
(d)
0.08
5E-4
)
)
Shaft in SAND
Shaft in Clayey SILT
All of shaft in Clayey SILT
TDS
TDSFBU
nitS
haft
Res
ista
nce
(kPa
)
θ/rs = 1.08E-4θ + 2.45E-4
R² = 0.991
θ/rs = 1.82E-2θ + 2.54E-4
R² = 0.981
0.0E+0
4.0E-4
8.0E-4
1.2E-3
1.6E-3
θ/τ
Observed from 3.1 to 4.1 mObserved from 2.1 to 3.1 mOmitted
(a)
Uni
tSha
ftR
esis
tanc
e(k
Pa)
0
10
20
30
40
50
60
70
0.00 0.02 0.04 0.06 0.08
Uni
t Sha
ft R
esis
tanc
e, τ
(kPa
)
Rotation, θ (deg)
Observed from 3.1 to 4.1 m
Observed from 2.1 to 3.1 m
Hyperbolic Fit
(b)
Hyperbolic Model Fitting (TDS)
ba
bars

Skipping the summary…but thanks to colleagues
and the Sponsors!
April 23, 2017
35
[ ]Colleagues• Prof. Andre Barbosa• Qiang Li, OSU PhD Student

SPONSORS

References
Li, Q., Stuedlein, A.W. and Barbosa, A.R. (2017) "Torsional Load Transfer of DrilledShaft Foundations," Journal of Geotechnical and Geoenvironmental Engineering,Vol. online at: http://ascelibrary.org/doi/10.1061/%28ASCE%29GT.1943-5606.0001701
Stuedlein, A.W., Li, Q., Zammataro, J., Belardo, D., Hertlein, B., and Marinucci, A.(2016) "Comparison of Non-Destructive Integrity Tests on Experimental DrilledShafts," Proceedings, 41st Annual Meeting of the Deep Foundations Institute,New York, NY. 10 pp.