RealReal--world Emission Characterizationworld … · RealReal--world Emission...
50
Real Real-world Emission Characterization world Emission Characterization Judith C. Chow ([email protected]) Judith C. Chow ([email protected]) John G. Watson Desert Research Institute Desert Research Institute Nevada System of Higher Education Reno, NV, USA d Presented at: The Workshop on Vehicular Air Pollution and its Impact on Human Health Indian Habitat Centre, New Delhi, India September 2, 2011
Transcript of RealReal--world Emission Characterizationworld … · RealReal--world Emission...

RealReal--world Emission Characterizationworld Emission Characterization
Judith C. Chow ([email protected])Judith C. Chow ([email protected])
John G. Watson
Desert Research InstituteDesert Research InstituteNevada System of Higher Education
Reno, NV, USA
dPresented at:The Workshop on Vehicular Air Pollution and its Impact on Human Health
Indian Habitat Centre, New Delhi, India
September 2, 2011
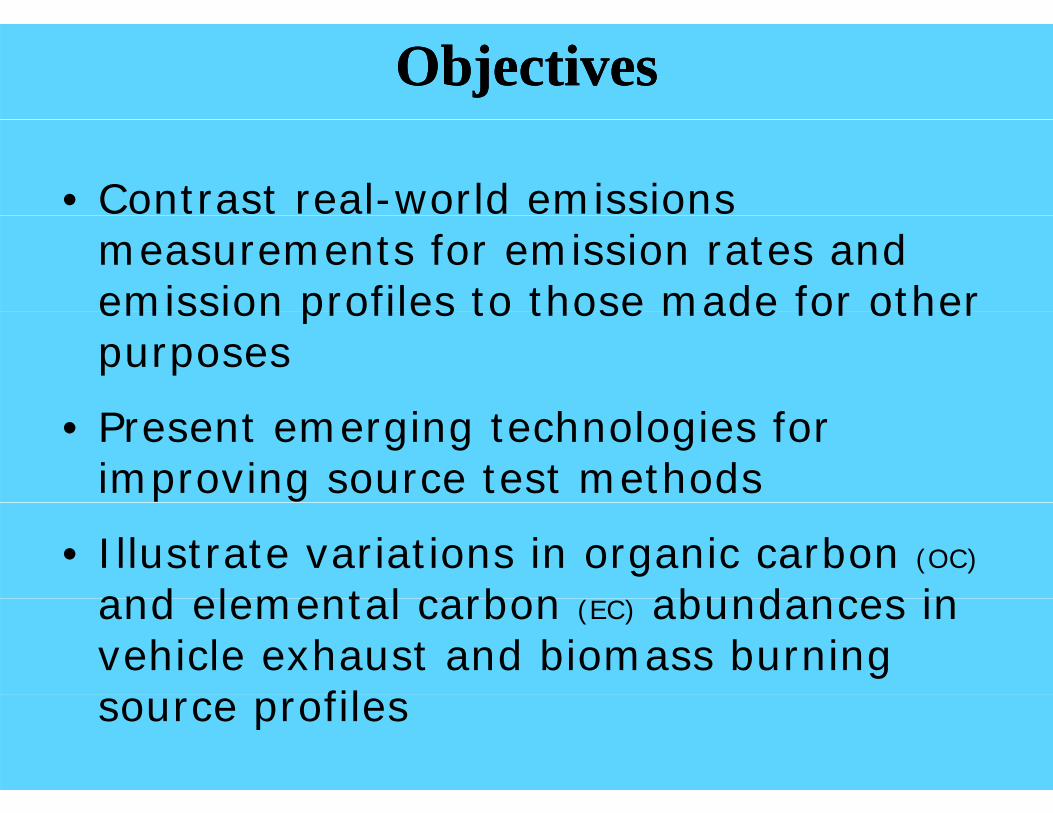
ObjectivesObjectives
• Contrast real-world emissions measurements for emission rates and emission profiles to those made for other emission profiles to those made for other purposes
• Present emerging technologies for improving source test methods
• Illustrate variations in organic carbon (OC)
and elemental carbon abundances in and elemental carbon (EC) abundances in vehicle exhaust and biomass burning
filsource profiles
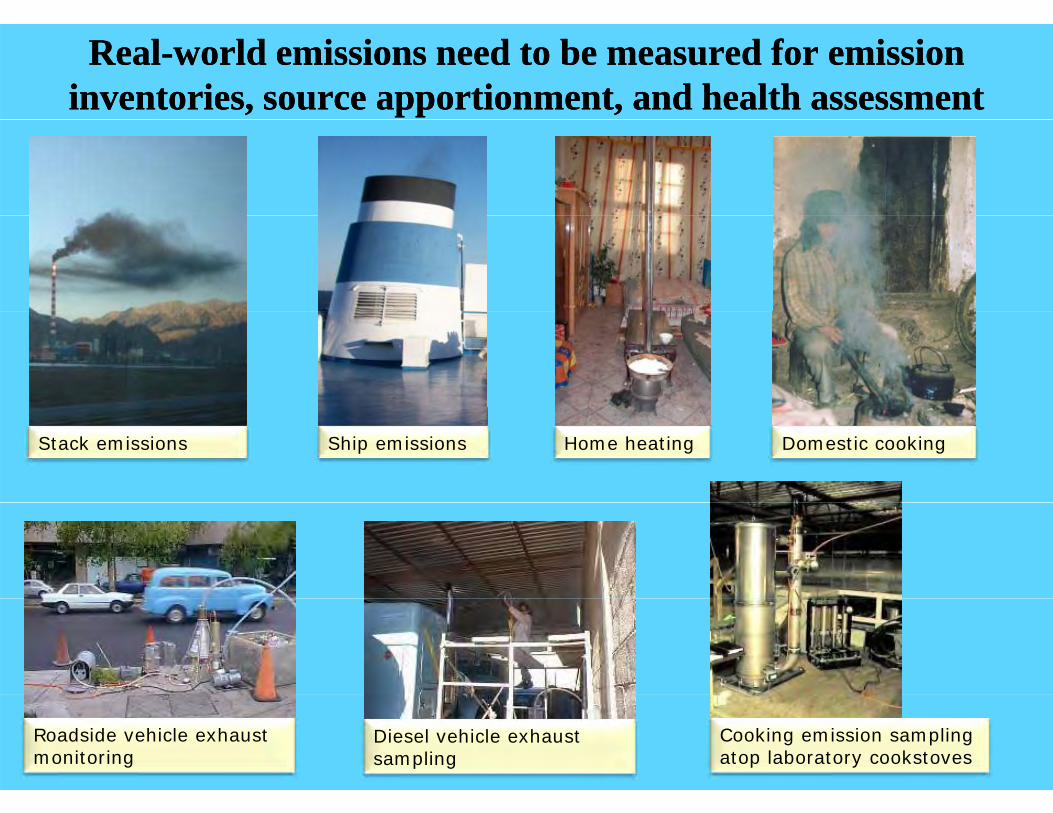
RealReal--world emissions need to be measured for emission world emissions need to be measured for emission inventories, source apportionment, and health assessmentinventories, source apportionment, and health assessment
Domestic cookingHome heatingShip emissionsStack emissions
Roadside vehicle exhaust monitoring
Diesel vehicle exhaust sampling
Cooking emission sampling atop laboratory cookstoves
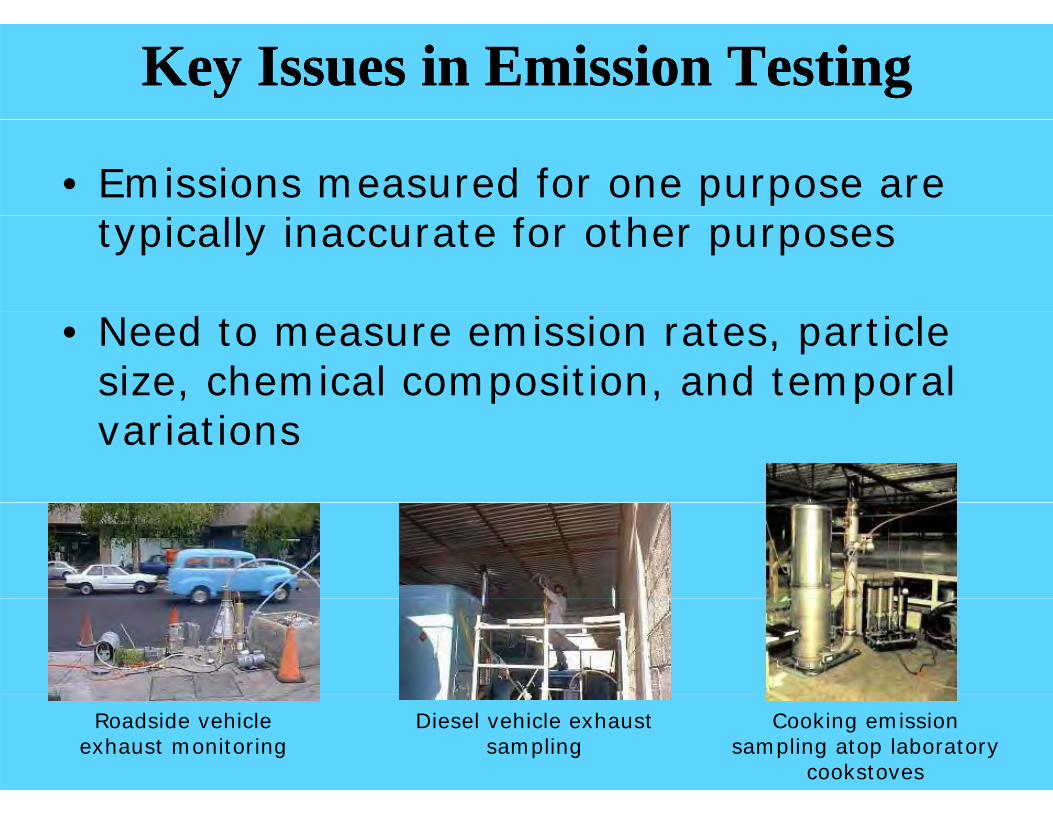
Key Issues in Emission TestingKey Issues in Emission Testing
• Emissions measured for one purpose are ftypically inaccurate for other purposes
• Need to measure emission rates, particle size, chemical composition, and temporal variations
Roadside vehicle exhaust monitoring
Diesel vehicle exhaust sampling
Cooking emission sampling atop laboratory
cookstoves
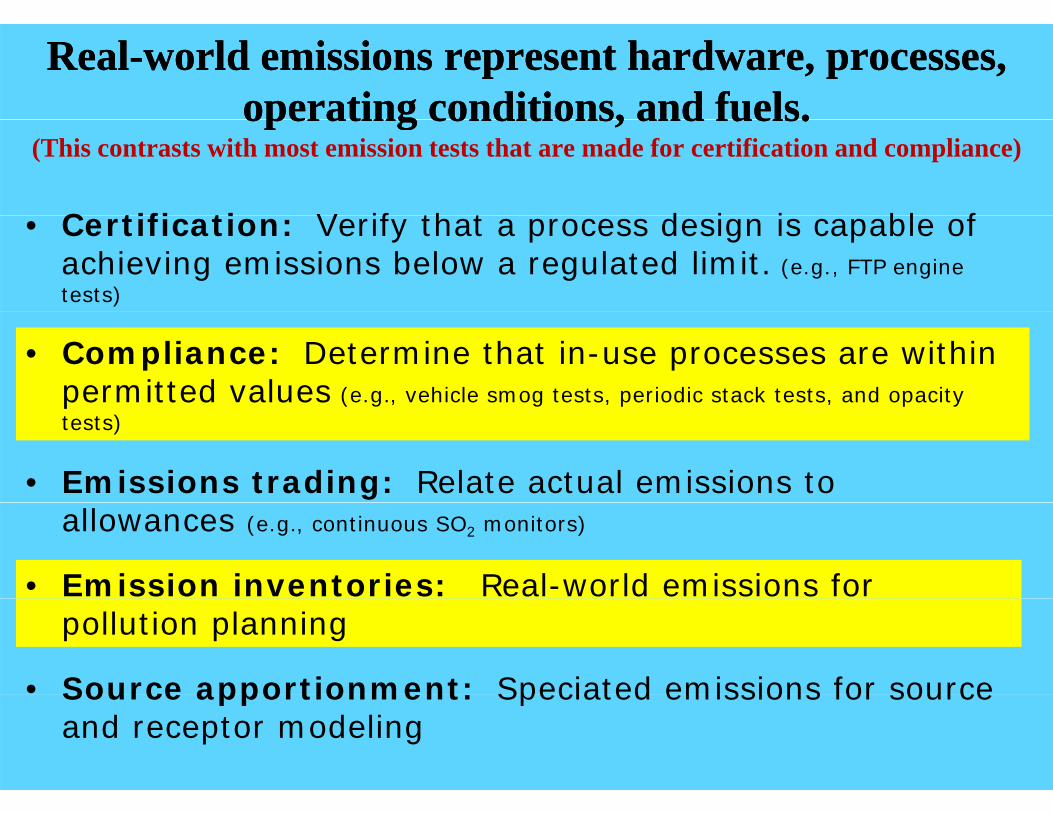
RealReal--world emissions represent hardware, processes, world emissions represent hardware, processes, operating conditions, and fuels.operating conditions, and fuels.operating conditions, and fuels.operating conditions, and fuels.
(This contrasts with most emission tests that are made for certification and compliance)
C tifi ti V if th t d i i bl f • Certification: Verify that a process design is capable of achieving emissions below a regulated limit. (e.g., FTP engine tests)
• Compliance: Determine that in-use processes are within permitted values (e.g., vehicle smog tests, periodic stack tests, and opacity ptests)
• Emissions trading: Relate actual emissions to allowances (e.g., continuous SO2 monitors)
• Emission inventories: Real-world emissions for pollution planning
• Source apportionment: Speciated emissions for source • Source apportionment: Speciated emissions for source and receptor modeling

Emission CharacteristicsEmission Characteristics
• Emission Factor:Amount emitted per unit time or unit of activityAmount emitted per unit time or unit of activity.
• Particle Size:Determines transport and deposition properties.
• Chemical Composition:• Chemical Composition:Fractional abundance of gaseous and particulate chemical components in emissions. Used to speciate inventory and p p yto apportion ambient concentrations to sources.
• Temporal Variation:• Temporal Variation:Emissions change on daily, weekly, seasonal, and annual cycles. Timing of emissions affects atmospheric transport y g p pand dilution as well as human exposure to air pollution.
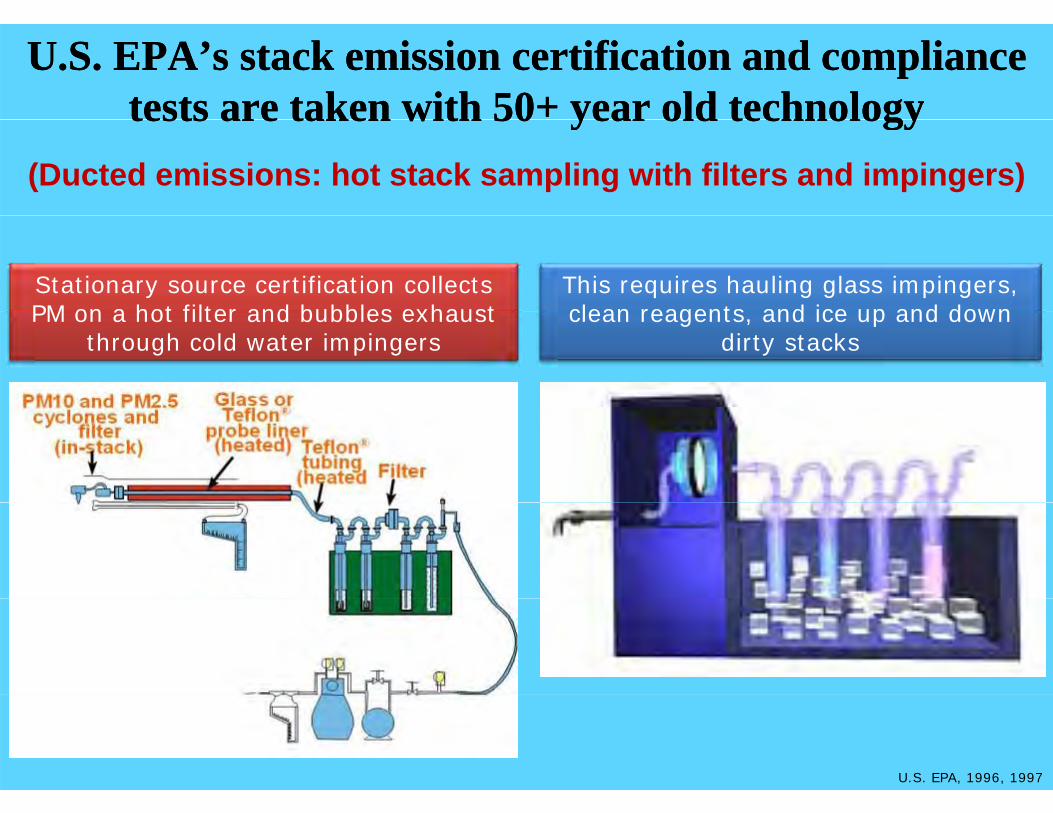
U.S. EPA’s stack emission certification and compliance U.S. EPA’s stack emission certification and compliance tests are taken with 50+ year old technologytests are taken with 50+ year old technologytests are taken with 50 year old technologytests are taken with 50 year old technology
(Ducted emissions: hot stack sampling with filters and impingers)
This requires hauling glass impingers, clean reagents and ice up and down
Stationary source certification collects PM on a hot filter and bubbles exhaust clean reagents, and ice up and down
dirty stacksPM on a hot filter and bubbles exhaust
through cold water impingers
U.S. EPA, 1996, 1997
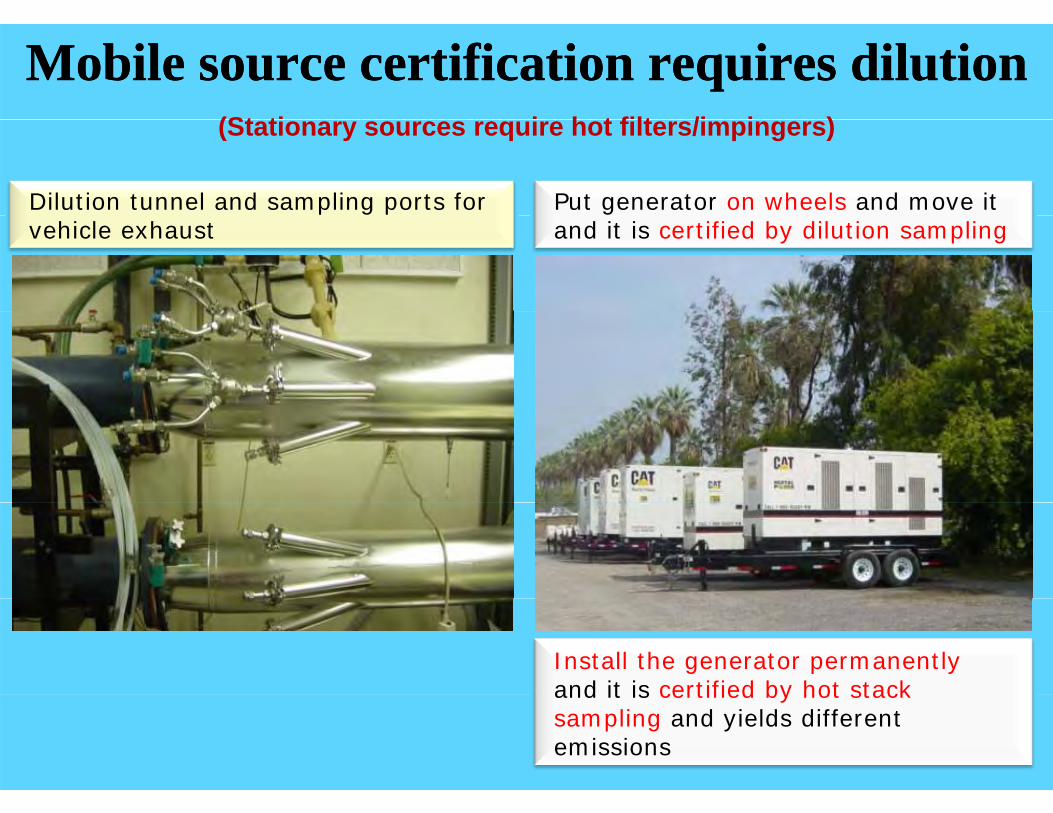
Mobile source certification requires Mobile source certification requires dilutiondilution(St ti i h t filt /i i )
Dilution tunnel and sampling ports for Put generator on wheels and move it
(Stationary sources require hot filters/impingers)
vehicle exhaust and it is certified by dilution sampling
Install the generator permanentlyand it is certified by hot stack and it is certified by hot stack sampling and yields different emissions
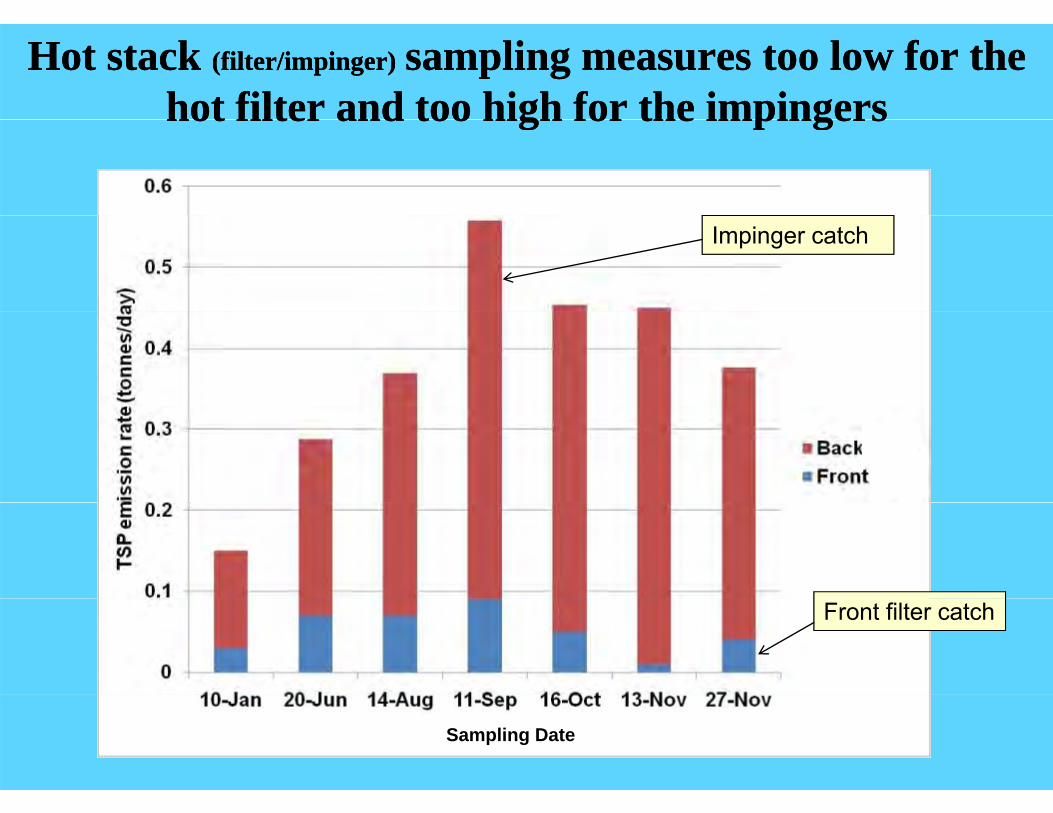
Hot stack Hot stack (filter/(filter/impingerimpinger)) sampling measures too low for the sampling measures too low for the hot filter and too high for the impingershot filter and too high for the impingershot filter and too high for the impingershot filter and too high for the impingers
Impinger catch
Front filter catch
Sampling Date

The hot filter does not collect condensable material, The hot filter does not collect condensable material, while thewhile the impingersimpingers collect soluble gasescollect soluble gaseswhile the while the impingersimpingers collect soluble gasescollect soluble gases
Example of diesel exhaust with thermal denuders
(Preceding thermal denuders remove some ultrafine particles)(Preceding thermal denuders remove some ultrafine particles)
Example of diesel exhaust with thermal denuders
Burtscher, 2005, J. Aerosol Sci.

Particle characteristics* often vary during Particle characteristics* often vary during i i t ti i t temission testsemission tests
Mass concentration Number concentrationDp (um) Mass concentration Number concentrationDp (um)2.5
Loose sand mass
dp1.0 Nucleation/ reactions from bi d
Shakeout (15min)
binder
Pouring
0.1 Shakeout (15min)( )
(μg/m3) (#/cm3)
Chang et al., 2005, AST* ELPI and Grimm OPC Size Distributions from a casting foundry operation
(μg/m3) (#/cm3)

Many of the chemical components in a source profile are Many of the chemical components in a source profile are condensablecondensable (commonly(commonly measured elements, ions,measured elements, ions, carbon, and gases)carbon, and gases)condensable condensable (commonly (commonly measured elements, ions, measured elements, ions, carbon, and gases)carbon, and gases)
Watson and Chow, 2007

This is especially the case for organic compounds that are important source This is especially the case for organic compounds that are important source markersmarkers (e.g., lactones(e.g., lactones, , hopaneshopanes, , guaiacolsguaiacols, , syringolssyringols, , steranessteranes, and sterols, and sterols))
e) f)
g) h)
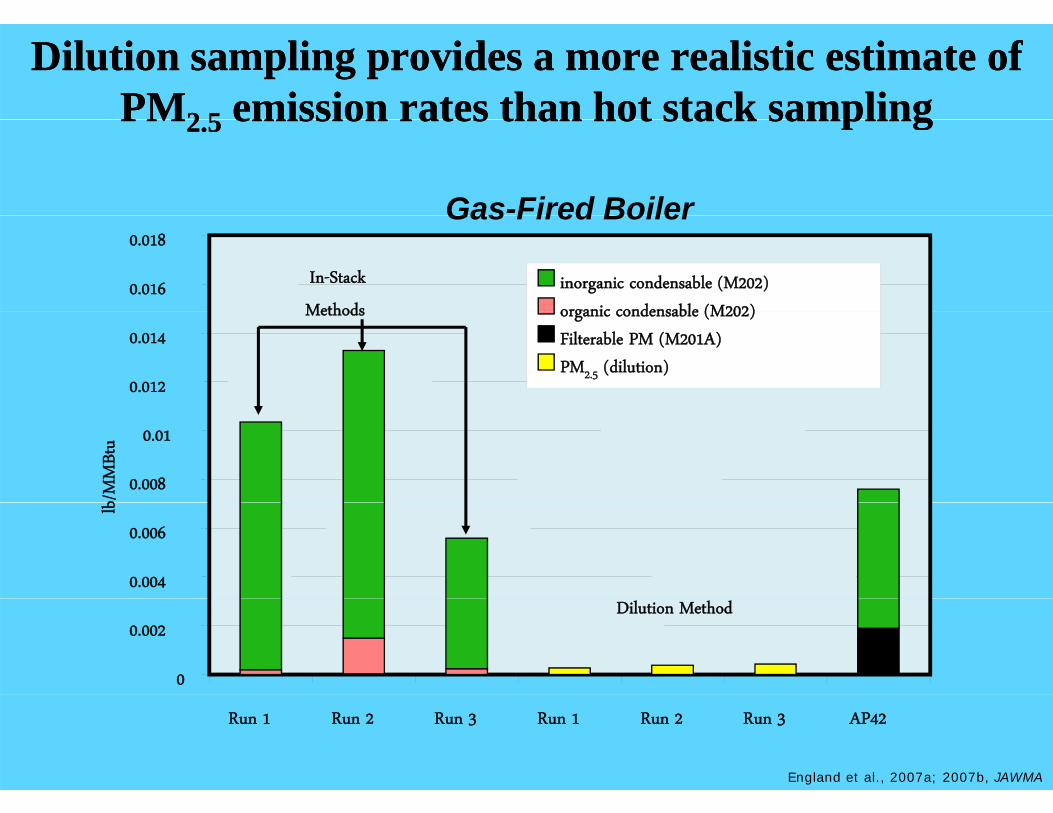
Dilution sampling provides a more realistic estimate of Dilution sampling provides a more realistic estimate of PMPM2 52 5 emission rates than hot stack samplingemission rates than hot stack samplingPMPM2.52.5 emission rates than hot stack samplingemission rates than hot stack sampling
Gas-Fired BoilerGas Fired Boiler
0.016
0.018
inorganic condensable (M202)
organic condensable (M202)
In-Stack
Methods
0.012
0.014organic condensable (M202)
Filterable PM (M201A)PM2.5 (dilution)
Methods
0.008
0.01
b/M
MBt
u
0.004
0.006
lb
0
0.002Dilution Method
Run 1 Run 2 Run 3 Run 1 Run 2 Run 3 AP42
England et al., 2007a; 2007b, JAWMA

Specific pollution sources need to be tested Specific pollution sources need to be tested with a dilution sampling systemwith a dilution sampling systemwith a dilution sampling systemwith a dilution sampling system
Casting foundry Dilution sampling system
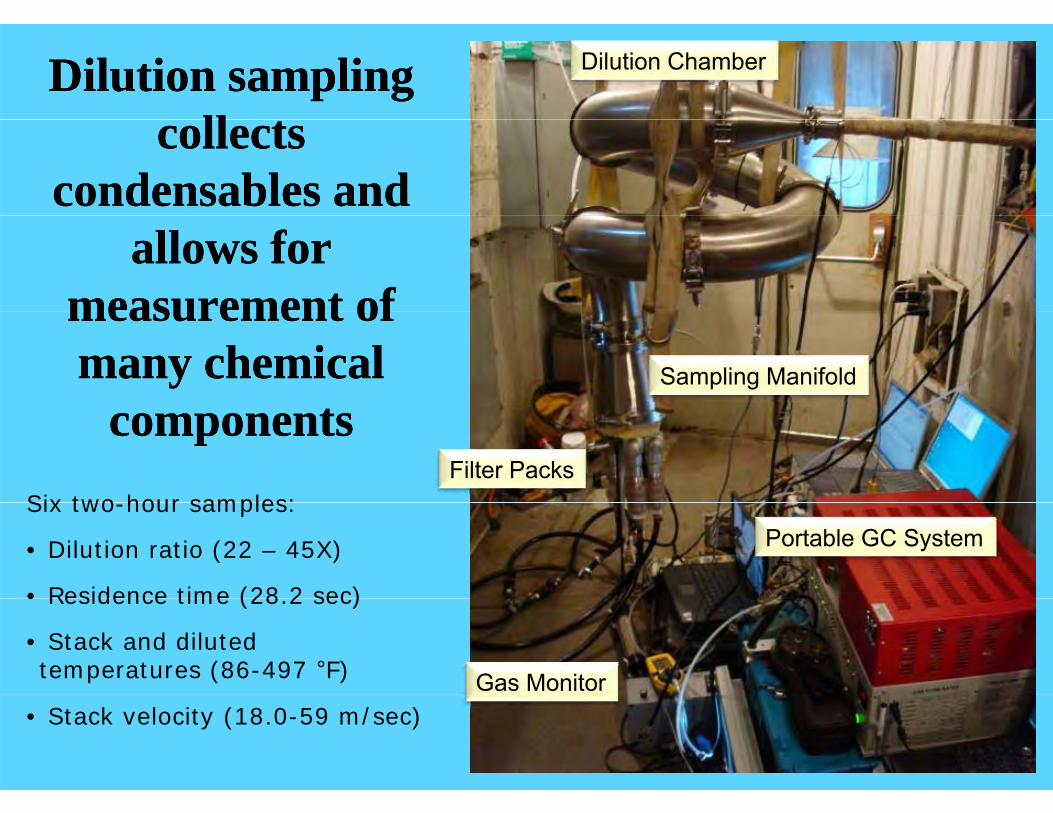
Dilution sampling Dilution sampling ll tll t
Dilution Chamber
collects collects condensablescondensables and and
allows for allows for measurement ofmeasurement ofmeasurement of measurement of many chemical many chemical
ttSampling Manifold
componentscomponentsFilter Packs
Six two hour samples:Portable GC System
Six two-hour samples:
• Dilution ratio (22 – 45X)
• Residence time (28 2 sec)
Gas Monitor
• Residence time (28.2 sec)
• Stack and diluted temperatures (86-497 °F)
• Stack velocity (18.0-59 m/sec)
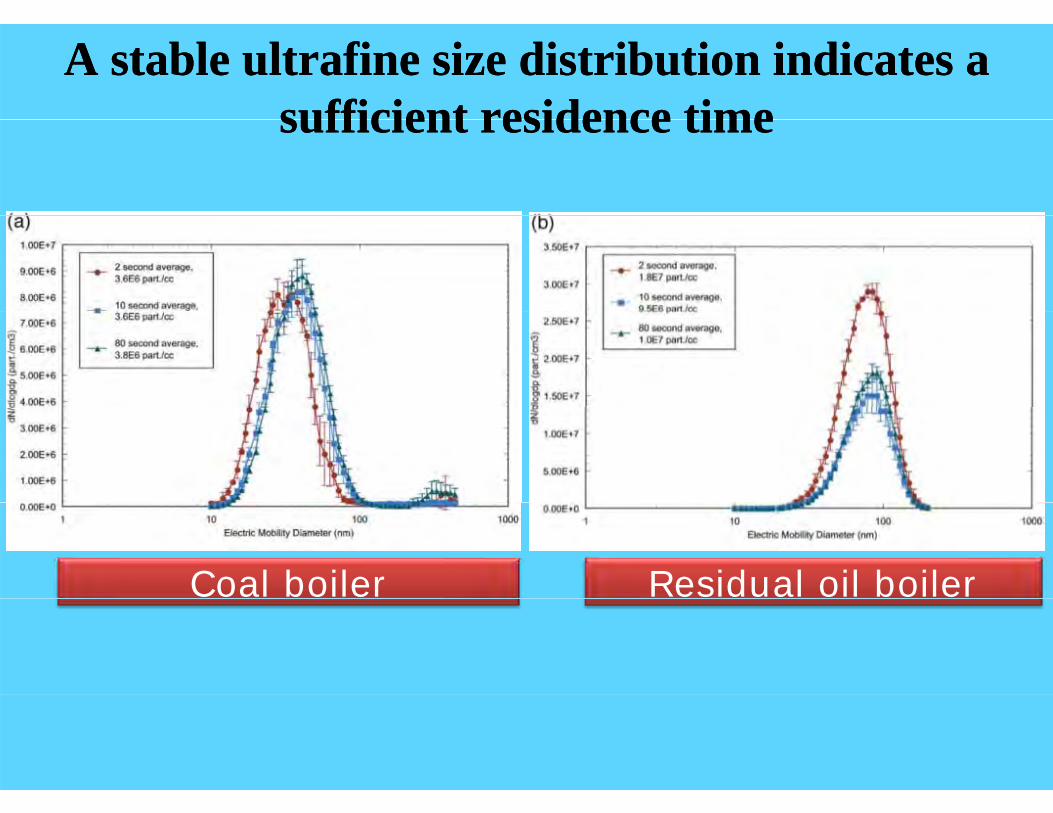
A stable ultrafine size distribution indicates a A stable ultrafine size distribution indicates a sufficient residence timesufficient residence timesufficient residence timesufficient residence time
Coal boiler Residual oil boiler
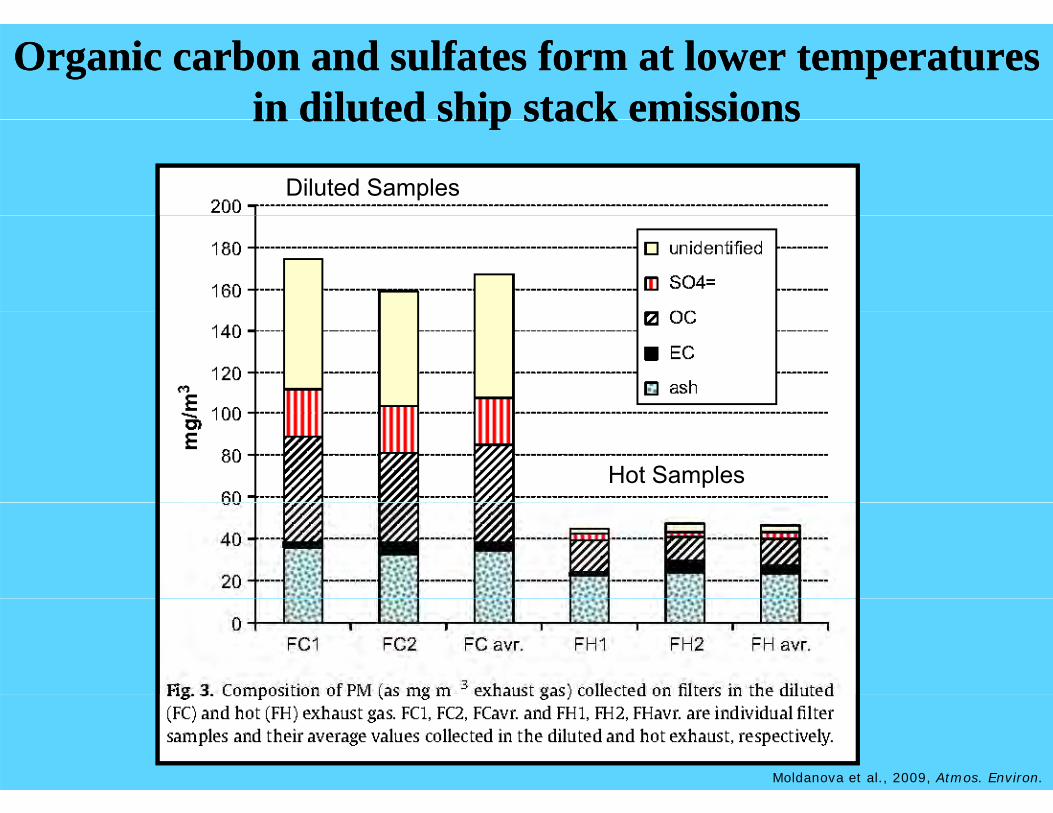
Organic carbon and sulfates form at lower temperatures Organic carbon and sulfates form at lower temperatures in diluted ship stack emissionsin diluted ship stack emissionsin diluted ship stack emissionsin diluted ship stack emissions
Diluted Samples
Hot Samples
Moldanova et al., 2009, Atmos. Environ.

Buttonhook nozzles in current stack tests do Buttonhook nozzles in current stack tests do not pass many large particlesnot pass many large particlesnot pass many large particlesnot pass many large particles
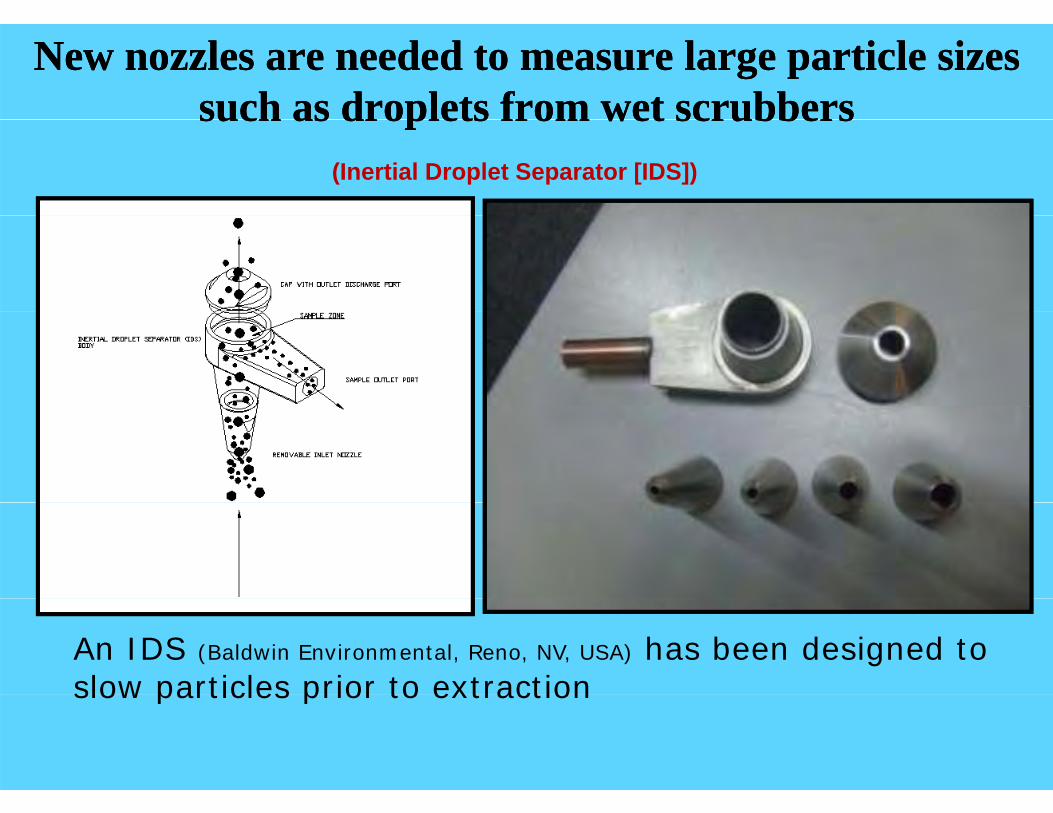
New nozzles are needed to measure large particle sizes New nozzles are needed to measure large particle sizes such as droplets from wet scrubberssuch as droplets from wet scrubberssuch as droplets from wet scrubberssuch as droplets from wet scrubbers
(Inertial Droplet Separator [IDS])
An IDS (Baldwin Environmental, Reno, NV, USA) has been designed to slow particles prior to extractionslow particles prior to extraction

IDS* is tested in a wetIDS* is tested in a wet--stack simulatorstack simulator
IDS
Filter inlet probe
Wet-stack simulator
*inertial droplet separator

Sampling effectiveness for IDS* using spherical Sampling effectiveness for IDS* using spherical glass beadsglass beadsglass beadsglass beads
100CDP: AvgCDP: Avg + Stdev
100CDP: AvgCDP: Avg + Stdev
80
90CDP: Avg + StdevCDP: Avg - StdevIDS/Iso: AvgIDS/Iso: Avg + StdevIDS/Iso: Avg - Stdev
y In
let
y In
let
80
90CDP: Avg + StdevCDP: Avg - StdevIDS/Iso: AvgIDS/Iso: Avg + StdevIDS/Iso: Avg - Stdev
y In
let
60
70
s Pe
rcen
tem
oved
bem
oved
b
60
70
s Pe
rcen
tem
oved
b
40
50
Cum
ulat
ive
Mas
srti
cles
Re
rticl
es R
e
40
50
Cum
ulat
ive
Mas
srti
cles
Re
20
30
C
IDS cut pointAvg: 19.8 µmLow: 17.7 µmHigh: 21 7 µmtio
n of
Pa
tion
of P
a
20
30
C
IDS cut pointAvg: 19.8 µmLow: 17.7 µmHigh: 21 7 µmtio
n of
Pa
0
10
0 10 20 30 40 50 60 70 80 90 100
High: 21.7 µm
Frac
tFr
act
0
10
0 10 20 30 40 50 60 70 80 90 100
High: 21.7 µm
Frac
t
*inertial droplet separator
0 10 20 30 40 50 60 70 80 90 100Aerodynamic Diameter (micrometers)Aerodynamic Diameter (micrometers)Aerodynamic Diameter (micrometers)
0 10 20 30 40 50 60 70 80 90 100Aerodynamic Diameter (micrometers)Aerodynamic Diameter (micrometers)

Testing such inlets requires an inTesting such inlets requires an in--stack stack measurement of droplet size distributionsmeasurement of droplet size distributionsmeasurement of droplet size distributionsmeasurement of droplet size distributions
(DMT forward scattering cloud droplet probe [CDP])probe [CDP])
www.dropletmeasurement.com

The CDP* needs to be reconfigured for wet stack The CDP* needs to be reconfigured for wet stack applicationsapplicationsapplicationsapplications
Wet stack simulator
*cloud droplet probe

The CDP* can be adapted to determine typical The CDP* can be adapted to determine typical droplet size distributions in a stack at thedroplet size distributions in a stack at thedroplet size distributions in a stack at the droplet size distributions in a stack at the
extraction pointextraction point
tbe
r cou
ntN
um
Channel
*cloud droplet probe
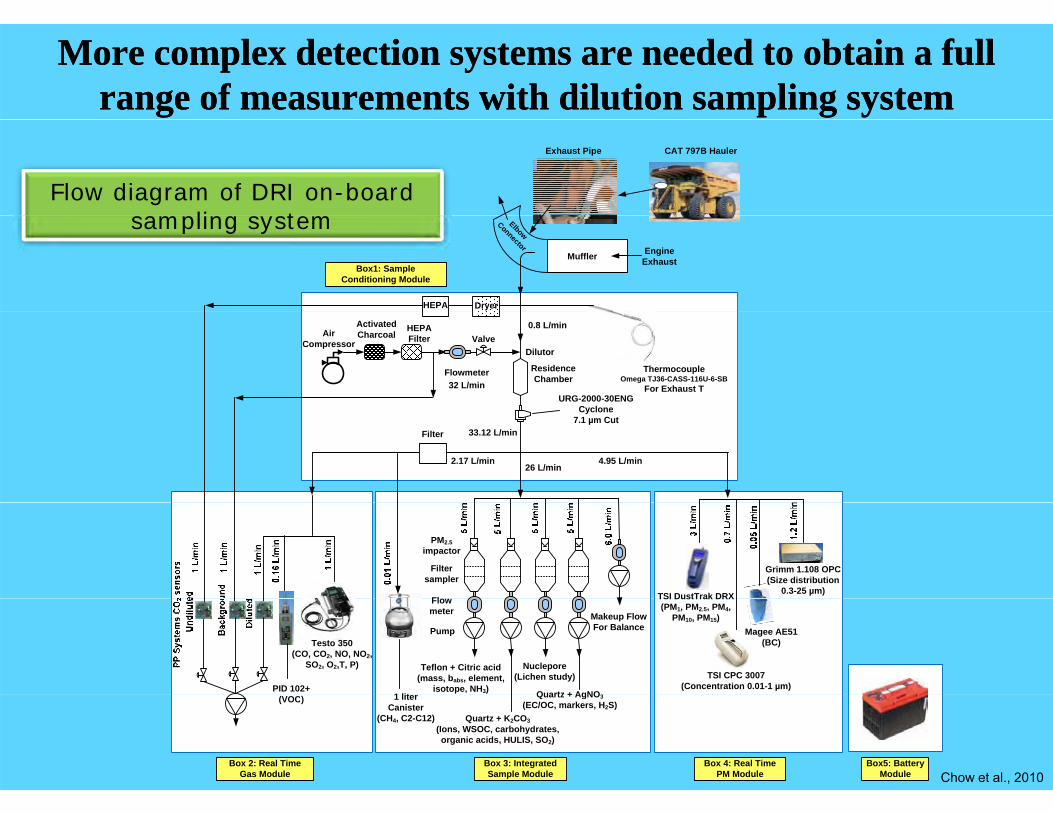
More complex detection systems are needed to obtain a full More complex detection systems are needed to obtain a full range of measurements with dilution sampling systemrange of measurements with dilution sampling system
CAT 797B HaulerExhaust Pipe
Flow diagram of DRI on-board li t
Muffler
Elbow
Connector EngineExhaust
DryerHEPA
Box1: Sample Conditioning Module
sampling system
ThermocoupleOmega TJ36-CASS-116U-6-SB
For Exhaust T URG-2000-30ENG
C l
0.8 L/min
ResidenceChamber
HEPAFilter
Activated CharcoalAir
Compressor Valve
32 L/minFlowmeter
Dilutor
Cyclone7.1 µm Cut
Filter
4.95 L/min26 L/min
2.17 L/min
33.12 L/min
PM2.5impactor
Filtersampler
Fl TSI DustTrak DRX
Grimm 1.108 OPC(Size distribution
0.3-25 µm)
Teflon + Citric acid (mass, babs, element,
isotope, NH3)
Pump
Quartz + AgNO
Nuclepore (Lichen study)
Flow meter
TSI DustTrak DRX(PM1, PM2.5, PM4,
PM10, PM15)Magee AE51
(BC)
TSI CPC 3007(Concentration 0.01-1 µm)
Testo 350(CO, CO2, NO, NO2,
SO2, O2,T, P)
PID 102+1 lit
Makeup FlowFor Balance
Quartz + K2CO3(Ions, WSOC, carbohydrates, organic acids, HULIS, SO2)
Quartz + AgNO3(EC/OC, markers, H2S)
Box 3: Integrated Sample Module
Box 4: Real Time PM Module
(VOC)
Box 2: Real Time Gas Module
1 liter Canister
(CH4, C2-C12)
Box5: Battery Module Chow et al., 2010

Sample Conditioning Module (#1) Real-time Gas Module (#2)
More compact and continuous in situ sensors are desiredMore compact and continuous in situ sensors are desiredCaterpillar 797B Heavy p g ( ) Real time Gas Module (#2) Caterpillar 797B Heavy Hauler (345 tons)
Battery MonitorIntegrated Sample Module (#3) Real-time PM Module (#4) Battery (#5)
Pumps
Filter PacksCanisterPump for Makeup Flow Flowmeters
Deep Cycle Marine Battery
Voltage Regulator
Each module measures = 80 cm L × 52 cm W × 32 cm H
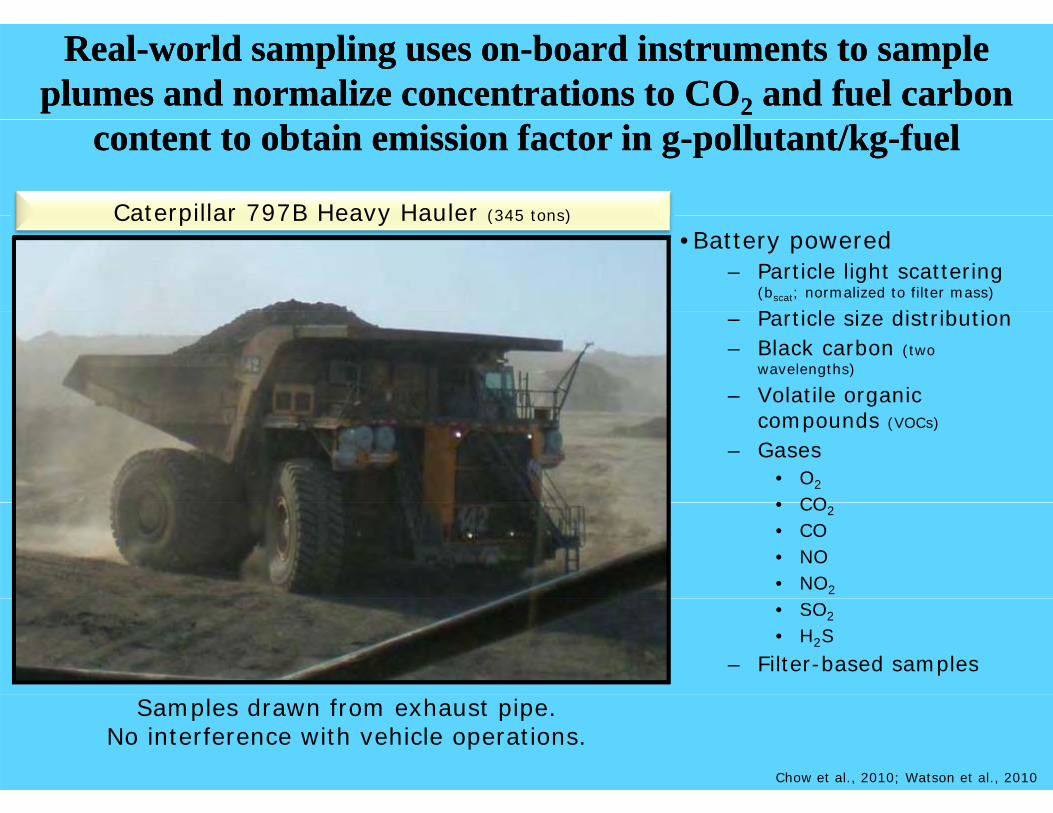
RealReal--world sampling uses onworld sampling uses on--board instruments to sample board instruments to sample plumes and normalize concentrations to COplumes and normalize concentrations to CO22 and fuel carbon and fuel carbon
content to obtain content to obtain emission factor in gemission factor in g--pollutant/kgpollutant/kg--fuelfuel
Caterpillar 797B Heavy Hauler (345 tons)
•Battery powered– Particle light scattering
(bscat; normalized to filter mass)
P ti l i di t ib ti
Caterpillar 797B Heavy Hauler (345 tons)
– Particle size distribution– Black carbon (two
wavelengths)
– Volatile organic compounds (VOCs)
– Gases• O2
• CO• CO2
• CO• NO• NO2
• SO2
• H2S– Filter-based samples
Samples drawn from exhaust pipe. No interference with vehicle operations.
Chow et al., 2010; Watson et al., 2010

Sampling port is connected to the exhaust pipe Sampling port is connected to the exhaust pipe (muffler outlet)(muffler outlet)(muffler outlet)(muffler outlet)
AthabascaAthabasca Oil Sands Region
Sampling Modules
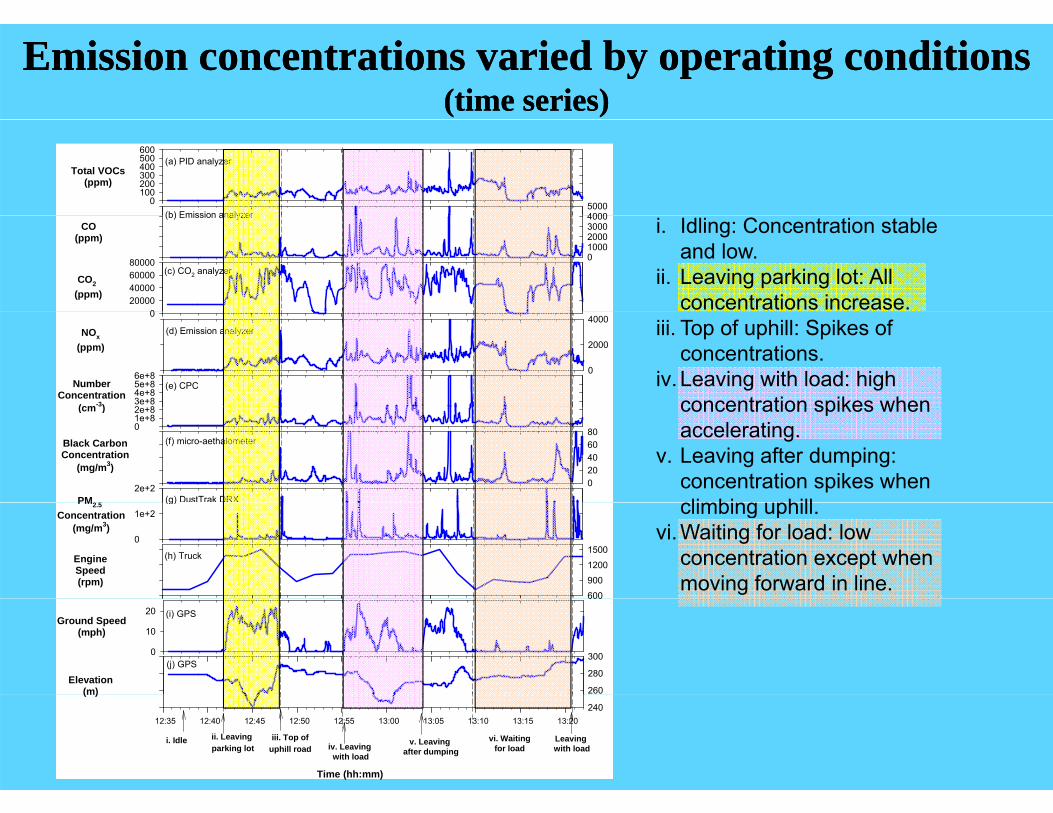
Emission concentrations varied by operating conditions Emission concentrations varied by operating conditions (time series)(time series)
40005000
Total VOCs(ppm)
0100200300400500600
(b) Emission analyzer
(a) PID analyzer
i. Idling: Concentration stable and low.
ii. Leaving parking lot: All concentrations increase.
CO2 (ppm)
020000400006000080000
CO(ppm)
01000200030004000
(c) CO2 analyzer
(b) Emission analyzer
iii. Top of uphill: Spikes of concentrations.
iv.Leaving with load: high concentration spikes when
0
NOx(ppm)
0
2000
4000
NumberConcentration
(cm-3) 2 83e+84e+85e+86e+8
(d) Emission analyzer
(e) CPC
concentration spikes when accelerating.
v. Leaving after dumping: concentration spikes when climbing phill
Black CarbonConcentration
(mg/m3)020406080
(cm )
01e+82e+8
PM2 5
2e+2
(f) micro-aethalometer
(g) DustTrak DRX climbing uphill.vi.Waiting for load: low
concentration except when moving forward in line.
PM2.5 Concentration
(mg/m3)0
1e+2
EngineSpeed(rpm)
600
9001200
1500(h) Truck
(g)
Ground Speed(mph)
0
10
20
600
Elevation(m) 260
280
300
(i) GPS
(j) GPS
Time (hh:mm)
12:35 12:40 12:45 12:50 12:55 13:00 13:05 13:10 13:15 13:20
(m)240
i. Idle ii. Leaving parking lot iv. Leaving
with load
v. Leaving after dumping
Leaving with load
iii. Top ofuphill road
vi. Waitingfor load
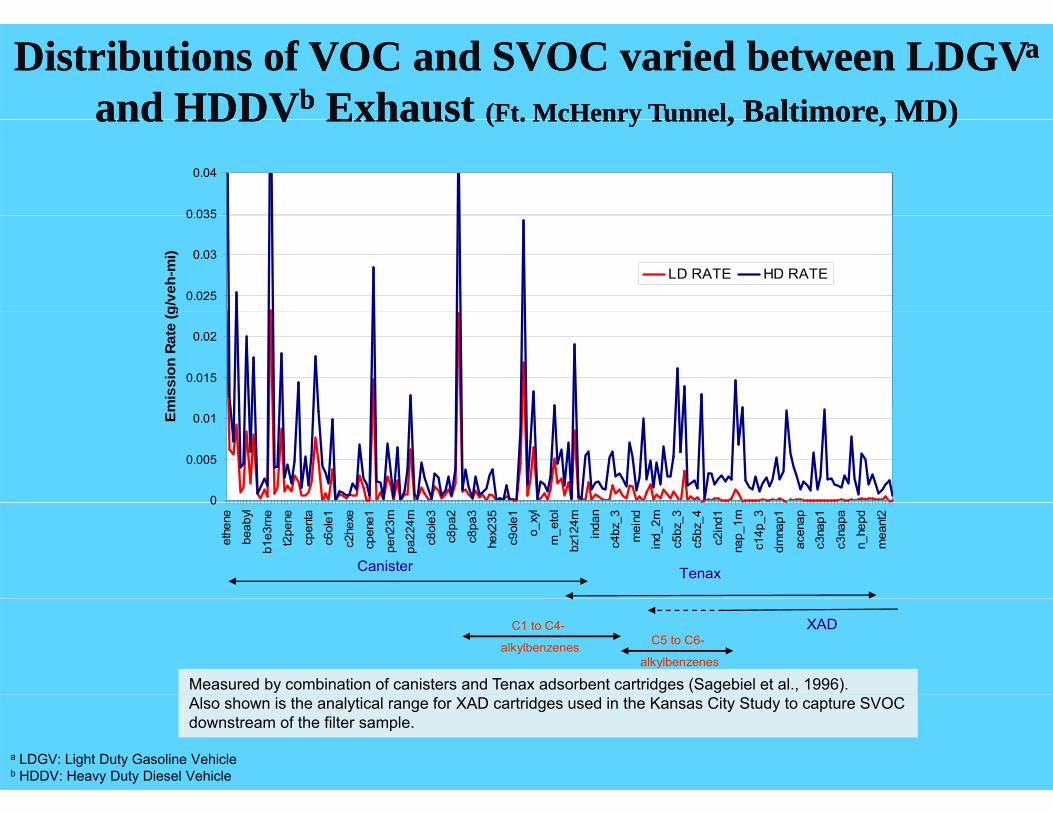
Distributions of VOC and Distributions of VOC and SVOCSVOC varied between varied between LDGVLDGVaa
andand HDDVHDDVbb ExhaustExhaust (Ft(Ft. McHenry. McHenry TunnelTunnel, Baltimore, MD), Baltimore, MD)and and HDDVHDDV Exhaust Exhaust (Ft(Ft. McHenry . McHenry TunnelTunnel, Baltimore, MD), Baltimore, MD)
0 035
0.04
0.025
0.03
0.035
g/ve
h-m
i)
LD RATE HD RATE
0.015
0.02
mis
sion
Rat
e (g
0
0.005
0.01Em
0
ethe
ne
beab
yl
b1e3
me
t2pe
ne
cpen
ta
c6ol
e1
c2he
xe
cpen
e1
pen2
3m
pa22
4m
c8ol
e3
c8pa
2
c8pa
3
hex2
35
c9ol
e1
o_xy
l
m_e
tol
bz12
4m
inda
n
c4bz
_3
mei
nd
ind_
2m
c5bz
_3
c5bz
_4
c2in
d1
nap_
1m
c14p
_3
dmna
p1
acen
ap
c3na
p1
c3na
pa
n_he
pd
mea
nt2
CanisterCanister TenaxTenax
XADXADC1 to C4C1 to C4--
alkylbenzenesalkylbenzenes C5 to C6C5 to C6--
alkylbenzenesalkylbenzenes
Measured by combination of canisters and Tenax adsorbent cartridges (Sagebiel et al., 1996). Also shown is the analytical range for XAD cartridges used in the Kansas City Study to capture SVOCdownstream of the filter sample.
a LDGV: Light Duty Gasoline Vehicle b HDDV: Heavy Duty Diesel Vehicle
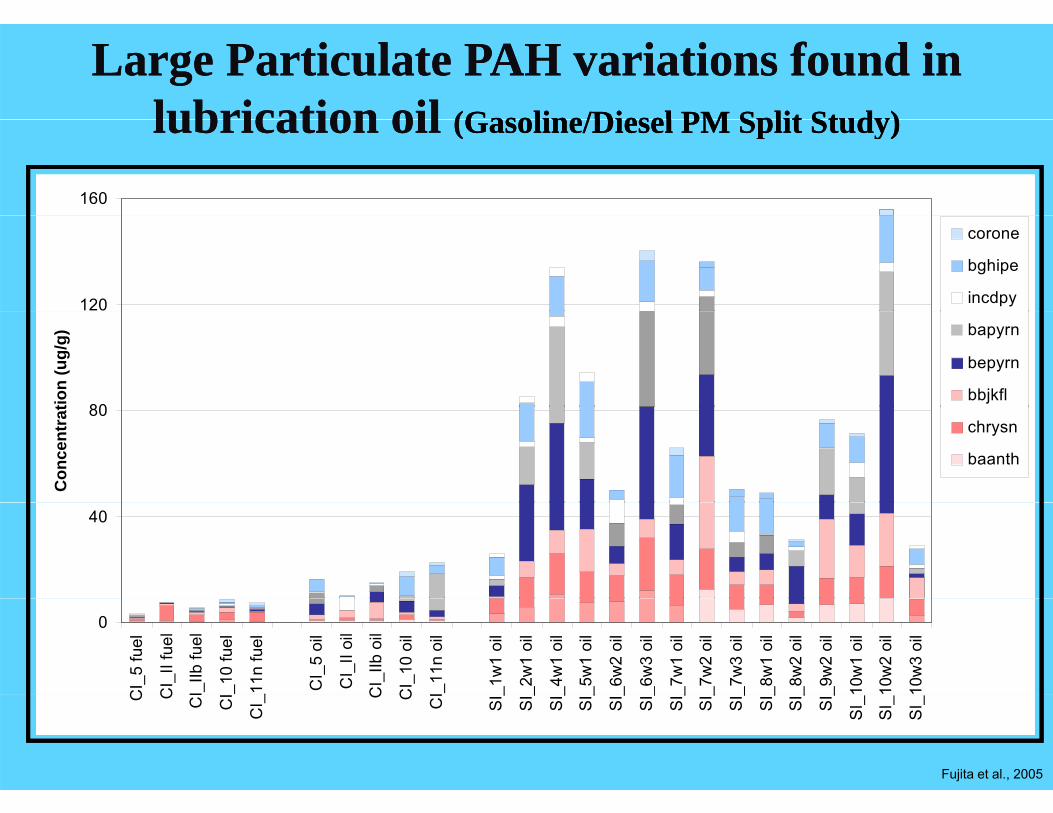
Large Particulate Large Particulate PAHPAH variations found in variations found in lubrication oillubrication oil ((Gasoline/Diesel PM Split Study)Gasoline/Diesel PM Split Study)lubrication oil lubrication oil ((Gasoline/Diesel PM Split Study)Gasoline/Diesel PM Split Study)
160160
120
corone
bghipe
incdpy120
corone
bghipe
incdpy
80tion
(ug/
g) bapyrn
bepyrn
bbjkfl80tio
n (u
g/g) bapyrn
bepyrn
bbjkfl80
Con
cent
rat
chrysn
baanth
80
Con
cent
rat
chrysn
baanth
4040
0
CI_
5 fu
el
CI_
II fu
el
I_IIb
fuel
_10
fuel
_11n
fuel
CI_
5 oi
l
CI_
II oi
l
CI_
IIb o
il
CI_
10 o
il
_11n
oil
_1w
1 oi
l
_2w
1 oi
l
_4w
1 oi
l
_5w
1 oi
l
_6w
2 oi
l
_6w
3 oi
l
_7w
1 oi
l
_7w
2 oi
l
_7w
3 oi
l
_8w
1 oi
l
_8w
2 oi
l
_9w
2 oi
l
10w
1 oi
l
10w
2 oi
l
10w
3 oi
l0
CI_
5 fu
el
CI_
II fu
el
I_IIb
fuel
_10
fuel
_11n
fuel
CI_
5 oi
l
CI_
II oi
l
CI_
IIb o
il
CI_
10 o
il
_11n
oil
_1w
1 oi
l
_2w
1 oi
l
_4w
1 oi
l
_5w
1 oi
l
_6w
2 oi
l
_6w
3 oi
l
_7w
1 oi
l
_7w
2 oi
l
_7w
3 oi
l
_8w
1 oi
l
_8w
2 oi
l
_9w
2 oi
l
10w
1 oi
l
10w
2 oi
l
10w
3 oi
l
Fujita et al., 2005
C C CI
CI
CI _ C C C
I
SI_
SI_
SI_
SI_
SI_
SI_
SI_
SI_
SI_
SI_
SI_
SI_
SI_
SI_
SI_C C C
I
CI
CI _ C C C
I
SI_
SI_
SI_
SI_
SI_
SI_
SI_
SI_
SI_
SI_
SI_
SI_
SI_
SI_
SI_

Combustion sources can be characterized in the Combustion sources can be characterized in the laboratorylaboratorylaboratorylaboratory
Diesel Generator
Acetylene Flame in a hooda hood
• Electric Arc Generator
Wood Stove
(PALAS)
• Carbon Black and Graphite Powder
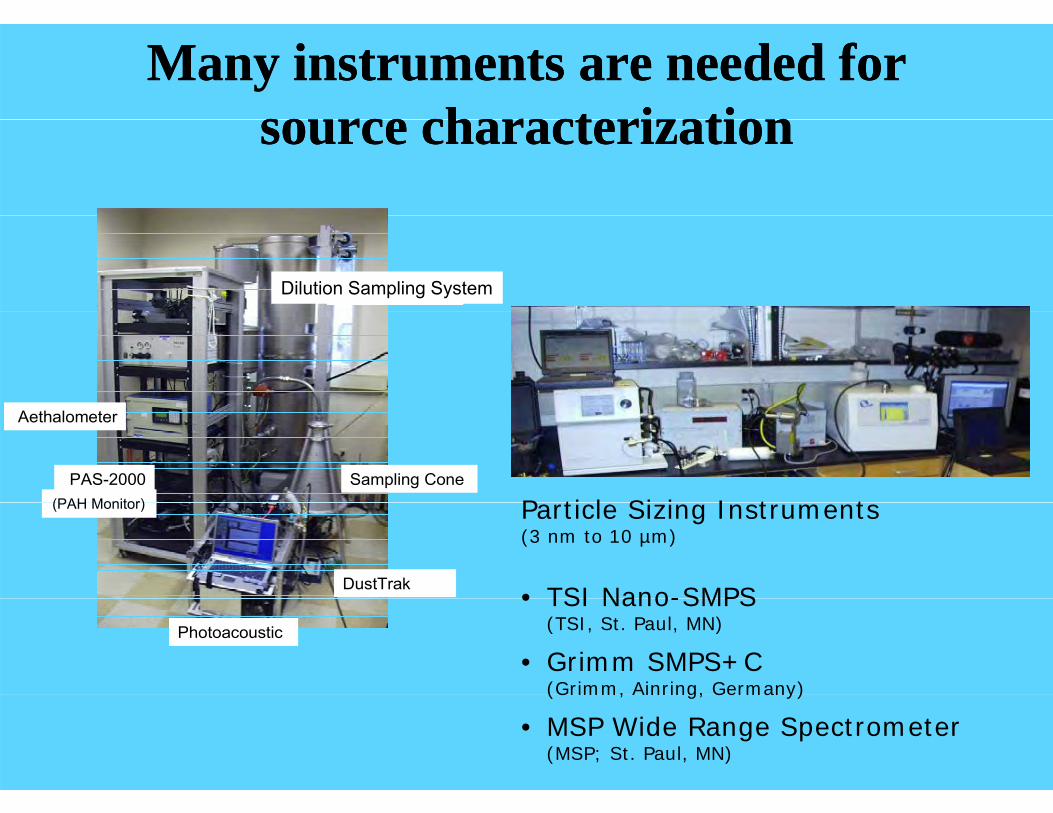
Many instruments are needed forMany instruments are needed forsource characterizationsource characterizationsource characterizationsource characterization
Dilution SystemDilution Sampling System
P ti l Si i I t t
Aethalometer
Sampling ConePAS-2000(PAH Monitor) Particle Sizing Instruments
(3 nm to 10 µm)
DustTrak
(PAH Monitor)
• TSI Nano-SMPSPhotoacoustic
• TSI Nano-SMPS(TSI, St. Paul, MN)
• Grimm SMPS+C(Grimm, Ainring, Germany)(Grimm, Ainring, Germany)
• MSP Wide Range Spectrometer(MSP; St. Paul, MN)

Abundances of different carbon fractions vary by source Abundances of different carbon fractions vary by source (reproducibility is (reproducibility is ++ 15% for all except for wood burning)15% for all except for wood burning)
100%
70%
80%
90%
%) OC1
OC2
50%
60%
70%
erce
ntag
e ( OC2
OC3OC4OPR
20%
30%
40%
Mas
s P
e
EC1-OPREC2EC3
OC1 – OC4 at 140, 280, 480, and
0%
10%
kW , 20 -
me
6.5
950
ent
50
580 °C in a 100% He atmosphere
EC1 EC3
Die
sel @
4k
D.R
. ~40
Woo
d sm
oke
Dilu
tion
Rat
io 2
120
Ace
tyle
ne F
lam
(2")
; D.R
. ~16
PA
LAS
@ 9
stro
m c
urre
lect
ric A
rc @
9EC1 – EC3 at 580, 740, and 840 °C in a 98% He/2% O D EHe/2% O2atmosphere
Chow et al., 2006, Report to ARB

Characterizing biomass burning is most Characterizing biomass burning is most h ll ih ll ichallengingchallenging
Flaming Phase: hot and dark; high combustion efficiency
Smoldering Phase: not-so-hot and white; low combustion efficiency(W t f ll Fi C Cit NV 14 J l 2004)(Waterfall Fire near Carson City, NV; 14 July 2004)
• Optical Properties }p p• Size Distribution• Emission Factors } Phase Specific?
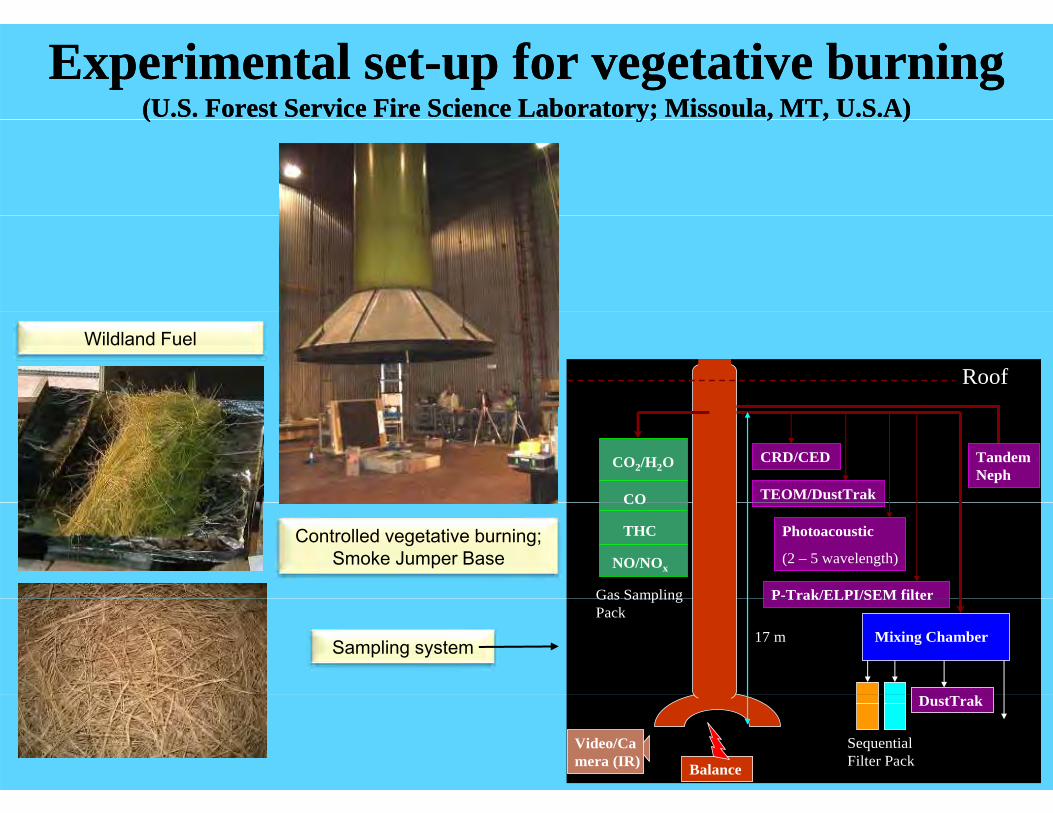
Experimental setExperimental set--up for vegetative burningup for vegetative burning(U.S. Forest Service Fire Science Laboratory; Missoula, MT, U.S.A)(U.S. Forest Service Fire Science Laboratory; Missoula, MT, U.S.A)( y; , , )( y; , , )
Roof
Wildland Fuel
CO2/H2O
CO
CRD/CED
TEOM/DustTrak
Tandem Neph
Controlled vegetative burning; Smoke Jumper Base
CO
THC
NO/NOx
Gas Sampling
Photoacoustic
(2 – 5 wavelength)
P-Trak/ELPI/SEM filterGas Sampling Pack
17 m
P Trak/ELPI/SEM filter
Mixing ChamberSampling system
DustTrak
Sequential Filter PackBalance
Video/Camera (IR)
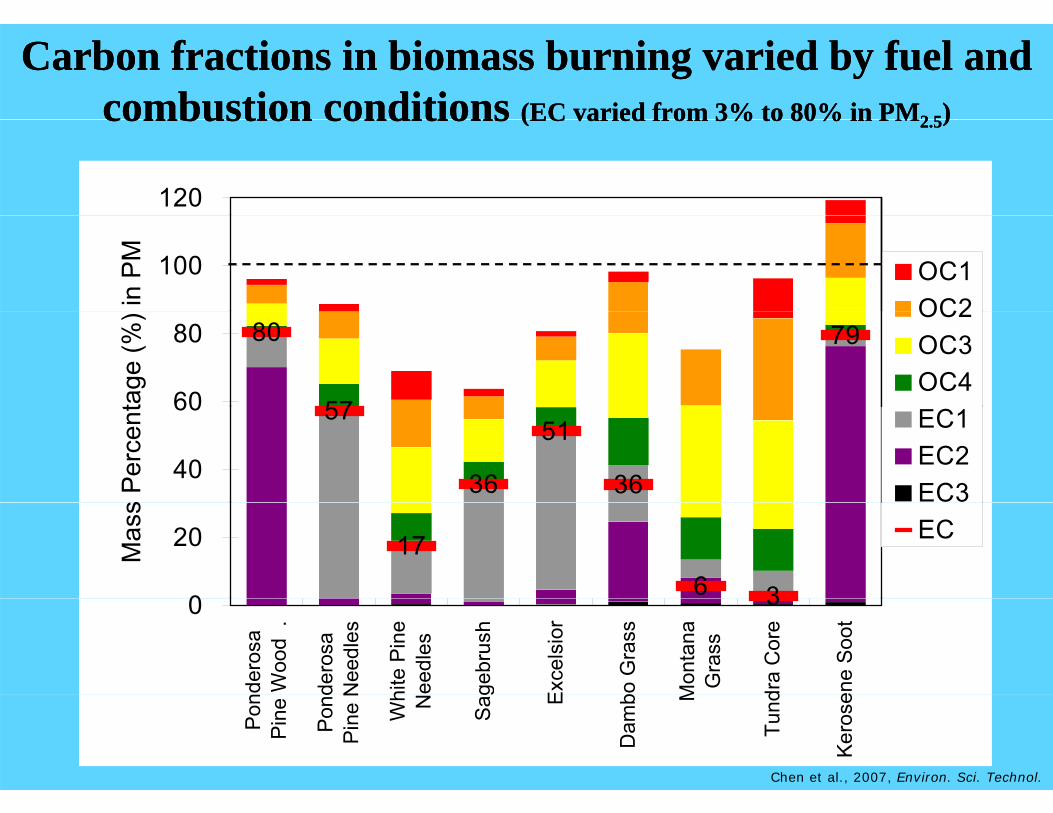
Carbon fractions in biomass burning varied by fuel and Carbon fractions in biomass burning varied by fuel and combustion conditionscombustion conditions (EC varied from 3% to 80% in(EC varied from 3% to 80% in PMPM2 52 5))combustion conditions combustion conditions (EC varied from 3% to 80% in (EC varied from 3% to 80% in PMPM2.52.5))
120
100
in P
M
OC1OC2
80
57
79
60
80
tage
(%) OC2
OC3OC4
5751
363640
60
s P
erce
nt EC1EC2EC3
176 30
20Mas
s
EC
30
dero
saW
ood
.
dero
saN
eedl
es
hite
Pin
eee
dles
gebr
ush
Exc
elsi
or
bo G
rass
Mon
tana
Gra
ss
dra
Cor
e
ene
Soo
t
Chen et al., 2007, Environ. Sci. Technol.
Pon
Pin
e
Pon
dP
ine
N
Wh N Sag E
Dam
b M
Tund
Ker
ose

T i iT i iTransmission Transmission Electron Electron
MiMiAcetylene flame Flaming rice straw Diesel exhaust
Microscope Microscope (TEM) shows (TEM) shows
degree of degree of carbonization carbonization Flaming white oak Kerosene flame
varies by varies by sourcesource
Smoldering pine bark Burned plastic
Tumolva et al., 2010, Aerosol Sci.Tech.

Chemical Analysesa
Complete characterization of filter samples allows markers to be identifiedComplete characterization of filter samples allows markers to be identified
Nuclepore polycarbonate-membrane
Silver nitrate-impregnated cellulose-fiber
K2O3-impregnated cellulose-fiber
Citric acid-impregnated cellulose-fiber
Quartz-fiber filter
Quartz-fiber filter
Teflon-membrane filter
Teflon-membrane
Quartz-fiber
Quartz-fiber
Citric acid-impregnated
K2O3-impregnated
Silver nitrate-impregnated cellulose fiber
Nucleporepolycarbonate-
bmembrane filter
cellulose fiber filter
cellulose fiber filter
cellulose fiber filter
filter
~1-2 cm2
0.5 cm2 punch
½ filter extracted in
XRF for 51 elementsb
½ filter extracted in
Whole filter without
Elemental analysis or
½ filter extracted in
filter filter filter cellulose-fiber filter
cellulose-fiber filter
cellulose-fiber filter
membrane filter
punch
20 ml distilled-deionized water (DDW)
Acid OC EC carbon Organic Ammonia by
10 ml 1:11 hydrogen peroxide: DDW dilution
extraction morphological analysis for lichen studies
Sulfur dioxide by Hydrogen
10 ml DDW
a Analytical Instruments: Acid Digestion
ICP-MS for rare-earth elements and
OC, EC, carbon fractions, carbonate by thermal/optical carbon
Organic Markers by TD-GC/MSc
Ammonia by AC
Sulfur dioxide by IC
Hydrogen sulfide by XRF as sulfur
y AAS: Atomic absorption spectroscopy AC: Automated colorimetry ELSD: Evaporative light scattering
detector HPLC-IEC: High performance liquid
chromatography with an ion exchange column
IC: Ion chromatography b Al – U (see Table 7-1) elements and
isotopesd
10 ml for anions and cationse by IC, AC, and AAS, acidified to pH 2 with
1 ml for total WSOC by thermal/optical
Filtration of 5 ml through 0.2 µm PTFE syringe filter
IC: Ion chromatography IC-PAD: IC with pulsed amperometric
detector ICP-MS: Inductively coupled plasma –
mass spectrometry PTFE: Polytetrafluoroethylene SEC: Size-exclusion chromatography TD-GC/MS: Thermal desorption-gas
c 124 organic marker species (see Table 7-1)
d Cs, Ba, La, Ce, Pr, Nd, Sm, Eu, Gd, Tb, Dy, Ho, Er, Tm, Yb, Lu, Pb204, 205, 206, 207, 208
e Cl-, NO2, NO3-, PO4
=, SO4= (by
IC); NH4+ (by AC); Na+, Mg++, K+,
and Ca++ (by AAS) AAS, acidified to pH 2 with thermal/optical carbon
1 ml speciated WSOC 1 ml for NC 1 ml for MDA 1 ml for PA
chromatography/mass spectrometry UV/VIS: Ultraviolet detector XRF: X-ray fluorescence Observables OC: Organic carbon EC: Elemental carbon HULIS: Humic-like substances
and Ca (by AAS)
1 ml speciated WSOC separated into three classes: NC, MDA, and PA by HPLC-IEC and UV/Vis detection at 254 nm
1 ml for NC speciation (e.g., carbohydrates) by IC-PAD
1 ml for MDA speciation (e.g., organic acids) by IC with conductivity detector
1 ml for PA speciation (e.g., HULIS) by HPLC–SEC–ELSD–UV/VIS
HULIS: Humic like substances MDA: Mono/dicarboxylic acids NC: Neutral/basic compounds PA: Polycarboxylic acids
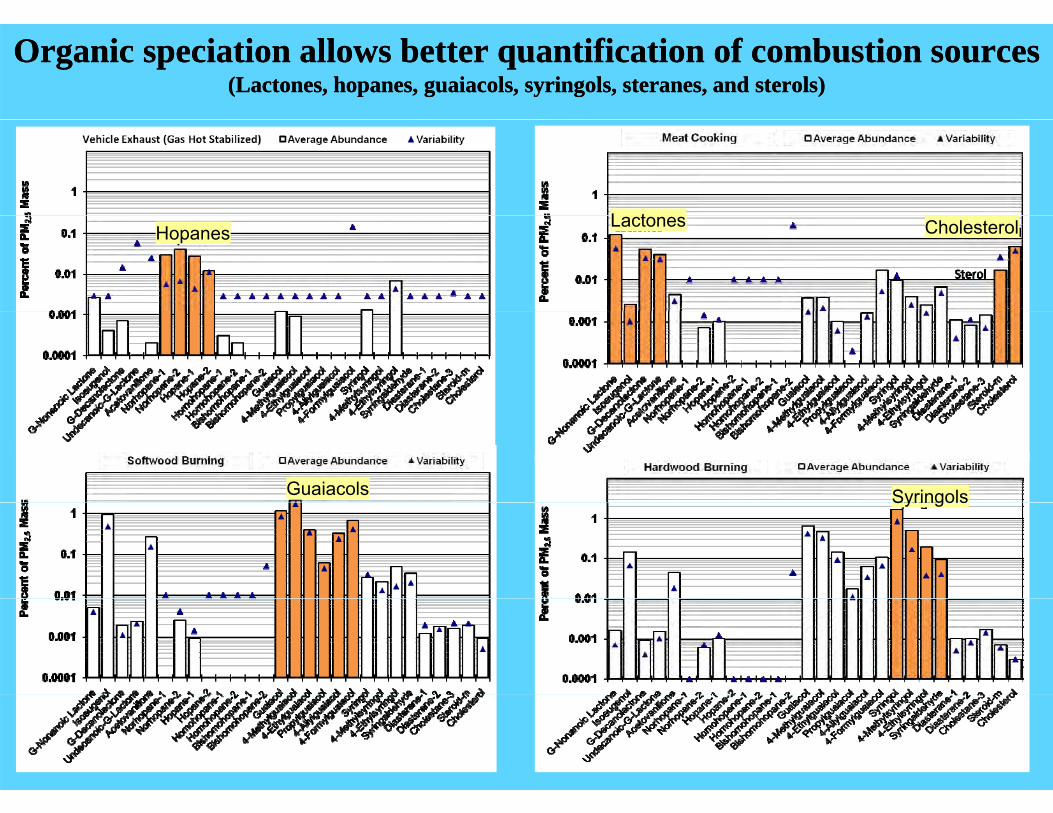
Organic speciation allows better quantification of combustion sourcesOrganic speciation allows better quantification of combustion sources(Lactones(Lactones, , hopaneshopanes, , guaiacolsguaiacols, , syringolssyringols, , steranessteranes, and , and sterols)sterols)
L tHopanes
Lactones Cholesterol
Guaiacols SyringolsSyringols

Global carbon inventories are uncertainGlobal carbon inventories are uncertain
Anthropogenic Fossil Fuels Biomass Burning
Sum of fossil fuel and biomass burningBC: 8 – 14 Tg/yr
Tg/yr = teragrams/year
BC: 8 14 Tg/yrOC: 33.4 – 62.2 Tg/yr
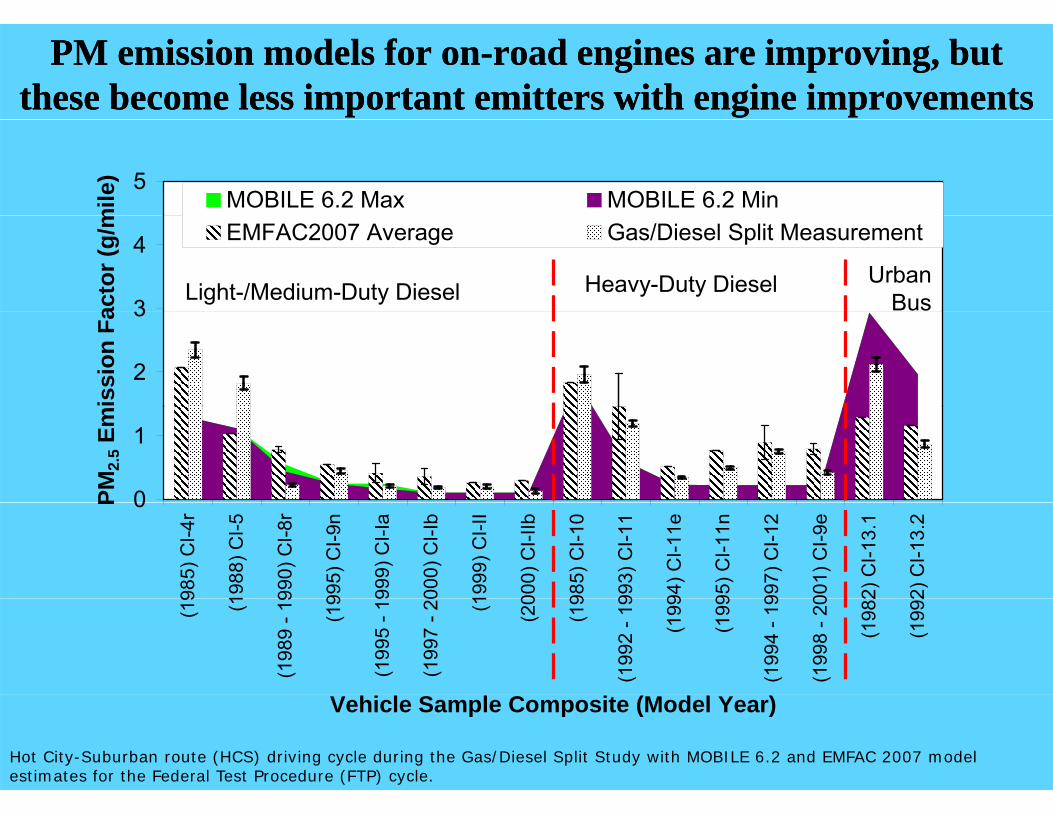
PM emission models for onPM emission models for on--road engines are improving, but road engines are improving, but these become less important emitters with engine improvementsthese become less important emitters with engine improvements
5
mile
)
MOBILE 6.2 Max MOBILE 6.2 Min
3
4
acto
r (g/
m EMFAC2007 Average Gas/Diesel Split Measurement
Heavy-Duty DieselLight-/Medium-Duty DieselUrban
Bus
2
3
issi
on F
a
0
1
PM2.
5 Em
0
985)
CI-4
r
1988
) CI-5
990)
CI-8
r
995)
CI-9
n
999)
CI-I
a
000)
CI-I
b
1999
) CI-I
I
000)
CI-I
Ib
985)
CI-1
0
993)
CI-1
1
94) C
I-11e
95) C
I-11n
997)
CI-1
2
001)
CI-9
e
2) C
I-13.
1
2) C
I-13.
2
P
(19 (1
(198
9 - 1
9
(19
(199
5 - 1
9
(199
7 - 2
0 (1 (20
(19
(199
2 - 1
9
(199
(199
(199
4 - 1
9
(199
8 - 2
0
(198
2
(199
2
Vehicle Sample Composite (Model Year)
Hot City-Suburban route (HCS) driving cycle during the Gas/Diesel Split Study with MOBILE 6.2 and EMFAC 2007 model estimates for the Federal Test Procedure (FTP) cycle.
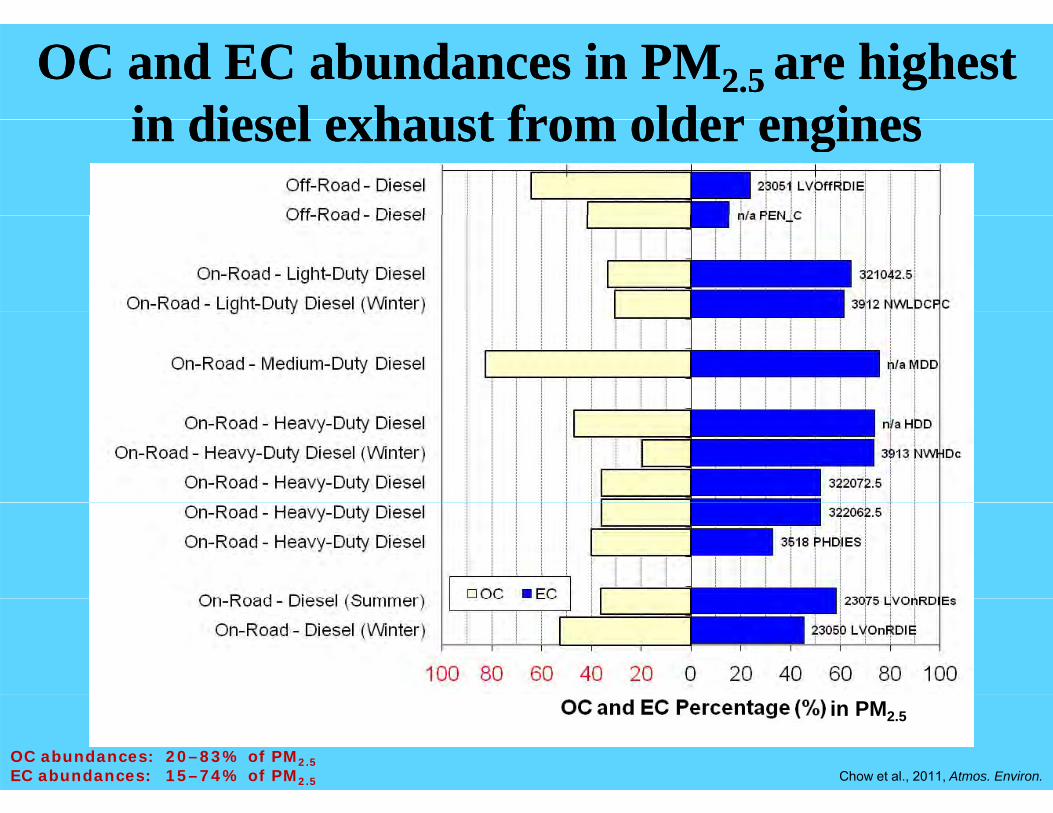
OC and EC abundances in PMOC and EC abundances in PM2.5 2.5 are highest are highest in diesel exhaust from older enginesin diesel exhaust from older enginesin diesel exhaust from older enginesin diesel exhaust from older engines
Chow et al., 2011, Atmos. Environ.OC abundances: 20–83% of PM2.5EC abundances: 15–74% of PM2.5
in PM2.5
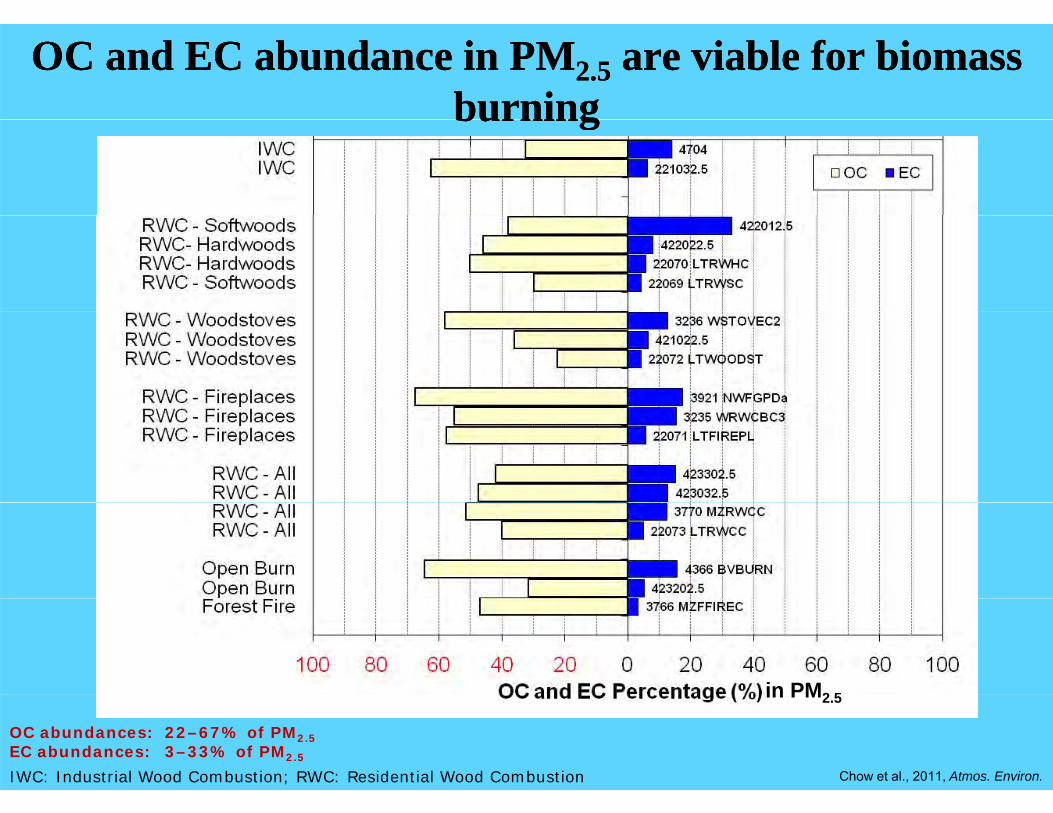
OC and EC abundance in PMOC and EC abundance in PM2.52.5 are viable for biomass are viable for biomass burningburningburningburning
in PM2 5
IWC: Industrial Wood Combustion; RWC: Residential Wood Combustion Chow et al., 2011, Atmos. Environ.
OC abundances: 22–67% of PM2.5EC abundances: 3–33% of PM2.5
in PM2.5

OC and EC abundances in OC and EC abundances in PMPM2.5 2.5 are generally low in industrial are generally low in industrial stack emissions with efficient control measuresstack emissions with efficient control measures
in PM2 5
OC abundances: 2–82% of PM2.5EC abundances: below minimum detectable limit–0-5% of PM2.5 Chow et al., 2011, Atmos. Environ.
2.5
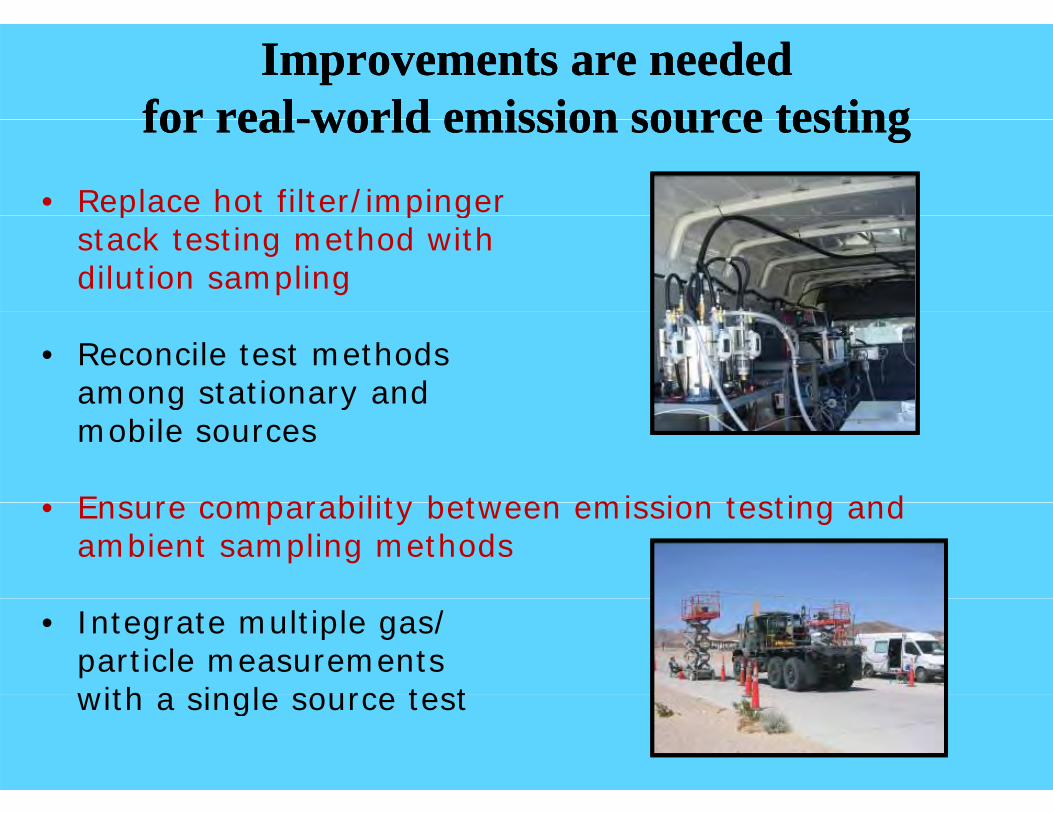
Improvements are neededImprovements are neededfor realfor real--world emission source testingworld emission source testingfor realfor real--world emission source testingworld emission source testing
• Replace hot filter/impingerp / p gstack testing method with dilution sampling
• Reconcile test methods among stationary and g ymobile sources
• Ensure comparability between emission testing and • Ensure comparability between emission testing and ambient sampling methods
• Integrate multiple gas/particle measurements with a single source testwith a single source test

ConclusionsConclusions• U.S. EPA certification methods are costly to apply
and do not represent real-world emissionsp• Resources used for certification and compliance
tests would yield more useful results if they were tests would yield more useful results if they were directed toward more real-world emission testing
• A variety of modern emission characterization • A variety of modern emission characterization methods exist that can practically obtain real-world emission factors profiles and activity world emission factors, profiles, and activity levels for global emission inventories
• Black Carbon (BC) or elemental carbon (EC) • Black Carbon (BC) or elemental carbon (EC)
abundances vary by an order of magnitude among pollution sources especially for vehicle among pollution sources, especially for vehicle exhaust and biomass burning

ReferencesReferences• Burtscher, H. (2005). Physical characterization of particulate emissions from diesel engines: A review. J. Aerosol Sci.,
36(7): 896-932.
• Chang, M.-C.O.; Chow, J.C.; Watson, J.G.; Glowacki, C.; Sheya, S.A.; Prabhu, A. (2005). Characterization of fine particulate emissions from casting processes. Aerosol Sci. Technol., 39(10): 947-959.
• Chen, L.-W.A.; Moosmüller, H.; Arnott, W.P.; Chow, J.C.; Watson, J.G.; Susott, R.A.; Babbitt, R.E.; Wold, C.E.; Lincoln, E.N.; Hao, W.M. (2007). Emissions from laboratory combustion of wildland fuels: Emission factors and source profiles. Environ. Sci. Technol., 41(12): 4317-4325.
• Chow, J.C.; Watson, J.G.; Doraiswamy, P.; Chen, L.-W.A.; Sodeman, D.A.; Ho, S.S.H.; Tropp, R.J.; Kohl, S.D.; Trimble, D.L.; Fung, K.K. (2006). Climate change - Characterization of black carbon and organic carbon air pollution D.L.; Fung, K.K. (2006). Climate change Characterization of black carbon and organic carbon air pollution emissions and evaluation of measurement methods, Phase I. Report Number DRI 04-307; prepared by Desert Research Institute, Reno, NV, for California Air Resources Board, Sacramento, CA; http://www.arb.ca.gov/research/apr/past/04-307_v1.pdf
• Chow, J.C.; Wang, X.L.; Kohl, S.D.; Gronstal, S.; Watson, J.G. (2010). Heavy-duty diesel emissions in the Athabasca Oil Sands Region In Proceedings 103rd Annual Meeting of the Air & Waste Management Association Tropp R J Sands Region. In Proceedings, 103rd Annual Meeting of the Air & Waste Management Association, Tropp, R. J., Legge, A. H., Eds.; Air & Waste Management Association: Pittsburgh, PA, 1-5.
• Chow, J.C.; Watson, J.G.; Chen, L.-W.A.; Lowenthal, D.H.; Motallebi, N. (2011). Source profiles for black and organic carbon emission inventories. Atmos. Environ., accepted.
• England, G.C.; Watson, J.G.; Chow, J.C.; Zielinska, B.; Chang, M.-C.O.; Loos, K.R.; Hidy, G.M. (2007a). Dilution-based g , ; , ; , ; , ; g, ; , ; y, ( )emissions sampling from stationary sources: Part 1. Compact sampler, methodology and performance. J. Air Waste Manage. Assoc., 57(1): 65-78.
• England, G.C.; Watson, J.G.; Chow, J.C.; Zielinska, B.; Chang, M.-C.O.; Loos, K.R.; Hidy, G.M. (2007b). Dilution-based emissions sampling from stationary sources: Part 2. Gas-fired combustors compared with other fuel-fired systems. J. Air Waste Manage. Assoc., 57(1): 79-93.J. Air Waste Manage. Assoc., 57(1): 79 93.
• Fujita, E.M.; Campbell, D.E.; Centric, A.; Arnott, W.P.; Chow, J.C.; Zielinska, B. (2005). Exposure to air toxics in mobile source dominated microenvironments, year-2 annual report. Report Number HEI contract 4704-RFA03-1/03-16; prepared by Desert Research Institute, Reno, NV, for Health Effects Institute, Boston, MA.
• Moldanova, J.; Fridell, E.; Popovicheva, O.B.; Demirdjian, B.; Tishkova, V.; Faccinetto, A.; Focsa, C. (2009). Characterisation of particulate matter and gaseous emissions from a large ship diesel engine. Atmos. Environ., 43(16): 2632-2641.

ReferencesReferences• Sagebiel, J.C.; Zielinska, B.; Pierson, W.R.; Gertler, A.W. (1996). Real-world emissions and calculated reactivities of
organic species from motor vehicles. Atmos. Environ., 30(12):2287-2296.
• Tumolva, L.; Park, J.Y.; Kim, J.S.; Miller, A.L.; Chow, J.C.; Watson, J.G.; Park, K. (2010). Morphological and elemental classification of freshly emitted soot particles and atmospheric ultrafine particles using the TEM/EDS Aerosol Sci classification of freshly emitted soot particles and atmospheric ultrafine particles using the TEM/EDS. Aerosol Sci. Technol., 44(3): 202-215.
• U.S. EPA (1996). Method 202. Condensible Particulate Matter - Determination of condensible particulate emissions from stationary sources. prepared by U.S. Environmental Protection Agency, Office of Air Quality Planning and Standards, Technical Support Division, Research Triangle Park, NC, http://www.epa.gov/ttn/emc/promgate/m-202.pdf
• U.S. EPA (1997). Compilation of air pollutant emission factors. Volume I: Stationary point and area sources. prepared by U. S. Environmental Protection Agency, Office of Air and Radiation, Office of Air Quality Planning and Standards, Research Triangle Park, NC.
• Watson, J.G.; Chow, J.C. (2007). Receptor models for source apportionment of suspended particles. In Introduction to Environmental Forensics, 2nd Edition, 2; Murphy, B., Morrison, R., Eds.; Academic Press: New York, NY, 279-316.Environmental Forensics, 2nd Edition, 2; Murphy, B., Morrison, R., Eds.; Academic Press: New York, NY, 279 316.
• Watson, J.G.; Chow, J.C.; Wang, X.L.; Kohl, S.D. (2010). Emission characterization plans for the Athabasca Oil Sands Region. In Proceedings, 103rd Annual Meeting of the Air & Waste Management Association, Tropp, R. J., Legge, A. H., Eds.; Air & Waste Management Association: Pittsburgh, PA, 1-6.