Realization of the potential of the Ukraine–EU free trade ...
20
258 Journal of International Studies Scientific Papers © Foundation of International Studies, 2017 © CSR, 2017 Yatsenko, O., Nitsenko, V., Karasova, N., James, H.S.Jr., & Parcell, J.L. (2017). Realization of the potential of the Ukraine–EU free trade area in agriculture. Journal of International Studies, 10(2), 258-277. doi:10.14254/2071-8330.2017/10- 2/18 Realization of the potential of the Ukraine–EU free trade area in agriculture Olha Yatsenko Kyiv National Economic University named after Vadym Hetman, Kyiv, Ukraine Email: [email protected] Vitalii Nitsenko Odessa I.I. Mechnikov National University, Odessa, Ukraine Email: [email protected] Nataliia Karasova National Scientific Center "Institute of Agricultural Economics", Kyiv, Ukraine Email: [email protected] Harvey S. James, Jr. University of Missouri, Columbia, Missouri, USA Email: [email protected] Joe L. Parcell University of Missouri, Columbia, Missouri, USA Email: [email protected] Abstract. The Deep and Comprehensive Free Trade Area (DCFTA) Agreement between Ukraine and the EU has led to the following question: What new opportunities are unveiled for the agricultural sector? The aim of this article is to determine the promising trends in Ukrainian agriculture’s export potential considering the potential adverse effects from highly competitive markets. The authors’ gravity model is based on the research of the Ukraine–EU free trade area operating conditions. The paper provides a forecast on the volumes of trade flows of agricultural food products between the participants of the Agreement and determines advantages and disadvantages of trade and overall economic relationship liberalization. Finally, the ways to improve bilateral relations for Ukraine are proposed. Keywords: free trade area, Ukraine, agricultural sector, export-oriented production. JEL Classification: Q17, F15 Received: December, 2016 1st Revision: May, 2017 Accepted: May, 2017 DOI: 10.14254/2071- 8330.2017/10-2/18
Transcript of Realization of the potential of the Ukraine–EU free trade ...

258
Journal of International
Studies
Sci
enti
fic
Pap
ers
© Foundation of International
Studies, 2017 © CSR, 2017
Yatsenko, O., Nitsenko, V., Karasova, N., James, H.S.Jr., & Parcell, J.L. (2017). Realization of the potential of the Ukraine–EU free trade area in agriculture. Journal of International Studies, 10(2), 258-277. doi:10.14254/2071-8330.2017/10-2/18
Realization of the potential of the Ukraine–EU free trade area in agriculture
Olha Yatsenko
Kyiv National Economic University named after Vadym Hetman, Kyiv, Ukraine Email: [email protected]
Vitalii Nitsenko
Odessa I.I. Mechnikov National University, Odessa, Ukraine Email: [email protected]
Nataliia Karasova
National Scientific Center "Institute of Agricultural Economics", Kyiv, Ukraine Email: [email protected]
Harvey S. James, Jr.
University of Missouri, Columbia, Missouri, USA Email: [email protected]
Joe L. Parcell
University of Missouri, Columbia, Missouri, USA Email: [email protected]
Abstract. The Deep and Comprehensive Free Trade Area (DCFTA) Agreement
between Ukraine and the EU has led to the following question: What new
opportunities are unveiled for the agricultural sector? The aim of this article is to
determine the promising trends in Ukrainian agriculture’s export potential
considering the potential adverse effects from highly competitive markets. The
authors’ gravity model is based on the research of the Ukraine–EU free trade area
operating conditions. The paper provides a forecast on the volumes of trade flows
of agricultural food products between the participants of the Agreement and
determines advantages and disadvantages of trade and overall economic
relationship liberalization. Finally, the ways to improve bilateral relations for
Ukraine are proposed.
Keywords: free trade area, Ukraine, agricultural sector, export-oriented production.
JEL Classification: Q17, F15
Received: December, 2016
1st Revision: May, 2017 Accepted: May, 2017
DOI:
10.14254/2071- 8330.2017/10-2/18

Olha Yatsenko, Vitalii Nitsenko, Nataliia Karasova, Harvey S. James, Jr., Joe L. Parcell
Realization of the potential of the Ukraine–EU free trade area in agriculture
259
1. INTRODUCTION
Conclusion of the Deep and Comprehensive Free Trade Area (DCFTA) Agreement between Ukraine
and EU (European Commission 2014, Shirmammadov, 2015) includes the creation of favorable conditions
for future cooperation between specific countries or groups of countries. The powerful export potential of
Ukraine’s agriculture as well as objective local and global changes at the food and primary commodity
markets create opportunities for intensification of trade and economic activities of Ukraine with the
European Union countries in the context of providing a preferential trade regime.
Irrespective of the instability of the macroeconomic environment, the agricultural sector of Ukraine is
one of the few branches of economy which has demonstrated a positive foreign trade balance in the last 10
years. As of 2015, the share of the agroindustrial complex in the structure of the total export volume of
Ukraine increased up to 27%, thus outperforming metallurgical production (21,6%), which always was the
leader in terms of foreign trade. In the same year, national agricultural sector ranked seventh in wheat
production, fifth in corn production, and third in barley production worldwide. In addition, Ukraine belongs
to the world leaders in sunflower oil production and exports. In accordance with the national model’s focus
on economic cooperation with the EU, Ukrainian agriculture becomes an industry, attractive for
investments and capable of providing investors with significant socioeconomic benefits from production.
Paice and Grimwood (2012) and Hanrahan (2013) researched conceptual and practical challenges in
the development of agri-food export, especially in the context of evergrowing world concerns regarding
food safety point. Such Ukrainian scientists as Antoniuk (2014) and Bestuzheva (2009) studied commodity
and geographical diversification of export flows. Borodyna (2006), Saikevych (2013), and Kvasha and Vlasov
(2015) dealt with the beneficial potential of exports, with special emphasis on Ukraine’s association with the
European Union. Klymenko (2014) analyzed the risks of the European integration project as such. Despite
the progress made under the DCFTA, real-life experience has proven there still is a range of problems
accompanying Ukrainian agri-food products’ adaptation to the requirements and standards of European
market. In addition, a certain dissymmetry exists between the basic terms and conditions of the free trade
area agreement and the levels of economic development in participating countries, which can create certain
risks for national manufacturers and problems for potential investors. Therefore, the aim of this research
is to determine the possibilities and best directions in future development of Ukraine’s agricultural sector
export potential, stemming from the research of the Ukraine-EU DCFTA operating conditions and through
construction of a gravity model, taking into account the potential adverse effects from highly competitive
markets.
2. RESEARCH TECHNIQUES
For the preliminary analysis of the conditions of operation of the free trade area between Ukraine and
the EU and determination of limits for the gravity model, the following information resources were used:
the EUROSTAT (2017), the World Tariff Profiles (2015), the World Bank and the UNCTADstat, Ministry
of Agrarian Policy and Food of Ukraine (2015), the official web site of the European Commission (2016),
official web site of the State Fiscal Service of Ukraine (2016), official web site of the State Statistics
Committee of Ukraine. Based on the data obtained from these resources, this paper will present the general
characteristics of the Free Trade Area Agreement, the trade economic activity in the agri-food industry
between Ukraine and the EU and a respective gravity model for the parties of the Agreement.
In general, gravity models represent one way to determine and assess the key factors affecting the
development of international trade. The basis is Newton’s law of gravitation from which trade between two
countries is balanced based on the size of their economies and the distance between these countries

Journal of International Studies
Vol.10, No.2, 2017
260
(Zakharova, 2014). The gravity model was first proposed by Tinbergen (1962) and Anderson (1979).
Though the gravity model was extensively used in empirical studies from the 1960s, the theoretical
justification of the model has only recently been explored.
The equation proposed by Tinbergen (1962) is as follows:
ij
ij
i
a
iig
d
mmGF
, (1)
where igF is the commodity turnover between countries i and j,
Mi and Mj represent the gross domestic products of countries i and j,
ijd is the factor of selling costs related to export, including logistic costs,
ij represents all other factors having effect on export but not included into the equation,
,, are the constants (model parameters).
At the current stage, there are various interpretations of this model depending on the purpose of
modeling. Thus, in the logarithmic form the gravity equation is expressed by the following formula:
ijijjiij DMMF )ln()ln()ln()ln( 3210 . (2)
The model contains an assumption that β1 and β2 will be positive while β3 will be negative. The gravity
model also influences other variables which may be added to the principal equation depending on the
purpose of modeling.
The modeling techniques described above allow, based on the multifactor model, applying a
mathematical approach to functional dependencies between the factors. In international practice the nature
of processes depends on several values – x1, x2 …xk (Kostenko, 2012). The gravity model, in turn, allows
taking into account the influence of each of the values. The gravity model can also determine the level of
influence caused by crisis developments in the economy of one country on the other country and on bilateral
trade in general.
To assess the parameters of this model, statistical data of the EU and Ukraine for the period between
1996 and 2015 were used. The EU GDP and Ukraine GDP were chosen as iM and jM , respectively. To
measure the distance between countries in this model, different values were chosen depending on the
objectives and factual basis of the research. These objectives can relate to geographical distance or cargo
transportation costs. In this case, ijD value was represented by the world quarterly or year-end average oil
prices since their fluctuations change transportation costs.
3. ANALYSIS OF DCFTA OPERATING CONDITIONS
The deep and comprehensive free trade area (DCFTA) between Ukraine, on the one hand, and the
European Union, European Atomic Energy Community and their member countries, on the other hand,
came into force on the 1st of January, 2016, resulting in signing of the Association Agreement in 2014
(European Commission 2014). Implementation of the free trade regime with the promising trade and
economic partners provides Ukraine with the possibility to diversify the geography and range of national
export in the long term and attract significant investments to the branch.
The European Commission, by its Regulation No. 374/2014 (European Union 2014), introduced
unilaterally the autonomous tariff preferences for the products originating from Ukraine, since 2014. In
particular, 82.2% of duty rates for Ukrainian agricultural products were abolished. For part of the products,

Olha Yatsenko, Vitalii Nitsenko, Nataliia Karasova, Harvey S. James, Jr., Joe L. Parcell
Realization of the potential of the Ukraine–EU free trade area in agriculture
261
Ukrainian exporters gained an additional preference on goods, for which the EU proposed to determine
tariff quotas. However, it should be noted that the initial conditions for DCFTA between the EU and
Ukraine were non-symmetrical. The EU has a great number of specific and combined import duty rates
while in Ukraine, import duty rates are mainly ad valorem. Unlike Ukraine, the EU uses a complex structure
of combined rates for duty and an entry price system. Besides, the Union applies export subsidies and special
protective measures for agricultural products to which Ukraine has no right. However, it should be
mentioned here that the agricultural sector plays a much more important role for Ukrainian economy as
compared with the EU countries (Table 1).
Table 1
Comparative analysis of agricultural indices of Ukraine and EU, average for the period of 2013-2015
Index Unit of measure EU-28 Ukraine
Share of agricultural lands % of total area of lands 43.97 71.25
Agriculture value added % of GDP 1.58 11.79
Agriculture value added per employee USD 25323.61 5495.34
Agricultural employment % of all working
population 4.42 14.80
Rural population % of all population 25,43 30,52
Share of agricultural products export in total export % 9.1 30.9
Share of agricultural products import in total import % 10.2 11.1
Production of agricultural products billion Euro 369,58 16.44
Consumption of agricultural products billion Euro 354.95 10.28
Source: Calculated according to data of International Trade Centre (2016), Project of Kyiv National
Trade and Economic University and EU (2016), Melnyk (2015)].
The EU is an important trade partner of Ukraine in all segments. A significant increase in bilateral trade
and economic cooperation was observed in 2008, which was preconditioned by Ukraine’s accession to the
WTP (World Trade Organization 2008). In the geographical structure of agricultural and food product
exports from Ukraine, a share of EU countries is 28.2% (for comparison: Asian countries – 46.6%, CIS –
10.2%, Africa countries – 13.6%, countries of North America and South America – 0.8%, other countries
– 0.6%). In the geographical structure of agricultural and food products import a share of EU countries is
45.1% (for comparison: Asia countries – 21.4% ,CIS – 9.1% Africa countries – 5.4%, countries of North
America and South America – 13%, other countries – 6%).
The volume of commodity trade with EU countries is 28.5 billion USD or 38.2% of the total trade
volume of Ukraine. EU is an important trade partner of Ukraine in the agricultural products sector too
(commodity groups 1–24 of the harmonized System (HS)). European perspectives increased national cereal,
oil and fruit potential and created a basis for the development of the meat sector and later, the milk complex
in Ukraine. Dynamics of foreign trade with EU convincingly proves the strengthening of economic relations
between Ukraine and EU, and it brings attention to the consolidation of a position concerning domestic
products in the European market as well as the attractiveness of trade with EU countries. In particular,
export of agro-industrial products for the period of 2006–2015 increased 2.7 times and for imported
products 1.3 times (Fig. 1). The increasing attractiveness of EU market has been proved by a positive trade
balance in recent years. In 2015, the positive balance reached a record level in Ukrainian history of over 2.4
billion USD being 17.5% more compared with the previous year.
Journal of International Studies
Vol.10, No.2, 2017
262
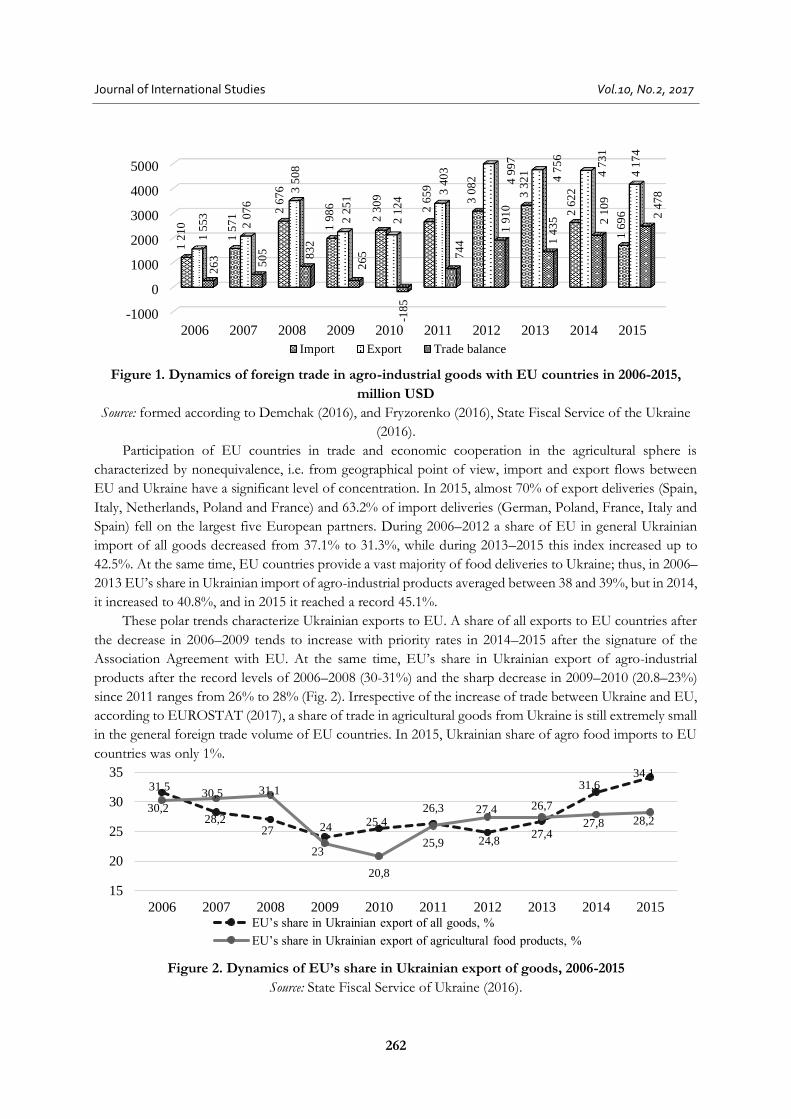
Figure 1. Dynamics of foreign trade in agro-industrial goods with EU countries in 2006-2015,
million USD
Source: formed according to Demchak (2016), and Fryzorenko (2016), State Fiscal Service of the Ukraine
(2016).
Participation of EU countries in trade and economic cooperation in the agricultural sphere is
characterized by nonequivalence, i.e. from geographical point of view, import and export flows between
EU and Ukraine have a significant level of concentration. In 2015, almost 70% of export deliveries (Spain,
Italy, Netherlands, Poland and France) and 63.2% of import deliveries (German, Poland, France, Italy and
Spain) fell on the largest five European partners. During 2006–2012 a share of EU in general Ukrainian
import of all goods decreased from 37.1% to 31.3%, while during 2013–2015 this index increased up to
42.5%. At the same time, EU countries provide a vast majority of food deliveries to Ukraine; thus, in 2006–
2013 EU’s share in Ukrainian import of agro-industrial products averaged between 38 and 39%, but in 2014,
it increased to 40.8%, and in 2015 it reached a record 45.1%.
These polar trends characterize Ukrainian exports to EU. A share of all exports to EU countries after
the decrease in 2006–2009 tends to increase with priority rates in 2014–2015 after the signature of the
Association Agreement with EU. At the same time, EU’s share in Ukrainian export of agro-industrial
products after the record levels of 2006–2008 (30-31%) and the sharp decrease in 2009–2010 (20.8–23%)
since 2011 ranges from 26% to 28% (Fig. 2). Irrespective of the increase of trade between Ukraine and EU,
according to EUROSTAT (2017), a share of trade in agricultural goods from Ukraine is still extremely small
in the general foreign trade volume of EU countries. In 2015, Ukrainian share of agro food imports to EU
countries was only 1%.
Figure 2. Dynamics of EU’s share in Ukrainian export of goods, 2006-2015
Source: State Fiscal Service of Ukraine (2016).
-1000
0
1000
2000
3000
4000
5000
2006 2007 2008 2009 2010 2011 2012 2013 2014 2015
12
10
15
71
26
76
19
86
23
09
26
59
30
82
33
21
26
22
16
96
15
53
20
76
35
08
22
51
21
24
34
03
49
97
47
56
47
31
41
74
26
3 50
5 83
2
26
5
-18
5
74
4
19
10
14
35 2
10
9
24
78
Import Export Trade balance
31,5
28,227 24 25,4
26,3
24,8
26,7
31,634,1
30,2
30,5 31,1
23
20,8
25,9
27,4
27,427,8 28,2
15
20
25
30
35
2006 2007 2008 2009 2010 2011 2012 2013 2014 2015EU’s share in Ukrainian export of all goods, %
EU’s share in Ukrainian export of agricultural food products, %

Olha Yatsenko, Vitalii Nitsenko, Nataliia Karasova, Harvey S. James, Jr., Joe L. Parcell
Realization of the potential of the Ukraine–EU free trade area in agriculture
263
It should be mentioned that a significant portion of agricultural food exports from the EU includes
goods with a high value added, especially in processed products. Agro-industrial imports from the EU is
characterized by a diversified structure wherein a share of most products does not exceed 5% of the total
import; however, a 5% limit is exceeded only by corn (as seed material, feed components for animals (dogs
and cats) and other food components). The total value of food product imports from EU countries in 2015
was 1 169.8 billion USD, and food product exports to EU countries was 4 174.2 billion USD.
Ukrainian exports of agricultural food products is characterized by a dependency on some main
commodity items creating the danger of significant volume variations and values of export deliveries. In
2015, over half of the currency earnings from exports of the agro-industrial complex products was covered
only by three groups of goods such as corn (30.5%), sunflower oil (13.7%) and oil meal and other waste
products from manufacturing of sunflower oil (11.3%).
The Ukraine export and import profit potential led to the DCFTA creation. This is evidenced by
Ukraine’s significant potential to increase its internal market, its steady and relatively high rate of economic
development during recent years and EU’s interest in deepening relations with foreign economic partners,
which was characterized by expansion of access to resource sources. Meanwhile, European markets of agro-
industrial products have become more open and transparent for domestic commodity producers since the
creation of DCFTA. However, raw material orientation of the domestic export has had a negative effect on
trade and economic activity. It should be noted that there is a potential medium—and long-term risk under
the free trade conditions where some agricultural food products of Ukraine,(e.g., meat and milk products)
are not competitive on EU markets.
One of the most important mechanisms of DCFTA implementation between Ukraine and the EU is
application of tariff regulators specified in Part IV "Trade and Trade-Related Matters of the Agreement."
For the moment, entry duty rates are approved by the Law of Ukraine “On the Customs Tariffs of Ukraine"
(Verkhovna Rada of Ukraine 2014). Specific rates are 1% of the total number of rates and determined for
alcohol and tobacco products, the combined rates have not been determined up to date. The Customs Tariff
of Ukraine includes 1357 differentiated preferential and full rates. Detailed information on the current rates
of the cumulative Customs Tariff of Ukraine as of January 1, 2016 is shown in Table 2.
Table 2
Entry duty (preference rates) imposed on goods imported to the customs territory of Ukraine as of
January 1, 2016
Cumulative Customs Tariff of Ukraine
Duty rates, % 0 0,1-5 5,1-10 10,1-15 15,1-20 20,1-25 Over
25 Specific
rates Total
Number of commodity sub-categories, item
3961 2915 2406 765 296 5 10 105 10463
Share of all commodity sub-categories, %
37,86 27,9 23 7,3 2,8 0,05 0,1 1 100
Average rate according to tariff corridors, %
- 3,9 8,9 13,2 19,9 25 48 - -
Maximum level of entry duty rate for preference ad valorem rates: 50%.
For names of the groups 1-24: 50% (of which for 0,3% of commodity sub-categories the entry
duties is determined over 25%)
For names of the groups 25-97: 25% (only 0,1% of commodity sub-categories)
Average rate of Customs Tariff, % 4,9
Source: prepared based on Verkhovna Rada (Parliament) of Ukraine 2014, Storozhchuk (2016), World
Tariff, (WTO, ITC, UNCTAD 2015).

Journal of International Studies
Vol.10, No.2, 2017
264
Ukraine opens, step by step, its market for the goods produced in the EU. Liberalization of the customs
tariff of Ukraine will be continued under the Agreement, since arrangements on the creation of the free
trade area will be fulfilled during the transition period covering a maximum of 10 years as determined by
Article XXIV of GATT of 1994 (WTO 1994). According to the arrangements reached, each party shall
reduce or cancel the duty of goods as per the determined schedules, and the transition period for Ukraine
will be up to 10 years. The change of the EU tariff schedule took place immediately upon the start date of
the Agreement, January 1, 2016.
It should be noted that the EU market is noted for having a better tariff shelter. Agro-industrial goods
have a current 5.3% average rate of entry duty. In Ukraine, the average rate of entry duty is 4.5%. The agro-
food НS 1-24 Group (agriculture) has a custom entry duty rate of 12.2%, and a 9.2% rate for the Ukraine.
At the same time, entry duty rates on the part of EU in specific tariff lines are 1.5–14 times higher than
entry duty rates of Ukraine (WTO, ITC, UNCTAD, 2015).
The research and analysis of the text of the Free Trade Area Agreement shows a mutual agreement
between the parties concerning the change of the procedure of tariff protection of the national agricultural
food market in regard to the commodity group 1-24 HS Ukraine which had to reduce the existing average
rate tariff shelter on agro food products from 6.8%, upon the effective date of the Agreement by 1.3 of that
level as of the 11th year Agreement term. At the same time, the EU had to reduce its existing average rate
of entry duty by 0.6% upon the same date. Thus, Ukraine agreed to reduce the level of tariff shelter of
agricultural food products according to commodity items 1448, being 192 commodity levels higher than
EU opens for Ukraine (Figure A1).
The highest level of tariff protection is peculiar to the milk and milk products market of EU, where
the average tariff in 2014 was 42.1%, while in Ukraine, it was only 10%; sugar and confectionery was 25.2%.
but in Ukraine, the tariff was 19.4%; EU average tariff in 2014 for beverages and tobacco products was
20.7%, in Ukraine, it was 7.9%; EU average tariff for meat and semi-finished meat products was 17.7%, but
in Ukraine it was 10.6%; for grains, EU’s tariff was 14.9%, but Ukraine tariffs were 12.4%; The EU tariffs
for vegetables was 0.94%, and in Ukraine, it was 9,8. The maximum animal products tariffs in EU exceed
138% due to application of tariff quotas for 4.8% of the tariff lines, which are a major portion of agricultural
products. The tariff quotas cover for 11.3% of agricultural products’ tariff lines. Ukraine applies a tariff
quota only to sugar cane with an import tariff of 50% above the average scale (Table A1).
The Deep and Comprehensive Free Trade Area (DCFTA) agreement between Ukraine and EU
(European Commission 2014, Shirmammadov, 2015) also provides abolishment of EU export subsidies,
abolishment of export duties, regulation of the conditions of application of bilateral protective measures,
harmonization of the technical regulation system, sanitary and phytosanitary protection.
Introduction of the tariff quota and respective reduction of entry duties in the EU were established to
provide an increase in the export of Ukrainian agro-industrial products. According to economic estimates,
annual increase of non-quota and quota Ukrainian export during the first year of the Agreement was
expected to produce an increase in trade volumes of not less than 38.6% increase; however, during the
following years the increase is predicted to be essentially less with an average of around 6.1–7.8%. The
increase in export of grain crops, meat and different food derivatives, such as tobacco products, were the
most dependable part of the prediction. The economy or revenues of exporters because of freedom from
payment of the tariff and abolishment of EU export duty under the quota is expected to reach EUR 180-
200 million. As for Ukrainian food market, the corresponding reduction by Ukraine of entry duties was
predicted to lead to a 7% annual increase in imports due to the increase of the volumes of supply of
beverages, meat and byproducts, milk products, and for a part of fruits and vegetables (Table A2).

Olha Yatsenko, Vitalii Nitsenko, Nataliia Karasova, Harvey S. James, Jr., Joe L. Parcell
Realization of the potential of the Ukraine–EU free trade area in agriculture
265
According to the Ministry of Agrarian Policy and Food, previous exporters of products to the EU had
fully used up their quotas. From the moment their trade quotas were totaled, their competitive advantage
increased slightly. It should be noted that the proposed quota volumes for these positions were relatively
insignificant as shown in the 2015 data (reaching a benefit of only 35% as shown in Table A3.
Quotas for the following commodity groups are still not used up: lamb meat, sugar syrups, treated
starch, mushrooms, products of treated milk, treated products of butter, malt and starch processing
products, treated cereal products, treated products of milk cream, cigars and cigarettes.
4. GRAVITY MODEL
The gravity model was used to assess the effectiveness of the free trade area agreement and possible
consequences of the deepening of integration cooperation. Among the econometric methods, gravity
models are a main instrument used to model trade flows of countries. Therefore, based on the detailed
analysis of the scope, capabilities and limitations of such models, gravity model instruments were used to
assess the efficiency of trade cooperation between the Ukraine and EU. The basic data for building the
gravity model for agricultural products is shown in Table A4.
The Tinbergen (1962) gravity model equation describing the dynamics of the foreign trade turnover of
agro-industrial products between Ukraine and EU for the period of 1999-2015 is as follows:
)ln(787,0)ln(127,0)ln(338,1761,18)ln( ijjiij DMMF
Basic results of the model are shown in Table 3. Model evaluation by the main criteria has shown that
the model is statistically significant. The determination coefficient is close to 1, so it approximates data very
well.
Table 3
Tinbergen (1962) gravity model results
Index Value
β0 -18,761
β1 1,338
β2 0,127
β3 0,787
R2 0,9555
R 0,9775
F fact. 114,53
F critic. (0,05) 3,01
This model shows that:
– increasing EU GDP by USD 1.0 will increase two-way agro-industrial commodity turnover by USD
1.338;
– increasing GDP of Ukraine by USD 1.0 will increase foreign trade turnover of agro-industrial
products by USD 0.127;
– increasing oil price by USD 1 will increase two-way agro-industrial commodity turnover by USD
0.787.
Figure 3 shows the foreign trade turnover of agro-industrial products of Ukraine and EU in 1996-2015.

Journal of International Studies
Vol.10, No.2, 2017
266
Figure 3. Actual and modeled values of foreign trade turnover of agro-industrial products of
Ukraine and EU, million USD
Figure 4 shows the volume of bilateral trade in agro-industrial products between 2016 and 2020, which
was forecast by means of the gravity model.
Figure 4. Forecasted turnover of agro-industrial products between the Ukraine and EU from 2016
to 2020, (in million USD)
Thus, calculation of the gravity model of foreign trade turnover of agro-industrial products between
the Ukraine and EU clearly define a significant effect of the EU GDP economic growth. Ukrainian GDP
growth rate has less effect, which can be explained by the differences in the size of EU and Ukraine
economies. As for oil price, the effect is direct, i.e., increasing oil price promotes increasing commodity
turnover between countries; however, gravity model findings provide an opposite effect. This phenomenon
can be explained by the fact that countries are located at relatively short distances and transportation is not
a main part of their expenses; thus, transportation is not critical to the state of commodity turnovers between
countries.
5. SOCIAL EFFECT
Involvement of the national economy to the European labor division system by eliminating trade
barriers and integrating Ukrainian economy into the European production networks creates preconditions
for raising employment and labor productivity as a result of economic development of competitive
industries, namely in the agricultural sector. However, we cannot ignore the threat of rising unemployment.
Elimination of uncompetitive industries and increased labor productivity in many industries will increase
0
2000
4000
6000
8000
10000
1996 1998 2000 2002 2004 2006 2008 2010 2012 2014Modeled values Actual values
6005,50
6789,76
6543,53 6571,52 6630,19
5600,00
6000,00
6400,00
6800,00
7200,00
2016 2017 2018 2019 2020

Olha Yatsenko, Vitalii Nitsenko, Nataliia Karasova, Harvey S. James, Jr., Joe L. Parcell
Realization of the potential of the Ukraine–EU free trade area in agriculture
267
the level of structural unemployment. This problem could severely weaken development of vocational
training and retraining programs as well as programs designed to strengthen private entrepreneurship in the
agricultural sector. In addition, deepened cooperation between the Ukraine and EU in the framework of the
DCFTA comes amid worsening trade relations with Eastern partners, especially Russia. Although in theory
any country can sign a DCFTA with other countries, creation by Ukraine of the DCFTA with the EU is
seen in Russia as a threat to its economic interests, which consequently leads to increased trade barriers.
Table 4 shows social consequences of economic integration by several scenarios: 1) Continued
cooperation on the autonomous EU trade preferences for Ukraine, which operated until 2016 and
strengthened the effect of the free trade zone with Russia, 2) DCFTA; 3) DCFTA and unilateral cancellation
of free trade with Russia.
Table 4
Social consequences of regional integration of Ukraine, % of cumulative change
Scenario 1: Autonomous EU trade preferences
Scenario 2: DCFTA
Scenario 3: DCFTA and cancellation of free
trade with Russia
Welfare change 1.10 12.3 6.30
Urban households 0.70 9.51 4.32
Rural households 0.98 9.41 4.68
Poor households 0.60 8.86 3.97
Non-poor households 0.79 10.20 4.76
Change of wages of unskilled workers 1.90 10.50 5.40
Change of wages of skilled workers 1.50 10.80 5.90
Source: Institute for Economic Research and Policy Consulting, (2014).
Analysis of the impact of DCFTA on different social groups shows that the benefits will increase for
all categories of households, but the growth rate will vary, which may increase the gap between different
sectors. The first issue here is that of poverty. According to calculations, the creation of the EU-Ukrainian
DCFTA will lead to an increase non-poor household benefits by 10.2% in the long term, while poor
household welfare will grow only by 8.9%.
Benefits growth of poor and non-poor households is closely correlated with other indicators, namely
with change of benefits depending on the level of skills of the households members, which affects the
poverty level. Creation of DCFTA means higher wage growth rates primarily for skilled personnel. This
statement finds confirmation in the benefits growth rate of households distributed by skills: higher skills
mean higher benefits growth rates. At the same time, due to the high growth rate of agriculture through
DCFTA, very close benefits growth rates for households located in rural and urban areas are observed.
6. CONCLUSIONS AND DISCUSSION OF THE RESULTS OBTAINED
For the Ukrainian agricultural sector, European economic integration will lead to the modernization
of domestic enterprises, attraction of foreign investments and advanced technologies, competitive recovery
of Ukrainian products, new financial resources for economic development and improvement of its citizens’
living standards. However, the DCFTA does not guarantee the beginning of this Ukrainian integration
process. Ukraine’s integration into EU will be lengthy because of problems and tasks that need to be
completed before the Ukrainian agricultural sector can be fully developed. The raw material orientation of

Journal of International Studies
Vol.10, No.2, 2017
268
Ukrainian exports reveals a low-paying capacity of agricultural producers as well as technological
underdevelopment agriculture.
The main advantage of DCFTA for agricultural trade consists in the partial elimination of asymmetry
in the trade conditions between EU and Ukraine which increased after Ukraine joined the World Trade
Organization (WTO). The asymmetry decreases due to the reduction an average rate of customs tariff for
agricultural products from 23.8% to 0.3% and for food products from 23.2% to 0.7%, and introduction of
tariff quotas with a zero rate for Ukrainian exports to the EU, which promotes a 15% increase in the
turnover of agricultural food products by 2017. Other DCFTA advantages are:
abolishment of export subsidies for EU agricultural products exported to Ukraine,
harmonization of standards with EU facilitating access of domestic products to the EU market,
implementation of agricultural producer support mechanisms,
strategy development and improvement of branch development planning at different hierarchical
levels due to modernization of the state agrarian policy according to EU legislative requirements,
integration of the agrarian policy and agrarian region development policy into general European
policy,
introducing new opportunities for the cooperation,
sharing experience and technologies in the field of organic farming and bio-technologies,
possibilities of compensation to Ukraine for increase in raw material prices due to the abolishment
of export duties at the expense of application of an additional duty during the 15 years of this
Agreement,
the perspective modernization of state agrarian and trade policies according to EU legislative
requirements,
improvement of the business environment due to the simplification of regulatory rules, and
deregulation in the branch and diversification of export flows of agricultural food products.
In addition, implementation of EU strategy concerning small- and medium-scale business development
and business development in niche branches (for example, berry, mushroom farming) will serve as an
impetus for Ukraine entrepreneurship along with the creation of preconditions for vertical integration, as
indicated by clusters of development in production, processing, and distributing, as well as by servicing
cooperatives. The DCFTA will be a springboard for growth in employment and local communities due to
the development of rural territories.
Analysis of DCFTA impacts different social groups, which leads to several important conclusions:
First, all categories of households will benefit from the creation of DCFTA, even if Russia imposes trade
restrictions. Second, welfare growth rates will differ for different categories of households, which means
increasing the social gap. This primarily affects poverty because increased welfare of non-poor households
will be 10.2% in the long term, while welfare growth of poor households will be 8.9%. At the same time,
due to expected high growth of agriculture under the DCFTA very close welfare growth rates for
households located in rural and urban areas will be observed.
The risks may include: improvement of competition and internal markets due to decreases in weighted
average entry duty rates for agricultural products ranging from 4.2% to 0.9%. For finished food products,
these duty rates will fluctuate between 10.3% and 3.6% during the 10 years of the agreement. These
fluctuations may require additional financing from the state budget and an increase in institutional capability
of the respective state authorities. Raw material prices are expected to increase due to the abolishment of
export duties (e.g., sunflower seeds needed to produce sunflower oil).

Olha Yatsenko, Vitalii Nitsenko, Nataliia Karasova, Harvey S. James, Jr., Joe L. Parcell
Realization of the potential of the Ukraine–EU free trade area in agriculture
269
Significant risks are connected with the high value of Ukrainian adjustment in the technical regulation
field to accommodate EU legislation. The costs are related not so much with the legislative implementation
of appropriate standards as with the implementation of new technologies in production, procurement of
appropriate equipment, personnel training etc. The experience of post-socialist countries which have
become EU members shows that these procedures were financed mainly at the expense of the EU, the
World Bank and other international organizations. Thus, the World Bank provided USD 41 million for the
project of modernization of beef houses in Hungary, USD 71 million for the component of sanitary and
phyto-sanitary standards within the project of Poland’s export increase (Ostashko 2013). The total costs of
modernization of production of animal and vegetable products according to EU standards are estimated to
be EUR 900 million during 10 years of implementing the DCFTA (Heits 2014). Under the conditions of a
general economic recession and military and political conflict with Russia, it is extremely difficult for Ukraine
to find free financial resources for the support and stimulation of corresponding transformations in export-
oriented industries.
Besides, there is a risk of restricting Ukrainian products’ access to European markets on the pretext of
their non-conformance to European standards and certificates. The narrowing of the export segment is due
to several factors: 1) the removal from the free trade regime of almost 400 commodity items (mostly
agricultural products), 2) trade liberalization designed to be the most profitable for Ukraine, 3)
implementation by EU of a tariff quota discriminatory system at a very low level (for most kind of products
there quotas are below 6% of the volume of EU volume for these kinds of products (grain, meat etc.), 4)
abolishment of export duty for sunflower oil, which could leave domestic refineries without raw materials,
5) maintenance in EU of the system of multibillion agrarian sector support grants making the export of
Ukrainian products to EU and third countries non-competitive.
According to the results of a Ukrainian business survey carried out by the institute of Economic
Research and political consultations in May of 2016, more than 30% of the food industry enterprises
managed to commence or increase their export to EU after the DCFTA went into effect; however, the main
obstacles preventing the usage of all advantages of the free trade area were considered by producers to be
the incapacity to quickly adjust their products to EU requirements (about 30% of respondents). Other
problems as shown by Figure 5, were the absence of partners and the lack of credits and investments.
Therefore, the government has prioritized the task of achieving macroeconomic stability, which can benefit
from a reduction in the National Bank of Ukraine’s rate thereby improving business access to credits and
promote an increase in investments.
Figure 5. Obstacles preventing Ukrainian producers to enter European markets
Source: (Institute of Economic Research and Policy Consulting (2016) article entitled: Has Ukrainian
Business Benefited from the Creation of the DCFTA with EU?
0 10 20 30 40
Lack of knowledge of EU legislation
Lack of knowledge about EU markets
Incapacity to quickly adjust products to market
requirements
Lack of credits and investments
Absence of partners in EU countries
Incapacity to quickly adjust products to EU
standards
% of business respondents

Journal of International Studies
Vol.10, No.2, 2017
270
In addition, the successful implementation of the DCFTA Agreement between Ukraine and EU will
be promoted by harmonization of market and state regulatory methods with simultaneous adjustment of
national legislation to accommodate EU legislative requirements in the priority spheres. The objective is to
accelerate the negotiation process concerning a new format of relations in economy, foreign trade, regional
and social policy, industrial and cross-border development. Those implementing the DCFTA will also be
monitoring environment protection and ecological safety, effective application of economic diplomacy
methods to overcome barriers while exporting products to European markets in the long-term. In this case,
the first steps to the creation of an effective mechanism to provide DCFTA adaptation information to
business participants as well as legal and other state support to exporters. Success will allow Ukrainian
businesses to prosper and attract foreign investment and commercialization of projects.
In order to minimize risks for the agrarian sector connected with the establishment of the EU-
Ukrainian DCFTA, leaders must improve the principles of an Euro-integration policy to accelerate works
on the program of agro-industrial complex adjustment to operation under the conditions of the common
European market and a common agrarian policy. This policy must promote the formation, correction and
implementation of the Ukrainian agrarian and trade policy, synchronizing national reforms with
Eurointegration to improve investment in agriculture. Ukraine has already implemented DCFTA provisions
concerning administration of commodity origin and tariff regulators, especially the implementation of the
regulatory and legal framework. Software information systems have been provided. A place to issue
certificates has been established, which is close to the potential exporters/producers. A mechanism to
authorize (approve) exports for the determination of product origin has been introduced. This mechanism
simplifies the application process with an instrument of Ukrainian origin than can offer confirmation for
supplies delivered to EU.
In the context of globalization, all sectors of national economies become interdependent, mutually
conditioned and complementary, and the place and role of the state in the world economy is determined by
the number of exportable branches and the volume and value of environmentally sustainable standardized
products. The formation and support of the strategic export generating sectors of economy able to create
global products is a priority task of the state.
REFERENCES
Anderson, J. (1979). A theoretical foundation for the gravity equation. American Economic Review, 69, 106-116.
Antoniuk, O. P. (2014). Agri-food Export Analysis. Food Industry Economics, 3(23), 27–32.
Bestuzheva, S. V. (2015). Foreign Trade Development Directions in the Agriculture of Ukraine. Global and National
Economic Problems, 4, 41–45.
Borodina, O. M. (2006). Agricultural Sector of Ukraine on the Way Towards European Integration: monograph. Uzhgorod: IBA:
109–119.
Demchak, I., Mytchenko, O., & Maidaniuk, O. (2016). Foreign trade of Ukraine in agro-industrial products with EU countries.
Kyiv: Research Institute "Ukragropromproduktyvnist".
European Commission. (2013). EU-Ukraine Deep and Comprehensive Free Trade Area, Reading Guide. Retrieved from
https://trade.ec.europa.eu/doclib/docs/2013/april/tradoc_150981.pdf
European Commission. (2014). Deep and Comprehensive Free Trade Area (DCFTA) between Ukraine and EU, Association
Agreement. Official Journal of the European Commission, 161 pages, Released May 29, 2014. Retrieved from
http://trade.ec.europa.eu/doclib/docs/2016/november/tradoc_155103.pdf
European Commission. (2016). Addition to Annex І-А to the Association Agreement between Ukraine on the one part and
European Union and its member countries on the other part. Accessed November 2016. Retrieved from
http://www.kmu.gov.ua/docs/Agreement/Annex_I-A_to_Agreement.pdf.
European Commission. (2016). Official website. December 2016. Retrieved from http://www.eur-lex.europa.eu.

Olha Yatsenko, Vitalii Nitsenko, Nataliia Karasova, Harvey S. James, Jr., Joe L. Parcell
Realization of the potential of the Ukraine–EU free trade area in agriculture
271
EUROSTAT. (2017). Database. Accessed January 2017. Retrieved from http://ec.europa.eu/eurostat
European Union. (2014). Regulation (EU) No 374/2014 of the European Parliament and of the Council of the European Union,
EUR-Lex - 32014R0374 – EN. Official Journal of the European Union. Retrieved from http://eur-
lex.europa.eu/legal-content/EN/TXT/?uri=CELEX%3A32014R0374
Fryzorenko, A. (2016). Foreign trade of Ukraine in goods and services in 2015: statistical book. Kyiv: State Statistics Service of
Ukraine.
Heits, V. (2014). Assessment of influence of the Association / FTA Agreement between Ukraine and EU on economy of Ukraine.
Kyiv: "Institute of Economics and Forecasting.
Institute of Economic Research and Policy Consulting. (2016). Has Ukrainian Business Benefited from the Creation of the
DCFTA with EU? Retrieved August 2016 from http://www.ier.com.ua/ua/publications/articles?pid=5358
Institute for Economic Research and Policy Consulting and International renaissance foundation. (2014). The effects
of creation of deep and comprehensive free trade area between Ukraine and the EU/Institute for Economic
Research and Policy Consulting. Retrieved December 2016 from
http://www.ier.com.ua/files/Projects/report_2014-11-28_edited.pdf.
Klymenko, I. (2014). Risks of European Integration Project: challenges and opportunities for Ukraine. PhilSci archive. Accessed
August 2016. Retrieved from http://www.niss.gov.ua/articles/1003/.
Kostenko, N. (2012). Methodology of research and determination of geo-economic priorities by countries in the
process of regional integration. Bulletin of International Nobel Economic Forum, 1(5), 157-166.
Kvasha, S. M., & Vlasov, V. I. (2013). Exports and Imports of the Agri-Food in Ukraine: Status and Trends. Kyiv: NSC IAE.
Kvasha, S. (2014). Signing of the Association Agreement between Ukraine and European Union: challenges and
perspectives. Retrieved July 2016 from http://www.fem.sumdu.edu.ua/…/presentation_2014_last.pdf.
Melnyk, T., & Holovachova, O. (2015). Foreign Economic Regulatory Policy in Agro-Industrial Sphere: national and
foreign experience. Economic Annals-XXI, 3-4(2), 12-16.
Ministry of Agrarian Policy and Food of Ukraine. (2016). Official website. Retrieved January 2016 from
http://minagro.gov.ua.
Ministry for Foreign Affairs of Ukraine. (2016). The Association Agreement between Ukraine and EU. Retrieved
January 2016 from http://www.kmu.gov.ua/kmu/docs/EA/00_Ukraine-
EU_Association_Agreement_(body).pdf.
State Fiscal Service of Ukraine. (2016). Official website. Retrieved January 2016 from http://sfs.gov.ua/.
State Statistics Committee of Ukraine. (2016). Official website. Retrieved January 2016 from
http://www.ukrstat.gov.ua/.
Ostashko, T. (2013). Agricultural markets under the influence of expected changes in trade regimes. Retrieved December 2016
fromhttp://nbuv.gov.ua/UJRN/econprog_2013_3_9.
Kyiv National Trade and Economic University and EU. (2016). Project "The Deep and Comprehensive Free Trade
Area with European Union: advantages and disadvantages for Ukrainian society", common project of Kyiv
National Trade and Economic University and EU, (certificate No. 562453-EPP-1-2015-1-UA-EPPJMO-
MODULE, 13.06-17.06.2016).
Ryzhenkov, M., Halko, S., & Movchan, V. (2013). Influence of the Deep and Comprehensive FTA between EU and Ukraine on
Agricultural Trade. Consulting work. APD/PP/01/2013.
Saykevych, M. I. (2013). Export Potential of Agricultural Enterprises. Innovative Economy, 41, 104-110.
Shirmammadov, K. (2015). DCFTA (Deep and Comprehensive Free Trade Agreement) in EU and Ukraine Relations.
J Pol Sci Pub Aff, 3, 170. doi:10.4172/2332-0761.1000170
Storozhchuk, V. (2016). Realization of Tariff Regulation under the Association Agreement between Ukraine and EU. Ternopil:
Publication and Printing Center of Ternopil National Economic University "Economic Thought".
Tinbergen, J. (1962). Shaping the World Economy; Suggestions for an International Economic Policy. Books (Jan Tinbergen).
Twentieth Century Fund, New York. Retrieved from http://hdl.handle.net/1765/16826.
International Trade Centre. (2016). Trade statistics for international business development. Retrieved December 2016
from http://www.trademap.org/Product_SelCountry_TS.aspx?nvpm=
UNCTADstat. (2016). Online information. Retrieved December 2016 from http://unctadstat.unctad.org/EN/.

Journal of International Studies
Vol.10, No.2, 2017
272
Verkhovna Rada of Ukraine. (2014). On the Customs Tariff of Ukraine: The Law of Ukraine. 2014. Gazette of the
Verkhovna Rada of Ukraine, 20-21, 740.
Win-TV Instrument. (2016). Inexhaustible. How Ukrainian Exporters Used European Quotas. Retrieved December
2016 from http://pobedit.com.ua/prom-news/1035.
World Bank. (2015). Online information. Retrieved December 2016 from http://data.worldbank.org/indicator.
World Trade Organization (WTO), International Trade Centre (ITC), United Nations Conference on Trade and
Development (UNCTAD) (2015). World Tariff Profiles, an annual publication containing a comprehensive compilation of the
tariffs imposed by each of the 161 WTO members pus a number of other countries and customs territories. Retrieved December
2016 from https://www.wto.org/english/res_e/booksp_e/tariff_profiles15_e.pdf.
World Trade Organization. (2008). WTO Welcomes Ukraine as a New Member, online press release. Retrieved from
https://www.wto.org/english/news_e/pres08_e/pr511_e.htm.
WTO. (1994). General Agreement on Tariffs and Trade 1994. WTO analytical index: GATT 1994, Article XIVV: Territorial
Application – Frontier Traffic – Customs Unions and Free-trade Areas. Retrieved from
https://www.wto.org/english/res_e/booksp_e/analytic_index_e/gatt1994_09_e.htm
Zakharova, O. (2014). Peculiarities of application of gravity models in the analysis of international trade cooperation.
Bulletin of Mariupol State University. Economics, 8, 145–151.

Olha Yatsenko, Vitalii Nitsenko, Nataliia Karasova, Harvey S. James, Jr., Joe L. Parcell
Realization of the potential of the Ukraine–EU free trade area in agriculture
273
APPENDIX
а) The initial level and the final level of tariff shelter of EU, %
b) The initial and final level of Ukraine tariff shelter, %
Figure A1. Changes in entry duties of EU and Ukraine based on individual agricultural products
Source: (Ryzhenkov, 2013)
0 5 10 15 20 25 30 35
Living animals
Meat
Milk and eggs
Fish
Grains
Vegetables and fruits
Sugar
Coffee and tea
Animal feedstuff
Food products
Beverages
Tobacco products
Animal oils and fats
Vegetable oils and fats
0
0
0
0
3,1
0,8
0,4
0,1
0
1,2
0,6
0
0
0
1,2
9,5
5,3
10,9
27,6
13,8
17,6
6,1
20,4
22,1
8
31,8
2,5
5,7
1st year 10th year
0 5 10 15 20 25 30 35
Living animals
Meat
Milk and eggs
Fish
Grains
Vegetables and fruits
Sugar
Coffee and tea
Animal feedstuff
Food products
Beverages
Tobacco products
Animal oils and fats
Vegetable oils and fats
0
0
0
0
3,1
0,8
0,4
0,1
0
1,2
0,6
0
0
0
1,2
9,5
5,3
10,9
27,6
13,8
17,6
6,1
20,4
22,1
8
31,8
2,5
5,7
1-st year2 10-th year

Journal of International Studies
Vol.10, No.2, 2017
274
Table A1
Tariff quotas introduced by EU regarding imports from Ukraine
Product Stipulated quota
Beef 12 000 t/year
Pork meat 20 000 t/year +20 000 t/year for some commodity groups
Poultry meat and by-products 16 000 t/year with gradual increase during 5 years up to 20 000 t/year +20 000 t/year for some commodity groups
Milk, cream, condensed milk and yoghurts
8 000 t/year with gradual increase during 5 years up to 10 000 t/year
Lamb meat 1 500 t/year with gradual increase during 5 years up to 2 250 t/year
Dairy butter and spreads 1 500 t/year with gradual increase during 5 years up to 3 000 t/year
Eggs and albumens 1 500 t/year with gradual increase during 5 years up to 3 000 t/year
Honey 5 000 t/year with gradual increase during 5 years up to 6 000 t/year
Sugar 20 070 t/year
Soft wheat, wheat flour and granules 950 000 t/year with gradual increase during 5 years up to 1 000 000 t/year
Barley, barley flour and granules 250 000 t/year with gradual increase during 5 years up to 350 000 t/year
Corn, corn flour and granules 400 000 t/year with gradual increase during 5 years up to 650 000 t/year
Mill offal, wastes and remains 16 000 t/year with gradual increase during 5 years up to 21 000 t/year
Grape juice and apple juice 10 000 t/year with gradual increase during 5 years up to 20 000 t/year
Treated sugar products 2 000 t/year with increase during 5 years up to 3 000 t/year
Food stuff 2 000 t/year
Reference material 27 000 t/year with gradual increase during 5 years up to 100 000 t/year
Cigars and cigarettes 2 500 t/year
Mushrooms 500 t/year +500 t/year for some codes
Treated tomatoes 10 000 t/year
Source: prepared according to European Commission (2016). Addition to Annex І-А

Olha Yatsenko, Vitalii Nitsenko, Nataliia Karasova, Harvey S. James, Jr., Joe L. Parcell
Realization of the potential of the Ukraine–EU free trade area in agriculture
275
Table A2
Tariff quotas introduced by Ukraine for import from EU
Product Stipulated quota
Pork meat 10 000 t/year + 10 000 t/year for some commodity groups
Poultry meat and by-products 8 000 t/year with the possibility of increase during 5 years up to 10 000
t/year + 10 000 t/year for some commodity groups
Sugar 30 000 t/year with increase during 5 years up to 40 000 t/year
Source: prepared according to European Commission (2016). Addition to Annex І-А
Table A3 Calculation of value of Ukrainian quota goods export to countries of European Union
Name of good
1st year 5th year
Quota, t Value,
million USD Quota, t
Value,
million USD.
Animal products
Beef 12000 130,3 12000 130,3
Pork meat 40000 372,8 40000 372,8
Lamb meat 1500 21,1 2250 31,6
Poultry meat 36000 84,0 40000 93,3
Milk 8000 30,0 10000 37,5
Cheese 2000 23,1 2000 23,1
Honey 5000 12,2 6000 14,6
Total animal products 704,2 х 762,2
Vegetable products
Wheat 950000 257,1 1000000 270,6
Barley 250000 66,7 350000 93,4
Corn 400000 92,6 650000 150,4
Starch 10000 30,3 10000 30,3
Total vegetable products 460,5 559,4
Processed products
Sugar 20000 10,5 20000 10,5
Grape juice 10000 9,3 20000 18,6
Apple juice 10000 18,4 20000 36,8
Protein concentrates 2000 24,9 2000 24,9
Reference standard 27000 25,6 100000 94,8
Cigars and Cigarettes 2500 143,8 2500 143,8
Total processed products 260,2 х 362,9
Total agro-industrial products 1424,9 х 1684,5
Without pork and beef 921,8 х 1181,4
Without pork, beef and reference standard 896,2 х 1086,6
Source: Ministry of Agrarian Policy … (2016)

Journal of International Studies
Vol.10, No.2, 2017
276
Table A4 Actual use by Ukraine of duty free quotas for agricultural products to EU countries, 2014–2015
Name Quota
volume, t
2014 2015
Quota used, t Remaining
quota, t Quota used, t
Remaining quota, t
Wheat 950000 950000 0 950000 0
Corn 400000 400000 0 400000 0
Barley 250000 22721 227279 194200 55800
Sugar 20070 522 19548 19851 219
Poultry meat 36000 12360 23640 12000 24000
Mill offal, wastes and remains 16000 1841 14159 3522 12478
Grape juice and apple juice 10000 10000 0 10000 0
Treated tomatoes 10000 10000 0 10000 0
Starch 10000 725 9275 960.5 9039.5
Other sugar 10000 350 9650 10000
Malt and wheat gluten 7000 1991 5009 5104 1896
Barley grain and flour 6300 6300 0 6300 0
Treated sugar products 1810 21 1789 319.8 1490.2
Honey 5000 5000 0 5000 0
Oats 4000 65 3935 4000 0
Garlic 500 36 464 44 456
Source: Ministry of Agrarian Policy… (2016), Win-TV Instrument (2016).

Olha Yatsenko, Vitalii Nitsenko, Nataliia Karasova, Harvey S. James, Jr., Joe L. Parcell
Realization of the potential of the Ukraine–EU free trade area in agriculture
277
Table A5 Main data of gravity model for agricultural products (commodity groups from 01 to 24 based on Ukrainian
Classification of Goods of Foreign Economic Activity (Parts I−IV)
Year Ukraine-EU foreign trade
operations, agro-industrial products, million USD
EU GDP, million USD
Ukrainian GDP, million USD
Oil price, USD/barrel
1996 439,0 9748340 46146 20,5
1997 516,5 9166693 51938 19
1998 531,9 9482905 43374 12,7
1999 453,8 9476802 32706 17,7
2000 526,5 8807159 32375 28,3
2001 859,1 8907736 39309 24,4
2002 1190,1 9716129 43956 25
2003 1571,9 11846291 52010 28,9
2004 2067,3 13683147 67218 38,3
2005 2255,2 14306697 89239 54,40
2006 2844,2 15269348 111885 65,40
2007 3647,1 17663569 148734 72,70
2008 6183,7 19020507 188110 97,70
2009 4236,5 17013493 121552 61,90
2010 4433,4 16946307 141209 79,60
2011 6061,9 18319753 169334 111,00
2012 8073,7 17262975 182592 121,40
2013 8077,4 17970797 188350 108,56
2014 7352,8 18498059 135472 98,90
2015 5870,0 25897283 123279,52 55,27
Source: State Statistics Committee of Ukraine … (2016), UNCTAD… (2016).