Real-Time State of Charge Estimation for Each Cell of ...
15
applied sciences Article Real-Time State of Charge Estimation for Each Cell of Lithium Battery Pack Using Neural Networks JaeHyung Park, JongHyun Lee, SiJin Kim and InSoo Lee * School of Electronic and Electrical Engineering, Kyungpook National University, Daegu 41566, Korea; [email protected] (J.P.); [email protected] (J.L.); [email protected] (S.K.) * Correspondence: [email protected]; Tel.: +82-10-5312-5324 Received: 2 November 2020; Accepted: 1 December 2020; Published: 3 December 2020 Featured Application: Authors are encouraged to provide a concise description of the specific application or a potential application of the work. This section is not mandatory. Abstract: With the emergence of problems on environmental pollutions, lithium batteries have attracted considerable attention as an efficient and nature-friendly alternative energy storage device owing to their advantages, such as high power density, low self-discharge rate, and long life cycle. They are widely used in numerous applications, from everyday items, such as smartphones, wireless vacuum cleaners, and wireless power tools, to transportation means, such as electric vehicles and bicycles. In this paper, the state of charge (SOC) of each cell of the lithium battery pack was estimated in real time using two types of neural networks: Multi-layer Neural Network (MNN) and Long Short-Term Memory (LSTM). To determine the difference in the SOC estimation performance under various conditions, the input values were compared using 2, 6, and 8 input values, and the difference according to the use of temperature variable data was compared, and finally, the MNN and LSTM. The differences were compared. Real-time SOC was estimated using the method with the lowest error rate. Keywords: lithium battery Pack; State of Charge; Multi-Layer Neural Network; Long Short-Term Memory; real-time 1. Introduction With the constant occurrence of energy crisis and environmental pollution in the modern era, the development of natural and efficient energy storage devices is required [1]. Among various energy storage devices, lithium batteries have recently attracted considerable attention due to their advantages, such as high power density, low self-discharge rate, long life cycle, and environmentally friendly characteristics [2]. Lithium batteries have been widely used in various applications, such as electric vehicles, bicycles, and scooters, other means of transportation [3,4], wireless power tools and vacuum cleaners, and smart phones [5]. Lithium batteries are a major power source used as an alternative to existing batteries due to their portability and excellent heat resistance, compared with primary batteries and lead storage batteries. However, if not managed properly, their performance may deteriorate, and they may become damaged, which, in severe cases, may cause an explosion [6]. Such problems are related to economy, reliability, and safety. Therefore, accurate measurement and estimation of the State of Charge (SOC) of a battery are important to improve reliability and provide safe service to users [7]. The SOC is an important parameter of a Battery Management System (BMS) [8] and indicates the available capacity of the current battery. Everything else is based on SOC; thus, accuracy and robustness need to be achieved. Appl. Sci. 2020, 10, 8644; doi:10.3390/app10238644 www.mdpi.com/journal/applsci
Transcript of Real-Time State of Charge Estimation for Each Cell of ...

applied sciences
Article
Real-Time State of Charge Estimation for Each Cell ofLithium Battery Pack Using Neural Networks
JaeHyung Park, JongHyun Lee, SiJin Kim and InSoo Lee *
School of Electronic and Electrical Engineering, Kyungpook National University, Daegu 41566, Korea;[email protected] (J.P.); [email protected] (J.L.); [email protected] (S.K.)* Correspondence: [email protected]; Tel.: +82-10-5312-5324
Received: 2 November 2020; Accepted: 1 December 2020; Published: 3 December 2020�����������������
Featured Application: Authors are encouraged to provide a concise description of the specificapplication or a potential application of the work. This section is not mandatory.
Abstract: With the emergence of problems on environmental pollutions, lithium batteries haveattracted considerable attention as an efficient and nature-friendly alternative energy storage deviceowing to their advantages, such as high power density, low self-discharge rate, and long lifecycle. They are widely used in numerous applications, from everyday items, such as smartphones,wireless vacuum cleaners, and wireless power tools, to transportation means, such as electric vehiclesand bicycles. In this paper, the state of charge (SOC) of each cell of the lithium battery pack wasestimated in real time using two types of neural networks: Multi-layer Neural Network (MNN) andLong Short-Term Memory (LSTM). To determine the difference in the SOC estimation performanceunder various conditions, the input values were compared using 2, 6, and 8 input values, and thedifference according to the use of temperature variable data was compared, and finally, the MNN andLSTM. The differences were compared. Real-time SOC was estimated using the method with thelowest error rate.
Keywords: lithium battery Pack; State of Charge; Multi-Layer Neural Network; Long Short-TermMemory; real-time
1. Introduction
With the constant occurrence of energy crisis and environmental pollution in the modern era,the development of natural and efficient energy storage devices is required [1]. Among various energystorage devices, lithium batteries have recently attracted considerable attention due to their advantages,such as high power density, low self-discharge rate, long life cycle, and environmentally friendlycharacteristics [2]. Lithium batteries have been widely used in various applications, such as electricvehicles, bicycles, and scooters, other means of transportation [3,4], wireless power tools and vacuumcleaners, and smart phones [5].
Lithium batteries are a major power source used as an alternative to existing batteries due to theirportability and excellent heat resistance, compared with primary batteries and lead storage batteries.However, if not managed properly, their performance may deteriorate, and they may become damaged,which, in severe cases, may cause an explosion [6]. Such problems are related to economy, reliability,and safety. Therefore, accurate measurement and estimation of the State of Charge (SOC) of a batteryare important to improve reliability and provide safe service to users [7]. The SOC is an importantparameter of a Battery Management System (BMS) [8] and indicates the available capacity of thecurrent battery. Everything else is based on SOC; thus, accuracy and robustness need to be achieved.
Appl. Sci. 2020, 10, 8644; doi:10.3390/app10238644 www.mdpi.com/journal/applsci

Appl. Sci. 2020, 10, 8644 2 of 15
Currently, the electric vehicle field is where the development of lithium batteries and researchon battery SOC estimation technology are the most significant. It is very important to estimate theSOC in real time due to the characteristics of the electric vehicle, and it is possible to estimate moreaccurately and efficiently to estimate the SOC of other lithium battery products. However, it is difficultto estimate accurate real-time SOC due to cost and limited computational power [9].
Various methods for SOC estimation have been recently proposed. However, most are the SOCthat estimate the battery cell. In addition, studies on how to estimate the SOC in real time are scarce.Lithium-ion batteries can supply stronger power to high-power electrical products with a high energydensity than a cell-based battery. Therefore, estimating the SOC of a battery pack leads to an efficientand safe use of the battery [10].
In this paper, a method for real-time SOC estimation of the cells of the lithium battery packsusing Multi-layer Neural Network (MNN) and Long Short-Term Memory (LSTM) is proposed.The relationship between the voltage and SOC was determined after charging and discharging fourlithium batteries at both room temperature and high temperature. Subsequently, the SOC of eachbattery cell was estimated by learning, with each of the four neural networks, using the collecteddata. Moreover, the performance of the method was evaluated through the simulation. In this paper,SOC estimation was performed in three methods. First, the error rate differences according to thenumber of inputs were compared; second, the error rate differences according to the temperaturevariable data used were compared; and finally, the differences in the performance between the MNNand LSTM were compared. Subsequently, the SOC of the lithium battery was estimated in real timeusing the input value of the learning method obtained with the lowest error rate.
2. Background
2.1. Lithium Battery Pack
Lithium batteries are widely used as major power sources for electric vehicles, owing to their highenergy density, high power density, long life cycle, and environmentally friendly characteristics [11].Battery cells exhibiting high energy density are currently manufactured so that a large amount ofenergy can be stored in the same volume. Battery modules, which include a certain number, protect thebattery cell from external shock and both high and low temperatures. A battery pack is composedof the BMS, and various battery control devices, installed in the battery module. The decline in thebattery cell capacity and the occurrence of failures, due to external shock may cause a breakdownof the battery module composed of multiple battery cells. In addition, a battery pack that containsmultiple battery modules can also cause failure. Even if the same battery is used for the battery pack,the battery cell becomes unbalanced when continuously charged and discharged, due to the differencein electrochemical characteristics [12]. Therefore, an accurate SOC estimation of a battery cell makes itpossible to safely use the battery pack. Figure 1 is a diagram showing the relationship between batterycell, module and pack.
Appl. Sci. 2020, 10, x FOR PEER REVIEW 2 of 16
Appl. Sci. 2020, 10, x; doi: FOR PEER REVIEW www.mdpi.com/journal/applsci
Currently, the electric vehicle field is where the development of lithium batteries and research
on battery SOC estimation technology are the most significant. It is very important to estimate the
SOC in real time due to the characteristics of the electric vehicle, and it is possible to estimate more
accurately and efficiently to estimate the SOC of other lithium battery products. However, it is
difficult to estimate accurate real-time SOC due to cost and limited computational power [9].
Various methods for SOC estimation have been recently proposed. However, most are the SOC
that estimate the battery cell. In addition, studies on how to estimate the SOC in real time are scarce.
Lithium-ion batteries can supply stronger power to high-power electrical products with a high
energy density than a cell-based battery. Therefore, estimating the SOC of a battery pack leads to an
efficient and safe use of the battery [10].
In this paper, a method for real-time SOC estimation of the cells of the lithium battery packs
using Multi-layer Neural Network (MNN) and Long Short-Term Memory (LSTM) is proposed. The
relationship between the voltage and SOC was determined after charging and discharging four
lithium batteries at both room temperature and high temperature. Subsequently, the SOC of each
battery cell was estimated by learning, with each of the four neural networks, using the collected
data. Moreover, the performance of the method was evaluated through the simulation. In this paper,
SOC estimation was performed in three methods. First, the error rate differences according to the
number of inputs were compared; second, the error rate differences according to the temperature
variable data used were compared; and finally, the differences in the performance between the MNN
and LSTM were compared. Subsequently, the SOC of the lithium battery was estimated in real time
using the input value of the learning method obtained with the lowest error rate.
2. Background
2.1. Lithium Battery Pack
Lithium batteries are widely used as major power sources for electric vehicles, owing to their
high energy density, high power density, long life cycle, and environmentally friendly characteristics
[11]. Battery cells exhibiting high energy density are currently manufactured so that a large amount
of energy can be stored in the same volume. Battery modules, which include a certain number, protect
the battery cell from external shock and both high and low temperatures. A battery pack is composed
of the BMS, and various battery control devices, installed in the battery module. The decline in the
battery cell capacity and the occurrence of failures, due to external shock may cause a breakdown of
the battery module composed of multiple battery cells. In addition, a battery pack that contains
multiple battery modules can also cause failure. Even if the same battery is used for the battery pack,
the battery cell becomes unbalanced when continuously charged and discharged, due to the
difference in electrochemical characteristics [12]. Therefore, an accurate SOC estimation of a battery
cell makes it possible to safely use the battery pack. Figure 1 is a diagram showing the relationship
between battery cell, module and pack.
Figure 1. Correlation among the cell, module, and pack of the lithium battery.
Figure 1. Correlation among the cell, module, and pack of the lithium battery.

Appl. Sci. 2020, 10, 8644 3 of 15
2.2. Traditional SOC Estimation Method
Several methods have been proposed for SOC estimation using the data from the current battery.There are battery SOC estimation methods, such as Kalman Filter method [13], Open-Circuit Voltage(OCV) method [14], and neural network method [15]. When charging and discharging the lithiumbattery, the data shows nonlinear characteristics.
In Kalman filtering, SOC estimation can be performed in real time because the extendedKalman filter method is often used because of the nonlinear characteristics of the battery. However,the calculation time is increased according to the increase in the variable [16]. In the OCV method,SOC estimation is performed based on the fact that the remaining capacity of the battery naturallydecreases in proportion to its energy usage. However, real-time SOC estimation, using this methodis difficult, as it requires a large amount of time, requires the battery to be in an equilibrium state,and requires the measurement of the terminal voltage [17].
The MNN and RNN are used to obtain data exhibiting non-linear characteristics of lithiumbatteries. When using MNN, several hidden layers need to be added in the existing neural networkcomposed of faults to obtain data. Through it, the relationship between complex inputs and outputscan be determined. The MNN also has the advantage of adapting well to data, which is suitable for thecontrol problems of nonlinear systems [18,19]. Conversely, the RNN sends the result from the node ofthe hidden layer to that of the output layer and then sends it back to the calculation input of the nodeof the other hidden layer. In general, the RNN is more efficient than the MNN and can be used toachieve better accuracy [20].
We compared the advantages and disadvantages of the conventional OCV method, Kalman filtermethod, neural network method, which are frequently used for SOC estimation, and the proposedmethod in Table 1 [16–27].
Table 1. Advantages and disadvantages of the open-circuit voltage (OCV), Kalman filter, neuralnetwork methods and the proposed method.
SOC Estimation Method Advantage Disadvantage
OCV[17,22–24]
• It is suitable for estimatingthe initial SOC.
• The algorithm is simpleto implement.
• It is difficult to use in generalbecause it requires accuratevoltage measurement.
• It is difficult to measure SOC inreal time because the voltage mustbe measured in a flat state.
Kalman filter[16,25–27]
• It exhibits strongcharacteristics that resolvethe noise problem.
• It has great errorcorrection capability.
• It is difficult to apply because theparameters and algorithmsare complex.
• There has not been much researchon its use in the SOC estimation forbattery packs.
Conventional Neural Networkbased method [18–21]
• It is useful for learning thenonlinear characteristics ofa battery.
• It can learn complexinput/output relationships.
• It only estimates SOC for eachbattery cell.
• There has not been much researchon its use in the SOC estimation forbattery packs.
Proposed method
• It is possible not only toestimate the SOC of theexisting battery cell but alsothat of the battery pack.
• It is possible to estimate SOCin real time.
• In the case of the LSTM,the learning time is relativelyincreased compared with MNN.
Appl. Sci. 2020, 10, 8644 4 of 15
3. Proposed Method SOC Estimation
3.1. Lithium Battery SOC Estimation Algorithm
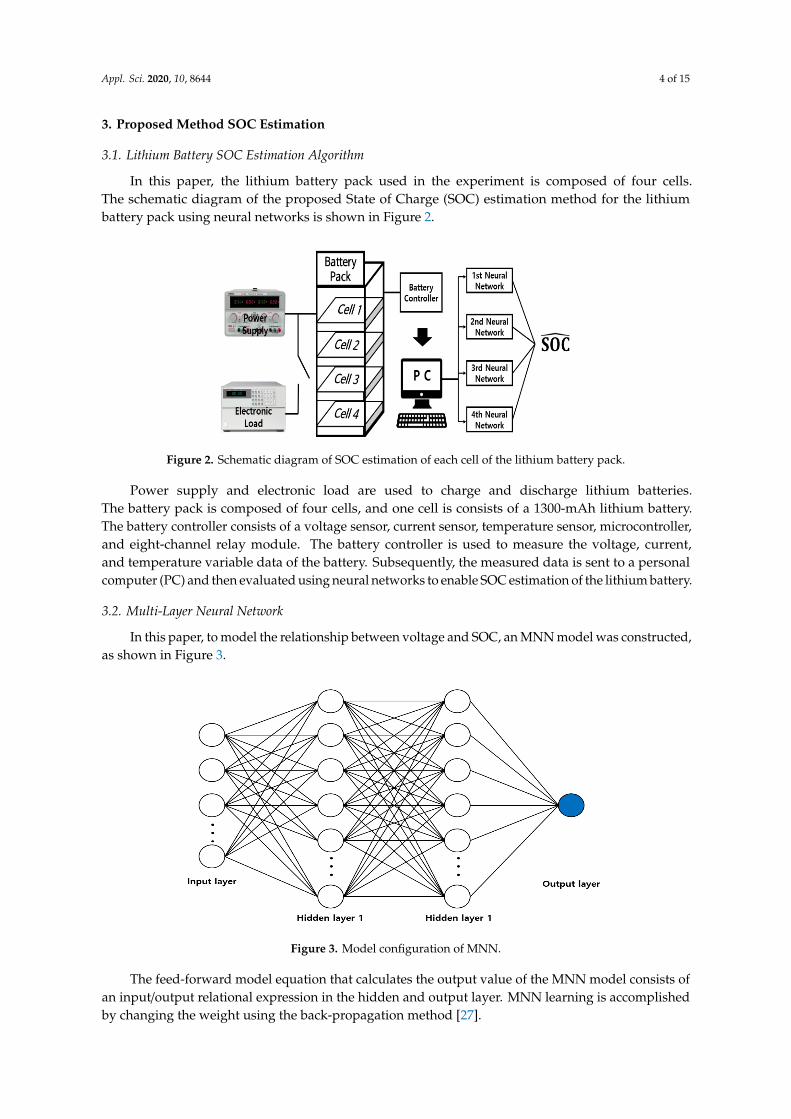
In this paper, the lithium battery pack used in the experiment is composed of four cells.The schematic diagram of the proposed State of Charge (SOC) estimation method for the lithiumbattery pack using neural networks is shown in Figure 2.
Appl. Sci. 2020, 10, x FOR PEER REVIEW 4 of 16
Appl. Sci. 2020, 10, x; doi: FOR PEER REVIEW www.mdpi.com/journal/applsci
battery cell but also that of the
battery pack.
It is possible to estimate SOC in
real time.
increased compared with
MNN.
3. Proposed Method SOC Estimation
3.1. Lithium Battery SOC Estimation Algorithm
In this paper, the lithium battery pack used in the experiment is composed of four cells. The
schematic diagram of the proposed State of Charge (SOC) estimation method for the lithium battery
pack using neural networks is shown in Figure 2.
Figure 2. Schematic diagram of SOC estimation of each cell of the lithium battery pack.
Power supply and electronic load are used to charge and discharge lithium batteries. The battery
pack is composed of four cells, and one cell is consists of a 1300-mAh lithium battery. The battery
controller consists of a voltage sensor, current sensor, temperature sensor, microcontroller, and eight-
channel relay module. The battery controller is used to measure the voltage, current, and temperature
variable data of the battery. Subsequently, the measured data is sent to a personal computer (PC) and
then evaluated using neural networks to enable SOC estimation of the lithium battery.
3.2. Multi-Layer Neural Network
In this paper, to model the relationship between voltage and SOC, an MNN model was
constructed, as shown in Figure 3.
Figure 3. Model configuration of MNN.
Figure 2. Schematic diagram of SOC estimation of each cell of the lithium battery pack.
Power supply and electronic load are used to charge and discharge lithium batteries.The battery pack is composed of four cells, and one cell is consists of a 1300-mAh lithium battery.The battery controller consists of a voltage sensor, current sensor, temperature sensor, microcontroller,and eight-channel relay module. The battery controller is used to measure the voltage, current,and temperature variable data of the battery. Subsequently, the measured data is sent to a personalcomputer (PC) and then evaluated using neural networks to enable SOC estimation of the lithium battery.
3.2. Multi-Layer Neural Network
In this paper, to model the relationship between voltage and SOC, an MNN model was constructed,as shown in Figure 3.
Appl. Sci. 2020, 10, x FOR PEER REVIEW 4 of 16
Appl. Sci. 2020, 10, x; doi: FOR PEER REVIEW www.mdpi.com/journal/applsci
battery cell but also that of the
battery pack.
It is possible to estimate SOC in
real time.
increased compared with
MNN.
3. Proposed Method SOC Estimation
3.1. Lithium Battery SOC Estimation Algorithm
In this paper, the lithium battery pack used in the experiment is composed of four cells. The
schematic diagram of the proposed State of Charge (SOC) estimation method for the lithium battery
pack using neural networks is shown in Figure 2.
Figure 2. Schematic diagram of SOC estimation of each cell of the lithium battery pack.
Power supply and electronic load are used to charge and discharge lithium batteries. The battery
pack is composed of four cells, and one cell is consists of a 1300-mAh lithium battery. The battery
controller consists of a voltage sensor, current sensor, temperature sensor, microcontroller, and eight-
channel relay module. The battery controller is used to measure the voltage, current, and temperature
variable data of the battery. Subsequently, the measured data is sent to a personal computer (PC) and
then evaluated using neural networks to enable SOC estimation of the lithium battery.
3.2. Multi-Layer Neural Network
In this paper, to model the relationship between voltage and SOC, an MNN model was
constructed, as shown in Figure 3.
Figure 3. Model configuration of MNN. Figure 3. Model configuration of MNN.
The feed-forward model equation that calculates the output value of the MNN model consists ofan input/output relational expression in the hidden and output layer. MNN learning is accomplishedby changing the weight using the back-propagation method [27].

Appl. Sci. 2020, 10, 8644 5 of 15
In Figure 3, the MNN model uses two types of datasets as input values of the input layer. One ofthe datasets has only voltage data and 2, 6, and 8 input parameters. The other dataset has voltage andtemperature data. This dataset consists of 3 and 7 inputs. There are two hidden layers. In the firsthidden layer, the number of nodes is 128, and the rectified linear unit (ReLU) function is employed asthe activation function; in the second hidden layer, the number of nodes is 64, and the ReLU function issimilarly employed as the activation function. Moreover, there is one output layer. Adaptive MomentEstimation (Adam) was used as the learning method.
Since the ReLU function does not use exponential calculations in the calculation process,simple calculations can be employed instead. In addition, it changes the negative values to 0 due to itsunsaturated form and linearity. Therefore, using this function makes fast convergence possible [28].The equation of the ReLU function is as follows:
f (x) ={
x, f or x > 00, otherwise
(1)
Adam combines Momentum and RMSProp, a kind of learning method. It is a first-order gradient-basedoptimization algorithm with a stochastic objective function. It can also be easily implemented and exhibitsgood computational efficiency [29]. The calculation method stores the average of the slopes calculated sofar and the average of the squared values of the slopes. Adam’s equation is as follows:
mt = β1mt + (1− β1)∇θ J(θ) (2)
vt = β2vt−1 + (1− β2)(∇θ J(θ))2 (3)
In the above equation, since mm and v are initialized to 0, a bias close to 0 is expected at the startof learning, and this goes through the process of making them unbiased. The equation is as follows:
mt =mt
1− βt1
(4)
vt =vt
1− βt2
(5)
θ = θ−η
√vt + ε
mt (6)
In Equations (2) and (3), m is the first moment vector initialization; v is the second moment vectorinitialization; t is the time step initialization; and θ is the initial parameter vector. The value of β1 is 0.9;β2 is 0.999; and ε is 10−8 [30].
3.3. Long Short-Term Memory
Unlike the general MNN model, LSTM is a method that can take time and order into account asthe result of the hidden layer is, once again, used as an input value of the hidden layer. In addition,the LSTM devised by adding cell state to solve the gradient vanishing problem of long-term dependencyof the MNN model [31]. It is often used for predicting time series data, and if the data used in thispaper is used, more accurate results can be obtained than with the MNN model.
In this paper, we used Long Short-Term Memory (LSTM). The input layers are 2, 6, 8 and 3 and7 are used by adding temperature variable data. There were three hidden layers, and all the LSTMlayers were used. In the first layer, there were 150 nodes; in the second layer, 100 nodes; and in thethird layer, 50 nodes. The ReLU function was employed as the activation function of the three LSTMlayers. In the output layer, there were 101 nodes, and the Softmax function was employed as theactivation function. Adam was used as the learning method.

Appl. Sci. 2020, 10, 8644 6 of 15
LSTM is one of the useful types of the RNN that can calculate the slope value of the basic RNN.Figure 4. presents the basic structure of LSTM. LSTM is a suitable method for SOC estimation as itconsiders the decrease in battery capacity as a time series [18]. The equation of LSTM is as follows.
Appl. Sci. 2020, 10, x FOR PEER REVIEW 6 of 16
Appl. Sci. 2020, 10, x; doi: FOR PEER REVIEW www.mdpi.com/journal/applsci
LSTM is one of the useful types of the RNN that can calculate the slope value of the basic RNN.
Figure 4. presents the basic structure of LSTM. LSTM is a suitable method for SOC estimation as it
considers the decrease in battery capacity as a time series [18]. The equation of LSTM is as follows.
Figure 4. Structure of LSTM.
Step 1. Forget gate:
𝑓𝑛 = 𝜎(𝑊𝑓 ⋅ [ℎ𝑛−1, 𝑋𝑛] + 𝑏𝑓) (7)
Step 2. Input gate:
𝑖𝑛 = 𝜎(𝑊𝑖 ⋅ [ℎ𝑛−1, 𝑋𝑛] + 𝑏𝑖) (8)
𝑆�� = 𝑡𝑎𝑛ℎ(𝑊𝑐 ⋅ [ℎ𝑛−1, 𝑋𝑛] + 𝑏𝑐 (9)
Step 3. Update(Cell state):
𝑆𝑛 = 𝑓𝑛 ∘ 𝑆𝑛−1 + 𝑖𝑛 ∘ 𝑆�� (10)
Step 4. Output gate(Hidden state):
𝑂𝑛 = 𝜎(𝑊𝑜[ℎ𝑛−1, 𝑋𝑛]) + 𝑏𝑜 (11)
ℎ𝑛 = 𝑂𝑛𝑡𝑎𝑛ℎ(𝑆𝑛) (12)
where, 𝑊 is the weight; ℎ is the hidden state; 𝑋 is the input; 𝑏 is the bias of each gate and state; 𝑓
is the forget gate; 𝑖, the input gate; 𝑆, the cell state; and 𝑂, the output gate.
Softmax is a activation function that normalizes the output value in the last step for class
classification with respect to the output value. The sum of the resulting values of the Softmax function
is always 1 [32]. The equation of Softmax is as follows,
f(𝑥𝑖) =𝑒𝑥𝑖
∑ 𝑒𝑥𝑗𝑁𝑗=1
(13)
where 𝑥𝑖 is the 𝑖-th output, and 𝑁 is the number of dimensions equal to the number of classes [33].
4. Online SOC Estimation by LSTM
Real-time SOC estimates were based on a real-time estimate of the SOC of the lithium battery
pack by combining the 6 voltage data with the lowest error rate results in Section 5.
Figure 5 presents the experimental configuration of the real-time estimation of the lithium
battery pack. Real-time SOC estimation of the lithium battery was performed in a state wherein all
four cells are fully charged, that is, at 100% SOC. An eight-channel relay module was added to the
battery controller to achieve sequential SOC estimation of the four cells. Currently, studies on the
Figure 4. Structure of LSTM.
Step 1. Forget gate:fn = σ
(W f · [hn−1, Xn] + b f
)(7)
Step 2. Input gate:in = σ(Wi · [hn−1, Xn] + bi) (8)
Sn = tanh(Wc · [hn−1, Xn] + bc (9)
Step 3. Update(Cell state):Sn = fn ◦ Sn−1 + in ◦ Sn (10)
Step 4. Output gate(Hidden state):
On = σ(Wo[hn−1, Xn]) + bo (11)
hn = Ontanh(Sn) (12)
where, W is the weight; h is the hidden state; X is the input; b is the bias of each gate and state; f is theforget gate; i, the input gate; S, the cell state; and O, the output gate.
Softmax is a activation function that normalizes the output value in the last step for classclassification with respect to the output value. The sum of the resulting values of the Softmax functionis always 1 [32]. The equation of Softmax is as follows,
f(xi) =exi∑N
j=1 ex j(13)
where xi is the i-th output, and N is the number of dimensions equal to the number of classes [33].
4. Online SOC Estimation by LSTM
Real-time SOC estimates were based on a real-time estimate of the SOC of the lithium batterypack by combining the 6 voltage data with the lowest error rate results in Section 5.

Appl. Sci. 2020, 10, 8644 7 of 15
Figure 5 presents the experimental configuration of the real-time estimation of the lithium batterypack. Real-time SOC estimation of the lithium battery was performed in a state wherein all four cells arefully charged, that is, at 100% SOC. An eight-channel relay module was added to the battery controllerto achieve sequential SOC estimation of the four cells. Currently, studies on the real-time estimation ofSOC are scarce. Therefore, the real-time SOC estimation method, which has been researched and testedin this paper, is considered as a new direction of SOC estimation, and the research and experimentswere conducted.
Appl. Sci. 2020, 10, x FOR PEER REVIEW 7 of 16
Appl. Sci. 2020, 10, x; doi: FOR PEER REVIEW www.mdpi.com/journal/applsci
real-time estimation of SOC are scarce. Therefore, the real-time SOC estimation method, which has
been researched and tested in this paper, is considered as a new direction of SOC estimation, and the
research and experiments were conducted.
Figure 5. Experimental environment for real-time SOC estimation.
The experiment process was as follows. The four cells were completely charged at a constant
voltage of 4.2 V and constant current of 1300 mA using an electronic load. Subsequently, the voltage
and temperature variable data were sent to the PC through the battery controller. The SOC of the
lithium battery was estimated in real time using the LSTM method utilizing only 6 voltage as the
input value and the temperature variable data. The real-time estimation is as shown in Figure 6.
The real-time SOC estimation result of Cell 1 to Cell 4 is shown in Figure 6. The experimental
result confirmed that the trend of SOC estimation of the battery pack was similar to that of the SOC
estimation simulation experiment.
Figure 6. Real-time SOC estimation.
Figure 5. Experimental environment for real-time SOC estimation.
The experiment process was as follows. The four cells were completely charged at a constantvoltage of 4.2 V and constant current of 1300 mA using an electronic load. Subsequently, the voltageand temperature variable data were sent to the PC through the battery controller. The SOC of thelithium battery was estimated in real time using the LSTM method utilizing only 6 voltage as the inputvalue and the temperature variable data. The real-time estimation is as shown in Figure 6.
Appl. Sci. 2020, 10, x FOR PEER REVIEW 7 of 16
Appl. Sci. 2020, 10, x; doi: FOR PEER REVIEW www.mdpi.com/journal/applsci
real-time estimation of SOC are scarce. Therefore, the real-time SOC estimation method, which has
been researched and tested in this paper, is considered as a new direction of SOC estimation, and the
research and experiments were conducted.
Figure 5. Experimental environment for real-time SOC estimation.
The experiment process was as follows. The four cells were completely charged at a constant
voltage of 4.2 V and constant current of 1300 mA using an electronic load. Subsequently, the voltage
and temperature variable data were sent to the PC through the battery controller. The SOC of the
lithium battery was estimated in real time using the LSTM method utilizing only 6 voltage as the
input value and the temperature variable data. The real-time estimation is as shown in Figure 6.
The real-time SOC estimation result of Cell 1 to Cell 4 is shown in Figure 6. The experimental
result confirmed that the trend of SOC estimation of the battery pack was similar to that of the SOC
estimation simulation experiment.
Figure 6. Real-time SOC estimation. Figure 6. Real-time SOC estimation.
The real-time SOC estimation result of Cell 1 to Cell 4 is shown in Figure 6. The experimentalresult confirmed that the trend of SOC estimation of the battery pack was similar to that of the SOCestimation simulation experiment.

Appl. Sci. 2020, 10, 8644 8 of 15
5. Result and Discussion
5.1. Experiment Process
In this paper, the lithium battery pack used is composed of four cells. First, the battery packconsisting of four lithium batteries was fully charged at a constant voltage of 4.2 V using a powersupply. This state is defined as 100% SOC. It has a stabilization period of 1 h after charge completion.Subsequently, the state of 0% SOC, which indicates discharge completion at a constant current of1300 mA using an electronic load, was defined as one cycle. The voltage and temperature variable datawere obtained using a battery controller. The previous charging, stabilization period, and dischargewere repeated to collect data for a total of five cycles. Then, using the collected data, each cell’sSOC was estimated using 4 MNN and LSTM. Python, TensorFlow, and Keras package were used forprogram writing and learning.
The experimental environment for the simulation of SOC estimation of the lithium battery packis as shown in Figure 7. Figure 7.- 1O and Figure 7.- 2O show the power supply and electronic Load,respectively, which are used to charge and discharge the battery. Figure 7.- 3O shows four lithiumbatteries. The experiment was conducted in the state of putting them in the safety chamber inpreparation for explosion and safety accidents. The temperature control function can be used toreceive high temperature variable data. Figure 7.- 4O shows the battery controller, which consists of avoltage sensor, current sensor, temperature sensor, and microcontroller. Real-time SOC estimationwas performed by adding an eight-channel relay module to the battery controller to achieve real-timedata measurement. Subsequently, the measured data was utilized, which was sent to the PC shownin Figure 7.- 5O. Moreover, the SOC of each cell was estimated using the MNN and LSTM. The SOCestimation procedure for each cell of the lithium battery pack was as follows:
(a) Each lithium battery pack consisting of 4 cells was fully charged with a constant voltage of 4.2 V.This state is defined as 100% SOC.
(b) After charging was complete, the pack was left to rest for 1 h.(c) Then, the lithium battery pack was completely discharged with a constant current of 1300 mA.
This state is defined as 0% SOC.(d) During discharge, the voltage and current were measured through the battery controller.(e) Steps (a) to (d) were repeated 5 times with data collected during each repetition. (*In case of high
temperature measurements, the charging, resting, and discharging steps were performed at hightemperature.)
(f) The measured data was sent to a PC.(g) The data was learned using the MNN model and LSTM method.(h) The actual SOC estimation result and the learned SOC estimation result were compared.(i) The mean absolute error was used to calculate the error rate.
Appl. Sci. 2020, 10, x FOR PEER REVIEW 8 of 16
Appl. Sci. 2020, 10, x; doi: FOR PEER REVIEW www.mdpi.com/journal/applsci
5. Result and Discussion
5.1. Experiment Process
In this paper, the lithium battery pack used is composed of four cells. First, the battery pack
consisting of four lithium batteries was fully charged at a constant voltage of 4.2 V using a power
supply. This state is defined as 100% SOC. It has a stabilization period of 1 h after charge completion.
Subsequently, the state of 0% SOC, which indicates discharge completion at a constant current of
1300 mA using an electronic load, was defined as one cycle. The voltage and temperature variable
data were obtained using a battery controller. The previous charging, stabilization period, and
discharge were repeated to collect data for a total of five cycles. Then, using the collected data, each
cell’s SOC was estimated using 4 MNN and LSTM. Python, TensorFlow, and Keras package were
used for program writing and learning.
The experimental environment for the simulation of SOC estimation of the lithium battery pack
is as shown in Figure 7. Figure 7.-① and Figure 7.-② show the power supply and electronic Load,
respectively, which are used to charge and discharge the battery. Figure 7.-③ shows four lithium
batteries. The experiment was conducted in the state of putting them in the safety chamber in
preparation for explosion and safety accidents. The temperature control function can be used to
receive high temperature variable data. Figure 7.-④ shows the battery controller, which consists of a
voltage sensor, current sensor, temperature sensor, and microcontroller. Real-time SOC estimation
was performed by adding an eight-channel relay module to the battery controller to achieve real-time
data measurement. Subsequently, the measured data was utilized, which was sent to the PC shown
in Figure 7.-⑤. Moreover, the SOC of each cell was estimated using the MNN and LSTM. The SOC
estimation procedure for each cell of the lithium battery pack was as follows:
(a) Each lithium battery pack consisting of 4 cells was fully charged with a constant voltage of 4.2
V. This state is defined as 100% SOC.
(b) After charging was complete, the pack was left to rest for 1 h.
(c) Then, the lithium battery pack was completely discharged with a constant current of 1300 mA.
This state is defined as 0% SOC.
(d) During discharge, the voltage and current were measured through the battery controller.
(e) Steps a) to d) were repeated 5 times with data collected during each repetition.
(*In case of high temperature measurements, the charging, resting, and discharging steps were
performed at high temperature.)
(f) The measured data was sent to a PC.
(g) The data was learned using the MNN model and LSTM method.
(h) The actual SOC estimation result and the learned SOC estimation result were compared.
(i) The mean absolute error was used to calculate the error rate.
Figure 7. Experimental environment for the SOC estimation simulation. Figure 7. Experimental environment for the SOC estimation simulation.

Appl. Sci. 2020, 10, 8644 9 of 15
5.2. SOC Estimation of MNN and LSTM
5.2.1. SOC Estimation Performance Comparison According to the Number of Inputs
In this paper, the SOC error rates of the lithium battery packs were compared according to thedifference in the number of inputs using 2, 6, and 8 voltages as the input values. Only pure voltagedata were utilized for the comparison. After charging and discharging at both room temperature andhigh temperature, the collected data was evaluated using the MNN and LSTM to estimate the SOCof each cell. Tables 2 and 3 compare the error rates of Cell 1 to Cell 4, using the MNN and LSTM for2, 6, and 8 voltages, at room temperature, and high temperature, respectively. Each error rate wascalculated using the Mean Absolute Error (MAE). The equation for obtaining the MAE is as follows,
MAE =1n
n∑i=1
∣∣∣yi − y∣∣∣ (14)
where, n is the number; y is the actual SOC value; and y is the estimated SOC value.
Table 2. Results of SOC estimation using the MNN according to the difference in the number of inputs.
Number of Inputs Cell 1 Cell 2 Cell 3 Cell 4
2 (Room temperature) 7.2% 7.5% 4.4% 2.2%2 (Hight temperature) 1.4% 2.9% 1.4% 1.5%6 (Room temperature) 4.8% 6.9% 3.8% 2.2%6 (Hight temperature) 3.1% 3.4% 3.1% 1.3%8 (Room temperature) 5.0% 7.2% 4.2% 2.8%8 (Hight temperature) 2.8% 3.1% 3.4% 1.1%
Table 3. Results of SOC estimation using the LSTM according to the difference in the number of inputs.
Number of Inputs Cell 1 Cell 2 Cell 3 Cell 4
2 (Room temperature) 3.4% 9.2% 7.3% 4.8%2 (Hight temperature) 4.9% 1.6% 1.3% 2.0%6 (Room temperature) 2.9% 6.1% 3.9% 3.1%6 (Hight temperature) 2.7% 2.6% 3.5% 1.8%8 (Room temperature) 1.2% 1.8% 4.9% 4.2%8 (Hight temperature) 1.9% 1.4% 4.2% 1.9%
As a result of the experiment, it was confirmed that with the MNN model, the error rate waslower when using 6 voltage data as input values than when using 2 or 8 voltage data. With the LSTMmodel, when 6 and 8 voltage data were used as input values, the error rate was lower than when using2 voltage data as input values. When using 6 and 8 inputs, there was a slight difference in error rate.However, it can be inferred that it is more efficient to use 6 voltage data as input values, because themore data there is, the more computation time required and learning efficiency decreases.
5.2.2. Comparison of Use/Unused of Temperature Variable Data
In this paper, an experiment was conducted to estimate the SOC of each cell for the lithium batterypacks in the room temperature range of 25–26 ◦C and high temperature range of 39–42 ◦C. The inputvalue using only the voltage data of room temperature and high temperature without the temperaturevariable data and the input value of room temperature, and high temperature at which the temperaturevariable data was added were compared. Figure 8 shows a graph of the SOC estimation result whenusing the MNN of Cell 4 utilizing only 6 voltage as the input value at room temperature and hightemperature. Figure 9 also shows a graph of the SOC estimation result when using the LSTM of Cell4 utilizing only 6 voltage as the input value at both room temperature and high temperature.

Appl. Sci. 2020, 10, 8644 10 of 15
Appl. Sci. 2020, 10, x FOR PEER REVIEW 10 of 16
Appl. Sci. 2020, 10, x; doi: FOR PEER REVIEW www.mdpi.com/journal/applsci
using the LSTM of Cell 4 utilizing only 6 voltage as the input value at both room temperature and
high temperature.
(a) (b)
Figure 8. SOC estimation results (a) Using the MNN utilizing only 6 voltage as the input value at
room temperature (b) Using the MNN utilizing only 6 voltage as the input value at high temperature.
(a) (b)
Figure 9. SOC estimation results (a) Using the LSTM utilizing only 6 voltage as the input value at
room temperature (b) Using the LSTM utilizing only 6 voltage as the input value at high temperature.
The “origin” label in Figures 8, 9, 10, and 11 shows the real percentage SOC values and these can
be calculated as follows,
SOC =𝐶𝑟𝑒𝑙𝑒𝑎𝑠𝑎𝑏𝑙𝑒
𝐶𝑟𝑎𝑡𝑒𝑑× 100 (15)
where, 𝐶𝑟𝑒𝑙𝑒𝑎𝑠𝑎𝑏𝑙𝑒 is the initial capacity of the battery, and 𝐶𝑟𝑎𝑡𝑒𝑑 is the capacity of the battery
currently available. In this paper, the above equation is used to calculate the time for SOC estimation
and the SOC origin of the lithium battery pack.
Figure 10 shows a graph of the SOC estimation results when using the MNN of Cell 4 utilizing
only 6 voltage as the input value and the temperature variable data at room temperature and high
temperature. Figure 11 shows a graph of the SOC estimation results when using the LSTM of Cell 4
utilizing only 6 voltage as the input value and the temperature variable data at room temperature
and high temperature.
Figure 8. SOC estimation results (a) Using the MNN utilizing only 6 voltage as the input value at roomtemperature (b) Using the MNN utilizing only 6 voltage as the input value at high temperature.
Appl. Sci. 2020, 10, x FOR PEER REVIEW 10 of 16
Appl. Sci. 2020, 10, x; doi: FOR PEER REVIEW www.mdpi.com/journal/applsci
using the LSTM of Cell 4 utilizing only 6 voltage as the input value at both room temperature and
high temperature.
(a) (b)
Figure 8. SOC estimation results (a) Using the MNN utilizing only 6 voltage as the input value at
room temperature (b) Using the MNN utilizing only 6 voltage as the input value at high temperature.
(a) (b)
Figure 9. SOC estimation results (a) Using the LSTM utilizing only 6 voltage as the input value at
room temperature (b) Using the LSTM utilizing only 6 voltage as the input value at high temperature.
The “origin” label in Figures 8, 9, 10, and 11 shows the real percentage SOC values and these can
be calculated as follows,
SOC =𝐶𝑟𝑒𝑙𝑒𝑎𝑠𝑎𝑏𝑙𝑒
𝐶𝑟𝑎𝑡𝑒𝑑× 100 (15)
where, 𝐶𝑟𝑒𝑙𝑒𝑎𝑠𝑎𝑏𝑙𝑒 is the initial capacity of the battery, and 𝐶𝑟𝑎𝑡𝑒𝑑 is the capacity of the battery
currently available. In this paper, the above equation is used to calculate the time for SOC estimation
and the SOC origin of the lithium battery pack.
Figure 10 shows a graph of the SOC estimation results when using the MNN of Cell 4 utilizing
only 6 voltage as the input value and the temperature variable data at room temperature and high
temperature. Figure 11 shows a graph of the SOC estimation results when using the LSTM of Cell 4
utilizing only 6 voltage as the input value and the temperature variable data at room temperature
and high temperature.
Figure 9. SOC estimation results (a) Using the LSTM utilizing only 6 voltage as the input value at roomtemperature (b) Using the LSTM utilizing only 6 voltage as the input value at high temperature.
The “origin” label in Figures 8–11 shows the real percentage SOC values and these can becalculated as follows,
SOC =Creleasable
Crated× 100 (15)
where, Creleasable is the initial capacity of the battery, and Crated is the capacity of the battery currentlyavailable. In this paper, the above equation is used to calculate the time for SOC estimation and theSOC origin of the lithium battery pack.
Appl. Sci. 2020, 10, 8644 11 of 15
Appl. Sci. 2020, 10, x FOR PEER REVIEW 11 of 16
Appl. Sci. 2020, 10, x; doi: FOR PEER REVIEW www.mdpi.com/journal/applsci
(a) (b)
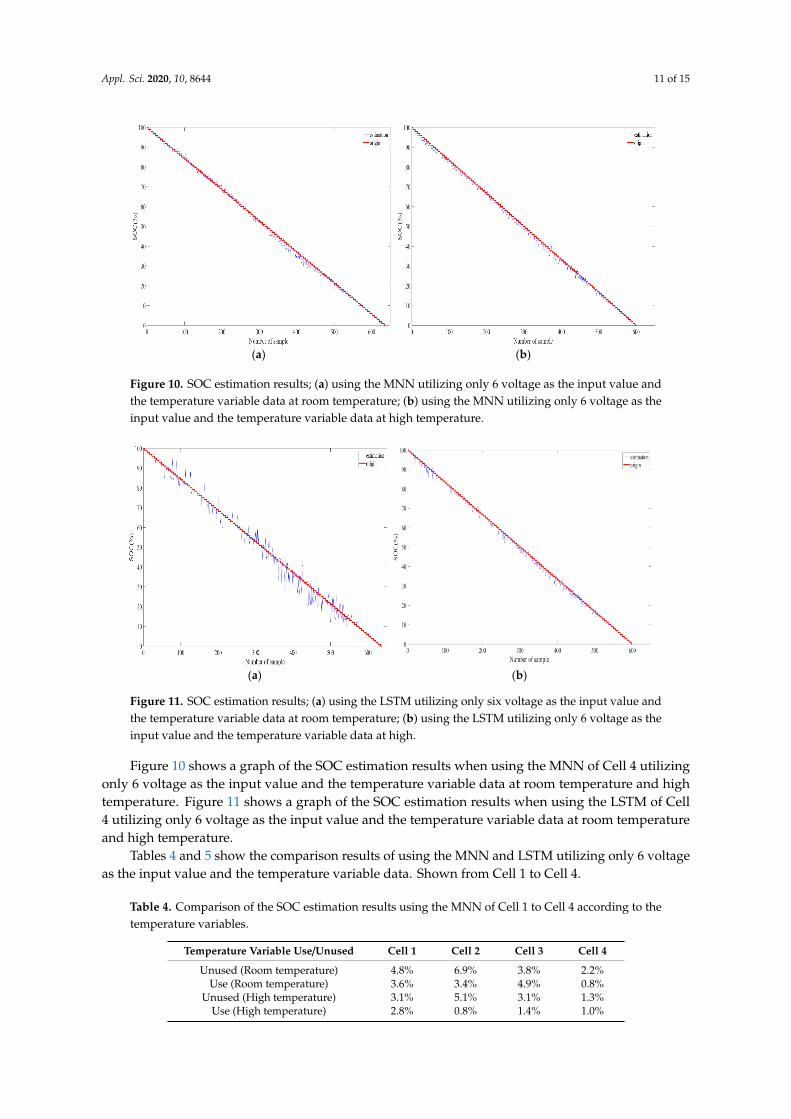
Figure 10. SOC estimation results; (a) using the MNN utilizing only 6 voltage as the input value and
the temperature variable data at room temperature; (b) using the MNN utilizing only 6 voltage as the
input value and the temperature variable data at high temperature.
(a) (b)
Figure 11. SOC estimation results; (a) using the LSTM utilizing only six voltage as the input value and
the temperature variable data at room temperature; (b) using the LSTM utilizing only 6 voltage as the
input value and the temperature variable data at high.
Tables 4 and 5 show the comparison results of using the MNN and LSTM utilizing only 6 voltage
as the input value and the temperature variable data. Shown from Cell 1 to Cell 4.
Table 4. Comparison of the SOC estimation results using the MNN of Cell 1 to Cell 4 according to the
temperature variables.
Temperature Variable Use/Unused Cell 1 Cell 2 Cell 3 Cell 4
Unused(Room temperature) 4.8% 6.9% 3.8% 2.2%
Use(Room temperature) 3.6% 3.4% 4.9% 0.8%
Unused(High temperature) 3.1% 5.1% 3.1% 1.3%
Use(High temperature) 2.8% 0.8% 1.4% 1.0%
Figure 10. SOC estimation results; (a) using the MNN utilizing only 6 voltage as the input value andthe temperature variable data at room temperature; (b) using the MNN utilizing only 6 voltage as theinput value and the temperature variable data at high temperature.
Appl. Sci. 2020, 10, x FOR PEER REVIEW 11 of 16
Appl. Sci. 2020, 10, x; doi: FOR PEER REVIEW www.mdpi.com/journal/applsci
(a) (b)
Figure 10. SOC estimation results; (a) using the MNN utilizing only 6 voltage as the input value and
the temperature variable data at room temperature; (b) using the MNN utilizing only 6 voltage as the
input value and the temperature variable data at high temperature.
(a) (b)
Figure 11. SOC estimation results; (a) using the LSTM utilizing only six voltage as the input value and
the temperature variable data at room temperature; (b) using the LSTM utilizing only 6 voltage as the
input value and the temperature variable data at high.
Tables 4 and 5 show the comparison results of using the MNN and LSTM utilizing only 6 voltage
as the input value and the temperature variable data. Shown from Cell 1 to Cell 4.
Table 4. Comparison of the SOC estimation results using the MNN of Cell 1 to Cell 4 according to the
temperature variables.
Temperature Variable Use/Unused Cell 1 Cell 2 Cell 3 Cell 4
Unused(Room temperature) 4.8% 6.9% 3.8% 2.2%
Use(Room temperature) 3.6% 3.4% 4.9% 0.8%
Unused(High temperature) 3.1% 5.1% 3.1% 1.3%
Use(High temperature) 2.8% 0.8% 1.4% 1.0%
Figure 11. SOC estimation results; (a) using the LSTM utilizing only six voltage as the input value andthe temperature variable data at room temperature; (b) using the LSTM utilizing only 6 voltage as theinput value and the temperature variable data at high.
Figure 10 shows a graph of the SOC estimation results when using the MNN of Cell 4 utilizingonly 6 voltage as the input value and the temperature variable data at room temperature and hightemperature. Figure 11 shows a graph of the SOC estimation results when using the LSTM of Cell4 utilizing only 6 voltage as the input value and the temperature variable data at room temperatureand high temperature.
Tables 4 and 5 show the comparison results of using the MNN and LSTM utilizing only 6 voltageas the input value and the temperature variable data. Shown from Cell 1 to Cell 4.
Table 4. Comparison of the SOC estimation results using the MNN of Cell 1 to Cell 4 according to thetemperature variables.
Temperature Variable Use/Unused Cell 1 Cell 2 Cell 3 Cell 4
Unused (Room temperature) 4.8% 6.9% 3.8% 2.2%Use (Room temperature) 3.6% 3.4% 4.9% 0.8%
Unused (High temperature) 3.1% 5.1% 3.1% 1.3%Use (High temperature) 2.8% 0.8% 1.4% 1.0%

Appl. Sci. 2020, 10, 8644 12 of 15
Table 5. Comparison of the SOC estimation results using the LSTM of Cell 1 to Cell 4 according to thetemperature variable.
Temperature Variable Use/Unused Cell 1 Cell 2 Cell 3 Cell 4
Unused (Room temperature) 2.9% 6.1% 3.9% 3.1%Use (Room temperature) 2.7% 3.3% 3.9% 1.8%
Unused (High temperature) 1.9% 2.6% 3.5% 1.3%Use (High temperature) 1.3% 0.7% 1.5% 0.6%
As a result of the experiment, compared to using 6 voltage data as input values, if 6 voltagedata and 1 temperature variable data are used as input values, with the MNN model, the error ratedecreases. With the LSTM method, when voltage and temperature variable data are used together aswith the MNN model, the error rate tends to decrease also.
5.2.3. Comparison of SOC Estimation Performance of Multi-Layer Neural Network and LongShort-Term Memory
In this paper, the MNN and LSTM were used to estimate the SOC of lithium batteries. Figure 12shows a graph of the results using the MNN and LSTM of Cell 4 utilizing 6 voltage as the input valueand the temperature variable data at high temperature.
Appl. Sci. 2020, 10, x FOR PEER REVIEW 12 of 16
Appl. Sci. 2020, 10, x; doi: FOR PEER REVIEW www.mdpi.com/journal/applsci
Table 5. Comparison of the SOC estimation results using the LSTM of Cell 1 to Cell 4 according to the
temperature variable.
Temperature Variable Use/Unused Cell 1 Cell 2 Cell 3 Cell 4
Unused(Room temperature) 2.9% 6.1% 3.9% 3.1%
Use(Room temperature) 2.7% 3.3% 3.9% 1.8%
Unused(High temperature) 1.9% 2.6% 3.5% 1.3%
Use(High temperature) 1.3% 0.7% 1.5% 0.6%
As a result of the experiment, compared to using 6 voltage data as input values, if 6 voltage data
and 1 temperature variable data are used as input values, with the MNN model, the error rate
decreases. With the LSTM method, when voltage and temperature variable data are used together as
with the MNN model, the error rate tends to decrease also.
5.2.3. Comparison of SOC Estimation Performance of Multi-Layer Neural Network and Long Short-
Term Memory
In this paper, the MNN and LSTM were used to estimate the SOC of lithium batteries. Figure 12
shows a graph of the results using the MNN and LSTM of Cell 4 utilizing 6 voltage as the input value
and the temperature variable data at high temperature.
(a) (b)
Figure 12. SOC estimation results with temperature data at high temperature (a) Using MNN (b)
Using LSTM.
Table 6 compares the results of using the MNN and LSTM utilizing only 6 voltage as the input
value and the temperature variable data at both room temperature and high temperature. Cell 1 to
Cell 4 are also shown in the Table 6.
Table 6. SOC estimation results of using the MNN and LSTM at room temperature and high
temperature.
MNN/LSTM Cell 1 Cell 2 Cell 3 Cell 4
MNN(Room temperature) 3.6% 3.4% 4.9% 1.8%
LSTM(Room temperature) 2.7% 3.3% 3.9% 0.8%
MNN(High temperature) 2.8% 0.8% 1.4% 1.8%
LSTM(High temperature) 1.3% 0.7% 1.5% 0.6%
Figure 12. SOC estimation results with temperature data at high temperature (a) Using MNN (b)Using LSTM.
Table 6 compares the results of using the MNN and LSTM utilizing only 6 voltage as the inputvalue and the temperature variable data at both room temperature and high temperature. Cell 1 toCell 4 are also shown in the Table 6.
Table 6. SOC estimation results of using the MNN and LSTM at room temperature and high temperature.
MNN/LSTM Cell 1 Cell 2 Cell 3 Cell 4
MNN (Room temperature) 3.6% 3.4% 4.9% 1.8%LSTM (Room temperature) 2.7% 3.3% 3.9% 0.8%MNN (High temperature) 2.8% 0.8% 1.4% 1.8%LSTM (High temperature) 1.3% 0.7% 1.5% 0.6%
As a result of the experiment, it was confirmed that the SOC of a lithium battery using the LSTMmethod took a little longer to learn, but showed higher accuracy than when the SOC was estimatedusing the MNN model, and a low error rate was recorded.
Appl. Sci. 2020, 10, 8644 13 of 15
In addition, the result of the experiment revealed that the error rate tends to be less when 6 V isused as the input value at both room temperature and high temperature. This confirms the tendencyof the error rates to be lower than when using 2 and 8 voltages as the input values. It has also proventhat the error rate is generally lower when using the LSTM than when using the MNN. For real-timeSOC estimation, 6 voltage and temperature variable data were utilized as input layers, and the SOC ofeach cell of the lithium battery pack was estimated in real time using the LSTM.
According to Jiayi Luo et al. [13], the SOC estimation results of lithium battery, using the cubatureKalman filter method, showed a performance of error within 5%. In our proposed method, the averageerror was within 3% at room temperature and within 1% at a high temperature (40 ◦C). From theseresults, the performance of our proposed method was better than that of the above paper [13].
According to Chemali, et al. [21], the SOC of a lithium battery was estimated using the LSTMmodel and obtained the SOC estimation error of 1.68% at room temperature and an average of 1.26%at a high temperature (40 ◦C). It was confirmed that the performance of our proposed method wasworse than Chemali’s paper at room temperature. However, the performance of our proposed methodat high temperatures was better than that proposed in Chemali’s paper.
In addition, the two papers [13,21] were applied to estimate the SOC using only the battery cell.Conversely, the proposed method estimated the SOC of the battery for the battery pack that comprisedfour cells and the observed SOC estimation performance was slightly lowered.
6. Conclusions
In this paper, we proposed an SOC estimation method for each cell of a lithium battery pack usingneural networks. Experiments were conducted at room temperature and high temperature. Due to themeasurement accuracy of the data, there was a difference in the results for each cell. The proposedmethod was used to estimate the SOC of the lithium battery pack in real time. Moreover, the SOC of thelithium battery pack was estimated using the MNN and LSTM methods, using two types of datasets,the voltage dataset only and the voltage and temperature dataset together. After that, the results withthe MNN and LSTM methods were compared and analyzed.
When using two, six, and eight inputs with only voltage data, a low overall error rate was recordedwhen using 6 voltage data as input values for the MNN model, and six and eight voltage data for theLSTM method. With the LSTM method, a similar number of low error rates were recorded for the sixand eight input values. However, the use of eight input values had the disadvantage of increasing thelearning time due to the increase in the amount of data, so we conclude that using six input values ismore efficient. The SOC estimation results of the lithium battery pack were also obtained with inputvalue using only six voltage data, and six voltage data and one temperature variable data. For theMNN model, SOC estimates, using voltage data and temperature variable data, tended to show lowererror rates, and lower error rates for all cells were also seen when using the LSTM method, except forthe estimated SOC error rate of cell three under room temperature conditions. The comparison of SOCestimates with the MNN and LSTM methods showed that the input value was based on the inputparameters of 6 voltage data and temperature variable data combined to estimate the SOC, and thateach cell for the battery pack had a higher error rate when it was estimated using the LSTM method.Therefore, we can confirm that SOC estimation using the LSTM method is better than with the MNNmethod. In conclusion, it is confirmed that the LSTM method using six voltage as the input valueand temperature variable data had the lowest error rate. In addition, the real-time SOC of lithiumbattery packs was estimated using LSTM method, which used six voltage data and temperature data,which had the lowest error rate. By comparing the error rates obtained from similar cases, an averageerror rate of about 1.5% was derived in this paper. Therefore, it can be confirmed that the proposedmethod performs very well.
In future studies, we will collect more battery data, which can be used to conduct the simulationand real-time estimation of the SOC. We plan to reduce the error rate by studying neural networkmethods other than the MNN and LSTM method used in this paper.

Appl. Sci. 2020, 10, 8644 14 of 15
Author Contributions: Methodology, J.P. and I.L.; Investigation, J.P. J.L., S.K. and I.L.; Experiments, J.P.,J.L. and S.K.; Simulations, J.P.; Data analysis, J.P., J.L. and I.L.; Writing-original draft, J.P.; Writing-review & editing,I.S.L. All authors have read and agreed to the published version of the manuscript.
Funding: This study was supported by the BK21 Plus project funded by the Ministry of Education, Korea (21A20131600011)This research was supported by the Basic Science Research Program through the National Research Foundation of Korea(NRF) funded by the Ministry of Education (No. 2020R1I1A3A04036615).
Conflicts of Interest: The authors declare no conflict of interest.
References
1. Zhang, W.; Nie, J.; Li, F.; Wang, Z.L.; Sun, C. A durable and safe solid-state lithium battery with a hybridelectrolyte membrane. Nano Energy 2018, 45, 413–419. [CrossRef]
2. Song, X.; Yang, F.; Wang, D.; Tsui, K.-L. Combined CNN-LSTM Network for State-of-Charge Estimation ofLithium-Ion Batteries. IEEE Access 2019, 7, 88894–88902. [CrossRef]
3. Chen, C.; Xiong, R.; Yang, R.; Shen, W.; Sun, F. State-of-charge estimation of lithium-ion battery using animproved neural network model and extended Kalman filter. J. Clean. Prod. 2019, 234, 1153–1164. [CrossRef]
4. Huang, D.; Chen, Z.; Zheng, C.; Li, H. A model-based state-of-charge estimation method for series-connectedlithium-ion battery pack considering fast-varying cell temperature. Energy 2019, 185, 847–861. [CrossRef]
5. Abbas, G.; Nawaz, M.; Kamran, F. Performance Comparison of NARX & RNNLSTM Neural Networks forLiFePO4 Battery State of Charge Estimation. In Proceedings of the 2019 16th International Bhurban Conferenceon Applied Sciences & Technology (IBCAST), Islamabad, Pakistan, 8–12 January 2019; pp. 463–468. [CrossRef]
6. Chen, J.; Ouyang, Q.; Xu, C.; Su, H. Neural Network-Based State of Charge Observer Design for Lithium-IonBatteries. IEEE Trans. Control. Syst. Technol. 2018, 26, 313–320. [CrossRef]
7. Xia, B.; Cui, D.; Sun, Z.; Lao, Z.; Zhang, R.; Wang, W.; Sun, W.; Lai, Y.; Wang, M. State of charge estimation oflithium-ion batteries using optimized Levenberg-Marquardt wavelet neural network. Energy 2018, 153, 694–705.[CrossRef]
8. Lu, L.; Han, X.; Li, J.; Hua, J.; Ouyang, M. A review on the key issues for lithium-ion battery management inelectric vehicles. J. Power Sources 2013, 226, 272–288. [CrossRef]
9. Meng, J.; Ricco, M.; Luo, G.; Swierczynski, M.; Stroe, D.-I.; Stroe, A.-I.; Teodorescu, R. An Overviewand Comparison of Online Implementable SOC Estimation Methods for Lithium-Ion Battery. IEEE Trans.Ind. Appl. 2018, 54, 1583–1591. [CrossRef]
10. Kim, J.; Shin, J.; Chun, C.; Cho, B.H. Stable Configuration of a Li-Ion Series Battery Pack Based on a ScreeningProcess for Improved Voltage/SOC Balancing. IEEE Trans. Power Electron. 2011, 27, 411–424. [CrossRef]
11. Yang, F.; Song, X.; Dong, G.; Tsui, K.-L. A coulombic efficiency-based model for prognostics and healthestimation of lithium-ion batteries. Energy 2019, 171, 1173–1182. [CrossRef]
12. Lee, P.Y.; Lee, D.Y.; Pack, J.H.; Kim, J.H.; Lim, C.W. Screening method using the cells deviation for Li-ionbattery pack of the high power application. In Proceedings of the Power Electronics Conference, Jeju, Korea,21–24 November 2017; pp. 157–158.
13. Luo, J.; Peng, J.; He, H. Lithium-ion battery SOC estimation study based on Cubature Kalman filter.Energy Procedia 2019, 158, 3421–3426. [CrossRef]
14. Shrivastava, P.; Soon, T.K.; Bin Idris, M.Y.I.; Mekhilef, S. Overview of model-based online state-of-chargeestimation using Kalman filter family for lithium-ion batteries. Renew. Sustain. Energy Rev. 2019, 113, 109233.[CrossRef]
15. Jiménez-Bermejo, D.; Fraile-Ardanuy, J.; Castano-Solis, S.; Merino, J.; Álvaro-Hermana, R. Using Dynamic NeuralNetworks for Battery State of Charge Estimation in Electric Vehicles. Procedia Comput. Sci. 2018, 130, 533–540.[CrossRef]
16. Jang, K.-W.; Chung, G.-B. A SOC Estimation using Kalman Filter for Lithium-Polymer Battery. Trans. KoreanInst. Power Electron. 2012, 17, 222–229. [CrossRef]
17. Cho, T.H.; Lee, I.S. Lead-Acid Battery SOC Estimation using ANFIS of Photovoltaic System; Institute of Control,Robotics and Systems: Seoul, Korea, 2018; pp. 514–515.
18. Choi, J.D.; Hwang, Y.S.; Lee, H.J.; Seong, S.J. Modeling and Operation Analysis of NiH2 Battery Using Multi-LayerNeural Network; Transactions of Korean Institute of Power Electronics: Seoul, Korea, 1999; pp. 192–200.

Appl. Sci. 2020, 10, 8644 15 of 15
19. Wang, T.; Sui, S.; Tong, S. Data-based adaptive neural network optimal output feedback control for nonlinearsystems with actuator saturation. Neurocomputing 2017, 247, 192–201. [CrossRef]
20. Liu, Z.; Jia, W.; Liu, T.; Chang, Y.; Li, J. State of Charge Estimation of Lithium-ion Battery Based on RecurrentNeural Network. In Proceedings of the 2020 Asia Energy and Electrical Engineering Symposium (AEEES),Chengdu, China, 29–31 May 2020; pp. 742–746. [CrossRef]
21. Chemali, E.; Kollmeyer, P.J.; Preindl, M.; Ahmed, R.; Emadi, A. Long Short-Term Memory Networks for AccurateState-of-Charge Estimation of Li-ion Batteries. IEEE Trans. Ind. Electron. 2018, 65, 6730–6739. [CrossRef]
22. Windarko, N.A.; Choi, J.-H. SOC Estimation Based on OCV for NiMH Batteries Using an Improved TakacsModel. J. Power Electron. 2010, 10, 181–186. [CrossRef]
23. Jeong, Y.-M.; Cho, Y.-K.; Ahn, J.-H.; Ryu, S.-H.; Lee, B.-K. Enhanced Coulomb counting method with adaptiveSOC reset time for estimating OCV. In Proceedings of the 2014 IEEE Energy Conversion Congress andExposition (ECCE), Pittsburgh, PA, USA, 14–18 September 2014; pp. 1313–1318. [CrossRef]
24. Spagnol, P.; Rossi, S.; Savaresi, S.M. Kalman Filter SoC estimation for Li-Ion batteries. In Proceedings of the2011 IEEE International Conference on Control Applications (CCA), Denver, CO, USA, 28–30 September2011; pp. 587–592. [CrossRef]
25. Jiang, C.; Taylor, A.; Duan, C.; Bai, K. Extended Kalman Filter based battery state of charge (SOC) estimationfor electric vehicles. In Proceedings of the 2013 IEEE Transportation Electrification Conference and Expo(ITEC), Detroit, MI, USA, 16–19 June 2013; pp. 1–5. [CrossRef]
26. Zhi, L.; Peng, Z.; Zhifu, W.; Qiang, S.; Yinan, R. State of Charge Estimation for Li-ion Battery Based onExtended Kalman Filter. Energy Procedia 2017, 105, 3515–3520. [CrossRef]
27. Lee, I.-S.; Yu, D.-H. A Fault Diagnosis Based on Multilayer/ART2 Neural Networks. J. Korean Inst. Intell. Syst.2004, 14, 830–837. [CrossRef]
28. Han, J.-S.; Kwak, K.-C. Image Classification Using Convolutional Neural Network and Extreme LearningMachine Classifier Based on ReLU Function. J. Korean Inst. Inf. Technol. 2017, 15, 15–23. [CrossRef]
29. Chang, Z.; Zhang, Y.; Chen, W. Electricity price prediction based on hybrid model of adam optimized LSTMneural network and wavelet transform. Energy 2019, 187, 115804. [CrossRef]
30. Kingma, D.P.; Ba, J.; Adam. A Method for Stochastic Optimization. In Proceedings of the 3rd InternationalConference for Learning Representations, San Diego, CA, USA, 7–9 May 2015.
31. Kim, G.-B.; Choi, M.-R.; Hwang, C.-I. Comparison of missing value imputations for groundwater levelsusing multivariate ARIMA, MLP, and LSTM. J. Geol. Soc. Korea 2020, 56, 561–569. [CrossRef]
32. Li, X.; Zhang, L.; Wang, Z.; Dong, P. Remaining useful life prediction for lithium-ion batteries based on a hybridmodel combining the long short-term memory and Elman neural networks. J. Energy Storage 2019, 21, 510–518.[CrossRef]
33. Wu, Y.; Li, J.; Kong, Y.; Fu, Y. Deep Convolutional Neural Network with Independent Softmax for LargeScale Face Recognition. In Proceedings of the 24th ACM on International Conference on MultimediaRetrieval-ICMR’16, New York, NY, USA, 6–9 June 2016; pp. 1063–1067. [CrossRef]
Publisher’s Note: MDPI stays neutral with regard to jurisdictional claims in published maps and institutionalaffiliations.
© 2020 by the authors. Licensee MDPI, Basel, Switzerland. This article is an open accessarticle distributed under the terms and conditions of the Creative Commons Attribution(CC BY) license (http://creativecommons.org/licenses/by/4.0/).