
Real Time Paid Social Advertising Analysis
24
Sysomos Paid Social Analytics Hosted by Erica Jenkins, VP of Product
-
Upload
sysomos -
Category
Social Media
-
view
161 -
download
0
Transcript of Real Time Paid Social Advertising Analysis

Sysomos Paid Social AnalyticsHosted by Erica Jenkins, VP of Product

Social Advertising LandscapeLets make sure we’re all on the same page…
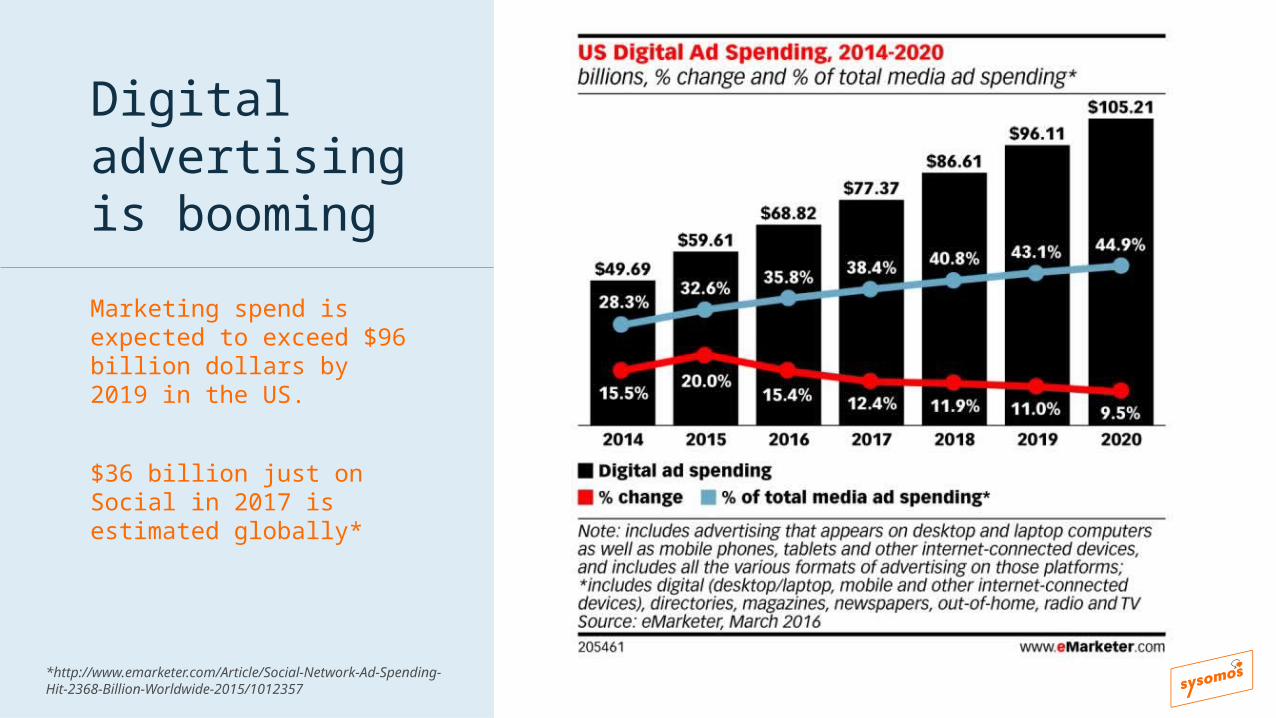
Digital advertising is booming
Marketing spend is expected to exceed $96 billion dollars by 2019 in the US.
$36 billion just on Social in 2017 is estimated globally*
*http://www.emarketer.com/Article/Social-Network-Ad-Spending-Hit-2368-Billion-Worldwide-2015/1012357

So Why is Facebook Dominating?
Expected spend by 2016*: $25 billion+
Key Strengths: Largest user base, avg daily time spent is 40+ mins
Most advanced targeting capabilities
Pyschographoc indicators through Behaviors
Multiple ad units based on campaign objectives
Engagement capability for customer acquistion
Custom Audience Targeting
Rich Insights
Rich Targeting Options:
• Location
• Demographics
• Political Affinities
• Life Events
• Keywords & Interests
• Connections
• Behaviors
• Proximity indicators
*https://investor.fb.com/investor-news/press-release-details/2016/Facebook-Reports-Second-Quarter-2016-Results/default.aspx

How does our tool add value to Facebook media buying today?
Built for the marketer and agency to easily measure ad performance with near real time custom reports, interactive analysis, and ad performance ranking by ad, creative, or target
One tool for all marketers from CMO to regional hubs to local markets with simple visualizations customized for each group.
Beyond Facebook Ads Manager reporting by:
D Analyze all social ad accounts, brands, channels and markets
D Aggregate and benchmark KPIs with currency normalization
D Identify top performing ad creatives and audiences
D Enable engagement on paid ads driving customer acquisition
D Share top creatives and audiences to lift regional performance

Facebook insights evolution
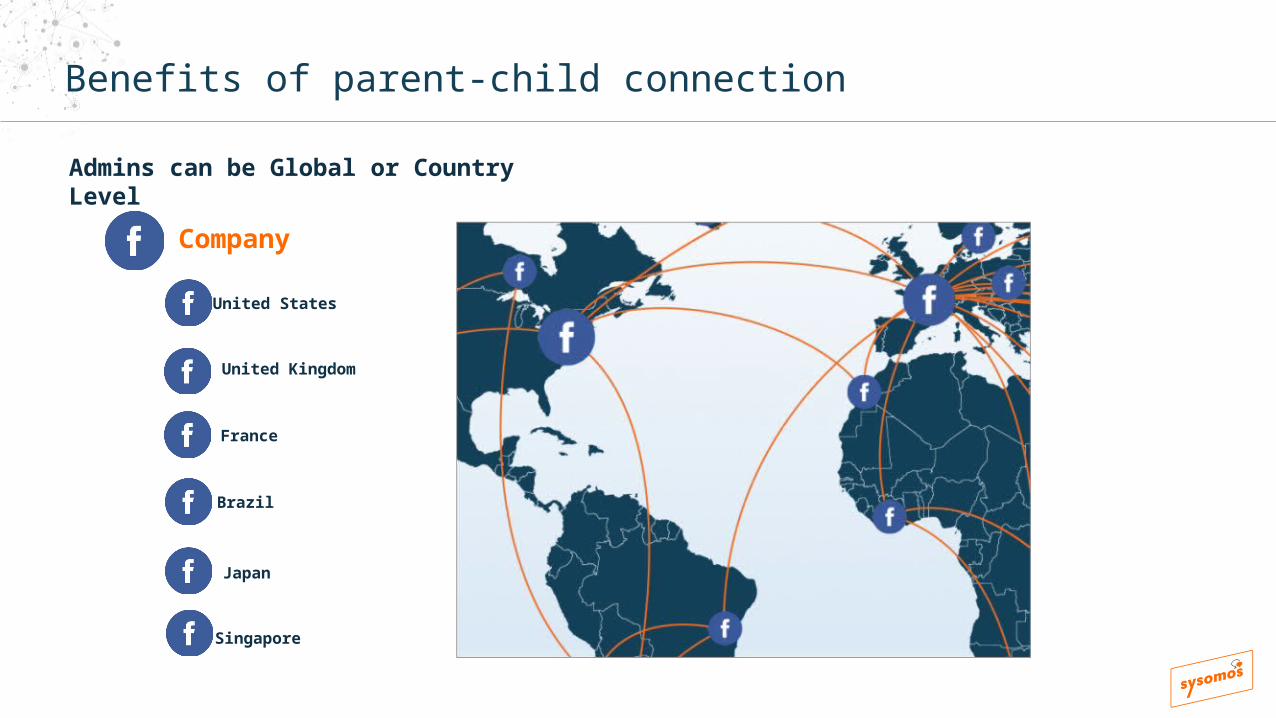
Benefits of parent-child connection
Company
United States
United Kingdom
France
Brazil
Japan
Admins can be Global or Country Level
Singapore
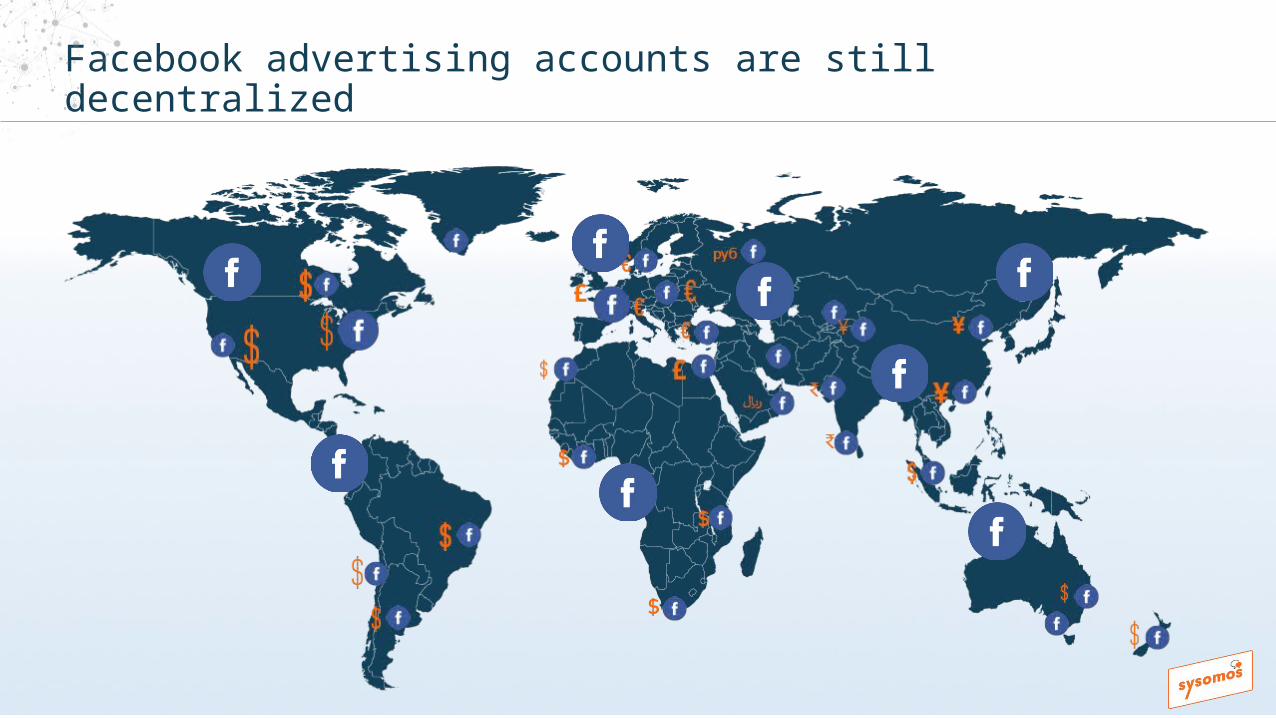
Facebook advertising accounts are still decentralized

So now we are aligned…let’s talk posts & ads
Page Posts
Lives on the Page
Limited Organic distribution
Boosted Posts
Lives on the Page
Pay for greater Reach in the Newsfeed
Dark Posts
Lives in the Ads Account
Pay to Target People
Location: Canada Age: 25 - 45 Placements: mobile devices People Who Match: Behaviors: All frequent travelers, Used travel app (2 weeks), Used travel app
Location: USA Age: 18 - 65 Placements: mobile devices People Who Match: Behaviors: All frequent travelers, Like Visa
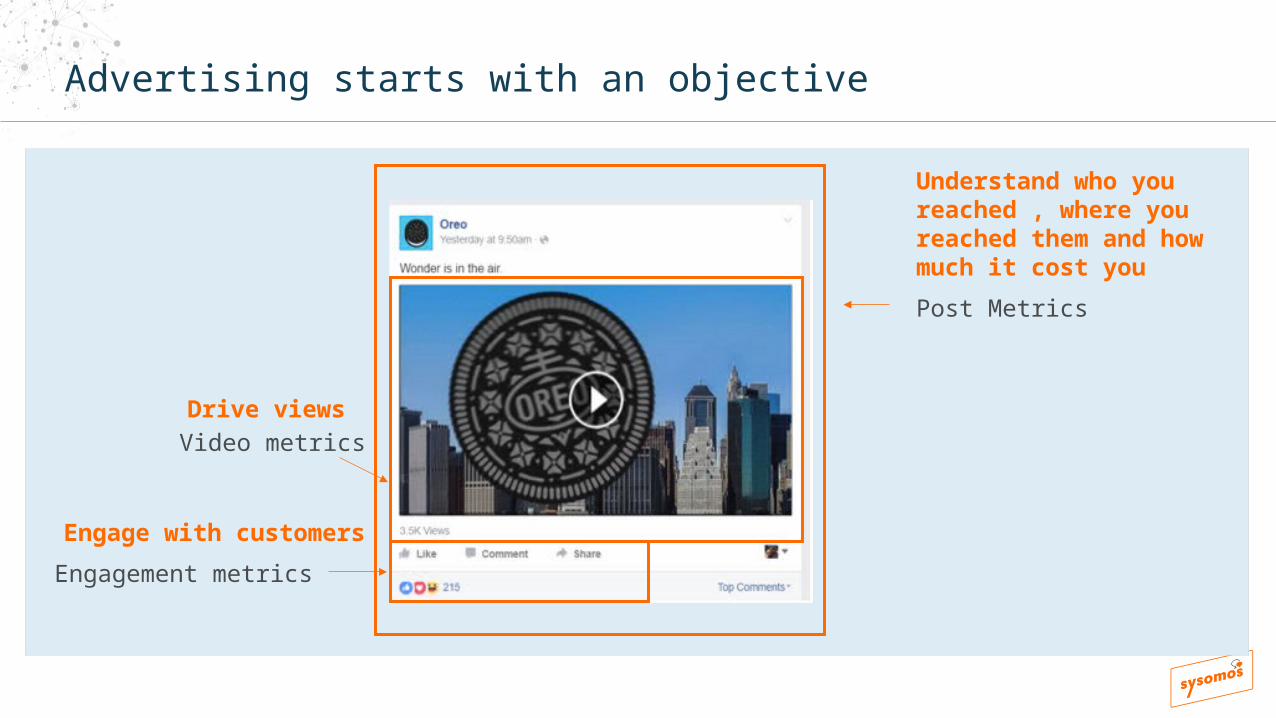
Understand who you reached , where you reached them and how much it cost you
Advertising starts with an objective
Post Metrics
Video metrics
Engagement metrics
Drive views
Engage with customers

North America
Q1 2016
Q4 2015+ 26%Quarter / Quarter
Asia- Pacific
Q1 2016
Q4 2015+ 46%Quarter / Quarter
*source http://www.nanigans.com/resource/fb/usu/q1-2016-global-facebook-advertising-benchmark-report
Emerging new creative focused on video

12

Some questions you probably are asking yourself…
“I use a media buying tool that does all of this for me…why is this different?”
Regardless of where ads are purchased, our tool aggregates hundreds of paid and owned metrics for near real time campaign analysis. The tool enables marketers and agencies to get value based on their needs
from reporting, A/B testing, and easy visibility to what is working.
“I’m a brand, can I really see all my spending in real time, and globally?”
Yes, our tool allows near real time updates across all ad accounts. This allows regional and global rollups by market for benchmarking and sharing of top performing ads updated every 10 minutes.
“I’m an agency, I already do paid reporting, why do I need this?”
Our custom reporting automates the collection of all ad data for near real time measure and benchmarking. Our interactive analysis enables decision making on ads, creatives, and targets to optimize campaigns.
This saves labor, timeliness of measurement, and better optimization of campaign performance.

Single Brand Multiple Markets
Enable real time decision making to affect campaign performance across creative and audience
Identify top performing ad creatives and audiences
Enable real-time engagement of paid ads
Simplified Transparent Reporting and Analytics
Single-lens view of campaigns across multiple agencies, ads accounts and markets
Measure and benchmark KPIs across markets
Cross-market visibility to identify and share creative and audiences for overall lift
Real time spending and access globally or by region
Depending on who you are…your needs are different
Agencies
Optimize campaign performance to maximize client ad spend with less resources
Eliminate manual reporting
Provide clients real time insights in simple marketer interface
Maximize ROI for clients by executing smarter campaigns

Brands and marketers

Agency

17
Holistic view of social campaigns
Paid & Organic Reports
• Visualize insights through the conversion funnel with key metrics marketers care about
• Easily change markets or accounts to update report
• Empower marketers to understand what is driving actions
• Export to PDF or CSV saving time and manual effort

18
Benchmark across your markets
KPIs across markets are aggregated
Rank by specific KPIs for real time action and analysis globally
Export Paid and Organic Insights from a single interface for deep manual analysis
Simplified reporting for marketers and analysts to work in collaboration
Enables real time measurement or the ability to review a full campaign roll up
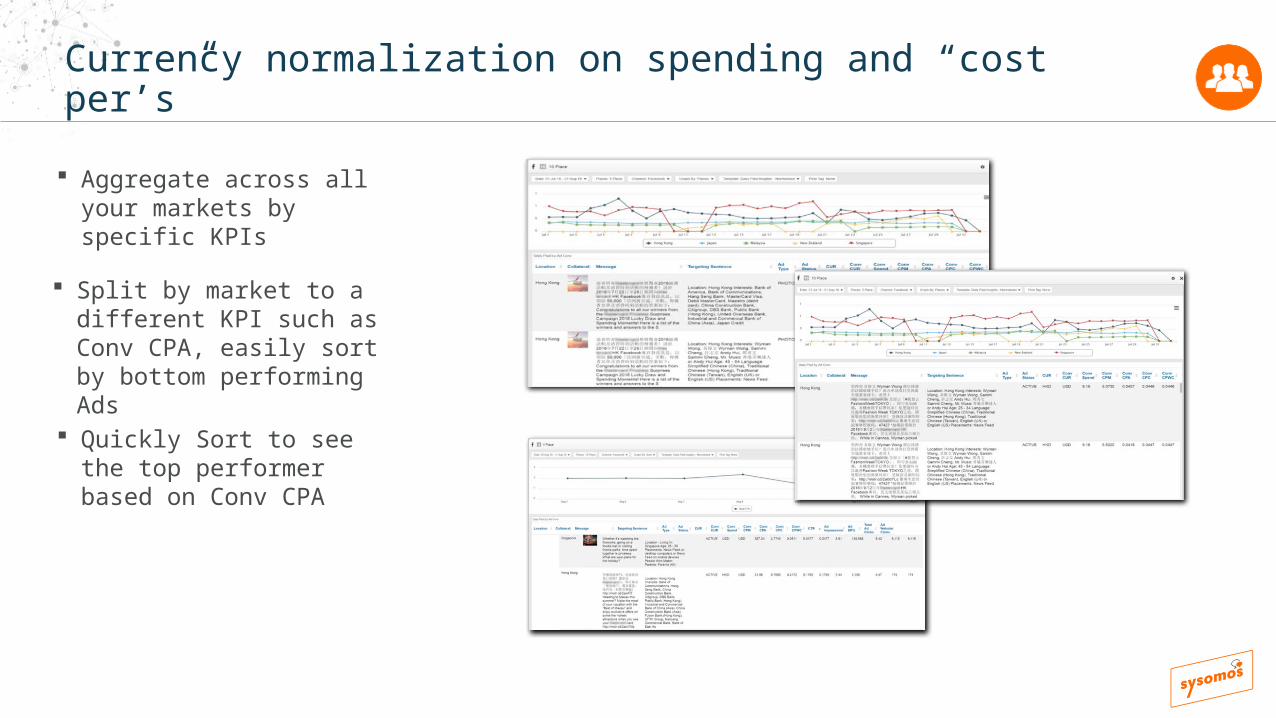
Currency normalization on spending and “cost per’s”
Split by market to a different KPI such as Conv CPA, easily sort by bottom performing Ads
Aggregate across all your markets by specific KPIs
Quickly Sort to see the top performer based on Conv CPA
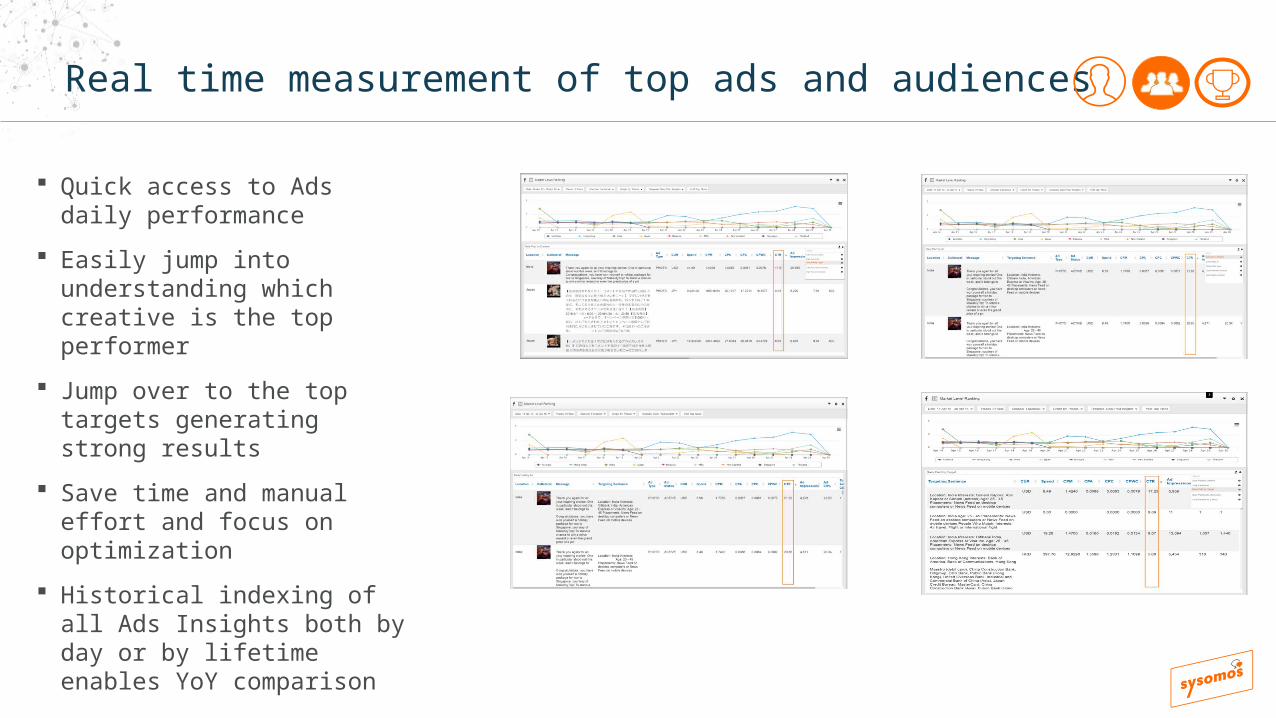
Real time measurement of top ads and audiences
Quick access to Ads daily performance
Easily jump into understanding which creative is the top performer
Jump over to the top targets generating strong results
Save time and manual effort and focus on optimization
Historical indexing of all Ads Insights both by day or by lifetime enables YoY comparison

21
Engage with paid audiences
Aggregate all ads for engagement or customer service escalation
Private Message people from comments on Ads to resolve issues
Mark comments and replies as read to move things out of your work queue
Tag profiles for future filtering and categorization for targeted audiences
We’re so glad you enjoyed your stay Susan!

22
Discover and share top ads across markets
Rich creative view of active ads, boosted or page posts
Rank top performing ads across markets by KPIs with view access outside your responsibility
Repurpose sharing to drive stronger campaign objectives
Publish a Dark Post from one Ads Account to another
Compare Campaign A with Campaign B with tags
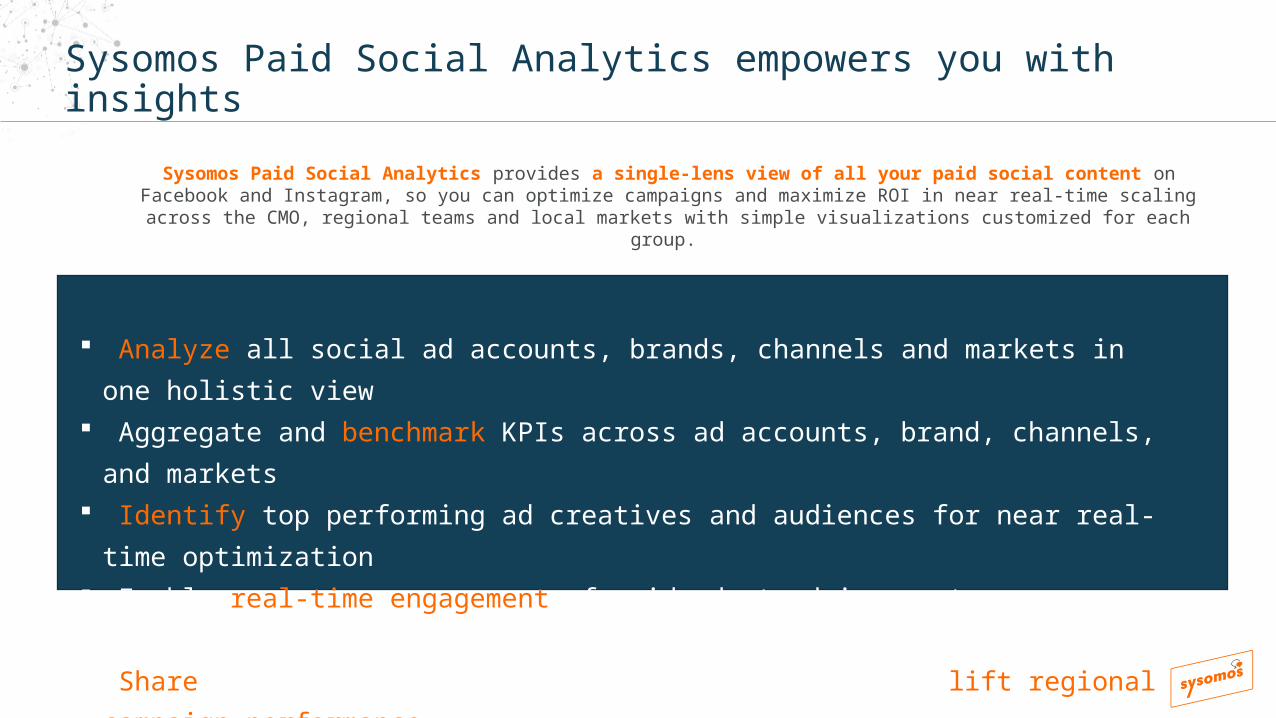
Sysomos Paid Social Analytics empowers you with insights
Sysomos Paid Social Analytics provides a single-lens view of all your paid social content on Facebook and Instagram, so you can optimize campaigns and maximize ROI in near real-time scaling
across the CMO, regional teams and local markets with simple visualizations customized for each group.
Analyze all social ad accounts, brands, channels and markets in one holistic view Aggregate and benchmark KPIs across ad accounts, brand, channels, and markets Identify top performing ad creatives and audiences for near real-time optimization Enable real-time engagement of paid ads to drive customer acquisition and loyalty Share top creatives and audiences across markets to lift regional campaign performance
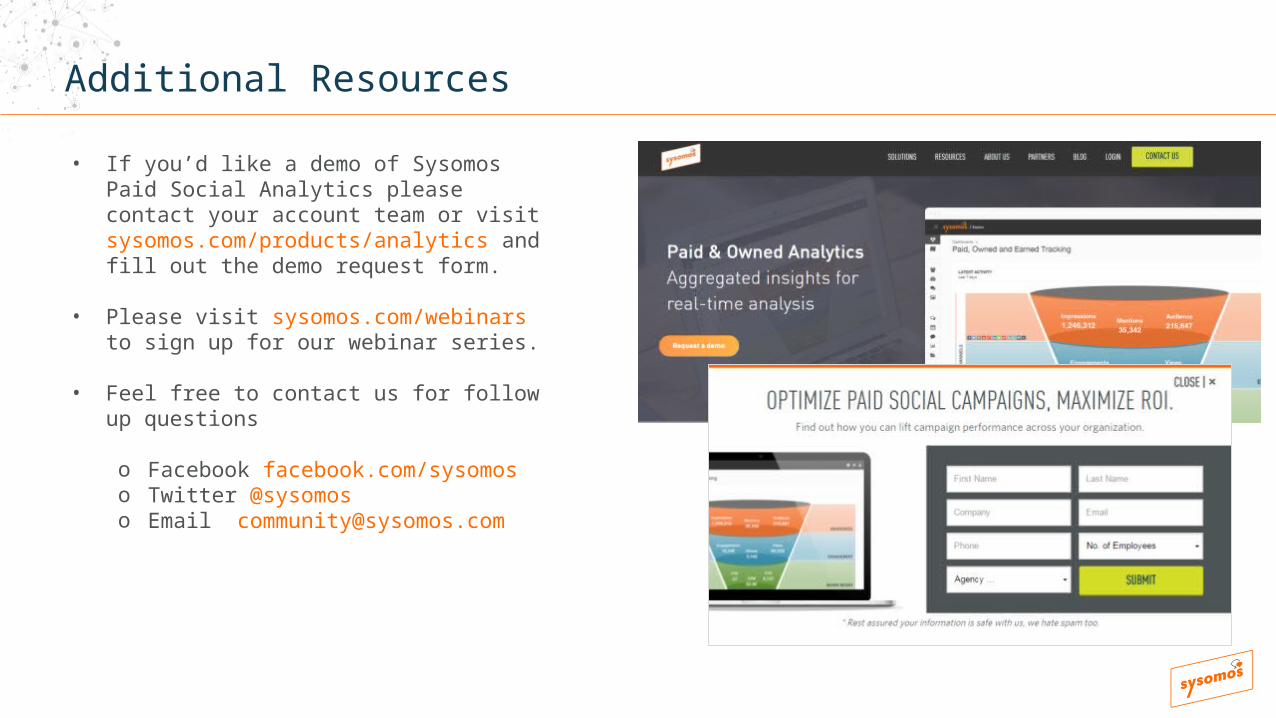
Additional Resources
• If you’d like a demo of Sysomos Paid Social Analytics please contact your account team or visit sysomos.com/products/analytics and fill out the demo request form.
• Please visit sysomos.com/webinars to sign up for our webinar series.
• Feel free to contact us for follow up questions
o Facebook facebook.com/sysomoso Twitter @sysomoso Email [email protected]