Self-adaptive Localization using Signal Strength Measurements
Upload
phungkhanhCategory
view
225download
0
Stephen F. Smith
The Robotics Institute
Carnegie Mellon University
www.surtrac.net
Real-time adaptive signal control for urban road networks
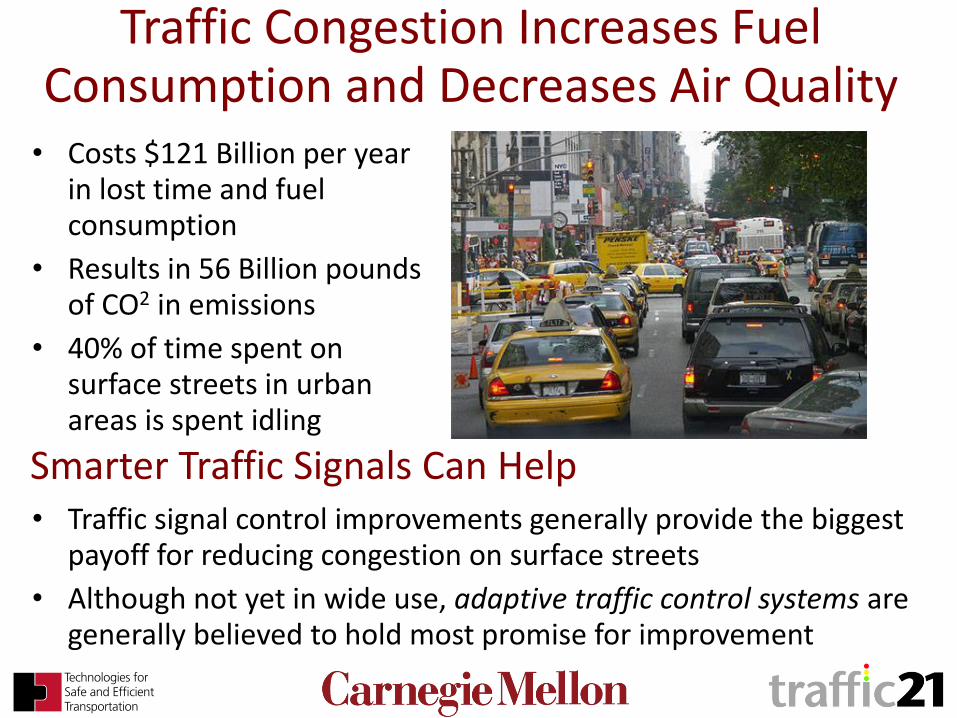
Traffic Congestion Increases Fuel Consumption and Decreases Air Quality • Costs $121 Billion per year
in lost time and fuel consumption
• Results in 56 Billion pounds of CO2 in emissions
• 40% of time spent on surface streets in urban areas is spent idling
• Traffic signal control improvements generally provide the biggest payoff for reducing congestion on surface streets
• Although not yet in wide use, adaptive traffic control systems are generally believed to hold most promise for improvement
Smarter Traffic Signals Can Help

Adaptive Traffic Signal Control for Urban Road Networks Stephen F. Smith, Gregory J. Barlow, Xiao-Feng Xie, Zachary B. Rubinstein
www.surtrac.net
Goal: Real-time optimization of traffic flows for urban (grid) road networks
Technical Approach: – Decentralized control
– Coordinated action
Research Progress
• 2010-11: Development of core approach; Simulation of performance on downtown Pittsburgh network
• 2011-12: East Liberty pilot deployment
• 2013-14: Expansion of pilot test site
Benefits • True real-time response • Multiple dominant flows • Scalable, incremental
deployment • Multi-modal optimization
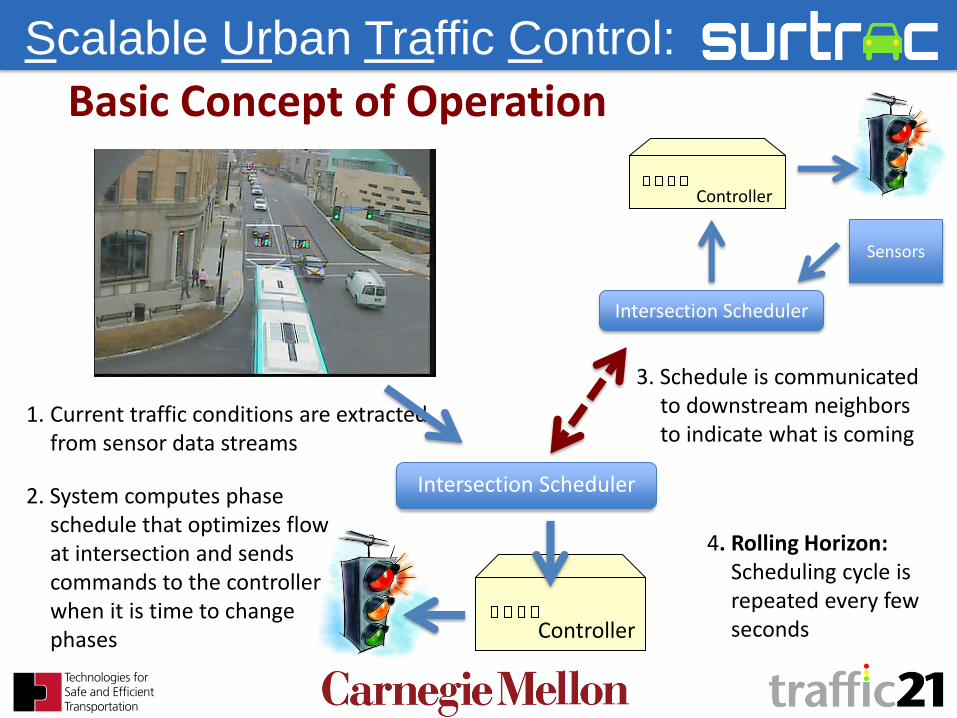
Scalable Urban Traffic Control:
Intersection Scheduler
1. Current traffic conditions are extracted from sensor data streams
Controller
2. System computes phase schedule that optimizes flow at intersection and sends commands to the controller when it is time to change phases
Controller
Intersection Scheduler
Sensors
3. Schedule is communicated to downstream neighbors to indicate what is coming
4. Rolling Horizon: Scheduling cycle is repeated every few seconds
Basic Concept of Operation

The Heinz Endowments
Penn Circle Pilot Study
Test Site – Developing area of Pittsburgh
with changing traffic patterns and
volumes
– Mixed commercial, retail and
residential land use
– 9 recently upgraded intersections
with camera detection
Partners − The Heinz Endowments
− City of Pittsburgh
− East Liberty Development Corp.
− Traficon Traffic Video Detection
− Traffic Control Products
Penn Ave./Penn Circle

Initial Deployment
Surtrac Processor
Network connection to fiber optic cable
Camera
Controller
Video Processing
Boards

SURTRAC in Action
Before After
VIDEO REMOVED TO ALLOW FILE TO BE EMAILED

East Liberty Pilot Test Results • Performance comparison to current
coordinated-actuated timing plans – Series of before and after drive-through
runs over 12 routes at 4 different periods of the day
– GPS tracking of travel times and number of stops
– Traffic volume data used to combine data from different routes
• Summary Results:
% Improvement Travel Time Speed # of Stops Wait Time Emissions
AM rush 30.11% 33.78% 29.14% 47.78% 23.83%
Mid Day 32.83% 48.55% 52.58% 49.82% 29.00%
PM rush 22.65% 27.45% 8.89% 35.60% 18.41%
Evening 17.52% 27.81% 34.97% 27.56% 14.01%
Overall 25.79% 34.02% 31.34% 40.64% 21.48%

CO, NOx and VOC Emissions • Per Day
– Number of vehicles: 29,940
– Fuel savings: 247 gallons
– Reduction in toxic emissions (CO, NOx, VOC): 24.67 kg
– Reduction in CO2 emissions: 2.2 metric tons
• Per year
– Fuel savings: 64,580 gallons
– Toxic emissions: 6.44 m. tons
– CO2 emissions: 577.8 m. tons
5228 8007
9548 7157
0
5000
10000
15000
AM-Rush Mid Day PM-Rush Evening
# of vehicles per day
CO, NOX, VOC Reduction per day
CO, NOX, VOC Reduction per year
0.0000
2.0000
4.0000
6.0000
8.0000
10.0000
AM rush Mid Day PM rush Evening
VOC (kg)
NOx (kg)
CO (kg)
0.0000
1.0000
2.0000
3.0000
AM rush Mid Day PM rush Evening
VOC (tonnes)
NOx (tonnes)
CO (tonnes)

Bakery Square Expansion • Operational since Nov. 2013
• Nine additional intersections
– Moving east along Penn Ave.
around Bakery Square to
Fifth Ave.
• Same evaluation methodology
• Summary Results:
% Improvement Travel Time Delay # of Stops Wait Time Emissions
AM rush 17.02% 26.31% 33.81% 32.76% 16.21%
Mid Day 21.35% 34.04% 37.23% 38.09% 17.62%
PM rush 28.61% 39.35% 44.87% 46.40% 24.77%
Overall 24.10% 35.41% 40.42% 41.59% 20.69%

2014-15 Expansion Plans
• Scalability test of 49 intersections in early 2015
Fall 2014: • 6 intersections • Heinz, RK Mellon
2014-15: • 23 Intersections • Hillman, Heinz, RK Mellon, UMPC
Fall 2014: • 2 Intersections • URA

Current Research Directions
• Multi-modal traffic flow optimization
– Real-time detection and response to buses
and pedestrians
• Optimization for environmental impact
• Monitoring and shaping traffic flows
– Communication with vehicles and integration
with route choice
– Real-time incident detection and congestion
mitigation
• Real-time use of traffic data
– Self-monitoring traffic networks
I-to-V: There’s an accident ahead. Turn left to route around and proceed east.