RCMRD –SERVIR AFRICA - UNFCCC€¢ University of Colorado Country Scheme I Scheme II Malawi Kappa:...
26
A GIS & REMOTE SENSING APPROACH IN REDUCING VULNERABILITIES TO CLIMATE CHANGE IMPACTS IN AFRICA LEG Regional Training Workshop on Adaptation for Anglophone African Least Developed Countries LCD’s Rwanda Kigali, 29 July 2013 ‐ 3 August 2013 RCMRD – SERVIR AFRICA
Transcript of RCMRD –SERVIR AFRICA - UNFCCC€¢ University of Colorado Country Scheme I Scheme II Malawi Kappa:...
A GIS & REMOTE SENSING APPROACH IN REDUCING VULNERABILITIES TO CLIMATE CHANGE IMPACTS IN AFRICA
LEG Regional Training Workshop on Adaptation for Anglophone African Least Developed Countries LCD’sRwanda Kigali, 29 July 2013 ‐ 3 August 2013
RCMRD – SERVIR AFRICA
Current member states are 19 with latest inclusion of South Sudan.

SERVIR GLOBAL HUBS AND REGIONS OF INTEREST
SERVIR‐Africa is among the core RCMRD projects that has been active since 2008 and also serving all the 19 RCMRD member countries.

GEOSS THEMES: SERVIR Thematic areas
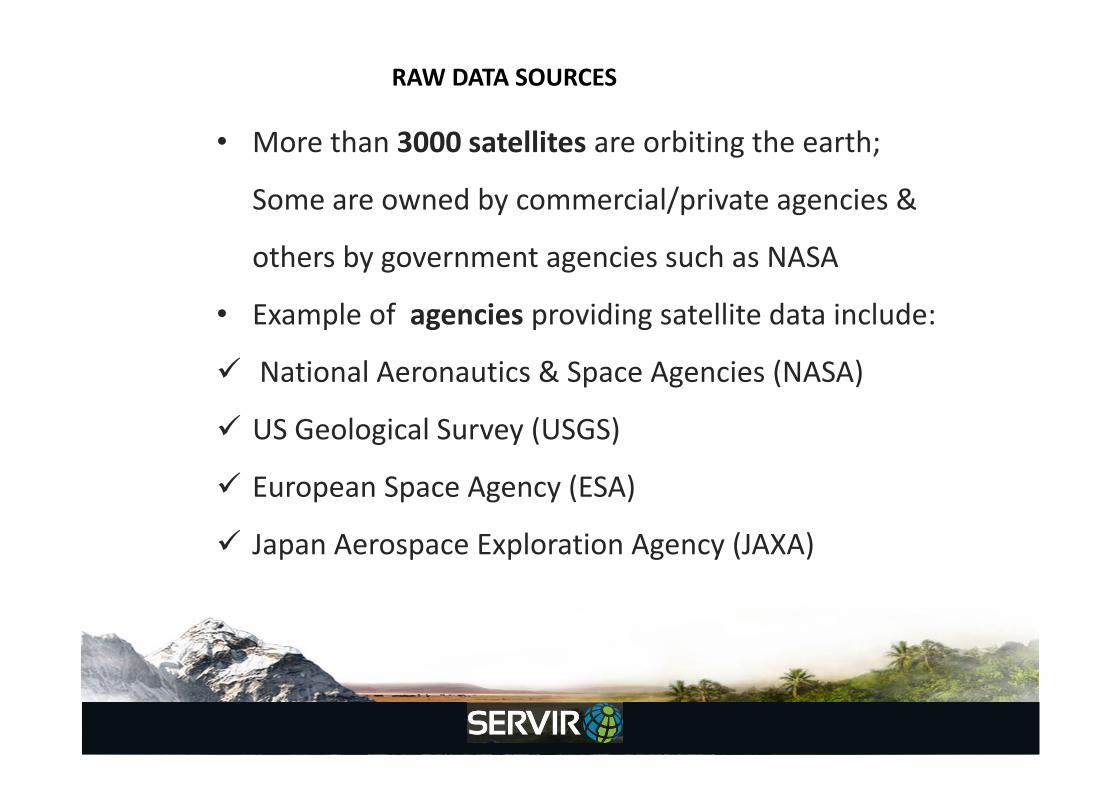
• More than 3000 satellites are orbiting the earth;
Some are owned by commercial/private agencies &
others by government agencies such as NASA
• Example of agencies providing satellite data include:
National Aeronautics & Space Agencies (NASA)
US Geological Survey (USGS)
European Space Agency (ESA)
Japan Aerospace Exploration Agency (JAXA)
RAW DATA SOURCES

6
www.servirglobal.net
NASA mission (goal 3A): Study Earth from space to advance scientific understanding and meet societal needs
NASA Earth Science Research Spacecraft
Projects & Products

LAND USE LAND COVER MAPS FOR EASTERN AND SOUTHERN AFRICA
• These landSat derived products were primarily developed for the assessment of vegetation cover in relation to GHG emissions at National level.
• However, the maps have dynamic applications e.g. can be used to address climate change resilience at Ecosystem level by analyzing shifts in the main vegetation cover e.g. Woodland to Savannah, Wetlands to Grasslands etc. Which might be attributed to shift in climatic conditions in a given region.
• They can also be used at a policy and planning level e.g. to show areas that require protective interventions i.e. rapidly degrading forest cover, infrastructural development e.g. hospitals, schools, roads etc.
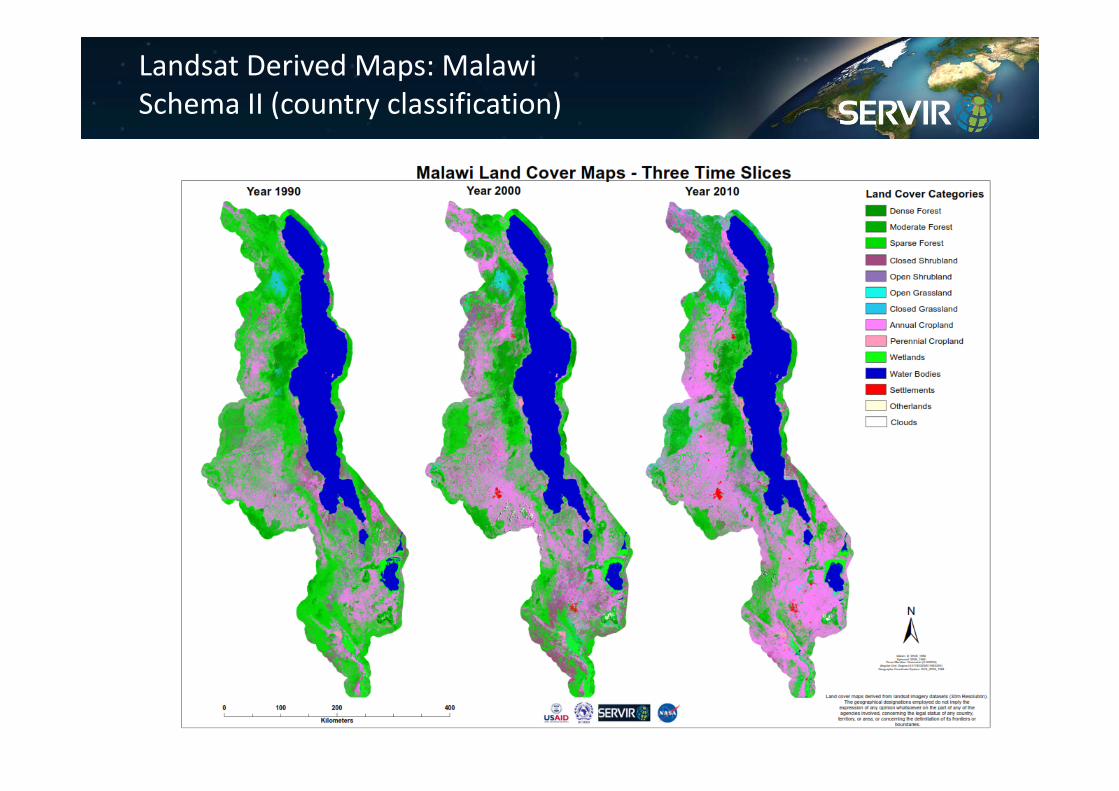
Landsat Derived Maps: Malawi Schema II (country classification)
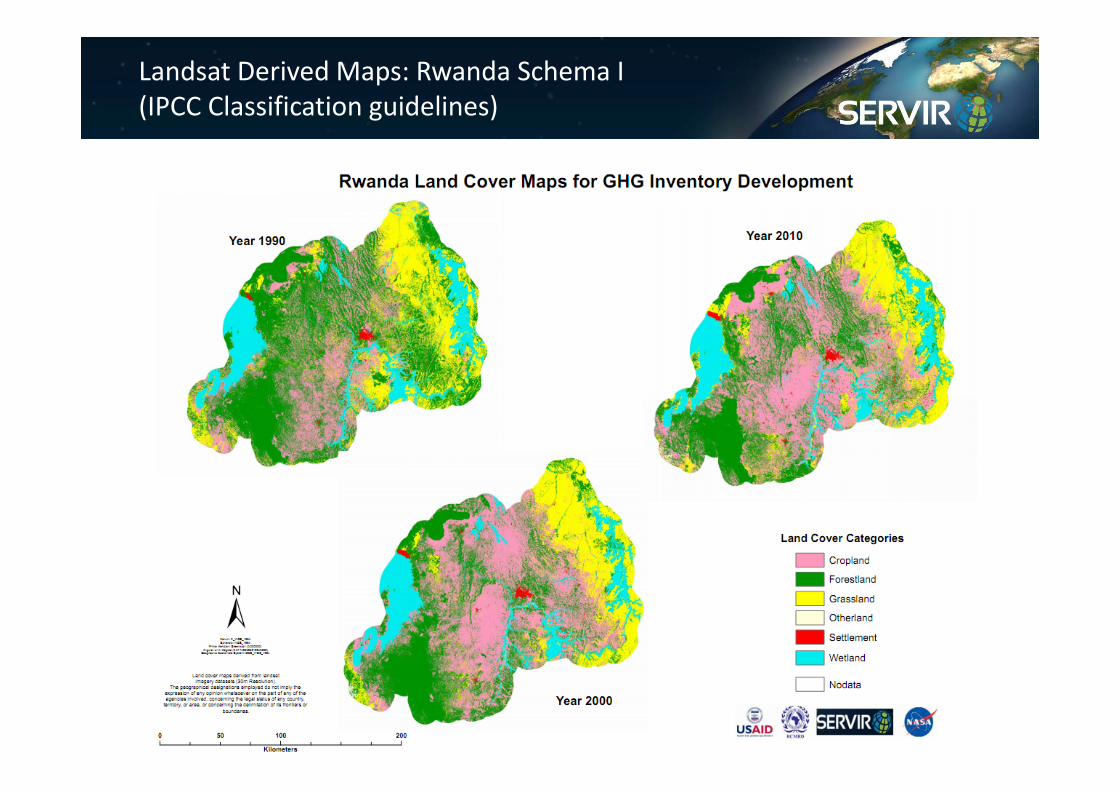
Landsat Derived Maps: Rwanda Schema I (IPCC Classification guidelines)

In Conclusion
• Through the use of LandSat satellite imagery; RCMRD & Relevant government agencies have been able to come up with accurate LULC maps.
• The process was duly conducted with active collaboration from various government agencies in respective countries and there after conducted an on the job training to enhance the capacities of various government representatives.
Key Stakeholders• Africa
Governments Agencies
• UNFCCC• USAID• US EPA• ICFI• NASA• RCMRD
SERVIR‐Africa• University of
Colorado
Country Scheme I Scheme II
Malawi Kappa: 0.7871Overall Accuracy: 85.2399
Kappa: 0.7439Overall Accuracy: 79.5203
Rwanda Kappa: 0.8077Overall Accuracy: 86.4253
Kappa: 0.7643Overall Accuracy: 80.0454
Zambia Kappa: 0.7409Overall Accuracy: 80.415
Kappa: 0.7163Overall Accuracy: 75.5167
Accuracy Assessment
IGAD HAZARD MAPS & ATLAS: Introduction
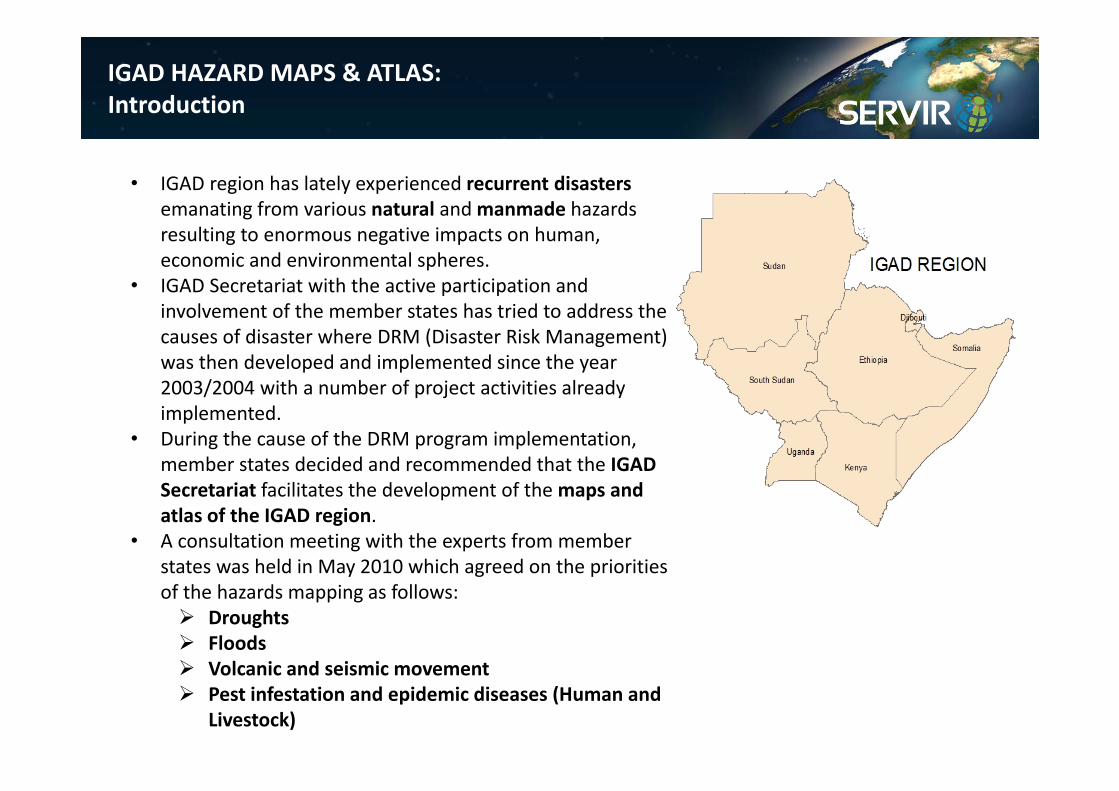
• IGAD region has lately experienced recurrent disasters emanating from various natural and manmade hazards resulting to enormous negative impacts on human, economic and environmental spheres.
• IGAD Secretariat with the active participation and involvement of the member states has tried to address the causes of disaster where DRM (Disaster Risk Management) was then developed and implemented since the year 2003/2004 with a number of project activities already implemented.
• During the cause of the DRM program implementation, member states decided and recommended that the IGAD Secretariat facilitates the development of the maps and atlas of the IGAD region.
• A consultation meeting with the experts from member states was held in May 2010 which agreed on the priorities of the hazards mapping as follows: Droughts Floods Volcanic and seismic movement Pest infestation and epidemic diseases (Human and
Livestock)
IGAD HAZARD MAPS & ATLAS: Introduction
Objectives of developing the hazard maps and atlas
1. To initiate the process from the start; no existing maps
2. To assist the decision makers/policy developers to put into place appropriate
policy actions in order to prevent hazards from causing disasters;
3. To assist DRM experts to plan and to take practical activities in mitigating the
impacts of hazards;
4. To create awareness to the vulnerable communities on the hazards surrounding
them and
5. To mobilize resources both internally and external partners on how to address
hazards which cause disasters.

IGAD HAZARD MAPS & ATLAS: Understanding the risks: The model
Where is the risk?µ
&: Capital cities
#0 Main towns
2011 GHoA droughtDrought conditions
Normal conditions
What are the risk?
µ
&: Capital cities
#0 Main towns
Pop. density3360
0
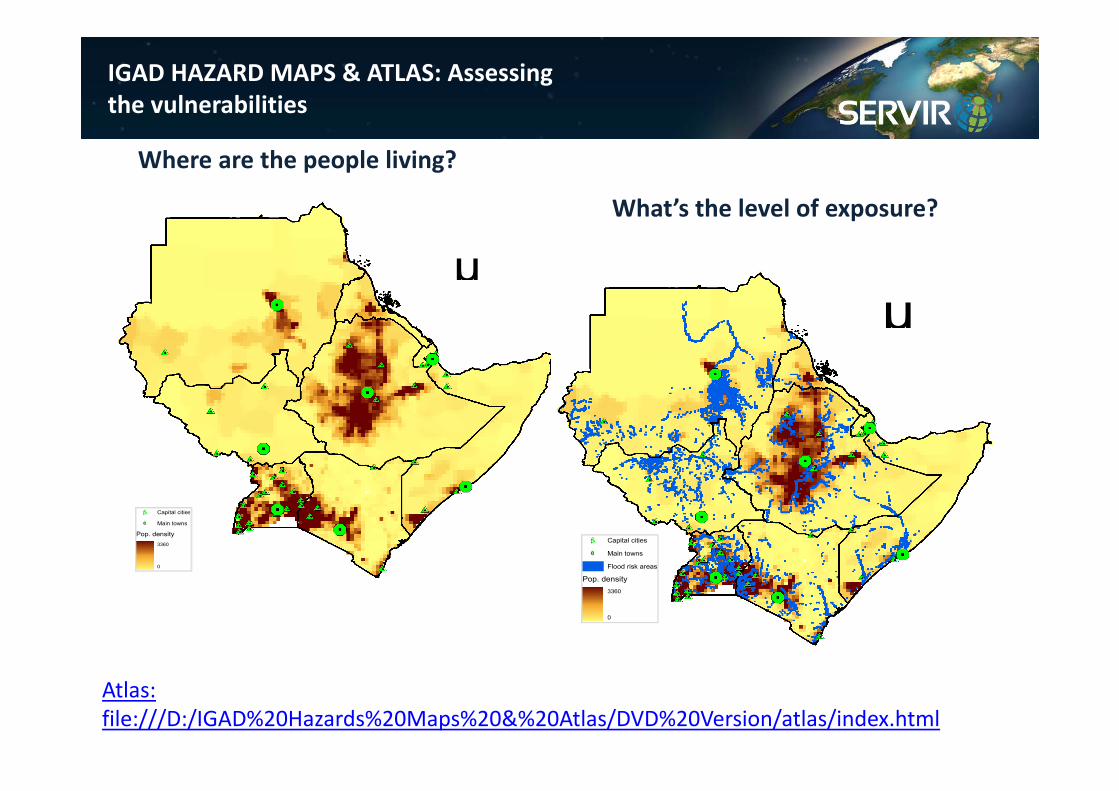
Where are the people living?
µ
&: Capital cities
#0 Main towns
Flood risk areas
Pop. density3360
0
What’s the level of exposure?
Atlas: file:///D:/IGAD%20Hazards%20Maps%20&%20Atlas/DVD%20Version/atlas/index.html
IGAD HAZARD MAPS & ATLAS: Assessing the vulnerabilities

Tools & Applications(At a Glance)
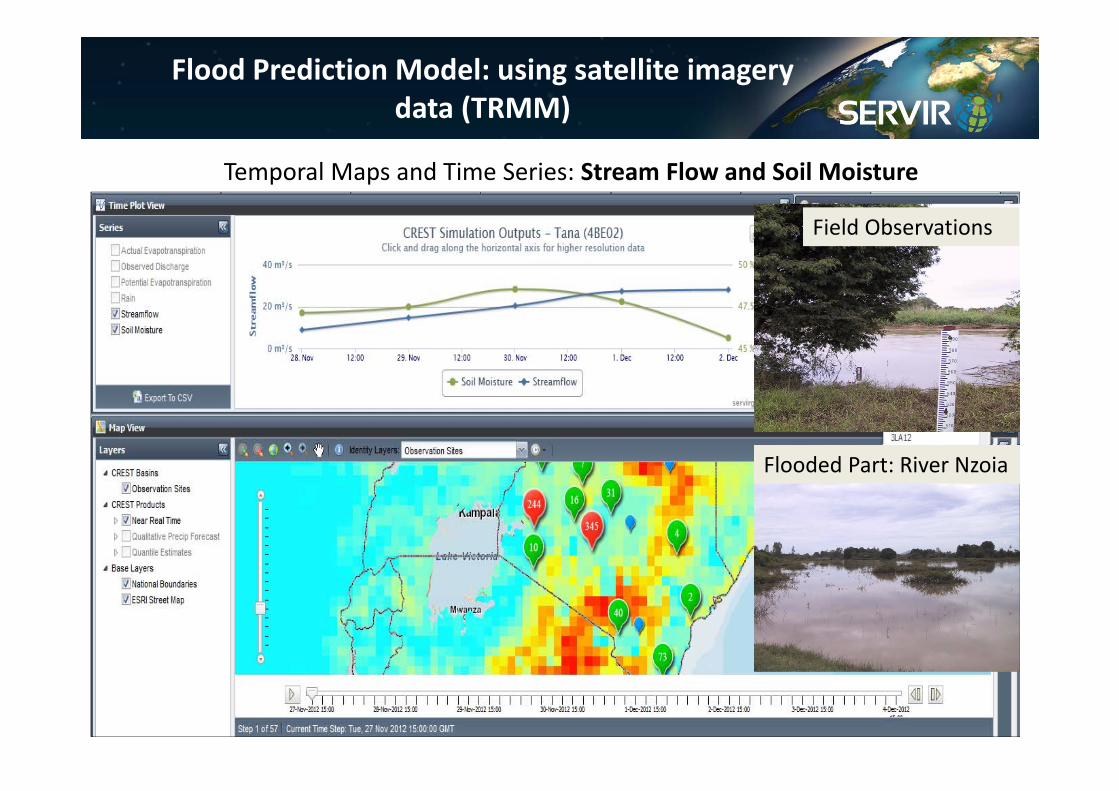
Flood Prediction Model: using satellite imagery data (TRMM)
Temporal Maps and Time Series: Stream Flow and Soil Moisture
Field Observations
Flooded Part: River Nzoia
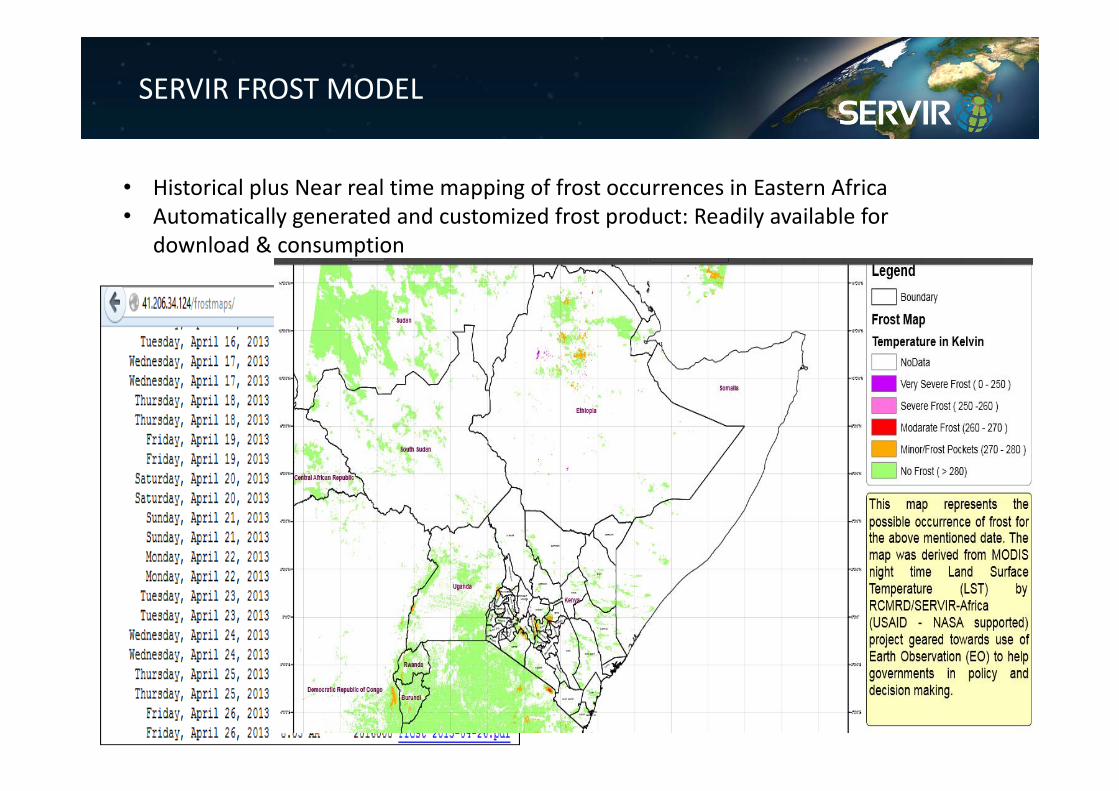
SERVIR FROST MODEL
• Historical plus Near real time mapping of frost occurrences in Eastern Africa• Automatically generated and customized frost product: Readily available for
download & consumption
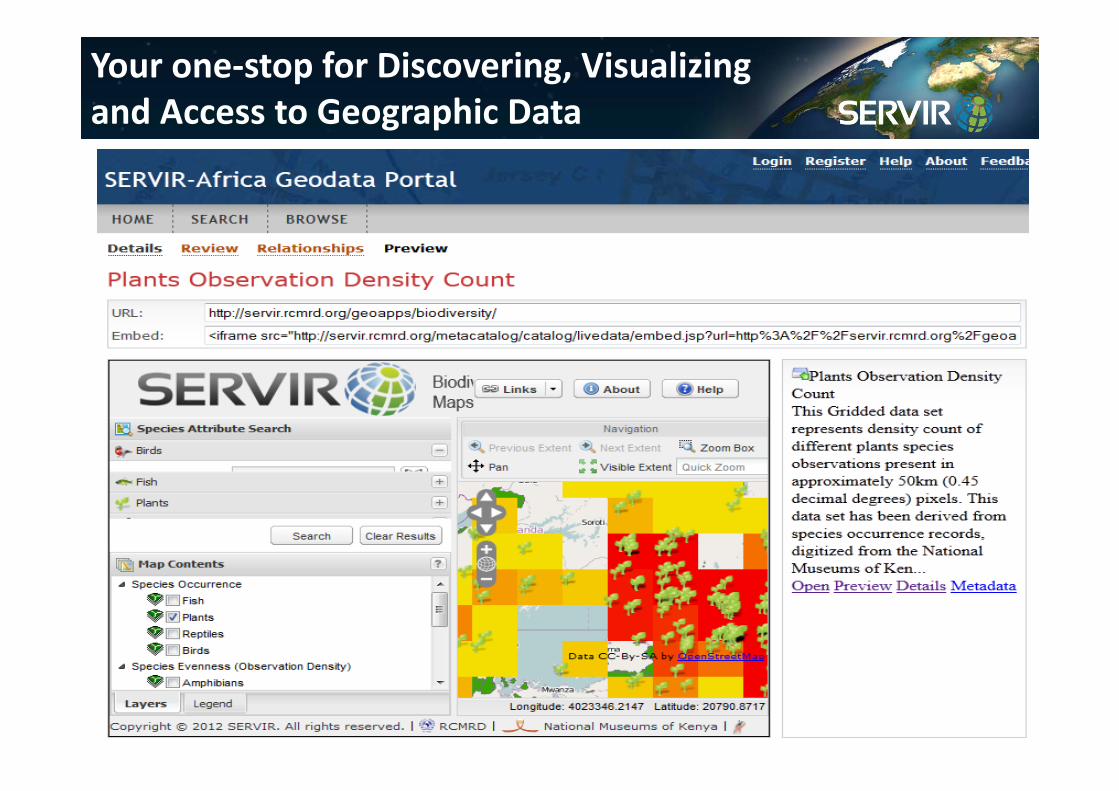
Your one‐stop for Discovering, Visualizing and Access to Geographic Data

SERVIR INTERACTIVE MAPPER
• An online visualization tool that allows mash up of several data layers and retrieval of same information from multiple external sources.
• Comprises of both time series data like TRMM rainfall data and other still data sets.
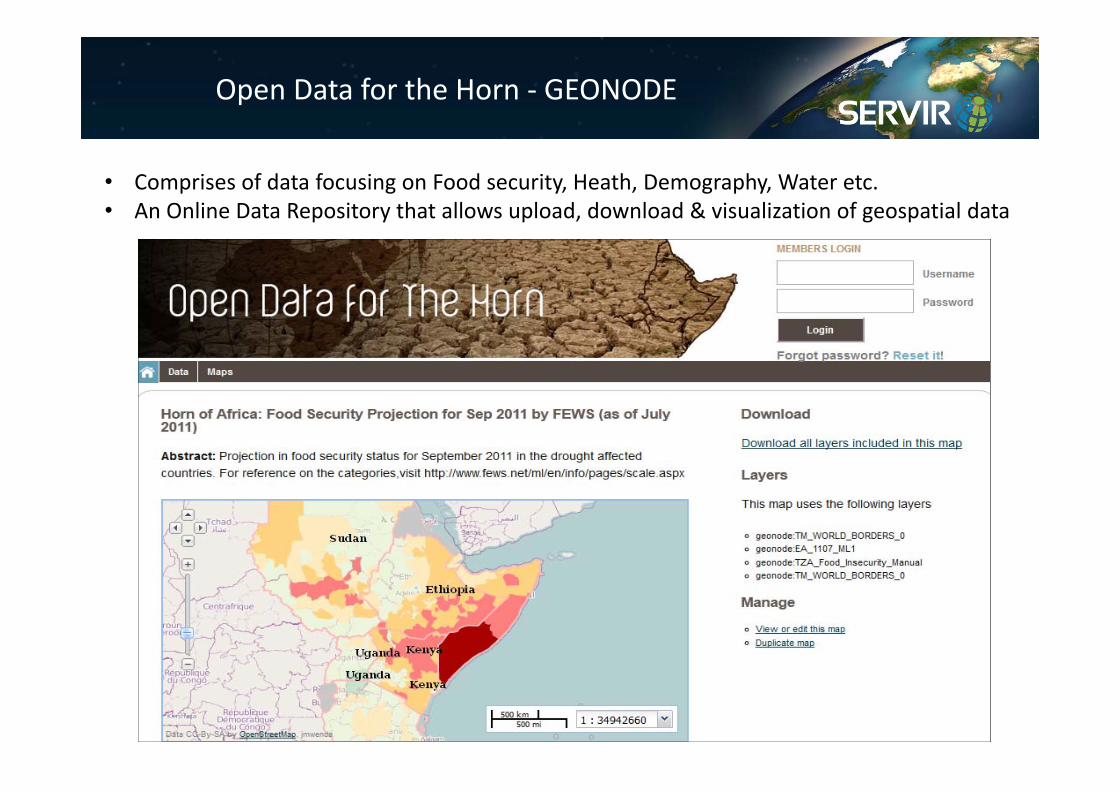
Open Data for the Horn ‐ GEONODE
• Comprises of data focusing on Food security, Heath, Demography, Water etc.• An Online Data Repository that allows upload, download & visualization of geospatial data
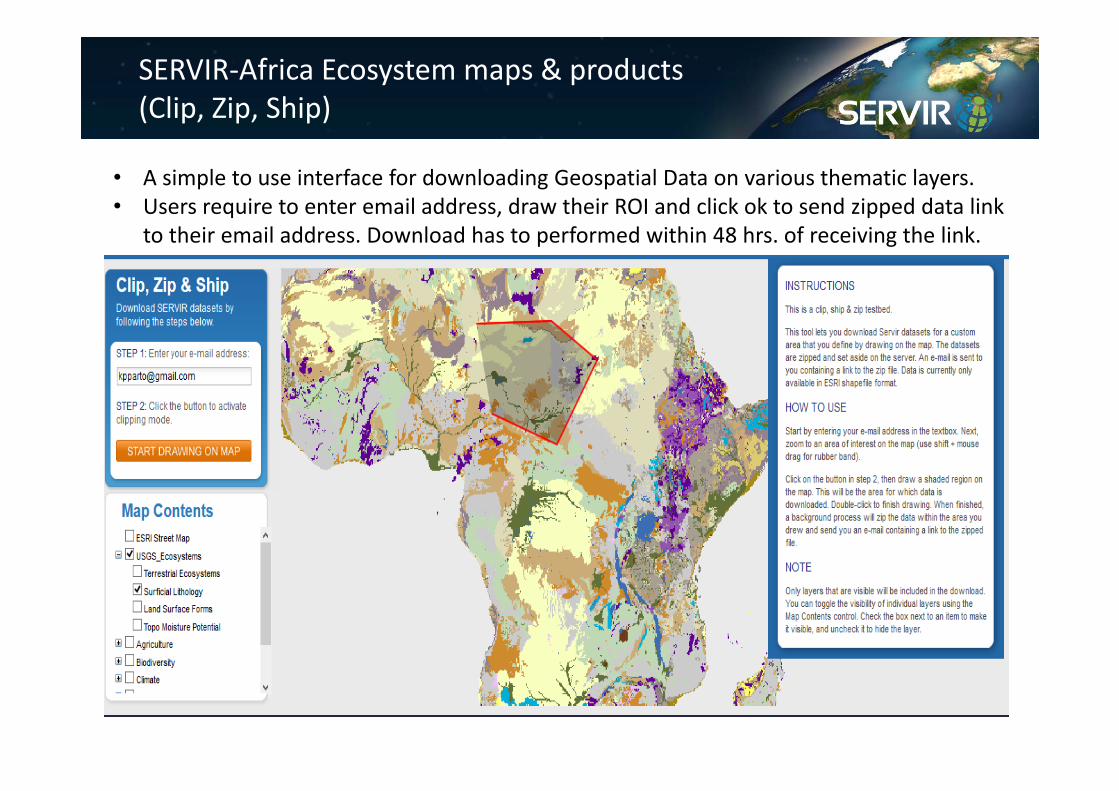
SERVIR‐Africa Ecosystem maps & products (Clip, Zip, Ship)
• A simple to use interface for downloading Geospatial Data on various thematic layers.• Users require to enter email address, draw their ROI and click ok to send zipped data link
to their email address. Download has to performed within 48 hrs. of receiving the link.

Important Links(follow up)
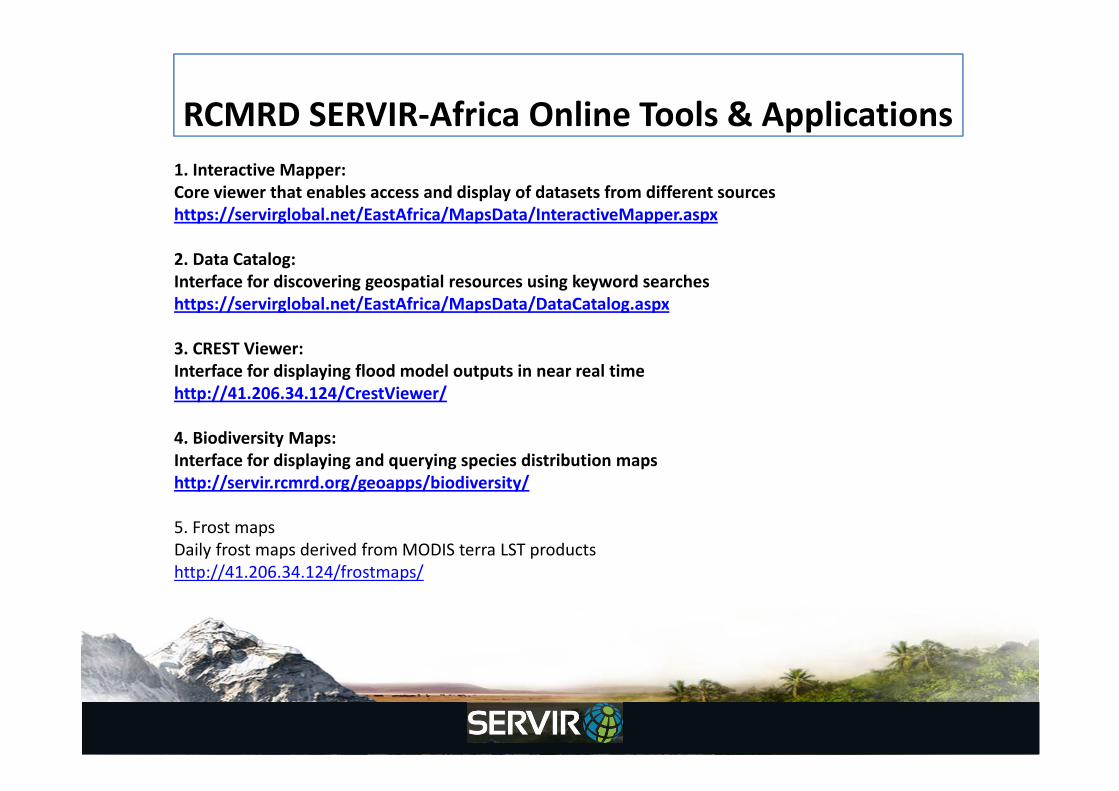
RCMRD SERVIR‐Africa Online Tools & Applications1. Interactive Mapper:Core viewer that enables access and display of datasets from different sourceshttps://servirglobal.net/EastAfrica/MapsData/InteractiveMapper.aspx
2. Data Catalog:Interface for discovering geospatial resources using keyword searcheshttps://servirglobal.net/EastAfrica/MapsData/DataCatalog.aspx
3. CREST Viewer:Interface for displaying flood model outputs in near real timehttp://41.206.34.124/CrestViewer/
4. Biodiversity Maps:Interface for displaying and querying species distribution mapshttp://servir.rcmrd.org/geoapps/biodiversity/
5. Frost mapsDaily frost maps derived from MODIS terra LST productshttp://41.206.34.124/frostmaps/
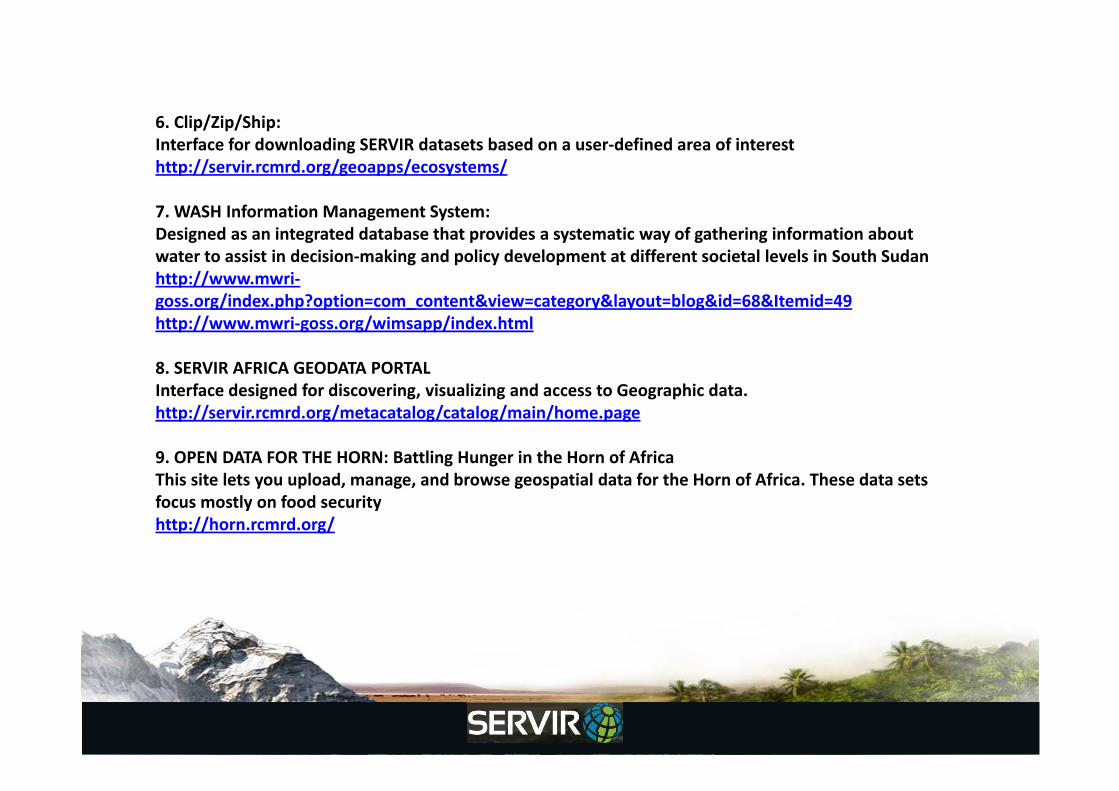
6. Clip/Zip/Ship:Interface for downloading SERVIR datasets based on a user‐defined area of interesthttp://servir.rcmrd.org/geoapps/ecosystems/
7. WASH Information Management System:Designed as an integrated database that provides a systematic way of gathering information about water to assist in decision‐making and policy development at different societal levels in South Sudanhttp://www.mwri‐goss.org/index.php?option=com_content&view=category&layout=blog&id=68&Itemid=49http://www.mwri‐goss.org/wimsapp/index.html
8. SERVIR AFRICA GEODATA PORTALInterface designed for discovering, visualizing and access to Geographic data.http://servir.rcmrd.org/metacatalog/catalog/main/home.page
9. OPEN DATA FOR THE HORN: Battling Hunger in the Horn of AfricaThis site lets you upload, manage, and browse geospatial data for the Horn of Africa. These data sets focus mostly on food securityhttp://horn.rcmrd.org/