
Ravind Kumar, Climate Services Division, Fiji ... · Fiji Ravind Kumar, Climate Services Division,...
1
Fiji Ravind Kumar, Climate Services Division, Fiji Meteorological Service, Private Mail Bag NAP0351, Nadi Airport, Fiji . > contact: Ravind Kumar> phone: +679 6724888> email: [email protected]> web: www.met.gov.fj Climate Trends and Projections in Fiji Introduction The Fiji Group is located in the South Pacific between 12˚S to 21˚S and 176˚E to 178˚W (Figure 1). The group consists of about 322 islands of which about 100 are inhabited and others are native reserves. The two largest islands, Viti Levu and Vanua Levu, make up 87% of the country’s total landmass; the third largest island is Taveuni. These islands are volcanic in origin and have high mountains that have a significant effect on the country’s weather and climate. The people of Fiji are experiencing changes and variability in their climate and extremes events such as tropical cyclone, floods and droughts that are affecting their environment, culture and livelihoods. Observed climate The main climatological features that affect Fiji are the South Pacific Convergence Zone (SPCZ) and Trade Winds. Fiji’s climate varies considerably from year to year with much of the variability associated with the El Niño Southern Oscillation (ENSO). The country has distinct wet (November to April) and dry (May to October) seasons and pronounced wet (southeast) and dry (northwest) zones (larger islands only). Changes in the mean air temperature from season to season are relatively small and strongly related to changes in the surrounding ocean temperature. The seasonal cycle in rainfall is strongly affected by the SPCZ which is most intense during the wet season and weakest in the dry season. The annual mean air temperatures at Nadi Airport and Suva (Laucala Bay) have increased significantly during the 1950 to 2009 period (Figures 1a & 1b), with maximum temperatures warming faster than minimum temperatures. However, no significant trends are evident in annual (Figures 1c &1d) or seasonal rainfall at these locations. Climate projections Climate models Global Climate Models (GCM) have varying spatial resolutions and have different skills in reproducing regional climate. From the 24 GCMs taking part in the Coupled Model Inter-comparison Project 3 (CMIP3 – used in IPCC AR4), a subset of 18 models have been selected based on their ability to realistically simulate important features of current climate across the western Pacific. Projections are derived from these models for three emission scenarios, B1 (low), A1B (medium) and A2 (high) for three 20 year periods (centered on 2030, 2055 and 2090 relative to 1990) (Figure 3). These projections provide an average change over the broad geographic region encompassing Fiji and the surrounding ocean. A level of confidence associated with a given projection is described as very high, high, moderate, low and very low with a mean change (± 2 inter-modal standard deviation) across the selected climate models for B1 (blue), A1B (green) and A2 (red) scenarios. These confidence levels are based on expert judgment considering a number of factors including: climate model agreement, ability of models to simulate relevant processes, historical changes and theoretical considerations. Summary of projections Over the course of the 21 st century: • Surface mean air temperature and sea surface temperature (Figure 4) are projected to continue to increase (very high confidence); •The intensity and frequency of extreme hot days are projected to increase (very high confidence); • Intensity and frequency of extreme rainfall are projected to increase (high confidence); • Mean sea level is projected to continue to rise (Figure 6) (very high confidence); • Ocean acidification is projected to continue (very high confidence); • Dry season rainfall is projected to decrease while wet season rainfall is projected to increase (moderate confidence); • Tropical cyclone numbers are projected to decrease in frequency and increase in proportion of more intense storms (moderate confidence). Figure 3: Atmospheric concentrations of carbon dioxide (CO 2 ) for the three emissions scenarios. Figure 6: Observed and projected relative sea-level change near Fiji. The observed in situ relative sea-level records from Suva (since the early 1970s) and Lautoka (since 1992) are indicated in blue, satellite record (since 1993) in green and the gridded sea level (since 1950, Church and White (2011)) in red. The projections for the A1B scenario (5–95% uncertainty range) are shown by the shaded region from 1990–2100. Vertical bars indicate range of change by 2100. The dashed lines are an estimate of inter-annual variability in sea level above or below longer-term averages (PCCSP, Vol .2, 2011). Figure 1: The Fiji Islands (www.eckert.id.au/images/fiji-map.gif). Figure 4: Observed historical (HadSST2) and simulated historical and future change in annual mean sea surface temperature in the region surrounding Fiji, for the CMIP3 models (with 20-yr running average). Multi-model average projections are shown for B1 (blue line), A1B (green line) and A2 (red line) emission scenarios. Coloured envelopes indicate the spread in projections associated with the different models (2 standard deviations). Figure 5: Major flooding in January 2012, Ba Town, Fiji Met. Service, 2012. Figures 1a & 1b above and figures 1c & 1d below: Annual mean air temperature and rainfall for Nadi and Suva (Laucala Bay). Light blue bars indicate El Niño, dark blue bars La Niña and grey bars indicate neutral years (PCCSP, Vol .2, 2011). !"#$%& () !"#$%& (* !"#$%& (+ !"#$%& (, Impacts of changing climate A sea level rise of 50cm will have far reaching impacts on coastal ecosystems such as accelerated coastal erosion, salt water intrusion into the fresh water lens and ground aquifers, increased sea flooding, loss of arable land and settlement, etc. The combination of sea level rise, high intensity rainfall and stronger tropical cyclones would further exacerbate the vulnerability of communities, which are exposed to more frequent coastal flooding, storm surge and strong winds. Projections suggest that aragonite saturation may fall below 3.5 in next few decades. This seems to be an important threshold below which many coral species become highly vulnerable. This could have negative impacts on the whole coral reef ecosystem, may worsen the effect of coral bleaching and lead to loss of habitat. This will affect local fisheries and could make tourism activities unattractive. The combination of change in rainfall and increase in surface air temperature will have a compounding effects on agricultural production and may become a threat to food security, water resources and human health. For instance, an increase in extreme hot days would have negative effects on health of young children and elderly people. For sector specific impacts, please contact Fiji Meteorological Service. Acknowledgement: Materials in this presentation are obtained from BoM and CSIRO (2011) Climate Change in the Pacific: Scientific Assessment and New Research (Vol. 2: Country Reports) produced by the Pacific Climate Change Science Program.
-
Upload
truongdiep -
Category
Documents
-
view
224 -
download
0
Transcript of Ravind Kumar, Climate Services Division, Fiji ... · Fiji Ravind Kumar, Climate Services Division,...
Fiji Ravind Kumar, Climate Services Division, Fiji Meteorological Service, Private Mail Bag NAP0351, Nadi Airport, Fiji .
> contact: Ravind Kumar> phone: +679 6724888> email: [email protected]> web: www.met.gov.fj
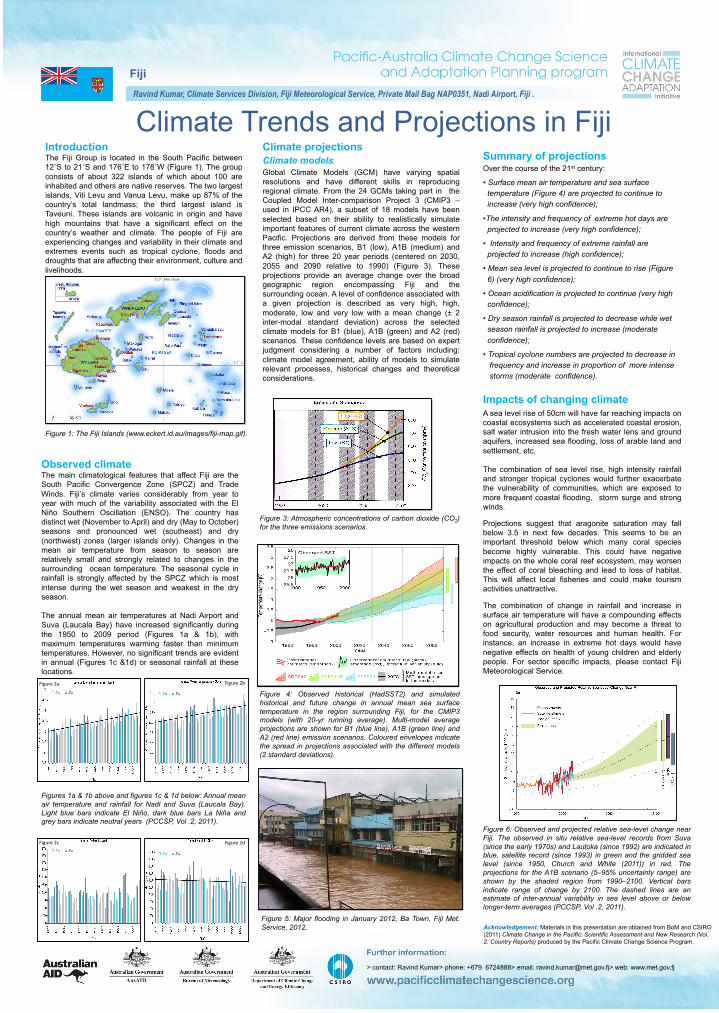
Climate Trends and Projections in Fiji Introduction The Fiji Group is located in the South Pacific between 12˚S to 21˚S and 176˚E to 178˚W (Figure 1). The group consists of about 322 islands of which about 100 are inhabited and others are native reserves. The two largest islands, Viti Levu and Vanua Levu, make up 87% of the country’s total landmass; the third largest island is Taveuni. These islands are volcanic in origin and have high mountains that have a significant effect on the country’s weather and climate. The people of Fiji are experiencing changes and variability in their climate and extremes events such as tropical cyclone, floods and droughts that are affecting their environment, culture and livelihoods.
Observed climate The main climatological features that affect Fiji are the South Pacific Convergence Zone (SPCZ) and Trade Winds. Fiji’s climate varies considerably from year to year with much of the variability associated with the El Niño Southern Oscillation (ENSO). The country has distinct wet (November to April) and dry (May to October) seasons and pronounced wet (southeast) and dry (northwest) zones (larger islands only). Changes in the mean air temperature from season to season are relatively small and strongly related to changes in the surrounding ocean temperature. The seasonal cycle in rainfall is strongly affected by the SPCZ which is most intense during the wet season and weakest in the dry season.
The annual mean air temperatures at Nadi Airport and Suva (Laucala Bay) have increased significantly during the 1950 to 2009 period (Figures 1a & 1b), with maximum temperatures warming faster than minimum temperatures. However, no significant trends are evident in annual (Figures 1c &1d) or seasonal rainfall at these locations.
Climate projections Climate models Global Climate Models (GCM) have varying spatial resolutions and have different skills in reproducing regional climate. From the 24 GCMs taking part in the Coupled Model Inter-comparison Project 3 (CMIP3 – used in IPCC AR4), a subset of 18 models have been selected based on their ability to realistically simulate important features of current climate across the western Pacific. Projections are derived from these models for three emission scenarios, B1 (low), A1B (medium) and A2 (high) for three 20 year periods (centered on 2030, 2055 and 2090 relative to 1990) (Figure 3). These projections provide an average change over the broad geographic region encompassing Fiji and the surrounding ocean. A level of confidence associated with a given projection is described as very high, high, moderate, low and very low with a mean change (± 2 inter-modal standard deviation) across the selected climate models for B1 (blue), A1B (green) and A2 (red) scenarios. These confidence levels are based on expert judgment considering a number of factors including: climate model agreement, ability of models to simulate relevant processes, historical changes and theoretical considerations.
Summary of projections Over the course of the 21st century:
• Surface mean air temperature and sea surface temperature (Figure 4) are projected to continue to increase (very high confidence);
• The intensity and frequency of extreme hot days are projected to increase (very high confidence);
• Intensity and frequency of extreme rainfall are projected to increase (high confidence);
• Mean sea level is projected to continue to rise (Figure 6) (very high confidence);
• Ocean acidification is projected to continue (very high confidence);
• Dry season rainfall is projected to decrease while wet season rainfall is projected to increase (moderate confidence);
• Tropical cyclone numbers are projected to decrease in frequency and increase in proportion of more intense storms (moderate confidence).
Figure 3: Atmospheric concentrations of carbon dioxide (CO2) for the three emissions scenarios.
Figure 6: Observed and projected relative sea-level change near Fiji. The observed in situ relative sea-level records from Suva (since the early 1970s) and Lautoka (since 1992) are indicated in blue, satellite record (since 1993) in green and the gridded sea level (since 1950, Church and White (2011)) in red. The projections for the A1B scenario (5–95% uncertainty range) are shown by the shaded region from 1990–2100. Vertical bars indicate range of change by 2100. The dashed lines are an estimate of inter-annual variability in sea level above or below longer-term averages (PCCSP, Vol .2, 2011).
Figure 1: The Fiji Islands (www.eckert.id.au/images/fiji-map.gif).
Figure 4: Observed historical (HadSST2) and simulated historical and future change in annual mean sea surface temperature in the region surrounding Fiji, for the CMIP3 models (with 20-yr running average). Multi-model average projections are shown for B1 (blue line), A1B (green line) and A2 (red line) emission scenarios. Coloured envelopes indicate the spread in projections associated with the different models (2 standard deviations).
Figure 5: Major flooding in January 2012, Ba Town, Fiji Met. Service, 2012.
Figures 1a & 1b above and figures 1c & 1d below: Annual mean air temperature and rainfall for Nadi and Suva (Laucala Bay). Light blue bars indicate El Niño, dark blue bars La Niña and grey bars indicate neutral years (PCCSP, Vol .2, 2011).
!"#$%&'()' !"#$%&'(*'
!"#$%&'(+' !"#$%&'(,'
Impacts of changing climate A sea level rise of 50cm will have far reaching impacts on coastal ecosystems such as accelerated coastal erosion, salt water intrusion into the fresh water lens and ground aquifers, increased sea flooding, loss of arable land and settlement, etc.
The combination of sea level rise, high intensity rainfall and stronger tropical cyclones would further exacerbate the vulnerability of communities, which are exposed to more frequent coastal flooding, storm surge and strong winds.
Projections suggest that aragonite saturation may fall below 3.5 in next few decades. This seems to be an important threshold below which many coral species become highly vulnerable. This could have negative impacts on the whole coral reef ecosystem, may worsen the effect of coral bleaching and lead to loss of habitat. This will affect local fisheries and could make tourism activities unattractive.
The combination of change in rainfall and increase in surface air temperature will have a compounding effects on agricultural production and may become a threat to food security, water resources and human health. For instance, an increase in extreme hot days would have negative effects on health of young children and elderly people. For sector specific impacts, please contact Fiji Meteorological Service.
Acknowledgement: Materials in this presentation are obtained from BoM and CSIRO (2011) Climate Change in the Pacific: Scientific Assessment and New Research (Vol. 2: Country Reports) produced by the Pacific Climate Change Science Program.