
Kumar, Deo and Ramachamdran - 2006 - Total Rain Accumulation and Rain Rate Analysis for Small...
6
ATMOSPHERIC SCIENCE LETTERS Atmos. Sci. Let. 7: 53– 58 (2006) Published online 9 August 2006 in Wiley InterScience (www.interscience.wiley.com) DOI: 10.1002/asl.131 Total rain accumulation and rain-rate analysis for small tropical Pacific islands: a case study of Suva, Fiji Vickal V. Kumar,* Ravinesh C. Deo and Visagaperuman Ramachandran School of Engineering and Physics, Faculty of Science and Technology, The University of the South Pacific, Suva Fiji *Correspondence to: Vickal V. Kumar, School of Engineering and Physics, Faculty of Science and Technology, The University of the South Pacific, Suva Fiji. E-mail: kumar [email protected] Received: 28 February 2006 Revised: 15 June 2006 Accepted: 16 June 2006 Abstract Rain-rate analyses using hourly data from 1990 to 2002 predict rain occurrence for ∼15% of the year while minute data for the period Apr ‘02–Mar ‘03 resolve rain-rate more accurately and show rain occurrence of ∼2% of the year. It is estimated that <1% of the rain at the site is mainl y convec tive. Rainfall analysis confirms its depend ence on El Ni ˜ no South ern Oscillation and convergence zones. Copyright 2006 Royal Meteorological Society Keywords: rain- rate exceedance; El Ni ˜ no Southern Oscillation; rainfall structure; tropical region 1. Intr oduc tion Rainfall is an import ant comp onent of the gl obal hydr ol ogical cycl e, which is a ke y enti ty to dr ive ene rgy cir cul ati on in the atmosp her e. Rai nfa ll is a highl y variab le parameter, both in terms of location and time (includes diurnal, seasonal and yearly vari- ations). The landmass of Pacific islands is predo mi- nately small, hen ce the moist air circul ati on arising from oceans may significantly affect rainfall patterns. Obv iou sly, an und ers tanding of lon g-t erm cli mat e dynamics becomes necessary to inve stigate cumu la- tive rainfall occurren ces. The varia tion s in the rainfall fields of small tropical Pacific islands are due to the dynamic nature of the inter-tropical convergence zone (ITCZ), lying typically at about 5 ◦ N, and the South Pac ific con ver gen ce zone (SPCZ) , whi ch str etc hes in an eas t-s out hea ste rly dir ect ion from Papua New Guinea to Samoa (Basher and Zheng, 1998). Owing to the zonal and meridional shifts in the positions of the convergence zones seasonally, there appears to be an interannual variation of rainfall across the region. Together with the movement of the convergence zones, it has been established that El Ni˜ no Southern Oscil- latio n (ENSO) also contr ibut es signi ficantl y towar ds rainfall variability in small tropical countries (Nicholls and Wong, 1990). Dur ing an ENS O eve nt, the per iod s of hig h tem- perature departures from the normal are called the El Ni ˜ no (wi th genera lly hig h neg ati ve SOI ), whi le the opposite phase is termed La Ni ˜ na (with generally high positive SOI). Driven by the weakening of the east- erly trade winds during a typical El Ni ˜ no event and the shift of the SPCZ eastward, there is an eastward shift in convection, causing the Fiji Islands to experi- ence reduced rainfall. The delay between the onset of an ENSO event and the impact on the climate of Fiji depends on when the SPCZ begins to shift eastward. It is well known that many islands of the southwest Pacific (including Fiji Islands) suffered drought during the 1997– 199 8 El Ni ˜ no event (NIWA Climate Update, 2002). The typical climate anomaly for Fiji during an El Ni˜ no event is for drier and hotter conditions during the wet and hot perio d, parti cular ly from December to February, and drier and cooler conditions in the cool and dry period, particularly between June and August. Moderate to strong ENSO events are reported to have significant impact on the rainfall at Nadi (western Fiji) leading to severe drought conditions while its effect is rather mild at Suva (eastern-central Fiji) (Mataki et al., 2006). In other words, the twin cyclonic vortexes gen- erated by the effect of Madden–Julian Oscillation and the reversal of trade winds could contribute substan- tially to intense rainfall events during April–June in non-ENSO years. In addition to affecting total annual rainfall, it may als o aff ect the rai n-rates. The rai n-r ate pla ys a vit al role for a wi de vari et y of appl ications of regi onal int erest, ran gin g from soi l erosio n to rad io commu- nicat ion. In fact, rain-rate measurements assis t com- munication scientists to estimate signal fading and its statistics (Bryant et al., 2001; Kumar and Ramachan- dran, 2004). The region is often prone to flash floods wich are primarily dependent on rain-rates rather than total rainfall accumulation. Rain-rate analysis is best represented by the cumulative probability distribution or exceedance curves. The exceedance of a particular rai n-r ate is comput ed as the percentage of the time, usually of the year, that a given rain-rate is exceeded. Inter national coll aborative efforts, such as the tropi - cal rainfall measuring mission (TRMM) precipitation radar (PR), have shown that the rain structure in the tropics is a combination of stratiform and convective Copyright 2006 Royal Meteorological Society
-
Upload
dr-ravinesh-c-deo -
Category
Documents
-
view
215 -
download
0
Transcript of Kumar, Deo and Ramachamdran - 2006 - Total Rain Accumulation and Rain Rate Analysis for Small...

7/31/2019 Kumar, Deo and Ramachamdran - 2006 - Total Rain Accumulation and Rain Rate Analysis for Small Pacific Islands…
http://slidepdf.com/reader/full/kumar-deo-and-ramachamdran-2006-total-rain-accumulation-and-rain-rate 1/6
ATMOSPHERIC SCIENCE LETTERS
Atmos. Sci. Let. 7: 53– 58 (2006)
Published online 9 August 2006 in Wiley InterScience
(www.interscience.wiley.com) DOI: 10.1002/asl.131
Total rain accumulation and rain-rate analysis for smalltropical Pacific islands: a case study of Suva, Fiji
Vickal V. Kumar,* Ravinesh C. Deo and Visagaperuman RamachandranSchool of Engineering and Physics, Faculty of Science and Technology, The University of the South Pacific, Suva Fiji
*Correspondence to:Vickal V. Kumar, School of Engineering and Physics, Faculty of Science and Technology, TheUniversity of the South Pacific,Suva Fiji.E-mail: kumar [email protected]
Received: 28 February 2006
Revised: 15 June 2006
Accepted: 16 June 2006
Abstract
Rain-rate analyses using hourly data from 1990 to 2002 predict rain occurrence for ∼15% of
the year while minute data for the period Apr ‘02–Mar ‘03 resolve rain-rate more accurately
and show rain occurrence of ∼2% of the year. It is estimated that <1% of the rain at the
site is mainly convective. Rainfall analysis confirms its dependence on El Ni ˜ no Southern
Oscillation and convergence zones. Copyright 2006 Royal Meteorological Society
Keywords: rain-rate exceedance; El Ni ˜ no Southern Oscillation; rainfall structure; tropicalregion
1. Introduction
Rainfall is an important component of the globalhydrological cycle, which is a key entity to driveenergy circulation in the atmosphere. Rainfall is ahighly variable parameter, both in terms of locationand time (includes diurnal, seasonal and yearly vari-ations). The landmass of Pacific islands is predomi-nately small, hence the moist air circulation arisingfrom oceans may significantly affect rainfall patterns.Obviously, an understanding of long-term climatedynamics becomes necessary to investigate cumula-tive rainfall occurrences. The variations in the rainfallfields of small tropical Pacific islands are due to thedynamic nature of the inter-tropical convergence zone(ITCZ), lying typically at about 5 ◦N, and the SouthPacific convergence zone (SPCZ), which stretchesin an east-southeasterly direction from Papua NewGuinea to Samoa (Basher and Zheng, 1998). Owingto the zonal and meridional shifts in the positions of
the convergence zones seasonally, there appears to bean interannual variation of rainfall across the region.Together with the movement of the convergence zones,it has been established that El Nino Southern Oscil-lation (ENSO) also contributes significantly towardsrainfall variability in small tropical countries (Nichollsand Wong, 1990).
During an ENSO event, the periods of high tem-perature departures from the normal are called the ElNino (with generally high negative SOI), while theopposite phase is termed La Nina (with generally highpositive SOI). Driven by the weakening of the east-
erly trade winds during a typical El Nino event andthe shift of the SPCZ eastward, there is an eastwardshift in convection, causing the Fiji Islands to experi-ence reduced rainfall. The delay between the onset of an ENSO event and the impact on the climate of Fiji
depends on when the SPCZ begins to shift eastward.
It is well known that many islands of the southwest
Pacific (including Fiji Islands) suffered drought during
the 1997– 1998 El Nino event (NIWA Climate Update,
2002). The typical climate anomaly for Fiji during an
El Nino event is for drier and hotter conditions during
the wet and hot period, particularly from December to
February, and drier and cooler conditions in the cool
and dry period, particularly between June and August.
Moderate to strong ENSO events are reported to have
significant impact on the rainfall at Nadi (western Fiji)
leading to severe drought conditions while its effect is
rather mild at Suva (eastern-central Fiji) (Mataki et al.,
2006). In other words, the twin cyclonic vortexes gen-
erated by the effect of Madden–Julian Oscillation and
the reversal of trade winds could contribute substan-
tially to intense rainfall events during April–June in
non-ENSO years.
In addition to affecting total annual rainfall, it may
also affect the rain-rates. The rain-rate plays a vital
role for a wide variety of applications of regional
interest, ranging from soil erosion to radio commu-
nication. In fact, rain-rate measurements assist com-
munication scientists to estimate signal fading and its
statistics (Bryant et al., 2001; Kumar and Ramachan-
dran, 2004). The region is often prone to flash floods
wich are primarily dependent on rain-rates rather than
total rainfall accumulation. Rain-rate analysis is best
represented by the cumulative probability distribution
or exceedance curves. The exceedance of a particular
rain-rate is computed as the percentage of the time,
usually of the year, that a given rain-rate is exceeded.
International collaborative efforts, such as the tropi-
cal rainfall measuring mission (TRMM) precipitation
radar (PR), have shown that the rain structure in the
tropics is a combination of stratiform and convective
Copyright 2006 Royal Meteorological Society

7/31/2019 Kumar, Deo and Ramachamdran - 2006 - Total Rain Accumulation and Rain Rate Analysis for Small Pacific Islands…
http://slidepdf.com/reader/full/kumar-deo-and-ramachamdran-2006-total-rain-accumulation-and-rain-rate 2/6
54 V. V. Kumar, R. C. Deo and V. Ramachandran
distributions (Houze, 1997). Numerical evidence pro-vided by Schumacher and Houze (2003) shows that25– 80% of rainfall in the tropics indeed has stratiformrain structure. TRMM observations further reportedthat heavy rainfall in the tropics generally has convec-tive structures, surrounded by less intense stratiform
rainfall (Houze, 1997; Schumacher and Houze, 2003).Rainfall due to different structures may also showchanges in their exceedances.
Oceanic precipitation patterns are important since∼70% of the earth’s surface is covered by oceanand such studies are of significance to global climatechange experts. Owing to the scarcity of ground-baseddata, remote sensing data are often used for moni-toring precipitation. Meteorological data are normallycollected at hourly intervals using conventional raingauges. Reports published using these data seldomfocus on rain-rate distribution and associated changes
in rainfall structure. In this article, we present a moresystematic study using long-term rain gauge data forSuva (Lat.: 18.08 ◦S, Long.: 178.45 ◦E), Fiji. Suva islocated on the southeastern part of Fiji’s main island,Viti Levu (Figure 1) and the main measurement sitewas about 1 km from the coastline. By location, therainfall at Suva is strongly affected by the southeast-erly trade winds. Hence, this southeastern part of Fiji’smain island remains cool and wet while the west-ern parts are mostly dry. From the meteorologicalrecords of Fiji, it is seen Suva has one of the high-est rainfall accumulations. The general climatologyof the Fiji Islands encompasses distinct wet (Novem-
ber– April) and dry (May– October) seasons (Kumarand Ramachandran, 2004). Lightning studies basedon remote sensing by the Lightning Imaging Sensoraboard the TRMM satellite and ground-based sensornetwork also show marked difference in the activityfor the two seasons (Ramachandran et al., 2005).
In this article, a 13-year average hourly rainfalldata is analyzed to study the diurnal, monthly and
annual variation of total rain accumulations. Suchstudies are useful in determining the temporal rainfalldistribution, and to quantify how rainfall patterns aredependent on various natural hydrological processes,ranging from the daily convectional cycles to long-term ENSO effects. Rain-rate analysis for a 13-year
period is conducted to investigate changes in rainstructure (if any) for the dry and the wet season. Therain-rates are also analyzed separately for the El Ninoand La Nina years. To determine the fine variationsin rain-rates, supplementary rainfall data from April2002–March 2003 (1 year), with an integration timeof 1 min, is also presented.
2. Total rain accumulation
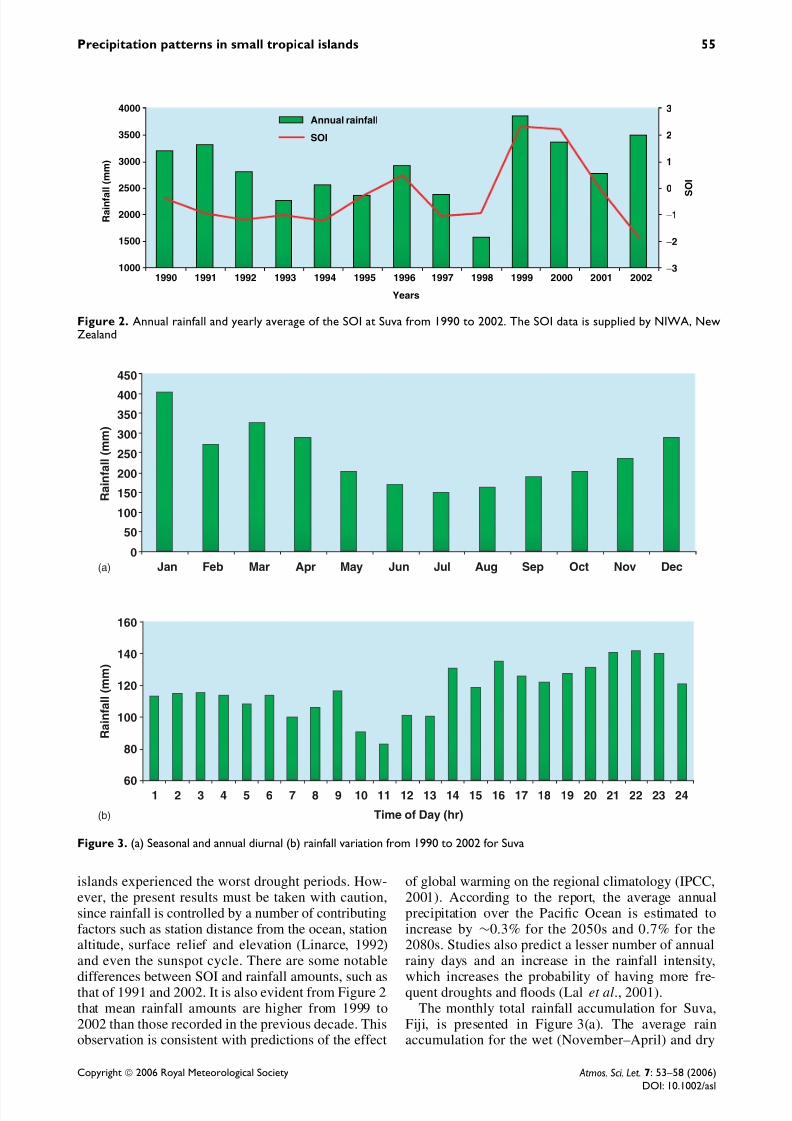
Figure 2 presents the total annual rainfall accumula-
tion for Suva, Fiji, and the corresponding SOI from1990 to 2002. Note that SOI is derived from mean sealevel pressure, measured at Tahiti and Darwin, which,in principle, represents a particular ENSO event.
The cumulative rainfall shows distinct interan-nual variations, with an average annual rainfall of ∼2804 mm. As clearly evident, the years 1993 and1998 had significantly low rainfall relative to otheryears. Correspondingly, the SOI values are highlynegative, indicating the possible influence of an ElNino event. On closer examination, there appears tobe a correlation between measured annual rainfall andSOI. It becomes obvious that years that have negative
SOI have experienced generally low rainfall (and peri-ods of droughts) than the years with highly positiveSOI (1996 and 1999– 2000). Supplementary climaterecords from Fiji Meteorological Services support thefact that the years 1996 and 1999–2000 experiencedoccasional flooding, and were classified as years of significant La Nina effects. The years with momentousEl Nino effects were 1993 and 1998, in which the Fiji
(a) (b)
Figure 1. A geographical map, showing (a) the Fiji Islands located in the South Pacific region, (b) the present measurement site,Suva, Fiji. Source: http://www.nationalgeographic.com/xpeditions/
Copyright 2006 Royal Meteorological Society Atmos. Sci. Let. 7: 53–58 (2006)
DOI: 10.1002/asl
7/31/2019 Kumar, Deo and Ramachamdran - 2006 - Total Rain Accumulation and Rain Rate Analysis for Small Pacific Islands…
http://slidepdf.com/reader/full/kumar-deo-and-ramachamdran-2006-total-rain-accumulation-and-rain-rate 3/6
Precipitation patterns in small tropical islands 55
Annual rainfall
SOI
1990
4000 3
2
1
0
−1
−2
−3
3500
3000
2500
R a i n f a
l l ( m m )
2000
1500
10001991 1992 1993 1994 1995 1996
Years
S O I
1997 1998 1999 2000 2001 2002
Figure 2. Annual rainfall and yearly average of the SOI at Suva from 1990 to 2002. The SOI data is supplied by NIWA, NewZealand
Jan Feb Mar Apr May Jun Jul Aug Sep Oct Nov Dec(a)
60
80
100
120
140
160
1 2 3 4 5 6 7 8 9 10 11 12 13 14 15 16 17 18 19 20 21 22 23 24
Time of Day (hr)
R a i n f a l l ( m m )
0
50
100
150
200
250
300
350
400
450
R a i n f a l l ( m m )
(b)
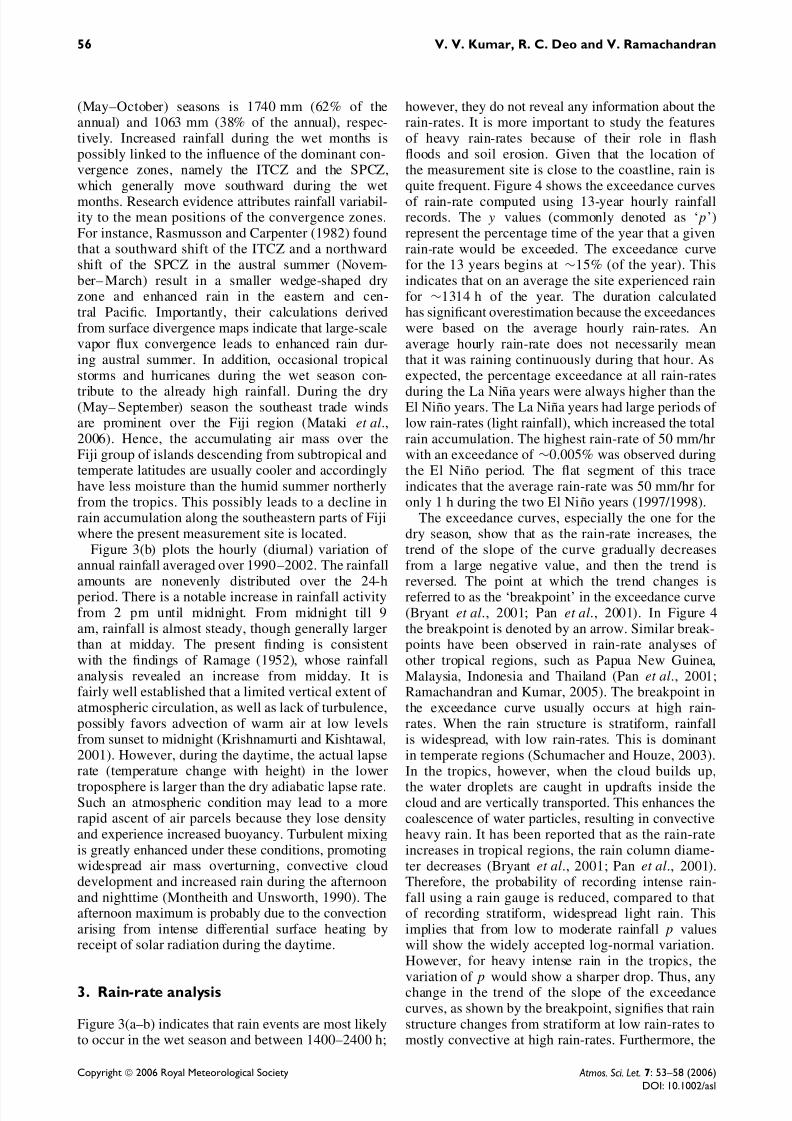
Figure 3. (a) Seasonal and annual diurnal (b) rainfall variation from 1990 to 2002 for Suva
islands experienced the worst drought periods. How-ever, the present results must be taken with caution,since rainfall is controlled by a number of contributingfactors such as station distance from the ocean, stationaltitude, surface relief and elevation (Linarce, 1992)and even the sunspot cycle. There are some notable
differences between SOI and rainfall amounts, such asthat of 1991 and 2002. It is also evident from Figure 2that mean rainfall amounts are higher from 1999 to2002 than those recorded in the previous decade. Thisobservation is consistent with predictions of the effect
of global warming on the regional climatology (IPCC,2001). According to the report, the average annualprecipitation over the Pacific Ocean is estimated toincrease by ∼0.3% for the 2050s and 0.7% for the2080s. Studies also predict a lesser number of annualrainy days and an increase in the rainfall intensity,
which increases the probability of having more fre-quent droughts and floods (Lal et al., 2001).The monthly total rainfall accumulation for Suva,
Fiji, is presented in Figure 3(a). The average rainaccumulation for the wet (November–April) and dry
Copyright 2006 Royal Meteorological Society Atmos. Sci. Let. 7: 53–58 (2006)
DOI: 10.1002/asl
7/31/2019 Kumar, Deo and Ramachamdran - 2006 - Total Rain Accumulation and Rain Rate Analysis for Small Pacific Islands…
http://slidepdf.com/reader/full/kumar-deo-and-ramachamdran-2006-total-rain-accumulation-and-rain-rate 4/6
56 V. V. Kumar, R. C. Deo and V. Ramachandran
(May–October) seasons is 1740 mm (62% of theannual) and 1063 mm (38% of the annual), respec-tively. Increased rainfall during the wet months ispossibly linked to the influence of the dominant con-vergence zones, namely the ITCZ and the SPCZ,which generally move southward during the wetmonths. Research evidence attributes rainfall variabil-ity to the mean positions of the convergence zones.For instance, Rasmusson and Carpenter (1982) foundthat a southward shift of the ITCZ and a northwardshift of the SPCZ in the austral summer (Novem-ber– March) result in a smaller wedge-shaped dryzone and enhanced rain in the eastern and cen-tral Pacific. Importantly, their calculations derivedfrom surface divergence maps indicate that large-scalevapor flux convergence leads to enhanced rain dur-ing austral summer. In addition, occasional tropicalstorms and hurricanes during the wet season con-
tribute to the already high rainfall. During the dry(May– September) season the southeast trade windsare prominent over the Fiji region (Mataki et al.,2006). Hence, the accumulating air mass over theFiji group of islands descending from subtropical andtemperate latitudes are usually cooler and accordinglyhave less moisture than the humid summer northerlyfrom the tropics. This possibly leads to a decline inrain accumulation along the southeastern parts of Fijiwhere the present measurement site is located.
Figure 3(b) plots the hourly (diurnal) variation of annual rainfall averaged over 1990 –2002. The rainfallamounts are nonevenly distributed over the 24-hperiod. There is a notable increase in rainfall activityfrom 2 pm until midnight. From midnight till 9am, rainfall is almost steady, though generally largerthan at midday. The present finding is consistentwith the findings of Ramage (1952), whose rainfallanalysis revealed an increase from midday. It isfairly well established that a limited vertical extent of atmospheric circulation, as well as lack of turbulence,possibly favors advection of warm air at low levelsfrom sunset to midnight (Krishnamurti and Kishtawal,2001). However, during the daytime, the actual lapserate (temperature change with height) in the lower
troposphere is larger than the dry adiabatic lapse rate.Such an atmospheric condition may lead to a morerapid ascent of air parcels because they lose densityand experience increased buoyancy. Turbulent mixingis greatly enhanced under these conditions, promotingwidespread air mass overturning, convective clouddevelopment and increased rain during the afternoonand nighttime (Montheith and Unsworth, 1990). Theafternoon maximum is probably due to the convectionarising from intense differential surface heating byreceipt of solar radiation during the daytime.
3. Rain-rate analysis
Figure 3(a–b) indicates that rain events are most likelyto occur in the wet season and between 1400–2400 h;
however, they do not reveal any information about therain-rates. It is more important to study the featuresof heavy rain-rates because of their role in flashfloods and soil erosion. Given that the location of the measurement site is close to the coastline, rain isquite frequent. Figure 4 shows the exceedance curvesof rain-rate computed using 13-year hourly rainfallrecords. The y values (commonly denoted as ‘ p’)represent the percentage time of the year that a givenrain-rate would be exceeded. The exceedance curvefor the 13 years begins at ∼15% (of the year). Thisindicates that on an average the site experienced rainfor ∼1314 h of the year. The duration calculatedhas significant overestimation because the exceedanceswere based on the average hourly rain-rates. Anaverage hourly rain-rate does not necessarily meanthat it was raining continuously during that hour. Asexpected, the percentage exceedance at all rain-rates
during the La Nina years were always higher than theEl Nino years. The La Nina years had large periods of low rain-rates (light rainfall), which increased the totalrain accumulation. The highest rain-rate of 50 mm/hrwith an exceedance of ∼0.005% was observed duringthe El Nino period. The flat segment of this traceindicates that the average rain-rate was 50 mm/hr foronly 1 h during the two El Nino years (1997/1998).
The exceedance curves, especially the one for thedry season, show that as the rain-rate increases, thetrend of the slope of the curve gradually decreasesfrom a large negative value, and then the trend isreversed. The point at which the trend changes isreferred to as the ‘breakpoint’ in the exceedance curve(Bryant et al., 2001; Pan et al., 2001). In Figure 4the breakpoint is denoted by an arrow. Similar break-points have been observed in rain-rate analyses of other tropical regions, such as Papua New Guinea,Malaysia, Indonesia and Thailand (Pan et al., 2001;Ramachandran and Kumar, 2005). The breakpoint inthe exceedance curve usually occurs at high rain-rates. When the rain structure is stratiform, rainfallis widespread, with low rain-rates. This is dominantin temperate regions (Schumacher and Houze, 2003).In the tropics, however, when the cloud builds up,
the water droplets are caught in updrafts inside thecloud and are vertically transported. This enhances thecoalescence of water particles, resulting in convectiveheavy rain. It has been reported that as the rain-rateincreases in tropical regions, the rain column diame-ter decreases (Bryant et al., 2001; Pan et al., 2001).Therefore, the probability of recording intense rain-fall using a rain gauge is reduced, compared to thatof recording stratiform, widespread light rain. Thisimplies that from low to moderate rainfall p valueswill show the widely accepted log-normal variation.However, for heavy intense rain in the tropics, the
variation of p would show a sharper drop. Thus, anychange in the trend of the slope of the exceedancecurves, as shown by the breakpoint, signifies that rainstructure changes from stratiform at low rain-rates tomostly convective at high rain-rates. Furthermore, the
Copyright 2006 Royal Meteorological Society Atmos. Sci. Let. 7: 53–58 (2006)
DOI: 10.1002/asl

7/31/2019 Kumar, Deo and Ramachamdran - 2006 - Total Rain Accumulation and Rain Rate Analysis for Small Pacific Islands…
http://slidepdf.com/reader/full/kumar-deo-and-ramachamdran-2006-total-rain-accumulation-and-rain-rate 5/6
Precipitation patterns in small tropical islands 57
0.001
0.01
0.1
1
10
100
0 10 20 30 40 50 60 70
Rain-rate (mm/hr)
T i m e e x c e e d a n c e o f a y e a r , p ( % )
Dry Season Average (1990 - 2002)
Wet Season Average (1990-2002)
Average of El Niño yearsAverage of La Niña years
13 year (1990 - 2002) average
Figure 4. Rain-rate exceedance curves for Suva, derived using hourly rain-rate measurements for 1990–2002
0.0001
0.001
0.01
0.1
1
10
0 0.2 0.4 0.6 0.8 1.21 1.4 1.6 1.8 2.22 2.4 2.6
Rain-rate (mm/min)
T i m e e x c e e d a n c e o f a y e a r , p ( % )
Dry Season
Wet Season
Cumulative Apr02-Mar03
Figure 5. Rain-rate exceedance curves for Suva, derived using minute rain-rate measurements from April 2002 to March 2003
exceedance curves show that the wet seasons have
higher rain exceedance and relatively high rain-rates
when compared with dry seasons. However, the break-
point appears to be more evident for dry season com-
pared to the wet. This may be attributed to the fact that
the increased surface temperature favors the formation
of convective cells.
The maximum average rain-rate for the 13-year
period was found to be 70 mm/h with corresponding
exceedance at 0.004%, indicating that on an average,
for ∼0.35 h in a year, the site received 70 mm/hr
rain. In the tropics, heavy rain-rates that are generally
due to convective rain structures are often shortlived.
By undertaking measurements at hourly intervals, the
presence of heavy rainfall due to convective rain struc-
tures was possibly absorbed by the cumulative effect
when averaged over an hour. If the rain-rate occur-
rences and structures were to be determined more
precisely, integration time ought to be reduced. There-
fore, to understand the fine structure of rainfall, 1-year
(April 2002 to March 2003) rain data was measured
with 1-min integration time and plotted, as seen in
Figure 5. For these measurements, a tipping bucket
arrangement of diameter 20-cm with a calibration of
0.2-mm per tip was interfaced with a programmable
data logger, which recorded the tipping time-step at an
accuracy of 0.1 s. The cumulative plot more accurately
indicates that the site experiences rain for ∼1.5% of
Copyright 2006 Royal Meteorological Society Atmos. Sci. Let. 7: 53–58 (2006)
DOI: 10.1002/asl
7/31/2019 Kumar, Deo and Ramachamdran - 2006 - Total Rain Accumulation and Rain Rate Analysis for Small Pacific Islands…
http://slidepdf.com/reader/full/kumar-deo-and-ramachamdran-2006-total-rain-accumulation-and-rain-rate 6/6
58 V. V. Kumar, R. C. Deo and V. Ramachandran
the year (∼130 h), which is significantly lower thanthat computed from Figure 4 using the hourly rainfall.The convective rain structure becomes dominant after∼2.2 mm/min rain-rate, which is the breakpoint rain-rate with exceedance ∼0.006%. This indicates that lessthan 1% of the total rain at the measurement site ismainly convective. This may be due to the physicalsize of the island and the close proximity of the site tothe ocean. Similar to the 13-year cumulative curves,the wet month has high rain exceedance, while thebreakpoint is more pronounced for the dry months andfor rain-rates greater than that at the breakpoint, theexceedance curve shows an asymptotically decreasingtrend, indicating saturation of rain at the measurementsite.
4. Conclusions
The maximum in SOI, of ∼+2.8 and annual rainfall of 3500 mm, occurred in 1999. In 1993 and 1998 the SOIvalues were low, ∼−1, and Fiji experienced droughtduring these years. All the months have an average rainaccumulation greater then 150 mm, with 62% of thetotal rainfall occurring during the wet season. Averagediurnal variation of the annual rainfall is found tobe smallest (84 mm) between 10 am and 1 pm. Therainfall tends to be high from 2 pm to midnight, with a
maximum of 140 mm occurring around 10 pm. Rain-rate analyses using minute integration provide moreaccurate information about the rain-rate distribution,indicating that the site experiences rain for ∼2% of theyear. The hourly samples overestimate the exceedanceat low rain-rate (15%). The probability of exceedingany given rain-rate was found to be (i) greater duringthe wet season than during the dry season and (ii)greater during La Nina years than during El Ninoyears. A significant feature of the rain-rate exceedancecurve for the region is the presence of the breakpoint,which occurs at high rain-rate. The occurrence of breakpoint signifies that the rain structure changes
gradually, with increasing rain-rate, from stratiformto mostly convective and is more evident during thedry season. The minute samples show a breakpointexceedance of ∼0.006%. This suggests that less than1% of the total rain at the measurement site is mainlyconvective.
Acknowledgements
The authors wish to acknowledge the Fiji Meteorological
Service for providing some data for this article.
References
Basher RE, Zheng X. 1998. Mapping rainfall fields and their ENSO
variations in data-sparse tropical Southwest Pacific Ocean region.
International Journal of Climatology 18: 237–251.
Bryant GH, Adimula I, Riva C, Brussaard G. 2001. Rain attenuation
statistics from rain column diameters and heights. International
Journal of Satellite Communications 19: 263–283.
Houze RA. 1997. Stratiform precipitation in regions of convection: a
meteorological paradox? American Meteorological Society 78(10):
2179–2196.
IPCC Climate Change. 2001. The Scientific Basis. Contribution
of Working Group I to the Third Assessment Report of the
Intergovernmental Panel on Climate Change. Cambridge, New York.
Available from: http://www.ipcc.ch/.
Krishnamurti TN, Kishtawal CM. 2001. Diurnal variation of summer
rainfall over Taiwan and its detection using TRMM observations. Journal of Applied Meteorology 40(3): 331–344.
Kumar V, Ramachandran V. 2004. Rain-attenuation measurement at
11.6 GHz in Suva, Fiji. Electronics Letters 40(22): 1429–1431.
Lal M, Nozawa T, Emori S, Harasawa H, Takahashi K, Kimoto M,
Abe-Ouchi A. 2001. Future climate change, Implication for Indian
summer monsoon and its variability. Current Science 81(9):
1196–1207.
Linarce E. 1992. Climate Data and Resources: A Reference Guide.
Roultage: London.
Mataki M, Koshy KC, Lal M. 2006. Baseline climatology of viti levu
(Fiji) and current climatic trends. Pacific Science 60(1): 49–68.
Montheith JL, Unsworth MH. 1990. Principles of Environmental
Physics, 2nd edn. Edward Arnold: London.
Nicholls N, Wong KK. 1990. Dependence of rainfall variability on
mean rainfall, latitude, and the Southern Oscillation. Journal of Climate 3: 163–170.
NIWA Climate Update. 2002. National Institute of Water and
Atmospheric Research. New Zealand.
Pan QW, Bryant GH, McMahon J, Allnutt JE, Haidara F. 2001. High
elevation angle satellite- to-earth 12GHz propagation measurements
in the tropics. International Journal of Satellite Communications
19(4): 363–384.
Ramachandran V, Kumar V. 2005. Invariance of accumulation time
factor of Ku-band signal in the tropics. Journal of Electromagnetic
Waves and Applications 19(11): 1501–1509.
Ramachandran V, Kumar S, Kishore A. 2005. Remote sensing of
cloud-to-ground lightning location using the TOGA of sferics.
Atmospheric Science Letters 6: 128–132.
Rasmusson EM, Carpenter T. 1982. Variations in tropical sea surface
temperature and surface wind fields associated with the SouthernOscillation/El Nino. Monthly Weather Review 110: 354–384.
Ramage CS. 1952. Variation of rainfall over south China through the
wet season. Bulletin of the American Meteorological Society 33:
308–311.
Schumacher C, Houze RA. 2003. Stratiform rain in the tropics as seen
by the TRMM precipitation radar. American Meteorological Society
16: 1739– 1756.
Copyright 2006 Royal Meteorological Society Atmos. Sci. Let. 7: 53–58 (2006)
DOI: 10.1002/asl