
Rapid Quantification of Perfluorinated Compounds in Drinking and Surface Water Using LC-MS/MS
12
1 / 9 Rapid Quantification of Perfluorinated Compounds in Drinking and Surface Water Using LC-MS/MS Jeremy Post, Christopher Gilles, William Lipps; Shimadzu Scientific Instruments, Columbia, MD
-
Upload
shimadzu-scientific-instruments -
Category
Environment
-
view
563 -
download
2
Transcript of Rapid Quantification of Perfluorinated Compounds in Drinking and Surface Water Using LC-MS/MS
1 / 9 �
Rapid Quantification of Perfluorinated Compounds in Drinking and Surface Water Using LC-MS/MS Jeremy Post, Christopher Gilles, William Lipps; Shimadzu Scientific Instruments, Columbia, MD

2 / 9 �2 / 9 �
Introduction
Perfluorinated compounds (PFCs) are synthetic molecules with carbon chains to which fluorine is bound by high-strength carbon-fluorine covalent bonds. Useful due to their surfactant and hydrophobic physicochemical properties, these materials are used broadly since the 1950s in industrial applications such as the conveyance of stain and stick resistance to a wide variety of materials and products including clothing, cookware, carpet, and food containers. These molecules, now classified as persistent organic pollutants, are highly stable and resistant to biological degradation, therefore they persist in the environment, bio-accumulate, and due to their ready transport by water are found even in remote regions of Earth. As contaminants of emerging concern, research on PFCs is ongoing to determine the impacts of these materials on human health and the environment. A CDC study detected four of these analytes in >98% of serum samples representative of the general US population above age twelve. Low level analysis of these compounds is challenging due to their ubiquitous presence in the laboratory and analytical instrumentation components.

3 / 9 �3 / 12 �
Introduction
Figure 1: Central Maryland surface water source locations
Figure 2: Direct method surface water sampling collection technique

4 / 9 �4 / 9 �
Method
Surface water samples were collected and stored according to document SOP #EH-01 Surface Water Collection using the Direct Method. As the mobile phase transfer lines, degasser membrane, pump inlet block, and sample vial septa all utilize PTFE, made from a prominent PFC, perfluorooctanoic acid (PFOA), these components were either exchanged or bypassed to eliminate all sources of extraneous analyte from the instrumentation. The calibration curve solutions were prepared in glass vials using glass syringes with a metal plunger. PFC standards were purchased from Wellington Laboratories. A Shimadzu LCMS-8050 was used for analyte separation and mass spectrometry. Analytes were ionized using negative mode electrospray ionization. All samples were passed through 0.2 um glass fiber filter prior to analysis. The method required only 3.15 minutes. Table 1 provides optimized transitions and retention times for the PFCs measured in this method.

5 / 9 �5 / 12 �
Method
Chromatography Parameters Flow Rate: 0.35 mL/min Mobile Phase A: 10 mM ammonium acetate in water Column oven: 35°C Mobile Phase B: 10 mM ammonium acetate in 80:20 MeOH:ACN Injection volume: 20 uL Column: Supelco Titan C18 (50 x 2.1mm 1.9 um) Gradient: Linear 45% - 97% B 0-2.6 minutes Mass Spectrometry Parameters Nebulizing Gas: 2.2 L/min Interface Temperature: 230 C Heating Gas: 8 L/min Desolvation Line Temperature: 95 C Drying Gas: 10 L/min Heat Block Temperature: 225 C Column Oven: 35 C

6 / 9 �6 / 12 �
Method Information
Table 1: Method information for the perfluorinated compounds measured in surface and drinking water
7 / 9 �7 / 12 �
Results
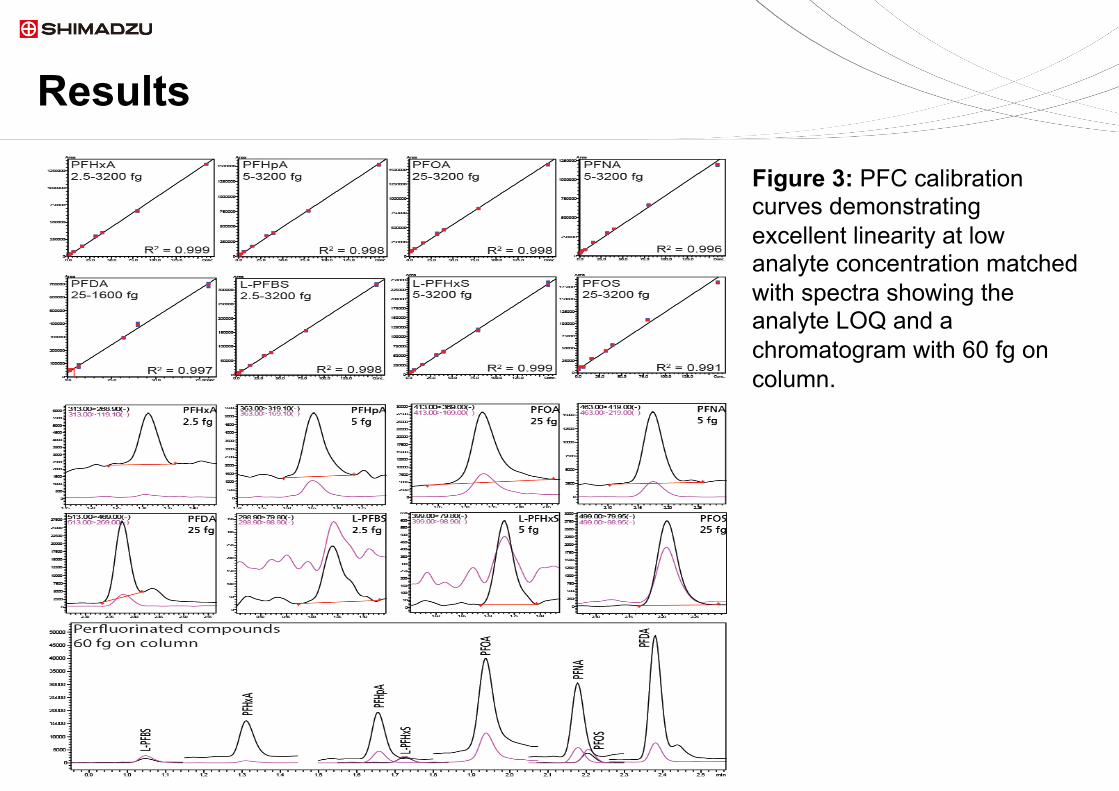
Figure 3: PFC calibration curves demonstrating excellent linearity at low analyte concentration matched with spectra showing the analyte LOQ and a chromatogram with 60 fg on column.

8 / 9 �8 / 12 �
Results
Figure 4: Representative PFC LC Chromatograms from 20uL injections of surface and drinking water.

9 / 9 �9 / 12 �
Results
Table 2: Calculated amounts of PFC materials in the surface and drinking water samples. The measured amounts were averaged (n=4) and reduced by the amount of each analyte detected in the Lab Blank (18MOhm purified water). These values were then divided by the injection volume to determine the final concentration in ng/L.

10 / 9 �10 / 9 �
Discussion
Creating an environment suitable for measuring PFCs required several adjustments to the standard LCMS workflow in both the way samples were prepared and data was acquired. Iterative modifications started with tubing replacements and LC hardware reconfiguration, which was followed by using glass and metal only for sample preparation. Even a seemingly minor adjustment such as inverting the autosampler vial septa proved important to reducing the PFC chemical background. Following these modifications the background reduced significantly, making possible the acquisition of calibration curves measuring down to 2.5 fg on column. The low standard %RSD value for PFOA was 4.1 and for PFOS, 5.6. Seven of the eight compounds were detected in surface waters across central Maryland whereas four were found in drinking water, though in reduced amounts relative to surface water.

11 / 9 �11 / 9 �
Conclusions
Though nearly ubiquitous, perfluorinated compounds can be effectively and quickly measured directly from surface and drinking water using a modified configuration of the LCMS-8050. This method can be used for routine monitoring of PFCs in water samples requiring only minimal sample preparation.

12 / 9 �
Thank you for viewing this presentation. Should you have any questions or require additional information about our research, products or services, please visit our support page: www.ssi.shimadzu.com/support/
@shimadzussi
Follow us on Twitter
Need More Info?


![Evaluation of lipid quantification accuracy using HILIC and ......modes (e.g., full-MS, data-dependent (DDA-MS), and data-independent acquisition MS (DIA-MS))[9–11]allowforthe quantification](https://static.fdocuments.us/doc/165x107/6092419cfd2b866c34049879/evaluation-of-lipid-quantification-accuracy-using-hilic-and-modes-eg.jpg)


