
RAP Gottstein BCM EEM12 Florence 2012 May 10
41
The Regulatory Assistance Project 48 Rue de Stassart Building C, BE-1050 Brussels, Belgium Phone: +32 2-894-9300 web: www.raponline.org Moving the Market Design Discussion “Beyond Capacity Markets” Meg Gottstein, Principal, Regulatory Assistance Project International Conference on the European Energy Market Florence, May 10-12, 2012 This presentation includes material from a paper copyrighted © 2012 IEEE under the title “Beyond Capacity Markets- Delivering Capability Resources to Europe’s Decarbonised Power System” Permission to use copyrighted information must be obtained directly from IEEE.
-
Upload
florabel-tolentino-sera-josef -
Category
Documents
-
view
8 -
download
1
description
ee
Transcript of RAP Gottstein BCM EEM12 Florence 2012 May 10

The Regulatory Assistance Project 48 Rue de Stassart Building C, BE-1050 Brussels, Belgium
Phone: +32 2-894-9300 web: www.raponline.org
Moving the Market Design Discussion
“Beyond Capacity Markets”
Meg Gottstein, Principal, Regulatory Assistance Project
International Conference on the European Energy Market
Florence, May 10-12, 2012
This presentation includes material from a paper copyrighted © 2012 IEEE under the title “Beyond Capacity Markets-Delivering Capability Resources to Europe’s Decarbonised Power System”
Permission to use copyrighted information must be obtained directly from IEEE.

The Regulatory Assistance Project ("RAP")
RAP is a global NGO providing technical and policy assistance to government officials and agency staff on energy and environmental issues. RAP Principals and senior staff are all former regulators, government officials or senior policy advisors, and RAP’s work is funded exclusively by foundations and government agencies. RAP has worked in more than 20 nations and 50 provinces and states. RAP's European offices are headquartered in Brussels, with a second office in Berlin.
Meg Gottstein is a Principal with RAP working on European Programmes out of RAP's Berlin office.
Prior to coming to RAP in 2008, Ms. Gottstein served for over 20 years as a senior regulatory judge for the Commission overseeing California's electric and gas industry. She has also held positions with the California Energy Commission and the US Department of Energy, and provided consultancy services to the National Governor’s Association and other organisations. She has a BA in Economics and German from Tufts University, including two years of study at the University of Tübingen, Germany. Meg received her Masters in Public Policy from Harvard University and is also an Honorary Fellow at the University of Exeter, UK.
Recent RAP assignments include work with: UK Department of Energy and Climate Change, European Climate Foundation (Policy Volume II, Roadmap 2050 and Power Perspectives 2030), Council of European Energy Regulators, Sustainable Development Task Force, and Chilean Ministry of Energy.
2 www.raponline.org

Does Power Sector Decarbonisation Turn Traditional “Wisdom” about ensuring Reliability on its head?
3
YES!
But not in the way it is currently being discussed!
“strategic reserve” of capacity?
full-market “capacity auction”?
capacity auction with “reliability option” contracts?
Can energy-only markets secure system reliability?
DO we need something else? WE NEED TO THINK BEYOND “CAPACITY” MARKETS

What’s the “Answer”? What’s the Question?
Let’s Start With: What Does a Reliable Power System Require?
4

Electrons “in” Electrons “out”
Continuous Balance of Supply and Demand
All Power Systems Require
5/14/2012 5

If you primarily have Dispatchable, Increasing Marginal Cost Generation in the mix….
nuclear lignite coal hard coal gas combined-cycle gas open-cycle oil
or “merit order”
mar
gin
al c
ost
5/14/2012 6
Total Demand

Western Denmark system—winter demand patterns
Source: Security of Supply from a UCTE Perspective, Paul-Frederik Bach, April 2004 5/14/2012 7
Peak
Mid-
Baseload
Reliability Challenge: Do you have enough firm capacity (# of MWs) to cover
the few hours of highest (peak) demand?

ALL CAPACITY PAYMENT designs (in theory or practice) focus on a single reliability dimension:
Pay to ensure there is enough MWs of firm capacity during the system peak demand
Baseload, mid-merit and peaking generation each has an equal role/value
New investment in peakers is key focus-- quickest/cheapest to build MWs that can economically operate just a few hours a year
This approach will not ensure reliability for Europe’s decarbonised power system
8

To Ensure Reliability of Europe’s Future Decarbonised Power System:
“Net” or “Residual” Demand becomes a critical reliability dimension
Net Demand = Total Demand
minus energy available from variable renewables (e.g., solar, wind)*
9
*Variable renewables are those whose output is not controllable (except through curtailment) due to the nature of their primary energy source
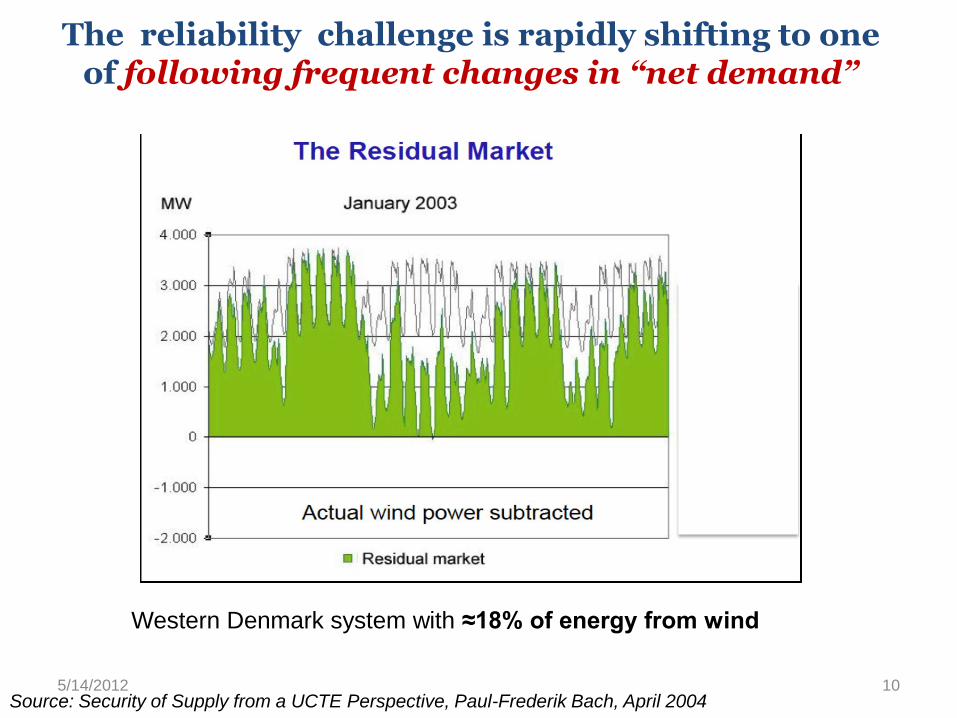
Western Denmark system with ≈18% of energy from wind
The reliability challenge is rapidly shifting to one of following frequent changes in “net demand”
Source: Security of Supply from a UCTE Perspective, Paul-Frederik Bach, April 2004 5/14/2012 10

KEY MESSAGE OF PAPER:
Market Design for a reliable, decarbonised power system
Must address “NET” DEMAND and deliver the RESOURCE CAPABILITIES to meet it!
11

Modelled for the power system operated by the WestConnect group of utilities in Arizona, Colorado, Nevada, New Mexico and Wyoming.
Source: Western Interconnection Wind and Solar Integration Study, December 2010, (NREL/TP-5500-50057) http://www.nrel.gov/docs;
Net demand: more volatile than overall demand, lacking a repeatable pattern. Demand and availability of variable renewables can be moving in opposite directions, any day, every day, several times a day
A Challenging Week for WestConnect (US), assuming 35% Wind Penetration 12
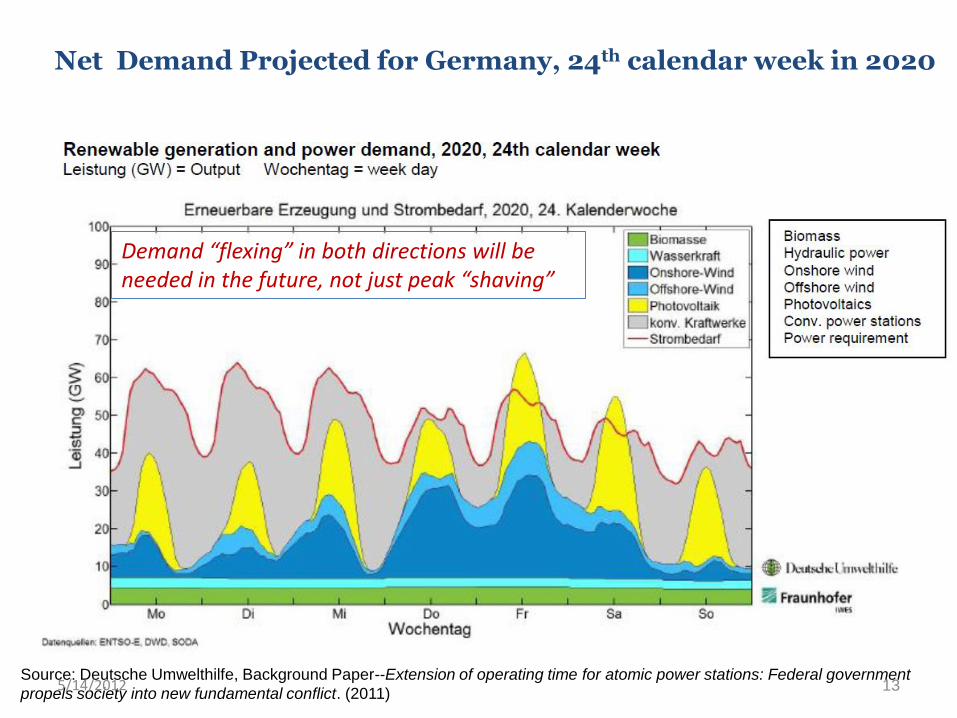
13 Source: Deutsche Umwelthilfe, Background Paper--Extension of operating time for atomic power stations: Federal government
propels society into new fundamental conflict. (2011)
Net Demand Projected for Germany, 24th calendar week in 2020
Demand “flexing” in both directions will be needed in the future, not just peak “shaving”
5/14/2012

Paying for MW capacity that is inflexible, or not flexible enough will increasingly:
threaten system reliability
impose more costs on consumers
pressure to curtail/restrict renewables needed to decarbonise the power system
14
All full-market Capacity Auctions* developed to date (in theory or practice) suffer from this “Fatal Flaw”
*e.g., “forward capacity markets” (PJM, ISO-NE model) or capacity auctions with reliability option contracts (Colombia)

The Market-Wide Capacity Auction (3 years “Forward”)
R1
R5
R3
R6
R7
R4
R1 R2
R3 R4
R5
R1-R7 = Capacity offered by Supply-Side (New built, Existing, Uprates) and Demand-Side (Energy Efficiency, Demand Response, Distrib. Gen); Self-supply (R1) bids in a “zero” price; New Resources set clearing price
R6 R7
Supply = Capacity Committed “Forward”
Demand = System Operator Forecast of Total Peak MWs
Quantity = MW
Bid Price = $ per MW-day
P*
P* clearing price paid to all capacity clearing auction
Cleared Capacity = 100,000 MW
15
R2
15

Source: Market Monitoring Analytics (PJM) 16
Cumulative PJM Capacity Revenues ($42 billion over 6 annual auctions)
Demand Resources2.43%
Energy Efficiency Resources0.07%
Coal (Existing)30.01%
Coal (Planned)0.16%
Gas (Existing)31.83%
Gas (Planned)0.66%
Hydro (Existing)4.91%
Hydro (Planned)0.00%
Nuclear (Existing)21.06%
Nuclear (Planned)0.00% Oil (Existing)
8.14%
Oil (Planned)0.00%
Other Renewables (Existing)0.68%
Other Renewables (Planned)0.05%
Coal--Existing
Gas--Existing
Hydro-Existing
Nuclear-Existing
Oil-Existing
Energy Efficiency
70% to existing fossil-
fueled plants;
20% to “legacy” nuclear;
Where are the new gas,
flexible peakers?
Demand Response
Renewables-Existing
Renewables-Planned
16

What Resource Capabilities are required to Operate the System from a “Net Demand Perspective?
Generators that can respond to rapidly changing net demand, e.g.:
generators with frequent stop-start capability (daily)
fast and “far” ramping, minimum run times
Responsive demand (in both directions) has a much larger role to play, along with storage technologies
Experience in real markets shows that demand-side can and has provided this flexibility reliably, and much cheaper than supply-side alternatives (see extra slides)
Enabling grid development and cross-border balancing
18

-
5.000
10.000
15.000
20.000
25.000
30.000
1 1001 2001 3001 4001 5001 6001 7001 8001
UK_South
How Flexible? Profile of mid-merit CCGTs in 2030
Source data compiled by RAP Europe in consultation with KEMA for four representative centers of gravity reflected in the model runs for Power Perspectives 2030, European Climate Foundation, full report available at: http://www.roadmap2050.eu/attachments/files/PowerPerspectives2030_FullReport.pdf
Example of large combined-cycle gas turbine fleet with “typical” average load factor (58%)* ( ~ 50% renewables in the mix, including hydro)
But requiring 264 start-stops per year of those “mid-merit” generators Compared to < 50 typical start-stops for those plants today
*load factor = amount of plant output relative to maximum output it could produce
Meg
awat
ts
Hours in the year
5/14/2012 19

“Demand-response aggregator”= Virtual powerplant
(not only demand reduction—both directions of response needed!)
“ISO” = system operator/TSO

Demand Response “Virtual Powerplant” offers
flexible capabilities to the system Representative Simulation (US Aggregator = Enbala)*
*Slide graphics/animation reproduced with permission of Ron Dizy, President and CEO, Enbala Power Networks; available at: http://www.enbala.com/gridbalancedemo.html
Response of all resources = “Regulation” capability delivered
Signal sent by system operator
5/14/2012 21

ENBALA Power Network Client Pool beginning to respond to
ISO signal.
5/14/2012 22

5/14/2012 23

5/14/2012 24

5/14/2012 25

5/14/2012 26

5/14/2012 27

5/14/2012 28

5/14/2012 29

5/14/2012 30

5/14/2012 31

5/14/2012 32

5/14/2012 33

5/14/2012 34

5/14/2012 35

The aggregate response of each resource in the
network is compiled to form a unified
regulation response.
5/14/2012 36

KEY MESSAGE OF PAPER: The Proposed Market Design…
Must Address “NET DEMAND” and Deliver the Resource
CAPABILITIES to Meet it!
37

Key Design “Check List” for Evaluation: Does the Market Design Proposal …?
1) Deliver capabilities required to meet net demand?
– Does the proposal even assess net demand at all?
2) Make the most of existing resources with the required capabilities, before turning to more expensive new ones?
3) Secure services from all potential resources, in particular demand-side?
4) Ensure that resources without the necessary range of capabilities (e.g., inflexible generation) are not remunerated (or much less than those that can)?
5) Recognise the carbon content of resources delivering capabilities?
38

Does the Market Design Proposal …(cont.)?
6) Avoid adverse impact on renewable investments that can undermine Europe’s ability to meet its carbon reduction targets?
7) Promote future cost reductions and innovation, avoid foreclosure of market to future providers of flexible capabilities (including consumers)?
8) Create a potentially scalable design, including future integration of neighboring balancing areas and sharing of capability resources?
Positive response to these questions suggests “robust proposal” whilst any negative responses should raise significant concerns
39

“You can’t solve a problem with the same thinking that created it.”
- Albert Einstein
40

“You can’t solve a problem with the same market rules that created it.”
- Meg Gottstein
41

About RAP
The Regulatory Assistance Project (RAP) is a global, non-profit team of experts that focuses on the long-term economic and environmental
sustainability of the power and natural gas sectors. RAP has deep expertise in regulatory and market policies that:
▪ Promote economic efficiency ▪ Protect the environment ▪ Ensure system reliability ▪ Allocate system benefits fairly among all consumers
Learn more about RAP at www.raponline.org
Meg Gottstein, Principal; [email protected]