The challenges of developing rainfall intensity – duration ...

U. S. DEPARTMENT OF COMMERCE SINCLAIR WEEKS, Secretary
WEATHER BUREAU F. W. REICHELDERFER, Chief
TECHNICAL PAPER NO. 29
Rainfall Intensity-Frequency Regi~ne
Part 1-The Ohio Valley
(Rainfall intensity-duration-area-frequency regime, with other storm characteristics, for durations of 20 minutes to 24 hours, area from point to 400 square miles, frequency for return periods from 1 to 100 years, for the quadrangle bounded by longitudes 80° and 90° W. and· latitudes 35° and 40° N.)
Prepared hy
COOPERATIVE STUDIES SECTION
HYDROLOGIC SERVICES DIVISION
tJ. S. WEATHER BUREAU
for
ENGINEERING DIVISION
SOIL CONSERVATION SERVICE
U. S. DEPARTMENT OF AGRICULTURE
WASHINGTON, D. C.
JUNE 1957
For sale by the Superintendent of Documents, U. S. Government Printing Office, Washington 25, D. C. • Price 30 cents

U. S. DEPARTMENT OF COMMERCE
WEATHER BUREAU
TECHNICAL PAPER NO·. 29
Rainfall Intenslty-Frequency Regime
Part I--The Ohio Valley
Errata
Itf:}ma 31 4, 5, 7, 8, and 9 in Table l-2-of Figures 1-l and 2 _.1 should refer to Figures 2-2,2-3, '2 -4, 2-5, · 2 ~6, and 2-7, respectivelY;, instead of Figures 5 through 10.
USCOMM-WB~DC

INTRODUCTION •••••••••
SECTION I. ANALYSIS···
Climate ..
Point Rainfall· •
Basic data ••
Duration· analysis
Frequency ·analysis ••
Isopluvial maps • • • •
Reliability of results.
Areal Rainfall· • • • • • • • •
Basic data • • • • • • . -. • • • •
Area- depth relationships • •
Computations. •
Limitations • •
CONTENTS
Seasonal Variation • • • • .• e • • • • •· • • • •
Time Distribution of Precipitation •
SECTION II • APPLICATIONS • •
REFERENCES··········· • •
iii
PAGE
1
2
2
2
2
3
3
7
7
8
8
8
11
12
12
13
15
17

1-1.
1-2.
1-3.
1-4.
1-5.
1-6.
1- 'i.
1-8.
2-1.
2-2.
1-1.
1-2.
1-3.
1-4.
1-5.
1-6.
2-1.
2-2.
2-3.
2-4.
2-5.
2-6.
2-7.
2-8.
2-9.
2-10.
TABL,ES
SECTION I.
Sources of point rainfall data.
Examples of computation (figure 1-1).
Empirical factors for converting partial- duration series to annual series.
Average difference for various return period amounts for 10- and 45-year records.
Example of computational procedure for determining the area/point ratio.
Stations used to develop seasonal variation relationship.
Stations used to develop time distribution relationship.
Average time distribution relations.
SECTION IT.
Station data (2-year 1-, 6-, and 24-hour).
Station data (100-year 1-, 6-, and 24-hour).
FIGURES
SECTION I.
Duration, frequency, area- depth diagrams and examples of computation.
Correlation of computed with observed 2-year S.-hour rainfall.
Correlation of computed with observed 2-year 12-hour rainfall.
Rainfall frequency data - example of annual and partial- duration series extre,me- value rainfall data.
Ratio of mean maximum annual areal depth to mean maximum annual point rainfall (precipitation) for various size areas.
Percentage depth- duration curves.
SECTION IT.
PAGE
3
4
5
8
9
13
14
15
24
40
4
5
5
6
10
14
Large working copy of figure 1- 1. Inside Back Cover Diagram A, durations less than 6 hours Diagram B, duration 6- to 24- hours Diagram C, frequency l- to 100-years Diagram D, area- depth curves Table 1- 2, examples of computation
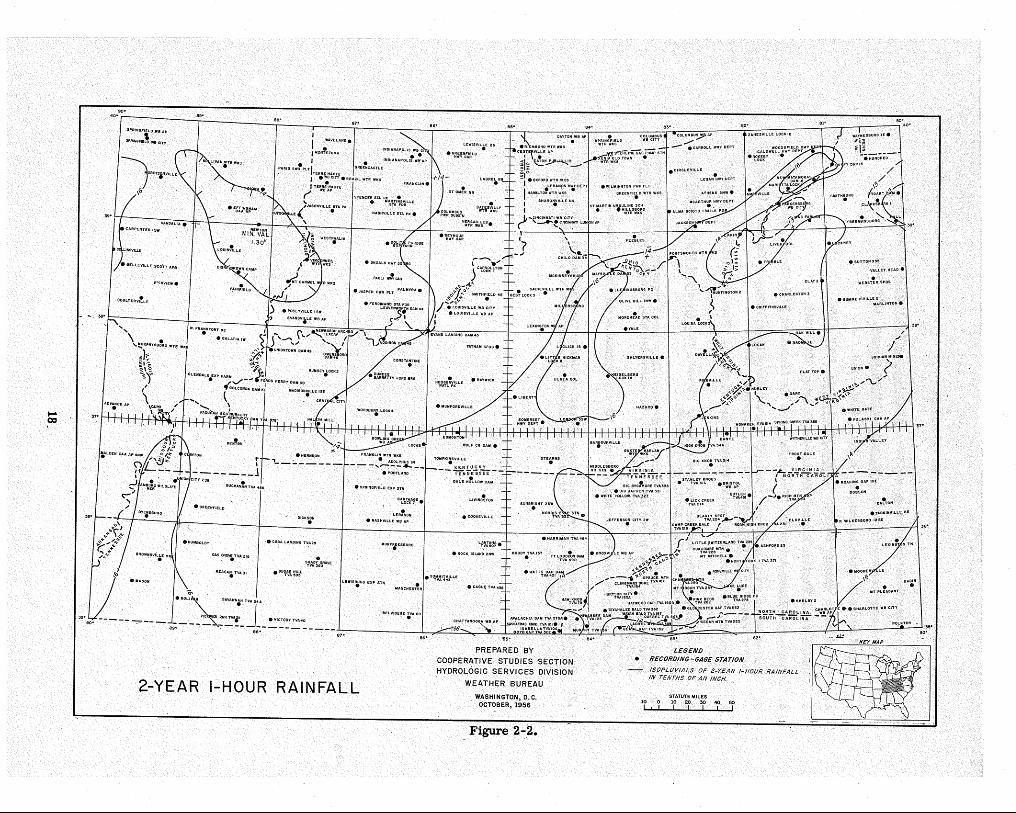
2- year 1- hour rainfall.
2-year 6-hour rainfall.
2-year 24-hour precipitation.
Ratio of 100-year 1-hour to 2-year 1-hour rainfall.
Ratio of 100-year 6-hour to 2-year 6-hour rainfall.
Ratio of 100-year 24-hour to 2-year 24-hour precipitation.
Seasonal probability of intense rainfall, 1-hour duration.
Seasonal probability of intense rainfall, 6-hour duration.
Seasonal probability of intense rainfall, 24- hour duration.
iv
18
19
20
21
22
23
42
43
44

Rainfall Intensity- Frequency Regime Part I: The Ohio Valley
Rainfall intensity-duration-area-frequency regime, with other storm characteristics, for durations of 20 minutes to 24 hours, area from point to 400 square miles, frequency for return periods from 1 to 100 years' for the quadrangle bounded by longitude 80°W and 90°W and latitude 35°N and 40°N.
INTRODUCTION
1. Authority. This report is the first of a series being prepared on a regional basis for the Soil Conservation Service, Department of Agriculture, to provide material for use in develo~,>ing planning and design criteria for the Watershed Protection and Flood Prevention program (P. L. 566).
2. Background. Heretofore, economic and engineering design requiring rainfall i~-tensity-frequency analysis has been based largely on "Rainfall Intensity- Frequency Data" , by David L. Yarnell, which was first printed about 20 years ago. Since that time, besides the additional years of record, the number of recording gages has increased fifteen-fold, and ways have been found for effective use of data from cooperative observers who make observations of daily rainfall.It is, therefore, appropriate nowto use maps with a more refined scale, portraying more regional variation than was possible 20 years ago. Instead of burdening the report with many maps, it has seemed expedient to use a small number of maps for significant durations and return periods, and to use diagrams with continuous variables for generalizing and interpolating among these few maps.
3. Ap~roach to the problem. The point-rainfall analysis is based largely on routine application of Ce theory of extreme values, with empirical transformation to include consideration of the high values that are excluded from the annual series. Analysis of areal rainfall is a relatively new feature in frequency analysis and is based on the few dense· networks that have several years of record and meet other important requirements. Consideration of other storm charactistics includes the portrayal of the seasonal variation in the intensity- frequency regime. The main reason for concern with seasonal variation may be illustrated by the fact that the 100-year 1-hour rain may be a typical summer thunderstorm, with considerable infiltration, whereas the 100-year flood may come from a lesser storm occurring on frozen or snow-covered ground in the late winter or early spring. ·
4. Separation of "Anal~sis" and "~lications". For convenience in practical appli-cation of the results of the wor reported ~is Technical Paper it is divided into two major sections. The first section, entitled "Analysis", describes what was done with the data, gives reasons for the way some things were done, and evaluates the results. The second section, entitled "Applications", gives step- by- step examples for use of the diagrams and maps in solving certain types of hydrologic problems.
5. Acknowled~ements. This investigation was directed by D. M. Hershfield, project leader, in the Cooper a ive Studies Section (W. T. Wilson, Chief), of Hydrologic Services Division (W. E. Hiatt, Chief). Technical assistance was furnished by L. L. Weiss, collection and processing of data were performed by W. H. Bartlett, R. B. Holleman, Mrs. E. C. I' Anson, J. Keefer, S. P. Kerr ill, Mrs. L. L. Langdon, Miss E. E. Marlowe, W. E. Miller, T. P. O'Connell, S. Otlin, H. J. Owens, Jr., J. G. Wangler, Jr., and A. J. Weinstein; typing was by S. P. Kerr III, and drafting by C. W. Gardner. Coordination with the Soil Conservation Service, Department of Agriculture, was maintained through H. 0. Ogrosky, Staff Hydrologist of the Engineering Division. M. A. Kohler, Chief Research Hydrologist, and A. L. Shands, Assistant Chief, Hydrologic Services Division, acted as consultants. Mrs. L. K. Rubin of the Hydro meteorological Section edited the text.
1

SECTION I. ANALYSIS
Climate
6. The region covered in this study is bounded by lOngitudes 80° and 90° W. and lati-tudes 35° and 45° N. This region experiences wide variations in climatic conditions because of its broad areal extent, its location within the paths of various storm tracks, and wide range of elevation. The mean annual precipitation varies from about 80 inches near the tops of several high peaks on the Tennessee- North Carolina line to less than 40 inches in the northern part of the region. In the southern part, precipitation is greatest in the winter and slightly smaller in the summer. This. seasonal trend is reversed to the north, with the maximum monthly amounts occurring during the summer, while some stations experience both a spring and sumq1er maximum.
7. Storms and moisture source. Most of the summer precipitation is of the short-duration, thunderstorm type with high- Intensity, small- area centers. The moisture for these storms is transported from the Gulf of Mexico by the prevailing southerly winds. Winter precipitation in the northern part of the region is partly in the form of snow, but in the southern part all large daily amounts are in the form of rain. This rain is, however, occasionally interspersed with snow and is the result of well-developed frontal systems.
8. Regional variation. Marked differences in precipitation occur among individual stations in orographic regions such as eastern Tennessee. Rainfall is considerably heavier on the Cumberland Plateau and on the Smoky Mountains than in the valleys of eastern Tennessee because a large percentage of the air reaching these valleys .must first pass over the mountains on either side, thus losing much of its moisture before reaching the enclosed area. Heavy rains in western North Carolina are sometimes the result of orographic lifting of moist air from hurricanes. Such stor.ms occasionally produce depths of more than 10 inches of rain per day.
9. Storms combined into one distribution. It has seemed worthwhile to question whether the statishcal distribution of eXtreme ramfall is a function of storm type. In other words, does the same frequency distribution apply to thunderstorm, hurricane, and frontal rainfall? While this question is of less importance in the region of interest than in regions to the east and south, it is being investigated. Thus far no well-defined dichotomy has been found between hurricane rainfall and rainfall having other initial causes. A small amount of data indicates, at least tentatively, that once a rain-producing mechanism has been established (consisting of convergence, vertical motion and cooling, condeilsationand precipitation), the frequency distribution of its extreme values is not influenced much by the manner in which it got started or what source of energy maintains it.
Point Rainfall
Basic data
10. Station data. The sources of data used in this study are indicated in table 1- 1. In order to generahze, and to insure proper relationships, it was necessary to examine data from outside the region of interest. For example, of the 200 first- order stations used (listed in table 1-1), only 17 are in this region. Long records were analysed from only a few stations (less than 300) to define the frequency relationships, and relatively short portions of the record from about 900 additional stations were analysed to define the regional pattern.
11. Station exposures. In refined analysis of mean annual and mean seasonal rainfall data it is necessary to evaluate station exposures by methods such as double-mass curve analysis. Such methods do not apply to extreme values. Except for some subjective selection (particularly for longer records) of stations that have had consistent exposures, no attempt has been made to adjust rainfall values to a standard exposure . The effects of varying exposure are implicitly included in the areal sampling error and are averaged out, if not evaluated, in the ,process of smoothing the isopluvial lines.
12. Time increments. Some of the hourly data are clock-hour, and some are maximum 60- mmute data; correspondingly, some of the 24- hour data are for the maximum 1440 minutes, whereas others are for a calendar day. Examination of sufficient data has resulted in reliable empirical conversion factors so that the results refer to maximum n- minute data for all durations.
13. Rain or snow. The term precipitation has been used in reference to the 24- hour data because snow as well as rain is included in some of the smaller 24-hour amounts. This is particularly true for high-elevation stations. Comparison of arrays of all ranking precipitation events with those known to have only rain has shown trivial differences in the frequency relations for several high-elevation stations tested. For the rarer 24-hour frequencies, and for all short- duration frequencies, the precipitation is composed entirely of rain.
2

Table 1-1
SOURCES OF POINT RAINFALL DATA
Duration No . of Stations A v. Length of Rec . Source § (yrs)
20 min- 24 hr 200 first - order 40 2,3
hourly 276 . hydrologic 10 4,5
6 -hour 276 hydrologic 10 4,5
daily 276 hydrologic 10 4,5
daily 910 cooperative 12 4,6
daily 62 cooperative 55 4,6
§ These numbers indicate references listed on p. 17.
Duration analysis
14. Duration interpolation diagrams. The result of the duration analysis is portrayed in diagrams A and B of figure 1-1 iri which the rainfall rate or depth can be computed for any duration, from 20 minutes to 24 hours, provided the values for 1, 6, and 24 hours for a particular return period are given. This convenient generalization was obtained empirically from data from 200 first-order Weather Bureau stations and is the same relation shown as diagrams A and B of figure 1 of Weather Bureau Technical Paper No. 28.7 For example, the 3-hour rainfall depth may be obtained if the 1-hour and 6-hour depths are given, and the 12-hour depth is a simple function of the 6- hour and 24- hour depths. The degree to which estimated and observed values of 3-hour and 12-hour depths correspond is shown in figures 1-2 and 1-3, respectively. The values are obtained merely by laying a straightedge across the two given values (1 and 6, or 6 and 24 hours) and reading the value for the desired duration. The points on figures 1- 2 and 1- 3 were chosen at random from stations throughout the United States. S~ce no regional variation is evident in this duration- depth or duration- intensity relationship, it may be used for any locality in the United States.
15. The 1-, 6-, and 24-hour values for use in figure 1-1 were obtained from isopluvial maps which will be described lat~r. A large copy of figure 1-1 is furnished in the pocket inside the back cover of this report with a detailed description of its use, with examples.
Frequency analysis
16. Return-period interpolation diagram. Extreme values of rainfall depths or intensities form a frequency distribUtion which may be defined in terms of its moments. Investigations of hundreds of rainfall distributions have confirmed the view of most authorities that the record length (rarely more than 50 years) is too short to measure beyond the first and second moments. The distribution must therefore be regarded as a function of the first two moments. The 2- year value is a measure of the first moment - the central tendency of the distribution. The relationship of the 2-year to the 100-year value is a measure of the second moment - the dispersion of the distribution. Diagram C of figure 1-1 illustrates the use of these two parameters, 2-year and 100-year rainfall, for estimating values for other return periods.
3

U.S. DEPARTMENT OF COMMERCE WEATHER BUREAU
Diagram A, INTENSITY OR DEPTH OF RAI NFALL.FOR DURATIONS LESS THAN 6 HOURS
Diagram 8, DEPTH OF RAINFALL FOR DURATIONS OF 6 TO 24 HOURS
For 20 mln. to 60 min. rainfall, valu~s or~ in inches per hour; for longer durations the values ore In inches depth.
7 6
-
-
-
--
1-
' 1-
-
--t---
-
-
-
-·-
-
-
-
-
--
-
-
--
-
-
-
-
/ -o.6
-
1-
==· 1-
1-
r-
1-0
6 10 12 14 16 18 DURATION- 6 TO 2.4 HRS.
Diagram C, RAINFALL INTENSITY OR DEPTH VS. RETURN PERIOD 1
1- -
1- 1-
1- 1-
1- 1-
f-- -
1- 1-
f- -
f-- -
----
--
--
--
--. -,.-
--
- -
- -1
--
--0 0
1 3 4 5 lO 15 20 25 30 35 40 45 50 60 70 80 90 100 RETURN PERIOD IN YEARS, PARTIAL-DURATION SERIES
NOTE: To use this d/ogrom for values greater than 10, o foetor of 10 may be used, as with o sllde rule, with proper attention to the decimal p~lnt. lf more convenient, other factors such as ,2 or 5 may be used.
--+---
-
-
-
-
-
-
-
-
-
-
--1
_..;
-
-
-
-
-
1
1
1
1
COOPERATIVE STUDIES SECTION
Tablel-2, with three examples, outlines the steps in the order they should be carried through in solving for the required rainfalllntensitiesordepths.
36•oo• N 39'"00' N 3'1'"00' N
82°00' w 84°00' w 89°00' w 25-Yr 3-Hr 50-Yr 12-Hr 15-Yr 30-Min
2. Requtredlntensity Rainfall{In) Rainfall(In) Int(In/Hr) (Depth)-Dur-Freq-Area ~ft;~o sq. ~f~:~o sq. ~fte~o sq.
3. ~~~11 .1-Hour Fig. 5
4. 2-Year 6-Hour Rainfall, Fig. 6
5, 2-Year '24-Hour Precip. Fig. 7
6. Straightedge
{~)~~c(.i)~~) (~d (2-Yr 3-Hr) (2-Yr 12-Hr) (2-Yr 30-Min)
~t::t~~~~s required, 2•5 In/Hr.
Diagrams AorB
7. 100-Yr 1-HrRainfall 2-Yr1-HrRainfall Flg. B
B. 100-Yr 6-HrRainfall 2-Yr 6-Hr Rainfall Fig. 9
9. ~~~~YJi~~Hpr~~f;.to. Fig. 10
(7)x(3)
(B)x(4)
(9) X (5)
(100-Yr 1-Hr)
2.9In.
(lOO-Yr 1-Hr)
(100-Yr 6-Hr) (100-Yr 6-Hr) (100-Yr 6-Hr)
{100-Yr24-Hr
6.0In.
Straightedge (~i)n~~t~f) (!~~ U~) (100-Yr 3-Hr) (100-Yr 12-Hr 100-Yr30-Min
~t::t~~~~s required 4.1 In. 4.6 In/Hr.
Diagrams A orB
14. straightedge connecting{6)and
~~~l~':rfciJ~lred Diagram C
(15) x (14) gives (2)
DIAGRAM D, AREA -DEPTH CURVES
3.5 In/Hr.
2.4 In/Hr.
AREA (SQUARE MILES)
FIGURE 1-1. DURATION, FREQUENCY, AREA-DEPTH DIAGRAMS, AND EXAMPLES OF COMPUTATION FOR
WEATHER BUREAU TECHNICAL PAPER NO. 29, PART I. (PREPARED MARCH, 1957)
4

r-1 I I I I I I )L ·a.o
_I I I I I I I I_
. f-- -. - -
r.4 ~·y
f-- /( - ,-- ;Y -ro
-' -' -' ~2.0 .~
z•' v -' ~5.0
~ "' ::>
f-- ;(. - ~ "' ::>
- -
%1.6 _,.
.Y. ~:.Y 0 ~4.0
"' <( w ,_
r- ./ - "' <( w ,_
- -
~1.2
0 / dJ3. 0 w >
lr-·· 0 v w
> "'
f-- -w "' w
- -
~0.8 L-t' ./- ""'
(f)
~2.0
f--v/
b{ I I I I I 0.8 1.2 1.6 2.0 2.4 COMPUTED 2-YEAR 3-HOUR RAINFALL (INCHES)
-
I 1-
- ,). /
,?( I I I I I 2.0 3.0 . 4.0 5.0 6.0 COMPUTED 2- YEAR 12-HOUR RAINFALL (INCHES)
-
I ,-FIGURE 1-2. CORRELATION OF COMPUTED WITH OBSERVED FIGURE. 1-3. CORRELATION OF COMPUTED WITH OBSERVED
2-YEAR 3-HOUR RAINFALL. 2-YEAR 12-HOUR RAINFALL.
17. Two tytRs of series. The shape of the diagram - that is, the position of the other ordinates - is par y empiriCal and partly theoretical. This discussion requires consider ation of two methods of selecting and analysing intense rainfall data. The partial- duration series includes all the high values, and the annual series consists of the highest value for each year. The highest value of record, of course, is the top value of each series, but at lower frequency levels (shorter return periods) the two series diverge, as shown in figure 1-4. The partial-duration series, having the highest values regardless of the year in which they occur, recognizes that the second highest of some year ordinarily exceeds the highest of some other year. The processing of partial-duration data is very laborious, and there is no theoretical basis for extrapolating it beyond the length of record, or even for good definition beyond about the 10-year return period, where there are only 40 or so years of record.
18. Construction of dia~am. The return- period diagram C of figure 1- 1 is based on data fromtlie long- record eather Bureau stations and is identical with the return- period diagram in Technical Paper No. 28. From ~ne to 10 years it is entirely empirical, based on free- hand curves drawn through "California" method plottings of partial- duration series data. For the 20-year and longer return periods, reliance was placed on Gumbel\~ analysis of annual series data. The transition was smoothed subjectively between 10- and 20-year return periods. If values between 2 and 100 years are taken from the return-period diagram, then converted to annual- series values and plotted on either Gumbel or log- normal paper, the points will very nearly define a straight line.
19. Conversion factors for two series. Table 1-3, based on a sample of nearly 50 widely scattered \J. S. stahons, gives the empirical factors for converting the partial-duration series to the annual series.
Table 1-3
EMPIRICAL FACTORS FOR CONVERTING PARTIAL- DURATION SERIES TO ANNUAL SERIES
2 -year return period 0. 88 5 -year return period 0 . 96
10 -year return period 0. 99
4Z8981 o -57 -z 5

RAINFALL FREQUENCY DATA
CHARLOTTE NORTH CAROLINA (1902-1940)
EXAMPLE OF ANNUAL AND PARTIAL-DURATION SERIES EXTREME-VALUE RAINFALL DATA
10.0
9.0
8.0
7.0 (j) ~ 6.0 u ~ 5.0
..J
..J ~ 4.0 z < a:: 3.0 ~ 0 I
a:: < ~ 2.0 lJJ ..J < u
f---
1.0 100
@ @ @
® (o
® ® ® ® 0
J
• ANNUAL SERIES o PARTIAL-DURATION SERIES
®POINTS COMMON TO BOTH SERIES
50 25 15 10 9 8 7 6 5 4 RETURN PERIOD (YEARS)
Figure 1-4
0
• ~ 0 0ooo • .ooo • • • • • I ooooooooq,
. ••••• 0~ .... . ····:;;--.. . .
3 2
For example, if the 2-, 5-, and 10-year partial-duration series values estimated from the return-period diagram are 3.00, 3.75, and 4.21 inches, respectively, the annual series values are 2. 64, 3. 60, and 4 .17 inches after multiplying by the conversion factors in table 1-3.
20. Use of diagram. The two intercepts needed for the frequency relation in diagram C of figure 1-1 are the 2-year values obtaiiled from the 2-year maps, and the 100-year values obtained by multiplying the 2-year values by those given on the 100-year to 2-year ratio maps. Thus, given the rainfall values for both 2- and 100-year return periods, values for other return periods are functionally related and may be determined from diagram C which is entered with the 2- and 100-year values. The 100-year values for the first-order stations were taken from Gumbe 1 analysis of the annual series (Technical Paper No. 25) .10
21. General apRlicability of diagram. Diagram C is independent of the units used, as long as tile same urils (inches, tenths of mches, or anything else) are used for any given problem. Tests have shown that within the range of the data and the purpose of this report the diagram is also independent of duration. In other words, for one hour, or 24 hours, or any other duration within the scope of this report, the 2-year and 100-year values define the values for other return periods in a consistent manner. Studies have disclosed no regional pattern that would improve diagram C, which thus far appears to have application over the entire region of interest and perhaps the entire United States.
22. Questions on sub- samHle size. In frequency analysis one of the postulates of extreme- value theory is the size ofhe sub- sample: each value in the annual series is the maximum of 365 events in the case of 24- hour rainfall, but in the case of shorter durations the subsample is obviously much larger - appar.ently being 24 times as large for hourly rainfall. Does the fact that some stations have more days of rain than others affect the sub- sample size appreciably? Should days of rain be regarded as the limiting number of possible rain events, or should a day of rain be regarded merely as an advanced stage of a process involving moisture content of the atmosphere, vertical motion, condensation, and other components - some of which have continuous values throughout each year?
23. These and related questions may remain unanswered for a long time; during their investigation there is some security in the knowledge that the traditional methods give results that are consistent within the range of the data and the range of present applications and that the results can be evaluated.
6

24. The use of short- record data introduces the question of possible secular trend and biased sample. Routine tests with data of different periods of record showed no significant trend, indicating that the direct use of the relatively recent short-record data was legitimate.
Isopluvial maps
25. For generalization over the region of interest three maps have been prepared which show rainfall depths for one, 6, and 24 hours for return periods of two years. Three additional maps show, for the same durations, the ratio of 100-year to 2-year rainfall. This set of six maps appears as figures 2-2 to 2-7 in section ll of this report. For interpolation among the durations given on these maps, and for returnperiods other than 2 years the diagrams of figure 2-1 are used. In general, the isopluvials were drawn in a straightforward and fairly objective manner. The 2-year 24-hour map is based on about 1300 stations. While the 2-year value is well defined even for short records, there was a tendency in drawing the isopluvial lines to give more weight to the longer-record data. The 2-year 1-hour and 2-year 6-hour maps are each based on more than 300 stations. Experience in sit~ations where it has been necessary to estimate short~ duration data from daily observations has demonstrated that the ratio of 1-hour or 6-hour values to corresponding 24-hour values for the same return period does not vary greatly over a region. This knowledge served as a useful guide in smoothing the 1-hour and 6- hour isopluvials.
26. Reason for ratio m~. The decision to use maps of the ratio of the 100- year to 2-year values, instead of 100-year maps, was based largely on the fact that the ratio produces a flatter map and greatly reduces errors that might arise from the practical limitations of correct registration in the printing process and of interpolation in using the maps. U 100-year (or even 10- year) maps had been used, ratio maps would have been required for one of the consistency tests while preparing this report. One of the reasons for using the 100- year instead of 10-year or other short return- period ratios was to make the use of diagram C less subject to error. Although the ratio maps require an additional slide rule or other mulitipling operation, actual tests with alternate methods established. the superiority of the ratio maps.
27. Examination of Phtlsio<f£a~hic parameters. Work with mean annual and mean seasonal rainfall has resulted inhe ervation and effective use of objective and empirically defined parameters relating rainfall data to the physiography of a region. Elevation, slope, orientation, distance from moisture source, and other parameters have been useful in drawing isopluvial maps of mean rainfall. These and many other parameters were examined in an effort to refine the maps presented here. However, tests showed that the use of these par ameters would result in no improvement in the isopluvial pattern because of the high density of stations in this region and the sampling and other error inherent in values obtained for each station.
Reliability of results
28. The reliability of results is influenced by sampling error both in time and space, and by the manner in which the maps were constructed. Sampling error in space is a result of the chance occurrence of a storm at one station but not at a nearby station. Where stations are less closely spaced than in the dense networks studied for this project, stations may receive storms that are non-representative of their vicinity, or may completely miss storms that are representative. Similarly, sampling error in time is a product of storms not occurring according to their average regime during a brief record. A brief period of record. may include some non-representative large storms, or may miss some important storms that occurred before or after the period of record at a given station. In evaluating the effects of areal and time sampling errors, it is pertinent to look for and to evaluate bias and dispersion. This is discussed in the two. following paragraphs.
29. Areal sampling error. In developing the area- depth relations, which will be described later, 1t was necessary to examine data from several dense networks. Some of these dense networks were from regions where there could be no conceivable effect of physiography on the rainfall regime. Examination of some of these data showed, for example, that the standard deviation of point rainfall for the 2-year return period for a flat area of 300 square miles is about 20% of the mean value. With no assignable causes for this dispersion, it must be regarded as a residual error in sampling the relatively small amount of extreme- value data available for each station.
30. Sampling error in time. Daily data from 158 long- record stations were analysed for 10- and 45-year records to determine the reliability or level of confidence that should be placed on the results from the short-record data. No bias was found. The average differences without regard to sign in the results for selected return periods are given in table 1-4.
7

Table 1-4
AVERAGE DIFFERENCE OF VARIOUS RETURN- PERIOD AMOUNTS FOR 10- AND 45- YEAR RECORDS
Return Period (yrs)
Average Difference (%)
2
9
5
12
10
15
25
17
50
19
100
20
31. Smoothing of isopluviallines. The reliability of the isopluvial maps is determined partly by the. manner in which they are constructed and partly by any limitations in their use. The manner of construction involves the question of how much to smooth the data, and an understanding of the problem of data smoothing is necessary to their most effective use. The drawing of isopluvial lines through a field of data is analogous in some important respects to drawing regression lines through the data of a scatter diagram. Just as isolines can be drawn so as to fit every point on the map, an irregular regression line can be drawn to pass through every point; but the complicated pattern in each case would be unrealistic in most instances. In each case the correlation coefficient could be made 1. 00, but too many degrees of freedom would be sacrificed. The maps were deliberately drawn so that the standard error of estimate (the inherent error of interpolation) was commensurate with the sampling and other error in the data and methods of analysis.
32. Evaluation. In general, the standard error of estimate ranges from a minimum of about 20%";Wliere a point value can be used directly as taken from a flat part of one of the 2-year maps, to at least 50%, where a 100-year value of short-duration rainfall must beestimated for an appreciable area in a more rugged portion of the region. Even though the confidence band is wide, some significant 2- year estimates have undoubtedly been masked as a result of smoothing - as for instance, in mountainous areas where large local variations have been obscured. For example, Mt. Mitchell and North Fork No. 1, North Carolina, are about 10 miles apart at elevations of 6635 and 2765 feet, respectively, yet their 2-year 1- hour values of 1. 21 and 1. 61 inches have been practically merged through smoothing.
33. Tables of station data. In order to make unsmoothed data available to the user, all the observed 2-year 1-, 6-, and 24-hour values are given in table 2-1. The 100-year values for long- record first- order and cooperative observer data are presented in table 2-2. The station names and locations shown in these two tables are those listed in the climatological publications for the latest year of record used in this study.
Areal Rainfall
Basic data
34. Criteria for selection of data. A survey was made of all available dense networks and seven were selected on the basis of the criteria cited below:
1) The networks had to be composed entirely of recorders. The use of nonrecorders would have greatly increased the number and density of the networks but wouldalso involve the construction of mass curves and therefore too much subjectivity.
2) The minimum length of record considered was seven years in order to insure an estimate of the 2- year areal rainfall within reasonable limits.
3) Gage locations had to remain the same during the period of record analysed.
4) A minimum of four gages for 400 or fewer square miles had to be available to estimate the areal depth.
35 ~ The location, number of gages, and length of record for the networks used in this study are shown in figure 1- 5 .
Area- depth relationships
36. Determining average depth. The estimation of areal rainfall with sufficient volume of data to denve general reg1onal duration and frequency relationships could become so laborious as to defe::tt its purpose .
8

With no precedent for this work, it was necessary to test methods for processing the data. It was found that the drawing of isohyets had no practical advantage over the faster and more objective method of taking the arithmetic mean of sufficient station values to estimate areal depth.
37. Sha~ factor. No attempt was made to evaluate effects of shape of area, though it can be said tat there was no apparent difference among the areas studied,, which varied in shape from essentially "square" to twice as long as wide. There were too few dense networks to evaluate the effects of orientation of the axis of a long drainage area.
38. Areal variation of storm rainfall. Ideally the study of areal rainfall patterns for given periods would show two thmgs. One would be the degree of variability: some measure of the extreme range of rainfall depth from place to place within the given area and period. The other would be some indication of where the high and low centers are. The study, to date, of this aspect of storm characteristics has been rather limited. Except in regions of rugged terrain it is believed that the location of high and low centers of rainfall over small areas and short durations is random. Accordingly, it may suffice for the present to express merely the degree of variability. A convenient measure of variability is the standard deviation. For plain areas of two or three hundred square miles the standard deviation of hourly rainfall is about 40% of the mean depth, and for 24- hour rainfall the standard deviation is about 30%of the mean depth. For rugged areas the variability is greater thanfor plain areasthe more rugged the more variable. In a 200 square mile area in the vicinity of Asheville, North Carolina, the standard deviation was about twice the values given above for hourly and 24- hour rainfall. ·
Table 1-5
EXAMPLE OF COMPUTATIONAL PROCEDURE FOR DETERMINING THE AREA/POINT RATIO
Yearly Maximum 1- hour Point and Areal Rainfall (inches)
Year Station A Station B Station c Station D Area
Amt. Date Time§ Amt. Date Time§ Amt. Date Time§ Amt. Date Time§ Amt. Date, Time§
1954 1.87 10/3 0800 1. 70 10/9 2100 2.11 8/18 0600 1. 74 8/18 0600 1. 79 8/18 0600
1953 1.13 7/21 1700 1.57 6/5 1500 1.13 4/30 1900 1.00 8/2 1600 .71 6/5 1500
1952 1.06 6/17 0100 .61 8/9 0300 1.08 8/9 0400 1.01 8/9 0500 .50 8/9 0400
1951 1.56 9/21 2000 1.05 9/21 0800 1.10 4/28 ·1900 1.40 4/28 1800 .65 4/28 1800
1950 .74 9/21 0600 1.12 6/2 1900 1.33 6/2 1900 .88 9/2i 0700 .84 6/2 1900
1949 1.27 5/19 1200 .98 3/30 2400 .68 6/14 2300 .72 6/14 1900 .64 6/14 2300
1948 1.15 4/7 1800 .82 7/21 0700 1.15 7/21 0600 1.19 7/21 0700 .73 7/21 0700
Sum 8.78 7.85 8.58 7.94 5.86
Years of record 7 7 7 7 7
Mean 1.25 1.12 1.23 1.13 .84
§ Hour ending
Four- station mean point rainfall = 1.25 + 1.12 + 1.23 + 1.13 1.18 inches 4
Ratio (Area) = -:!!. = 71.2 % Point 1.18
9

RATIO OF MEAN MAXIMUM ANNUAL AREAL DEPTH
TO MEAN MAXIMUM ANNUAL POINT
1PRECIPITATION) FOR VARIOUS SIZE
RAINFALL
AREAS
~ 60 ~----+-----~--~-+~--~------+-----~-----+----~
0 a. .........
<(
~50+-----~--•---+----~~----+-----~-----+----~----~ <(
80~----~----~------~----~----~----~----~~--~
0 50 100 150 200 250 AREA (SQUARE MILES)
DENSE TOTAL TOTAL
NETWORK AREA NO. OF GAGES
A 310 13 B 90 9 c 150 6 D 300 5 E 400 4 F 200 5 G 300 5
TOTAL
FIGURE 1-5
10
300 350 400
NO. OF LENGTH OF
SUB-NETWORKS RECORD
(YRS.)
8 9 6 15
3 15 2 14
0 II
I 7
2 14
22

Computations
39~ Area-depth com~utations. As a practical device for saving labor, the data and curves shown m hgure 1-5, or the relationship of depth to area for l-and 24-hour durations, are for the mean of the annual series, which is the 2. 3-year return period rather than the 2.0-year return period. The 2.0-year value is almost exactly 6% less .than the series mean value. The ordinate of the lower curve of figure 1- 5 is convenient! y expressed as a fraction whose numerator is, for mstance, the 2-year 24-hour rainfall over an area, and whose denominator is the average of the 2-year 24-hour points in the area. The numerator is obtained from an annual series of values, each of which is the maximum average depth for a given area during the year - the times of beginning and ending of the 24- hour duration, for example, being the same for each station in the area. The denominator is the mean of the individual station values- each being the 2-year 24-hour rainfall obtained from the annual series of point values without regard to when the 24-hour period occurs among the stations. The element of simultaneity in the numerator restricts the magnitude of the areal depths to values equal to or less than the average of the point rainfall depths. Table 1- 5 shows the mechanics of this procedure applied to one of the sub-networks in the Chicago area.
40. The mean point values 1. 25, 1. 12, 1. 23, and 1. 13 inches obtained in these series are slightly larger than the 2-year values. It is therefore necessary to subtract 6% toobtain the 2-year values which are plotted on the isopluvial maps. This assignment of frequency may be unimportant if future work substantiates the indications that storm depth is insignificant in shaping the area- depth curves.
41. The foregoing discussion of area:- depth computation may be expressed in mathematical symbols.
YEARLY MAXIMUM SHORT-DURATION RAINFALL
YEAR POINT AREA
1 ~11 p12 p13 Pln Al
2 p21 p22 p23 . P2n A2
3 Pa1 Pa2 Paa . Pan A a
Pij . At
r Prl Pr2 Pr3 Prn Ar
P.l P.2 P.a P· ·l . P.n A
r is the number of years of record
n is the number of stations in the network
P1i is the value taken from the jth station for the ith year, where i goes from 1 to r and j from 1 to n
A1 is the maximum areal rainfall for each year
A denotes the mean of r values of areal rainfall, therefore A =
r Pin P .n denotes the mean of r values from the nth station, therefore P = L .n r
This value· minus 6% (2- year value) is plotted on the 2- year maps
Ratio (Area/Point) =
r A· r L + n LAt i=l i=l
1 r n
nr L I Pij i=l i=l
11
___;_ _____ _ r n I I Pii i=l j=l
i=l

42. Determination of area of network. It is fairly easy to determine the area of a watershed and estimate the average depth of rainfall over it from a dense network of gages. It is not so easy, however, to start with a dense network of gages and say to what size or shape of area the mean depth applies. The area "covered" by n gages was about equal to n circles having diameters equal 'to the average station spacing. The networks chosen involved compromise ·amongdensity of the network, length of record, and nearness to the region of interest. The areas for most of the dense networks studied were rounded off to the nearest hundred square miles. Most of the area-depth curves are so flat and the scatter of points is so great, as shown in figure 1- 5, that precise determination of area would not be worth the effort.
43. The larger- area networks were subdivided to provide additional points for help in defining the position of the curves for .the smaller areas. The 1- and 24- hour curves were fitted by eye and represent a compromise between optimum fit for the larger areas and a well established feature of storm rainfall: the average intensity over an area in relation to the maximum point rainfall in that area is some inverse function of the size of that area.
Limitations
44. Discussion of imperfect relationships. The large scatter in figure 1- 5 which exhibits no systemahc regwnal pattern can partly be ascribed to the imperfect area-depth estimates. Reliable estimates would require:
1) synchronized readings of the rain gages, particularly for the shorter durations.
2) gages suitably located in sufficient number over the area.
3) the period having the maximum continuous rainfall rather than clock- interval rainfall because the areal rainfall, particularly for short periods, is underestimated. This is believed compensated for to some extent because clock-hour and calendar- day rainfall are used for both areal and point rainfall determinations.
45. Duration as a major parameter. From detailed studies of the seven dense networks and from tests performed on many others, it was found that the area-depth relationship varies with duration, as shown in figure 1-5. The area-depth relationship seems, however, to be independent of geographic location, time of year, and other circumstances.
46. De~th or return l]eriod not a parameter. None of the dense networks has sufficient length of recor to evaluatefie effect of magmtude (or return period) on the area-depth relationship. An approachlf this problem included examination of published area-depth curves from "Storm Rainfall." These curves required transformation to make them comparable with curves such as those of figure 1-5. The data for "Storm Rainfall" is storm centered, whereas the networks used in this report are geographically fixed. "Storm Rainfall" data represents profiles of discrete storms, whereas the dense network data are statistical averages in which the point values very seldom, if ever, correspond to areal values of the same storm each year; in fact, the point values for each year are usually from several storms. The areadepth curves taken from "Storm Rainfall",after transformation to make them comparable with the generalized curves of the dense networks for the 2.3-year return period, showed no significant differences from the curves for lesser storms. Accordingly, it is tentatively accepted that for areas of less than 400 square miles, storm magnitude is not a parameter in the area- depth relationship.
Seasonal Variation
47. Introduction. Short duration rainfall in the Ohio Valley is more intense in summertime than m wmter. Of the rain from a heavy 1- hour storm in July, with normal vegetation and soil condition for that time of year, a certain portion is absorbed by the soil and the rest runs off and may contribute to a flood. But a greater flood may come from a lesser rain occurring in the wintertime when the soil may be frozen or snow-covered. With seasonal and other variations in the rainfall- runoff relations hip, it was desirable to investigate the seasonal variation in the rainfall intensity-frequency regime.
48. Monthly vs. annual series. The frequency analysis so far has followed the conventional procedures of usmg only the annual maxima or the n-maximum events for n-years of record. Obviously, some months contribute more events to these series than others and, in fact, some months might not contribute at all to these two series. The purpose of the following analysis is to show how often these rainfall events occur during a specific month.
49. Data used. To develop the seasonal variation relationship, 13 first-order stations were chosen so as to sample a large part of the rainfall regime of the region of interest. The 13 stations and the length of record for the data are shown in table 1- 6.
12

Table 1-6
STATIONS USED TO DEVELOP SEASONAL VARIATION RELATIONSHIP
Station Length of Rec. Station Length of Rec. (yrs) (yrs)
Cairo, Ill. 43 Cincinnati, Ohio 51 Springfield, Ill. 39 Columbus, Ohio 43 Evansville, Ind. 41 Chattanooga, Tenn. 40 lndianapo lis, Ind. 49 Knoxville, Tenn. 43 Lexington,. Ky. . 42 Lynchburg, Va. 37 Louisville, Ky. 44 Elkins, W. Va. 41 Charlotte, N. C. 39
50. Computation of monthly probabilities. For each of three durations (1, 6, and 24 hours) all the events which make upthe partial-duration series - the maximum n events for n-years of record - were classified according to month of occurrence, and magnitude on the return-period scale. After the data for each station were summarized, the frequencies were computed for each month by determining the ratio, expressed as a percentage, of the number of occurr.ences equal to or greater than the magnitude of a particular event to the total possible number of occur-rences (years of record). The magnitude of any rainfall event is approximately related to the probability of its occurring in any year. Cases of non- occurrence· as well as occurrence of rainfall events were considered in order to arrive at numerical probabilities. The results were then plotted as a function of return period and season.
51. Construction of seasona 1 probability diaf{rams. Some variation exists from station to station, suggestirig a slight regional pattern, bU: no attempt was made to define it because there is no conclusive method of determining whether this pattern is a climatic fact or an accident of sampling. Duration seems to be the only parameter having significant effect on the shape of the seasonal probability relationships. The data from all 13 stations were combined, giving 550 station-years of record, and smoothed isopleths of frequency were drawn for each significant duration: 1, 6, and 24 hours. These isop leths appear as figures 2- 8 to 2- 10 in section n of this report. As a check on the consistency of these diagrams, the probability lines were carefully examined to make sure the aggregate probabilities agreed with the definition of return period; e. g., the 2-year value occurs on the average about 50% of the time.
52. Seasonal distribution of short-duration precipitation. Upon examination of figure 2-10, it will be noted that there is only a small chance of getting an amount as large as the 1-year event during the winter months. From a seasonal point of view large 24-hour precip~ itations are most likely during March and July with a slightly smaller chance in September. Figures 2-8 and 2-9 exhibit a very great range of frequency (and precipitation) with season, withpractically all the larger events occurring duringthe summer months. This observation, together with the fact that monthly thunderstorm incidence is very nearly in phase with the frequency of short-duration rainfall events, indicates that only small ~reas are affected by these intense summer rainfalls.
53. Application to areal rainfall. To test the applicability of these diagrams for the range of area in this report, a limited amount of areal data was analysed in the same manner as the point data. The results exhibited no substantial difference from those of the point data, which lends some confidence for using these diagrams as a guide for small areas.
Time Distribution of Precipitation
54. Introduction. The variability of precipitation in time has a marked effect on the resulting runoff. If a three-inch rain is spread uniformly over a 24-hour period, the resulting streamflow, particularly the peak rate, will be much less than if the rain occurs during one hour of the 24- hour period. It is pertinent to ask what proportion of a 24- hour rain usually does fall in one hour, or in six hours. It is also pertinent to ask if this proportion is different for rains of different magnitude .
55. Selection of data. To develop the time distribution relationship, 696 storms with precipitation amounts equal to or greater than 2. 0 inches in a continuous 24- hour period were analysed. The number of storms for each station is shown in table 1- 7.
4Z8981 0 -57 - 3 13

Table 1-7
STATIONS USED TO DEVELOP TIME- DISTRmUTION RELATIONSHIP
Station
Cairo, Ill. Evansville, Ind. Louisville, Ky. Cincinnati, Ohio Columbus, Ohio
No. of Storms
100 98 92 64 30
Station
Dayton, Ohio Chattanooga, Tenn. Knoxville., Tenn. Elkins, W. Va.
No. of Storms
26 142 105 39
56. Pre ration of de th-duration curves. In most instances the maximum continuous 24- hour prec p a on e rae e rom e · s orm' period was only a part of the total storm precipitation. The amounts used for smaller time increments were the maximum clock-hour, 2-hour, 3- hour, etc. , all beginning and ending on the hour. and all occurring within the 24- hour period. The empirical factor, 1.13, was used to bring clock-hour amounts up to the maximum continuous 60- minute rainfall. Similarly, empirical factors were used to adjust the 2-, 3-, &-, 12-, and 24- hour amounts. The data were then stratified by 1- inch (per 24 hours) increments and averaged. The resulting smoothed depth- duration curves are shown in figure 1-6.
PERCENTAGE DEPTH-DURATION CURVES
z Q 80 1--------+----_,..... ~ 0.. u w 0::
0.. 60 1-----~ 0:: ;::)
0 :I: I,
o;t N
~ 40 w (.!)
~ z w u ~ 20 . 0..
6 12 DURATION (HOURS)
Figure 1-6
18 24
57. Probable sequence of 24...;hour rainfall. These average curves, however, do not indicate which hour- or quarter of a day duririg the 24-hour period is likely to have the largest rainfall or what the magnitude of the rainfall might be. Average sequences are summarized in table 1-8. The data were further analysed to give the frequency of occurrence in percent of the maximum 6-hour (quarter of a day) and 1-hour increments plus the average 6- to 24-
. and 1- to 6- hour ratios for each quarter of a day.
14

Table 1-8
AVERAGE TIME- DISTRffiUTION RELATIONS
1st 2nd 3rd 4th Quarter Day Quarter Day Quarter Day Quarter Day
Frequency of Occurrence (%) of Max. Quarter Day Rainfall 42 22 20 16
Frequency of Occurrence (%) of Max. 1-hour Rainfall 40 21 21 18
Ratio of Max. Quarter Day Rainfall to 24- hour Rainfall 67 53 51 55
Ratio of Max. 1-hour Rainfall to Quarter Day Rainfall 50 49 51 52
58. Contrast with non- sequential relations. The curves of figure 1- 6 should not be considered to have the same depth- duration relations as the curves in Technical Paper No. 25. In that paper the maximum data for each duration did not necessarily come from the same storm, whereas the relations shown in figure 1- 6 are based on increments of rainfall which did come from the same 24-hour period. Consequently, the 1- to 24-hour and 6- to 24-hour ratios, etc. , are slightly lower for the curves in this paper.
SECTION II. APPLICATIONS
59. Introduction. This Technical Paper has the primary purpose of presenting rainfall data in a manner convenient for hydrologic analysis and design criteria. It is no longer adequate for a field engineer to interpolate among a set of maps of point rainfall. The presently available degree of detail, and the introduction of areal and seasonal influences, have complicated his work so that in many instances he must use a combination of maps and diagrams in a rather long series of operations. After having read how these aids were prepared he is ready to use them, and by having them together in one section of the report he can easily find them for future use, without having to look through the entire report each time he needs to refer to the maps or diagrams. Hypothetical examples of a few representative problems are included with the maps and diagrams in this section of the Technical Paper .
60. Use of tabulated data with the maps. The tabulated data may be used in conjunction with the isopluvial maps in: obtaming the best possible registration of the map with the stations and drainage areas themselves. Where there are steep gradients or complicated patterns in the isopluvials and in the contours of a region, the tabulated station data serve as identifying bench marks. The station can be located on the ground and tied in with the station as shown on the map. If there are errors of printing registration, or of interpolation in the isopluvial pattern, adjustments can thus be made.
61. Need for judgment. Whether to use the smoothed values from the isopluvial maps, or wnetfier to usethe individual station data, or some combination of the two, depends largely upon local physiography. In a plain region there is little question but that the smoothed isopluvials give a better estimate, than single station data, of the rainfall regime of a locality. In a rugged region, while sampling error exists, much of the variation among nearby stations may be properly ascribed to orographic influences. The assessment of how much of the variation can be ascribed to physical influences may have to be done by a person familiar with local conditions who has more information of storm patterns, and who has observed orographic influences. He may evenbe able to transfer a localtopographic relationfrom a mountain slope where there are good data to a nearby but similar slope which lacks data.
62. The curves of figure 1- 5, and similar curves for additional durations, are shown in diagram D of figure 1- L The 30-minute curve is based on short record data from the Muskingum, Ohio network.-r2 The points for defining the 3- and 6- hour curves were interpolated between the 1- and 24-hour curves. The three examples shown in figure 1-1 include reductions for area. If the particular area of interest is large enough and the isopluvial pattern is complicated enough, it may be questioned what point in the area should be taken as. representative. The point value to which the area- reduction factor should be applied is the average point value in the area. For practical purposes the average point value can be determined adequately by inspection of the isopluvial map or maps.
15

63. Examples illustrating the use of the seasonal probability diagrams.
Example 1.
The 1-year 1-hour value of 1.3 inches for Nashville was estimated from a combination of figures 2- 2, 2- 5, and 2- 1. From figure 2-8, the empirical probability that the 1- year 1-hour rainfall will be equalled or exceeded in July of any one year is 30% or 30 chances out of a hundred. Similarly, the probability that Nash ville's 2- year 1- hour value of 1. 5 i,nches will be e_gualled or exceeded in any one July is 14% by interpolation. The difference (30% -14% = 16%) is the probability of occurrence in any one July of a 1-hour rainfall within the range 1.3 - 1.5 inches inclusive.
·Example 2.
Assume the snowmelt season to be :February through March and determine the probability of getting a rainfall of 1. 0 inches or more in one hour during this season, at a point near Asheville, North Carolina. For a first approximation, determine from the. isopluvial map the 2-year 1-hour value near Asheville to be about 1.4 inches. Referring to the seasonal probability chart for one hour for the 2-year return period, it may be seen that for February and March there is. about a 1% chance of getting 1.4 inches or more p_er hour (corresponding to the 2- year 1- hour return period) in each of these months, or a 2% chance of getting 1. 4 inches or more per hour during the two-month snowmelt season. Since the chances of equalling or exceeding 1. 0 inches is obviously greater than for 1. 4 inches, use the return- period diagram C for a second approximation, to get a rainfall value for the 1- year return period . At the point of interest near Asheville, (referring to the map of figure 2- 5) we find that the ratio of 100-year to 2-year rainfall is about 2.0. Multiplying 1.4 inches by the ratio, 2.0, to get the 100-year value, we then enter diagram C with the 2-year value, 1.4, and the 100-year value, 2. 8, and obtain a 1- year value of 1. 2 inches. Referring again to the seasonal probability chart -for one hour, the probability for February at the 1-year return period is a little less than 1% and for March about 3% - a probability for the two-month period of about 4% equalling or exceeding 1.2 inches. The probability for 1.4 inches or more is 2%, for 1.2 inches it is 4%, and,. one can safely extrapolate to the conclusion that the probabiJity of 1. 0 inches is 5%. In other words, the probability of 1. 0 inches or more of rain per hour during this hypothetical snowmelt season is 5%; this rate of rainfall will be equalled or exceeded in one season out of twenty.
Example 3.
Consider the problem of what infiltration and other loss is necessary in the three summer months for the runoff to equal that in the three winter months, assuming 100% runoff in the winter, with a 10-year 6-hour rainfall. From the maps and diagrams it is determined that the 10- year 6- hour rainfall for this watershed is 3. 0 inches. For June, July, and August, in the 6-hour seasonal probability chart, at the 10-year return-period level, the percentage values are about 1, 4, and 3, respectively, giving a total of 8% probability of 3. 0 inches being equalled or exceeded during the three- month summer season of any one year. For equal probability in the three.-month winter season, in the 1-yearreturn period, the seasonal probability chart for December, January, and February gives values of 3%, 1%, and 2%, respectively, which is a little low compared with the total of 8% for summer. However, this is at the limit of the ~hart.. Using diagram C, with 3. 0 inches at the 10- year level and the hypothetical value of 1. 8 inches (from the isopluvial map) for the 2- year value, read 1. 4 inches for the 1-year value. Since there is only a 6% chance of this value being equalled or exceeded in wintertime and the 8% value is a little smaller, it can be inferred that the infiltration and other loss must be at least the difference between 3.0 and 1.4 inches, or 1.6 inches.
Example 4.
As an example where interpolation between durations is necessary, consider example 1, table 1-2 (of figure 2-1) where the 25-year 3-hour rainfall is estimated to be 3.3 inches. If the probability of occurrence for July is required, 1.3 and 0.8% are estimated from the 1- and 6- hour seasonal probability charts, respectively. The 3-hour probability is then interpolated to be 1. O% or one chance in a hundred of equalling or exceeding a 3- hour rainfall of 3. 3 inches in July of a particular year.
16

REFERENCES
1. United States Department of Agriculture, Miscellaneous Publication No. 204, 1935.
2. United States Weather Bureau, Climatological Record Book, 1890-1951.
3. United States Weather Bureau, Form 1017, 1890-1950.
4. United States Weather Bureau, Climatological Data, 1897-1954.
5. United States Weather Bureau, Hydrologic Bulletin, 1940-1948.
6. Tennessee Valley Authority, "Precipitation in the Tennessee River Basin", 1938-1955.
7. United States Weather Bureau, "Rainfall Intensities for Local Drainage Design in Western United States", Technical Paper No. 28, November 1956.
8. California Department of Public Works, Bulletin No. 5, "Flow in California Streams", 1923.
9. E. J. Gumbel, "The Return Periods of Flood Flows", The Annals of Mathematical Sta-tistics, Volume XII, June 1941, pp. 163-190. ·
10. United States Weather Bureau, "Rainfall Intensity-Duration- Frequency Curves for Selected Stations in the United States, Alaska, Hawaiian Islands, and Puerto Rico", Tech-nical Paper No. 25, December 1955. -
11. Corps of Engineers, United States Army, "Storm Rainfall in the United States", February, 1954.
12. United States Soil Conservation Service, "Precipitation in the Muskingum River Watershed", by 30 Minute Periods, Muskingum Climatic Research Center, New Philadelphia, Ohio, July 1938 -June 1939.
17

.... 00
90• 40•
82'
o•• SS'
87
' ~ SS' s•• SPRlN~lECD C~~u~r• ZANESVILCE cOCKlO SPRlNOFJEcO WS AP WTR WKS
. ' · WAVEcAND. cEWlSVlLiE 2N r:5 SflfRLuroGAS;;;;;;; STN SPRlNOFIEcO W8 CITY • INDIA NAP • OREENFlEcD «N'tA OCD TOWN • '.
J MONTEZUMA INDIANAPOLI~ W: AP HWY GAR WTR WKS
I • PARIS swfPt.TJTERREHAUTE GRE~NCASTL£
J 8 WB CITY 0 BRAZIL WTR WKS . ITE~RBEAHlUTE
( ISPENCE.STA p:.s'',I'i'b"ri""• j'JASONVII.LESTAPK
R'r.HV!EWO
cet( .•
' WESTPHALIA •
EVANSV~LE WBAP
' ./W.FRANKFORT8E ,- f'. _, """' EXCAY
'\ . • • DACATIA IW • f'---... )... ....... / ~ a."EWOURGHARCN'O
... ~RPHVSe:.o WTR WKe ~'~ .UNIONTOWN 0AM49 OWEJr.RO
~1~ J {(;"'+ 0AM48
~t~ GcENDAcE EXP FARM ~,."':\! ~ 1 • v-- ~~RoS fERRY DAM !10
, . ~OLCONDAOAr.itSJ MAOISONVILLEISE
I I I . \ \ . -...... ' \COIRO / ......... I · \ )2.9!!1TY/ PAOUifAH SCS'NUR~cRY
•~k_ENTUCKY_OAMTVA
FRANKLIN WTR WKS
• AOOLPHUSIN I .--- """:',.,...._ __ .._ -- KE.NTUCKY
.· .• ~ORTLAND ---fENN£sffi--
0..
BUCHAN,NTVA4!16
0AKGRO,.TVA:!I9
REAGANTVA31 •
"" DICKSON • ··CUBALANOINGTVA29
• SUGAR HILl. TVA:!O:I
s.p:Aot~rOVE
esPRINGFIEI.DEXPSTN
C'i_'6~~A~E·
LEB~NON eNASHVILLEWBAP
MURFREESBORO •
LEWISBURG EXP STN • MANCHES~R
DALE tt!t.OWDAM
l.IVING-=TON
OCOOKEVILLE
esur't'i'I~~LLE
.WILMINGTON PWRPL.T
e,SUTTON3SE
VALLEY HEAD.
WEBST~R SPOS
esuMMER9:VtLLE2. MARL\NTON0
. '•SOLI~ . SAVANN~HTVA'<A SELVIDE.ETVASG
----- -=-- _.J __ :... -P~~N:.:•!'_ j __ ~.:::o:v:::~-~--L ___ _::~·=L...:::~~::~~~:ffi~ili~l~~~'£:C~~~~~~~:::~=~~:;----_:.....~~~~:~~===; 89" _ · ee• er• --A
PREPARED BY
COOPERATIVE STUDIES SECTION HYDROL<)GIC SERVICES DIVISION
LEGEND
2-YEAR I-HOUR RAINFALL WEATHER BUREAU
WASHINGTON, D. C. OCTOBER, 1956
Figure 2~~·
e RECORDING-GAG£ STATION
ISOPLUVIALS OF 2-YEAR I-HOUR RAINFALL IN TENTHS OF AN INCH.
STATUTE MILES 10 01020304050 I I I I I I I I

..... CC)
so•
~============~~====~------~-----,------~~------------~------------~~,-----~~~~~~--~~~~~~~ ... ~--~~~~;;,~----r-~r-~~~~l•o• us• e3•· sz• 40• 88• 87• 86• 84• • COLUMBUS C07.U US WB AP ,. ZANESVILLE LOCK 10 .
(
SPRINGFIELD WBCI~Y SPRINO~I,El.O WB AP . J WAVELAND. LEWISVILLE 2N WTR WKS • CARROLL H'ttY DEPT C~LD~:eeoH~JEJ-J>p~WY ~P'C SPRINGFIELD WB CITY I • MT STERLING GAS PUNt' :11"1 ./ I I .ROKEBY .;. I MT STERLINGGASPUNP STH
BROWNSVILLE 'HE • 8MASON
SULLIVANWTRWICS •
eHUNSOLOT
REAOA~TVA:SI
r: ~~ WESTPHALIA
~~~ . ( .:2 V~~CRE~~~S.
I
~CARMELWTRWKS r,J"' ..
) ePOSEYVILLEISW
'
•SUGAR HILL
TVASOS
s.p,: ... ok'hROVE
GRE~CASTLE
HONDA~i~~kLLE • RAYWICK
LEWIS~RG EXP STN
MILLERS:,RG
LEXINOTONWB AP . LOGLICKIS.
•'-t~~~E8H!CICMAH
8ER~ACOL
• X~~~A :if TOWN •
MOREH~OSTACOL
evALE
• HE(~~~~:RG
. . l.• BOLIVAR SAVANN~H TJVA34A I BELVIOERE TVA 60
••. 7
__ .,c:::::8_q~--- , PICkWICI<2NRTV .. 9 '•VICTORYTVA<O • CHATTANOOGAWBAP Bl
90 ••• -:--.----:---- .;:----------~,. ·"-. •••
2-YEAR 6-HOUR RAINFALL
PREPARED BY COOPERATIVE STUDIES SECTION HYDROLC)GIC SERVICES DIVISION
WEATHER BUREAU
WASHINGTON, D.C. . OCTOBER, 1956·
· Figtll'e 2-3.
LEGEND e RECORDING-GAGE STATION
ISOPLUVIALS OF' 2-YEAR 6-HOUR RAINFALL IN TENTHS OF AN INCH.
STATUTE MILES 10 0 !020304050 I I I I I I I I

·t!
40• tll;:l• ... 87•
,,_.,,..~LDWBAP. as• as• I .
I WAVELAND. ..1. l'nllllloiAII<t
• L!WISVH.t.E 2N
J MONTEZU INOIANAPOL.IS.WB.ITY • GREENFIELD •
010NA8
•e:cnN~~AM
NEWTON
LOUIS,.LLE
CISN~BR;NCAMP
I'~IR~ELO
PARIS sw!'Pt.T f ORE STLEINOIANAPOLIS We'AP HWY GAR
T£RREHAUTE 1 .•:c•TYesR~z•t.WrRw~es ITE~~I!:fpAUTE
( ISPENCE.~A p~ARTI:SYILLE . /JASONVILLE STA PK STA FOR
IUT:SONVIU.E( ••
I' ,..I
' ~~~ WEST;ALIA
'i\~ 9u ..
,Jv*~~E~~iS. (
.,;;!CARMELWTRWICS ,'
NASHVJLLI!:STAPIC.
• 02Jc~T~~f3RDUE
esHOALSHWYl!IOBRG
PAOLI,.,:OAR
.JASPER PWR PLT PALMYRA •.
,. ) .• POSEYVILLEISW
'
• SUOARHILL TVASOS
Sf.tlk~ROVE
CONSTANTINE . ~ g~~~i~TS FORo BRO.
LEWIS~RGEXPSTN/MANCHES~R
HOJlA~i.~~kL.LE .RAYWICK
8MUNFOROV!Lt.E
eft.EhiiNGSBUMPO
MOREH~OSTACOL
SALYERSVILLE.
8 HELgg~~:Ro
HAZARD8
LAY.INJi
1.,
e o\~ ~ J; .... , "11
'~j~"' \, ~HUtmNoTON2
,~ .. ' LOUI.SA LOCK3"
I
'* • x,p.). DAVELLA~'1-~~~
OAIC HIL:L .•
esurroN,SE
HALL •
VALLEY HEAD •
WEBST~RSPOS
esuMMERii'IILL£2 MARLINTON.
(~~~ \.._.:.." FLATTOP.• I UN\0···
PIKEVILLE '• +'/ . "" ~~%'> N~RLEY ,,.\1)-;""'\...;"
~~f.~f:J 1"\ ... , ···;"\ .. ~~,;:..~ , ..... __ ,.,i' .... ., 'J\
JENKt.Ns · . I ewHtTEOATE
HONAKE:RTVA6t4SPRINGCREEKTVAl!l55
LEXIN~ON7N
8NOORESVIt.LE
BADIN . . MTPt.EASANT . • "J<j
~-...... Zl' ••
• !Jib ,o,t.Tv , - ~ .-/ f I -·· J .VICTORYTYA40 "" I ~TYAIOO!f~P~TYAI, %' ~ wn ._._;,;_____ _ _______ _;_ __ I I f ( R.A"rh ;o2e
. - -BEt.VIOE~E TVA 60 .
2-YEAR 24-HOUR PRECIPITATION
~·· PREPARED BY
COOPERATIVE STUDIES SECTION HYDROL<)GIC SERVICES DIVISION
WEATHER BUREAU
WASHINGTON, D.C. OCTOBER, 1956
Figure 2~4.
LEGEND e RECORDING-GAGE STATION
ISOPLUVIALS OF 2-YEAR 24-HOUR PRECIPITATION IN TENTHS OF AN INCH.
STATUTE MILES 10 0 10 20 30 40 so I I I I I I I I

N . ....,.
90• 40• 89• ...
- - ~ - ~ w SPRINGFIEt.OWBAP . ' J OAYTONWB/IP • COLUMBUS
SPR"'GREU> WB CITY I WAVELAND. LEWISVilLE •• • S\,",'~·:~~LD WB ClrY
MORRISONVILLE •
VANDALIA.
RICHVIEW.
I
;;;/; "'" ~~I..~
SULLIVANWTRWKS • DIONA.
eecnNi~AM
LOUIS,LLE
CISNE BROWN CAMP • F!'IR~ELO
;-LOEN CAA AP 4NW '\!J~Iq~
f/_,L -- -1--'----- --.l \ . .U.NIONCITY2SE
_)SANau'a Wu .. ot.IFE ":, REF.
~ /
BIJCHAN,NTVA41$6
.GREENFIELD
OY~SBURG
I MON~bUMA INDIANAPOLIS WBfiiTY • GREENFIELD • MT STERLING GAS PUMP STN
J • INOIANAPOLt:'WB"AP HWY GAR ·)C~~~A.:KLJ> TOWN •
~ARIS SW~ PLT I TERRE HAUTE GREENCAST~E • CIRCLEVILLE •
, J • WS CITY • BRAZIL WrR WKS LOGAN HWY DEPT NEW U OA MORAS ,t J TERR:-HAUTE LEBANpN HWY DEPT • WILMINGTON PWR PL.T MARlETT:. LOCK I
(" WBAP I HAM(L ofwTRWKS • aREENFIIjOWTRWKS ATHENS •••• !ESVILLE ,-_....,..-
>JASONVILLE STA PK I SH RO~ILLE NR STMARTIN URSULINE SCH UCARTH"; HWY OEPT / J PA':)'a'~l~~RG "SONVILLE (. • ·,;~ijU.:"uB~ I -CINCIN ATI WB CITY • ·H~\';,S~~~O ALMA SCIOTO TRAILS FOR ( MAC FARLAN
' V~~~A~'i<'sES. ~ ' ~ OHCINHATI LUNriN AP JACKSON.;WY DEPT . ( •
• HALL F·REENANSBURG • •
DICKSON .
• O~~~T~5tJ'~ROU£
esPRINGFIEi.OEXPSTN
C1_'6b~A~E·
LES~NON 8NASHVILLEWBAP
•~w.:.rg~:
0\..IVEHIL.LINWe
MOREH~OSTACOt.
.YALE
SALYERSVILLE.
SER~ACOL eHElS~~'iRG
HAZARD.
' \ !/ LIVE~OOL et.OCKNEY
eTRIBSLE esuTTON:!SE
VALLEY HEAP. . WEBSTER SPOS ..... _\ j..,~
\o. ""UNTINGTON2
Ct.AY2.
I
~ eGRIFFITHSVlt.LE
~ . \ LOUISA t.OCK3" ''- /
,T t • ,x .. _,. LOGAN • NAOMA IE ~ OAVELLA"''~-;o{-s> I c>~
4 JORDA\MIN-
PIKEVILLE \_ FLAT TOP. UNION. (
•• +'/ ·" . ~-%~··~RLEY • \"\')./"'\.,/
:;~~~, I \... ··A:~ ,.~>!, . .::'<~ ,,_, ' .... ._J' .... , '~~'\R"
JENKINS 8WHI~E GATE
HONAKERTVA614 SPRINGCFIEEKTVA30li .PULASKI CAAAP .
LEXIN~ONTN
BROWNSVILLE SHE • 8MASON
eHUNBOLDT
OAKGROIJETVAS/9 . REAGA~TVA31
.CUBALANOINGTVA29
• SUGAR HILL TVA!I05
s.p:Aot~ROVE
MURFREESBORO •
LEWISBURG EXP STN . WANCHES~R
eSUTIIIv':_'l~iLLE
ewoORESVIL.t.E
MTPL~ASANT BADIN •
eaot.IVAR SAVANN~H TJVA34A l ___ ~·:·L:VI:OE:RE~Tv:•:••L_.:.:_:~:~~~:ffi~~~:r~~~~~~~~~q;:~~===~~:---_:_-~=;~=:~:~==~ • CHATTANOOGA WBAP el 91" , __ :.__·=:~·:.:-!'_ __::_IC~O::~:::____ • ·"'-. ~URPH:.~VA136 "'" -~· •••~ ag• as• , .....
PREPARED BY
COOPERATIVE STUDIES SECTION HYDROLOGIC SERVICES DIVISION
LEGEND .RECORDING-GAGE STATION ISOPLETH$ OE,IOO-YEAR I-HOUR TO 2-YEAR I-HOUR RAINFALL. RATIO OF 100-YEAR I-HOUR TO
2-YEAR I-HOUR RAINFALL WEATHER BUREAU
WASHINGTON, D. C. OCTOBER, 1956
Figure 2-5.
STATUTE MILES 10 01020304050 I, I I I I I I

N N
BROWNSVILLE 5NE . 8MASON
DIONA.
OEEX!"i~AM
LOU/S,LL.E
CISNE BROWN CAMP • F~IR~ELO
BUCHAN,NTVA456
.GREENFIELD
.HUMBOLDT
0AKGROVETVA519 . .
REAGA~TVA31
8BOLIVAR SAVANNAHTVA34A
... 87•
• I PARLSSWGPLTITERREHA~.
I e: CJ \ e BR~ZLL WrR WK~ fTERAEHAUTE
r' •.•" ~JASONV!LLE STAPK
IUTSONVILL£( . O
' ~ ~~ WESTPHALIA
;,~ . ~·;NCENNES.
( WTR W-KS •
I
.,::!CARMELWTRWKS ,,'
r,J .. ) ePOSEYVILLE ISW
) EVANSV~LE WBAP
DICKSON • -·CUBALANOINGTVA29
•SUGAR HILL
TVA 50:$
. s.p:,p~8<t,ROVE
~ - - --···--· ···- ·- - ~nt.llMBUS ZANESVILLE l.OCKIO
NOR~~Aes:: ST~ •
.HARRIMAN TVA484
8YALE
SALYERSVILLE.
• HEIDELBERG LOCK14
HAZARD.
LAKINJi
I.e r~r o\~
;- I; '"\. . o{J-
\ . ./~~ '-~uNntioroN2.
~-(
. "\ \ LOUI_SA~OC~~
/ f
·) ' I \
IJ LIVE~OOL
8Tft!BBLE
CLAY2 •
0CHARLESTON:5
8GR\FFITHSVIU.E
8L.OCKNEY
,J
/ JO)'I:OAN~LN£Se
/~
LEXIN!ON7N
MT PL~ASANT BADIN •
PICKW<I< 2NRTVA; J eviCTORYTVA 40 l.AURELMTNTVA~09 8';:~':...., _______
8
;: _______ _.:,.__ .Gl.ADEOAPTVAI~2 .,,.o .,~~~•~•ro
RATIO OF 100-YEAR 6-HOUR TO
2-YEAR 6-HOUR RAINFALL
COOPERATIVE STUDIES SECTION HYDROLOGIC SERVICES DIVISION
WEATHER BUREAU
. WASHINGTON, D.C. OCTOBER, 19156
Figure 2-6.
LEGEND e RECORDING-GAGE STATION
ISOPLETHS OF /00-YEAR 6-HO/JR TO 2-YEAR 6-HO/JR f?AINFALL,
STATUTE MILES 10 0 10203040l50 I I I I. I I I I

N w
- -- - - - ~ - - - - . -SPRINGF,DWSA\ I . SPRIN!I~D C~~U~W~' COLUNSUSWSAP ZANES'It~Lp.~oo: / ~i~
SPRINGFIELD wa c•r~ . '\ 1 WAVELAND • t.Ewasv•t..t.E 2N wrR wK \ • - wooosFIEt.o Hwv DEPt 1 ;;. J i T -"1 \ • CALDWELL HWY DEPT • • • -
,-0 8 INDIANAPOLIS W8 CITY • GRE N MT ERLING GAS PUMP STN eROKESY • J ----• X. .. I MONTEZI,JMA 8 • HW~ :~~LD • XENIA 0 0 TOWN 8 . LOCK 8 HUNDRED
I INDIANAPOLIS WB' AP WTR W · DUFFY DAM I~ . . , .
MORRISONVILLE •
LOUIS,LI..E
CISNE 8ROWNCAMP • Ft'IR~ELD
OAKGROVETVASI9 . .
REAOA;.TVA31
SAVANN:,HTVA3 4 A
ARIS SWG PLTITERRE HAUTE GREENCASTLE
, : T£=R~H:~:E· BRAZIL WTR WKS
(" WS AP
>JASONVILLE STAPK
SONVJlJ..E( •
'
DICKSON .
WESTPHALIA .
s.p:lk~roVE
SPENCERSTA PK 8 8 MA5R1liNF~V~LLE
NASHVJLLESTAPK8
• O~~~T~'iFf.,YRDUE
8 SHOALS HWY,08RG
PAOLI~GAR
PALMYRAO .JASPER PWR PLT
CONSTANTINE . 0 ~~~~ifrs FORO BRG.
0SPRINGFIELOEXPSTN
c't~~~~Ee . LEBANON
0NASHVILLEWBAP
MURF;ESBORO
LEWISBURG EXP STN . MANCHES~R
STOM~RNR
e;~~u:ue~
v~;~A~~LlS•
OsHEJy"'g~~
,.-... ..... ) C1_'b~~H-TOH
~~-;~.J, ~Q'~ SMITHF;t.04S
j':t.;UISVILLE WB c;TY
1 8t.OUISVILt.E we AP
I
. HOrfA<}~N~~Lt..E
• SUMMITVILLE TVA443
LAKINJi
ri o\:
.... , fl.; \ ~'" '-~u:ruioroN 2
~··. (' \.
NEW MATAMORAS-/
MARIETTA~t'c111K1f 1',. ! -'
MESVILLE I '-"'
.,,JPARKERSBURG t' WB CITY
·) hiACF~LAN
' ' \ ~LIVE~OOI..
8TRIBBLE
Ct.AT2.
8CHARLESTON3
8GRIFFITHSVILLE
8NAOMAIE
SMITHBURG . TYGART OAM8 . CLARKSBURG I
0 HALL F·REEMANSBURG • •
.LOCKNEY
8SUTTOH3SE
VAI.t.ETHEA08 . WEBSTER SPGS
•sUMI!IER5ViLLE2. MARLINTON8
/,J JO~OAN"'IHE:Se
UNION • . < ••••r '"·,~_.."'\..."
ts ~/ '"\ ... ~~~;;J~
J +f.8- . BELVIOERE~A60 ---p=:~N=A~- -- 0VICTORY~40 . CHATTANOO~AWBAP • S(
89•. ee• --- -----...... ~ ~-~ ··-··
RATIO OF 100-YEAR 24-HOUR TO
2-YEAR 24-HOUR PRECIPITATION
PREPARED BY
COOPERATIVE STUDIES SECTION HYDROLOGIC SERVICES DIVISION
WEATHER BUREAU
WASHINGTON, D. C. OCTOBER, 1956·
Figure 2-7.
LEG£NO RECORDING-GAGE STATION
ISOPLETH$ OF 100-YEAR IN-HOUR TO 2-YEAR 24-HOUR PRECIPITATION.
STATUTE MILES l00l0203040t;() I, I I I I I I

Table 2-1. Station Data (2-Year 1-, 6-, and 24-Hour)
Period Length 2-Year 1-Hour 2-Year -6-Hour 2-Year 24-Hour STATION Lat. Long. of of Record
Record (years) (inches) (inches) (inches)
ARKANSAS
Blytheville 35-56 89-55 1939-54 16 3.29 Burdette 35-49 89-57 1943-54 12 4.07 Osceola 35-43 89-58 1939-54 16 3.32
ILLINOIS
Albion 38-22 88-03 1943-54 12 3.37 Anna 1 NW 37-28 89-15 1939-54 16 3.71 Belleville, Scott AFB 38-32 89-51 1945-54 10 4.04 Belleville, Scott AFB 38-32 89-51 1940-50 11 1.48 2.71 3.47 Benton 38-00 88-55 1939-54 16 3.41
Brookport Dam 52 37-08 88-39 1939-54 16 4.03 Carbondale Sewage Plant 37-44 89-12 1939-54 16 3.ll Cairo WB City 37-00 89-10 1903-51 49 1. 57 2.58 3.72 Carlinville 4 E 39-17 89-49 1939-54 16 3.25 Carlyle 38-36 89-22 1940-54 15 3.56
Carmi 38-06 88'-10 1939-54 16 2.92 Carpenter 1 sw 38-53 89-54 1940-50 ll 1.44 2.78 3.90 Casey 39-18 88-00 1939-54 16 3.13 Centralia 4 W 38-31 89-12 1948-54 7 3.48 Charleston 39-29 88-10 1897-54* 57 3.02
Chester 37-54 89-49 1897-54* 57 3.38 Cisne Brown Camp 38-31 88-24 1945-50 6 1.40 2.18 3.43 Collinsville 38-40 89-59 1941-50 10 2.02 3.34 4.33 Coulterville 38-ll 89-36 1941-50 10 1.31 2.09 3.19 Decatur 39-51 88-58 1897-54 58 3.00
Diona 39-22 88-08 1945-50 6 1.63 2.28 3.20 DuQuoin 2 S 38-00 89-14 1939-54 16 3.12 Edwardsville 38-49 89-58 1939-54 16 4.24 Effingham 39-07 88-33 1939-54 16 3.12 Effingham CAA AP 39-09 88-32 1942-50 9 1.38 2.27 3.62
Elizabethtown 37-27 88-18 1942-54 13 3.78 Fairfield 38-23 88-22 1939-54 16 3.06 Fairfield 38-23 88-22 1940-44 5 1.36 1.99 2.87 Flora 38-40 88-28 1939-54 16 3.02 Galatia 1 W 37-51 88-37 1940-50 ll 1.55 2.73 3.82
Glendale Experiment Farm 37-26 88-41 1950-54 5 3.24 Glendale Experiment Farm 37-26 88-41 1941-50 10 1.64 3.10 4.39 Golconda Dam 51 37-22 88-29 1939-54 16 3.40 Golconda Dam 51 37-22 88-29 1940-50 ll 1.44 2.82 3.58 Grand Chain Dam 53 37-12 89-02 1939-48 10 4.08
Grand Tower 2 N 37-40 89-30 1941-54 14 4.32 Greenville 38-53 89-24 1897-54 58 3.13 Greenup 39-15 88-09 1942-54 13 3.01 Harrisburg 37-44 88-32 1939-54 16 3.38 Harrisburg Disposal Plant 37-44 88-31 1948-54 7 2.65
Hillsboro 39-09 89-29 1939-54 16 3.22 Hutsonville 39-07 87-40 1940-50 ll 1.45 2.46 3.25 Hutsonville Power Plant 39-06 87-40 1948-54 7 2.96 Lawrenceville 38-44 87-41 1943-54 12 3.36 Louisville 38-46 88-30 1940-50 ll 1.30 1.92 3.02
Marion 37-44 88-55 1942-54 13 3.67 Marshall 39-23 87-42 1940-54 15 3.05 Mascoutah 38-29 89-48 1897-53 57 3.36 Ma.ttoon 39-28 88-21 1948-54 7 3.23 McLeansboro 38-05 88-32 1897-54 58 3.44
Morrisville 1 E 39-25 89-26 1939-54 16 3.17 Morrisville 39-25 89-27 -1941-50 10 1.54 2. 55 3.04 Mt • Carmel 3 N 38-27 87-46 1898-54* 56 3.47 Mt. Carmel Water Works 38-25 87-45 1940-50 ll 1.36 2.21 3.32 Mt. Olive 2 NE 39-04 89-42 1941-54 14 3.18
Mt. Vernon 4 N 38-22 88-55 1939-54 16 3.07 Murphysboro Water Works 37-46 89-19 1940-50 ll 1.58 2.48 3.49 Nashville 3 NW 38-23 89-25 1939-54 16 3.49 New Burnside 37-35 88-46 1897-54 58 3.68 Newton 39-00 88-10 1939-54 16 2.75
Newton 39-00 88-10 1940-50 ll 1.36 2.12 3.03 Olney Radio Station 38-43 88-04 1897-53 57 3.26 Palestine 39-00 87-37 1939-54 16 2.93 Pan a 39-23 89-05 1939-54 16 3.26
' P!i.ris Water Works 39-38 87-42 1939-54 16 2.99
Paris Sewage Plant 39-37 87-41 1940-50* 10 1.44 2.ll 2.48 Richview 38-22 89-11 1940-50 11 1.46 2.54 3.88 Ste. Marie 38-56 88-01 1948-54 7 2.96 Salem 38-37 88-57 1939-54 16 3.19 Shawneetown, New Town 37-43 88-10 1939-54 16 3.78
Sidell 39-55 87-49 1948-54 7 3.14 Sparta 38-08 89-42 1939-54 16 2.98 Springfield WB AP 39-50 89-40 1948-54 7 2.75 Springfield WB AP 39-50 89-40 1941-50 10 1.86 2.59 3.32 Springfield WB City 39-48 89-39 1903-50 48 1.45 2.17 2.98
' *Breaks 1n Record
24

Table 2-1, cont.
Period Length 2-Year 1-Hour 2-Year -6-Hour 2-Year 24-Hour STATION Lat. Long. of of Record
Record (years} (inches} (inches} (inches}
~(continued}
Sullivan Water Works 39-34 88-37 1940-50 ll 1.58 2.28 3,00 Taylorville 39-33 89-18 1941-54 14 2.87 Tuscola 39-48 88-17 1939-54 16 2.94 Vandalia CAA AP 38-59 89-10 1939-54 16 3.22 Vandalia 38-58 89-07 1940-50 ll 1.56 2.55 3.30
Virden 39-30 89-46 1941-54 14 3.25 Waverly 39-41 89-57 1939-45 7 3.34 Wayne City 38-21 88-35 1948-54 7 3.26 W, Frankfort 8 E 37-52 88-48 1941-49 9 1,68 2.71 4.01 Wilcox 38-38 88-18 1948-54 7 3.32
Windsor 39-26 88-36 1939-54 16 3.12
INDIANA
Batesville Water Works 39-18 85-15 1945-50 6 1.21 2,35 3.37 Bedford 38-51 86-30 1939-54 16 3.19 Bedford 4 SW 38-50 86-32 1945-54 10 3.10 Bloomington, Indiana University 39-10 86-30 1939-54 16 3.17 Boonville 2 E 38-02 87-15 1939-54* 13 3.24
Bowling Green 39-23 87-01 1948-54 7 2.87 Brazil Water Works 39-31 87-08 1945-50 6 1,48 2.44 3.50 Brookville 1 S 39-25 85-01 1939-54 16 2.88 Cambridge City 39-49 85-ll 1939-54 16 2.98 Centerville AP 39-49 84-58 1941-46 6 1.48 1.95 2.60
Columbus 39-12 85-55 1939-54 16 3,58 Columbus Power Substation 39-12 85-55 1940-50* 10 1.06 2.01 3.07 Crane Naval Depot 38-52 86-50 1945-54 10 3,80 Cypress Dam 48 37-50 87-40 1939-54 16 3.35 Edwardsport Power Plant 38-48 87-14 1939-54 16 3.30
Elliston 39-02 86-58 1939-54 16, 3.52 Evans Landing Dam 43 38-00 86-00 1939-54 16 2.80 Evans Landing Dam 43 38-00 86-00 1940-50 ll 1,38 2.21 3.08 Evansville WB AP 38-02 87-32 1903-51 49 1.54 2.36 3,34, Farmersburg 3 SW 39-14 87-25 1939-51 13 3.22
Ferdinand State Forest 38-15 86-47 1940-50 ll 1,60 2.10 3.08 Franklin 39-29 86-03 1939-54 16 2.84 Franklin 39-29 86-03 1942-50 9 1.51 2.37 3.32 Greencastle 1 E 39-39 86-51 1939-54 16 3.67 Greencastle 39-39 86-51 1940-48 9 1,33 1.95 2.86
Greenfield 39-47 85-46 1939-54* 15 2.62 Greenfield Highway Garage 39-46 85-47 1940-50 ll 1.20 1.97 2.50 Greensburg 3 SW 39-20 85-33 1939-54 16 2.78 Hazelton Gravel Plant 0 38-30 87-32 1939-48 10 2.88 Henryville State Forest 38-33 85-46 1939-54 16 2.92
Huntingburg AP 38-16 86-57 1939-54 16 3.17 Indianapolis Monument Circle 39-46 86-10 1939-54 16 2.94 Indianapolis WB City 39-46 86-10 1903-51 49 1.47 2.30 2.87 Indianapolis WB AP 39-44 86-16 1939-54 16 2.64 Indianapolis WB AP 39-44 86-16 1941-50 10 1,31 2.10 2.66
Jasonville State Park 39-11 87-15 1942-50 9 1.60 2.43 3.28 Jasper Power Plant 38-23 86-55 1945-50 6 1,50 2.55 3,19 Jeffersonville 38-16 85-45 1897-54 58 3.08 Johnson Experiment Farm 38-16 87-45 1939-54 16 2.99 Knightstown Water Works 39-47 85-32 1948-54 7 2.75
Laurel (nr) 39-30 85-ll 1940-48 9 1.13 1.72 2.56 Leavenworth Dam 44 38-11 86-20, 1939-54 16 3.73 Leavenworth Dam 44 38-12 86-20 1940-50 ll 1.48 2.67 3.65 Lewisville 2 N 39-50 85-21 1945-50 6 1.25 2.05 3.23 Madison 38-44 85-23 1897-54 58 3.17
Marengo 38-23 86-21 1939-44 6 2.68 Markland Dam 39 38-47 84-58 1948-54 7 2.72 Martinsville City Hall 39-25 86-26 1939-54 16 2.90 Martinsville State Forest 39-20 ' 86-25 1940-50 11 1.52 2.39 3.02 Mauzy 39-37 85-20 1939-48 10 2.64
Montezuma 39-47 87-22 1942-50 9 1.37 2.16 2.80 Moores Hill 39-07 85-06 1902-54 53 3.14 Mount Vernon 37-56 87-54 1897-54 58 3.38 Nashville State Park 39-10 86-13 1945-53 9 3,68 Nashville State Park 39-09 86-13 1941-50 10 1,78 2.52 3,36
Newberry Highway St, Bridge 38-56 87-01 1948-54 7 3,07 Newburgh Archeological Excavation 37-57 87-27 1945-50 6 1.79 2.68 3.95 Newburgh Dam 47 37-57 87-24 1939-54 16 3.10 New Castle 39-56 85-22 1950-54 5 2.71 New Harmony 38-08 87-56 1939-54 16 2.93
North Vernon 39-01 85-37 1939-54 16 3,35 Oaklandon Geist Reservoir 39-54 85-59 1948-54 7 2.81 Oolitic Purdue Experiment Farm 38-53 86-32 1941-50 10 1,40 2.03 2.79 Palmyra 38-24 86-07 1940-50 ll 1.54 2.29 3.38 Paoli 38-34 86-28 1898-54 57 3,34
Paoli Highway Garage 38-34 86-29 1940-50* 10 1.28 2.21 3,00 Pendleton Reformatory 39-59 85-45 1945-54 10 3.92
*Breaks in Record
25

Table 2-1, cont.
Period Length 2-Year 1-Hour 2-Year ·6-Hour 2-Year 24-Hour
STATION Lat. Long. of of Record Record (years) (inches) (inches) (inches)
INDIANA (continued)
Petersburg 61 Bridge 38-31 87-17 1939-54 16 3.88
Poseyville 1 SW 38-10 87-48 1942-49 8 1,57 2.19 3,25
Princeton 1 W 38-21 87-35 1897-54 58 3.24 Richmond AP 39-46 84-50 1948-54 7 2.92 Richmond Water Works 39-51 84-51 1939-54 16 2.72
Richmond Water Works 39-50 84-51 1940-50 ll 1.46 2.06 2.96 Rockville 39-46 87-14 1939-54 16 3.31 Rushville Sewage Plant 39-36 85-27 1949-54 6 2.62 Salem 38-37 86-06 1897-54 58 3.17 St. Orner (nr) 39-26 85-36 1940-48 9 1.49 2.ll 2.69
Scottsburg 38-42 85-47 1897-54 58 3.26 Seymour 2 N 38-59 85-54 1939-54 16 2.96 Seymour Highway Garage 38-58 85-53 1940-50 ll 1.17 2.13 3.07 Shelbyville Power Plant 39-32 85-46 1939-54 16 2.87 Shoals Highway 50 Bridge 38-40 86-48 1939-54 16 3.05
Shoals Highway 50 Bridge 38-40 86-48 1942-50 9 1.52 2.10 3,23 Spencer 39-17 86-46 1948-54 7 3,25 Spencer State Park 39-16 86-43 1940-50 ll 1.38 2.61 3.06 Tell City Power Plant 37-57 86-46 1939-54 16 3,40 Terre Haute WB AP 39-27 87-18 1912-51 40 1,58 2.63 3,47 Terre Haute WB City 39-29 87-24 1940-46 7 1.72 2.60 3,15
versailles Water Works 39.:.05 85-13 1940-50 ll 1.33 1,88 2.85 Vevay Dam 39 38-44 85-05 1939-47 9 2.74 Vincennes 38-41 87-33 1939-54 16 3.26 Vincennes Water Works 38-42 87-31 1940-50 ll 1,33 2.42 3.23 Washington 38-40 87-ll 1939-54 16 3.34
Waveland 39-52 87-03 1945-50 6 1.30 2.02 2.63 W. Baden Springs College 38-34 86-37 1947-54 8 2.90 Westphalia 38-51 87-13 1940-46 7 1.31 2.45 2.95 Williams 'Power Plant 38-48 86-39 1939-54 16 3,18
KENTUCKY
Addison Dam 45 37-55 86-34 1939-54 16 3.28 Addison Dam 45 37-55 86-34 1940-50 ll 1.68 2.59 3,43 Adolphus 1 N 36-39 86-16 1940-50 ll 1.44 2.42 3.23 Allen 37-35 82-43 1949-54 6 2.60 Anchorage 38-16 85-33 1901-54 54 3.41
Ashcamp 37-16 82-26 1949-54 6 2.47 Ashland Dam 29 38-27 82-36 1939-54 16 2.50 Barbourville 36-52 83-53 1942-50 9 1.61 2.32 3.07 Bardstown SJ Preparatory School 37-48 85-28 1949-54 6 3.55 Baxter Harlan Water Works 36-51 83-20 1940-50 ll 1.19 2.20 2.95
Beaver Dam 37-25 86-52 1939-54 16 3.20 Benham 36-58 82-57 1946-54 9 3.19 Benton 36-51 88-21 1944-50 7 1.44 2.30 3,16 Berea College 37-34 84-18 1901-54 54 3.23 Berea College 37-34 84-18 1942-50 9 1.76 2.55 3.43
Berea Water Works 37-33 84-15 1948-54 7 3.22 Bowling Green 37-00 86-26 1940-54* 13 3.34 Bowling Green CAA AP 36-58 86-26 1939-54 16 3.44 Bowling Green Substation 37-01 86-26 1944-54 ll 3,60 Bowling Green WB AP 36-58 86-26 1941-50* 8 1,68 2.25 3.08
Brent Dam 36 39-03 84-25 1944-54 ll 2.74 Brownsville Lock 6 37-12 86-16 1939-54 16 3.26 Burnside 36-59 84-37 1939-52 14 3.07 Cadiz Lock E 36-46 87-58 1949-54 6 3.80 Campbellsville 37-20 85-21 1945-54 10 3.14
Carroll ton Lock 1 38-41 85-ll 1939-54 16 2.88 Carrollton Lock 1 38-41 85-ll 1941-50 10 1.27 2.05 3,25 Central City 37-19 87-07 1942-50* 8 1.46 2.03 3.02 Clermont 1 SSE 37-55 85-40 1940-54* 9 3.20 Clinton 36-41 89-00 1942-50 9 1.66 3.05 4.15
College Hill Lock 11 37-47 84-06 1939-54 16 2.98 Cold Spring Dam 36 39-01 84-22 1939-43 5 2.53 Columbia 37-06 85-18 1949-54 6 3.53 Constantine 37-40 86-14 1940-50 ll 1,37 2.40 3.05 Corbin CAA AP 36-58 84-08 1945-54 10 2.96
Covington WB AP 39-04 84-40 1948-54 7 3,14 Cynthiana 38-23 84-18 1939-54 16 3,22 Danville 37-39 84-46 1939-54 16 3.07 Davella 37-48 82-32 1940-50 ll 1.50 2.17 2.81 Delphia l E 37-02 83-07 1949-54 6 2.47
Dema 37-25 82-48 1949-54 6 2.57 Dix Dam 37-48 84-43 1939-54 16 2.81 Dundee Barretts Ford Bridge 37-33 86-43 1950-54 5 3,25 Dundee Barretts Ford Bridge 37-33 86-43 1941-50 10 1.36 2.13 2.87 Dunmor 37-05 87-00 1949-54 6 4.25
Dunnville 37-13 84-58 1949-54 6 3,53 Eadsville 36-54 84-53 1939-46 8 3.35 Earlington 37-17 87-30 1939-48 10 2.86 Eddyville Lock F 37-03 88-05 1948-54 7 3,49 Edmonton 37-00 85-37 1941-50 10 1.54 2.24 3,27
*Breaks 1n Record
26

Table 2-1, cont.
Period Length 2-Year 1-Hour 2-Year -6-Hour 2-Year 24-Hour STATION Lat. Long. of of Record
Record (years) (inches) (inches) (inches)
KENTUCKY (continued)
Falmouth 38-40 84-20 1897-54 58 2.96 Farmers 38-09 83-33 1939-54 16 2.70 Flemingsburg 38-25 83-43 1939-54 16 3.13 Flemingsburg Post Office 38-25 83-44 1943-50 8 1.42 2.05 3.01 Ford Lock 10 37-54 84-16 1939-54 16 3.04
Fords Ferry Dam 50 37-28 88-06 1939-54 16 3.20 Fords Ferry Dam 50 37-28 88-06 1940-50 11 1.46 2.59 3.41 Frankfort Lock 4 38-13 84-52 1939-54 16 3.ll Franklin Water Works 36-43 86-34 1949-54 6 I 2.94 Franklin Water Works 36-43 86-34 1941-50 10 1.63 2.41 3.61
Frenchburg 37-57 83-39 1950-54 5 2.70 Georgetown Water Works 38-12 84-33 1949-54 6 2.98 Gest Lock 3 38-25 84-53 1939-54 16 3.25 Gest Lock 3 38-25 84-53 1941-50 10 1.48 2.18 3.32 Glasgow 37-00 85-55 1939-54* 11 3,35
Grant Dam 38 38-59 84-50 1939-54 16 2.68 Grayson 38-19 82-57 1939-54* 12 2.59 Greensburg 37-15 85-30 1939-54 16 3.02 Greensburg Highway 61 Bridge 37-15 85-30 1948-54 7 3.42 Greenup Dam 30 38-37 82-51 1939-54 16 3.01
Greenville 2 W 37-12 87-12 1939-54 16 3.34 Haleys Mill 37-03 87-20 1941-50 10 1.31 2.26 3.27 Hartford 6 NW 37-32 86-54 1939-54 16 3.30 Hazard 37-15 83-12 1940-50 ll 1.44 2.10 2.74
·Hazard Water Works 37-15 83-11 1939-51 13 2.87
Heidelberg Lock 14 37-33 83-46 1939-54 16 2. 74 Heidelberg Lock 14 37-33 83-46 1940-50 11 1.60 2.02 2.80 Henderson 4 SW 37-47 87-37 1939-54 16 3.70 Herndon 36-44 87-34 1943-50 8 1. 51 2.39 3.62 Hicksville 36-48 88-30 1949-54 6 4.12
High Bridge Lock 7 37-49 84-43 1939-54 16 2.94 Hindman Settlement School 37-20 82-59 1948-54 7 2.75 Hodgenville National Park 37-32 85-44 1945-50 6 1.68 2.70 3.77 Hopkinsville 36-51 87-30 1897-54 58 3.90 Hyden 37-10 83-22 1949-54 6 2.77
Irvington 37-53 86-17 1939-54 16 3.00 Jackson 37-33 83-23 193.9-54* 15 3.00 Jenkins 37-12 82-36 1939-51* 9 2.62 Jenkins 37-10 82-38 1940-50 ll 1.40 2.01 2.84 Jeremiah 37-10 82-56 1949-54 6 2.44
Keene 2 N 37-58 84-38 1949-54 6 3.42 Kentucky Dam TVA 379 37-01 88-16 1945-54 10 3,34 Kentucky Dam TVA 379 37-01 88-16 1944-50 7 1.28 2.01 3.05 La Grange 38-24 85-23 1939-46 8 3,24 Lancaster 37-37 84-35 1939-54 16 3.26
Laura 37-45 82-26 1948-54 7 2.44 Leitchfield 37-29 86-18 1897-54 58 3.34 Lexington WB AP 38-02 84-36 1903-53* 40 1.32 2.24 3.ll Liberty 37-21 84-55 1949-54 6 3,35 Liberty 37-21 84-55 1940-50 ll 1.42 2.31 3.30
Little Hickman Lock 8 37-45 84-35 1939-54 16 2.81 Little Hickman Lock 8 37-45 84-35 1940-50 11 1.48 2.37 2.88 Lockport Lock 2 38-26 84-58 1939-:;4 16 2.92 Loglick 1 S 37-51 84-02 1941-50" 10 1.57 2.38 2.84 London 3 SW 37-06 84-08 1940-50* 10 1.54 2.29 2.71
Louisa 2 38-07 82-37 1939-54* 15 3.30 Louisa Lock 3 38-07 82-37 1941-50 10 1.15 1.89 2,68 Louisville WB AP 38-11 85-44 1941-50 10 1.30 2.21 3.30 Louisville WB City 38-15 85-46 1903-51 49 1.36 2.10 3.28 Louisville, Bowman Field 38-13 85-40 1939-54 16 3.08
Louisville Upper Gage 38-17 85-48 1948-54 7 3.23 Lovelaceville 36-58 88-50 1939-54* 15 3.26 Lucas 36-53 86-02 1945-50 6 1. 50 2.30 3.20 Madisonville 1 SE 37-19 87-29 1949-54 6 3.23 Madisonville 1 SE 37-19 87-29 1943-50 8 1.56 2.18 3.10
Mammoth Cave Park 37-ll 86-06 1939-54 16 3.77 Manchester 4 SE 37-06 83-43 1949-54 6 3.38 Mayfield 2 S 36-42 88-38 1939-54 16 3.54 Mayfield Substation 36-44 88-39 1944-54 ll 3.70 Maysville Dam 33 38-38 83-42 1939-54 16 2.90
Maysville Dam 33 38-38 83-42 1940-50 11 1.63 2.21 2.89 McKinneysburg 38-36 84-16 1940-50 11 1.32 1.97 3.09 Middlesboro 36-37 83-43 1939-54* 14 3.38 Middlesboro Railroad Station 36-37 83-43 1940-50 ll 1.49 2.03 2.71 Midway 38-09 84-41 1948-54 7 3.37
Millersburg 38-18 84-09 1941-50 10 1.73 2.55 3.10 Millerstown 37-27 86-03 1948-54 7 3.49 Monticello 36-50 84-50 1939-54 16 3.00 Morehead State College 38-ll 83-26 1946-50 5 1.88 2.60 3.53 Mount Sterling 38-04 83-56 1897-54* 56 3.ll
* Breaks in Record
27

Table 2-1, cont.
Period Length 2-Year 1-Rour 2-Year ij-Rour 2-Year 24-Rour STATION Lat. Long. of of Record
Record (years) (inches) (inches) (inches)
KENTUCKY (continued)
Munfordville 37-16 85-53 1939-54* 14 3.34 Munfordville 37-16 85-53 1940-50 ll 1.30 2.41 3.42 Murray 36-36 88-20 1939-54 16 3.72 Olive Rill 1 NW 38-18 83-ll 1942-50 9 1.52 2.28 3,25 Olney 37-14 87-47 1949-54 6 3.00
Oneonta Dam 35 38-.58 84-18 1939-54 16 2.58 Owensboro 2 W 37-46 87-09 1897-54 58 3.24 Owensboro Dam 46 37-47 87-08 1939-54 16 3.08 Owensboro Dam 46 37-47 87-08 1940-50 ll 1.51 2.72 3.51 Paducah 37-06 88-37 1939-54 16 3.98
Paducah CAA AP 37-04 88-46 1950-54 5 3.89 Paducah SCS Nursery 37-04 88-35 1940-50 ll 1.55 2.44 3.40 Paintsville 37-49 82-48 1939-54 16 2.74 Pikeville 37-29 82-31 1939-54* 15 2.56 Pikeville 37-29 82-31 1940-50 ll 1.19 1.79 2.45
Pineville 36-45 83-42 1949-54 6 2.90 Pippapass 37-19 82-52 1939-46 8 3.29 Princeton 37-06 87-53 1939-54 16 3,67 Quicksand 37-32 83-21 1939-48 10 3.29 Ravenna Lock 12 37-40 83-57 1939-54 16 3.04
Raywick 37-33 85-26 1941-48 8 1.51 2.29 3.18 Richmond 37-44 84-18 1939-54* 14 2.84 Rumsey Lock 2 37-32 87-16 1939-54 16 3.23 Rumsey Lock 2 37;..32 87-16 1940-50 ll I
1.61 2.62 3.39 Russellville 36-51 86-53 1939-54 16 3.49
Russellville Substation 36-50 86-54 1948-54 7 4.44 Sadieville Water Works 38-23 84-32 1943-50 8 1.20 2.08 2.81 st. John Bethlehem Academy 37-42 85-59 1939-54 16 3,08 Salvisa Lock 6 37-56 84-49 1939-54 16 3.12 Salyersville 37-45 83-04 1940-50 ll 1.42 1.95 2.89
Science Hill 37-ll 84-39 1943-49 7 3.ll Scottsville 36.,-45 86-12 1947-54 8 3.46 Sebree 37-36 87-32 1949-54 6 3.60 Shelbyville 2 W 38-13 85-16 1897-54 58 3,28 Shepherdsville 38-00 85-44 1939-54* 7 2.89
Smithfield 4 S 38-20 85-16 1942-50 9 1.40 2.28 3,42 Smiths Grove 37-03 86-ll 1939-44 6 3.07 Somerset Highway Department 37-07 84-35 1942-50 9 1.44 2.12 2.88 Springfield 37-41 85-14 1947-54 8 3.72 Stearns 36-43 84-29 1939-54* 12 3,05
\
Stearns 36-42 84-29 1940-50 ll 1.38 2.26 3.06 Summer Shade 36-53 85-43 1949-54 6 4.16 Summer Shade Substation 36-53 85-40 1948-54 7 ·3.65 Tatham Springs 37-52 85-09 1940-50 11 1.22 1.97 2.78 Taylorsville 38-02 85-21 1939-54* 10 3.59
Tompkinsville 36-42 85-41 1941-50 10 2.02 2.88 3.89 Tompkinsville 2 36-42 85-41 1947-54* 6 3,66 Turkey Creek School 36-45 88-05 1948-54 7 4,09 Tyrone Lock 5 38-02 84-51 1939-54 16 3.14 Uniontown Dam 49 37-46 87-57 1939-54 16 3.42
Uniontown Dam 49 37-46 87-57 1940-50 11 1,50 2.83 3,86 Valley View Lock 9 37-51 84-26 1939-54 16 2.92 Vanceburg Dam 32 38-39 83-21 1939-54 16 2.52 Waynesburg 6 E 37-22 84-34 1947-54 8 3.48 West Liberty Water Works 37-55 83-15 1948-54 7 3.24
Williamsburg 36-44 84-10 1897-54 58 3,10 Williamstown 5 WSW 38-38 84-38 1939-54 16 2.90 Willow Lock 13 37-36 83-50 1939-54 16 2.90 Winchester 37-55 84-16 1939-44 6 3:07 Wolf Creek Dam 36-52 85-09 1947-54 8 3,11
Wolf Creek Dam 36-53 85-08 1942-50 9 1.28 2.04 3.08 Woodbury Lock 4 37-11 86-38 1939-54 16 3.20 Woodbury Lock 4 37-11 86-38 1940-50 11 1.36 2.16 3.02 Yale 38-03 83-30 1940-45 6 1.44 2.19 3,18
l!ISSOURI
Advance 5 ESE 37-06 89-50 1939-54 16 3.31 Advance AP 37-06 89-55 1942-49 8 1.63 2.58 3,79
Bernte 36-40 89-58 1944-54 11 3.31 Bloomfield 36-53 89-56 1945-54 10 3.88 Bragg City 36-17 89-55 1939-43 5 2.69
Cape Girardeau 37-18 89-32 1939-54 16 3.68 Cape Girardeau Missouri State College 37-18 89-32 1946-54 9 3.42 Caruthersville 36-ll 89-39 1939-54 16 3.19
Deering 36-12 89-53 1941-54 14 3.47
Dexter 36-47 89-58 1939-54 16 3.74
Jackson 37-23 89-40 1899-54 56 3,78
Malden CAA AP 36-36 89-59 1949-53 5 4,48
Malden CAA AP 4 NW 36-36 89-58 1941-50 10 1.46 2.56 3,43
Marble Rill 37-18 89-58 1897-54~ 57 3,50
Morehouse 36-51 89-42 1939-54 16 4.00
*Breaks in Record
28

Table 2-1, cont.
Period Length 2-Year 1-Hour 2-Year ·6-Hour 2-Year 24-Hour STATION Lat. Long. of of Record
Record (years) (inches) (inches) (inches)
MISSOURI (continued)
New Madrid 36-35 89-31 1939-54 16 3,67 Parma 36-37 89-48 1939-54 16 3,55 Perryville 39-43 89-52 1941-54 14 3.13 Sikeston 36-53 89-35 1939-54 16 4.25 Zalma 5 E 37-10 89-59 1939-54 16 3, 78
NORTH CAROLINA
Albemarle 35-21 80-12 1939-54 16 4.06 Altapass 35-54 82-01 1939-54* 15 3.18 Andrews 2 E 35-12 83-48 1939-54 16 3.67 Andrews D,am 35-04 83-56 1939-54 16 2.78 Asheville CAA AP 35-26 82-29 1939-54 16 3.55
Asheville WB City 35-36 82-32 1903-51 49 1.34 1.97 2.93 Ashford 2 S 35-52 81-58 1942-50 9 1. 58 2. 55 3.48 Badin 35-25 80-07 1940-50 ll 1.63 2.37 3.05 Bakersville 36-01 82-10 1939-54 16 2.60 Balsam 35-25 83-05 1943-54 12 3.33
Banner Elk 36-10 81-52 1939-54 16 3.67 Barnardsville 35-46 82-26 1939-54 16 2.77 Beaverdam Creek 35-13 84-06 1939-54 16 3.94 Beetree Dam 2 35-38 82-24 1948-54 7 2.95 Bent Creek 35-30 82-36 1949-54 6 3.24
Big East Fork Pigeon 35-22 82-49 1943-49 7 5.44 Big Pine 35-47 82-49 1939-44 6 3.16 Black Mountain 35-37 82-19 1950-54 5 3.32 Blowing Rock 36-08 81-41 1944-51 8 3.05 Blue Ridge Post Office 35-21 82-22 1939-54* 5 4.67
Blue Ridge Post Office TVA 278 35-21 82-22 1943-50 8 1.37 2.42 3.94 Bluff 36-24 81-13 1949-54 6 4. 73 Boone 36-13 81-41 1939-54 16 4.15 Brevard 35-14 82-44 1902-54* 48 4.36 Bridgewater Hydro. Plant 35-44 81-50 1949-54 6 3. 79
Bryson City TVA 185 35-26 83-27 1939-49 ll 3.20 Bryson City TVA 185A 35-25 83-27 1944-50 7 1.44 2.03 3,30 Cane River 35-55 82-24 1939-54 16 2.62 Canton 1 SW 35-32 82-52 1939-54 16 2.90 Caroleen 35-15 81-47 1939-54 16 4.01
Cartoogechaye Creek 35-09 83-29 1942-54 13 4.00 Ca taloochee 35-38 83-05 1945-54 10 2.87 Cataloochee Ranch 35-33 83-06 1939-54 16 3.28 Catawba 35-43 81-05 1946-54 9 2.72 Catawba Lookout Shoals 35-44 81-04 1949-54 6 2.92
Cedar Mountain TVA 283 35-09 82-39 1943-50 8 1.85 3.21 5.21 Celo 2 S 35-50 82-ll 1943-54 12 3.94 Celo TVA 35-52 82-12 1939-54 16 3.86 Chambers Mountain TVA 250 35-34 82-54 1940-50 ll 1.63 2.27 3.43 Charlotte WB AP 35-14 80-56 1940-50 ll 1.68 2.66 3.64
Charlotte WB City 35-13 80-51 1903-51 49 1.67 2. 58 3.54 Chatuge Dam 35-01 83-47 1943-54 12 2.83 Cheoah Dam 35-27 83-56 1939-54 16 3.30 Cherokee 35-29 83-19 1941-54* 13 2.66 Clingmans Dome TVA 184 35-33 83-30 1940-50 11 1.61 3.08 4.86
Cody Store 35-55 82-36 1939-54 16 3.10 Concord 35-25 80-35 1939-54 16 3. 59 Conover Oxford Shoals 35-50 81-09 1949-54 6 3.49 Cove Creek 35-38 83-00 1939-44 6 2.96 Coweeta 35-04 83-26 1949-54 6 5.46
Coweeta 8 35-02 83-28 1950-54 5 6.95 Coweeta Experiment Station 35-02 83-26 1949-54 6 5.06 Coxcombe Mountain TVA 228 35-49 82-21 1940-50 ll 1.15 2.15 3.25 Crossnore 36-01 81-56 1939-54 16 4.58 Cullowhee 35-19 83-ll 1939-54 16 3.02
Dalton 36-17 80-24 1940-50 11 1.45 2.45 3.26 Danbury 36-25 80-12 1947-54 8 3,14 Daybook 35-59 82-18 1939-54 16 2.54 Dix Creek 35-27 82-52 1939-54 16 3.54 Dobson 36-23 80-43 1940-50 11 l. 58 2. 51 3.47
Doggett Gap 2 35-43 82-50 1939-54 16 2.99 Eaglenest Mountain 35-29 83-03 1939-54 16 3.28 Ela 35-27 83-22 1943-54 12 3.11 Elkin 36-15 80-51 1939-54 16 3.84 Elkville 36-04 81-24 1940-50 11 1.40 2.57 4.21
Enka 35-33 82-39 1939-54 16 2.72 Erastus 35-11 83-ll 1939-44 6 4.37 Flat Top .Mountain 36-02 82-24 1939-54 16 3.08 Fontana Dam 35-27 83-48 1945-54* 9 3,61 Forney Creek 35-30 83-34 1950-54 5 3.59
Franklin 35-13 83-22 1939-54 16 3,86 Franklin 1 SSW 35-11 83-23 1939-54 16 3.76 Franklin TVA 35-ll 83-23 1939-54* 7 3.54 Garren Creek 35-31 82-20 1939-54 16 4.55 Gastonia 35-16 81-12 1939-54 16 3.79
*Breaks in Record
29
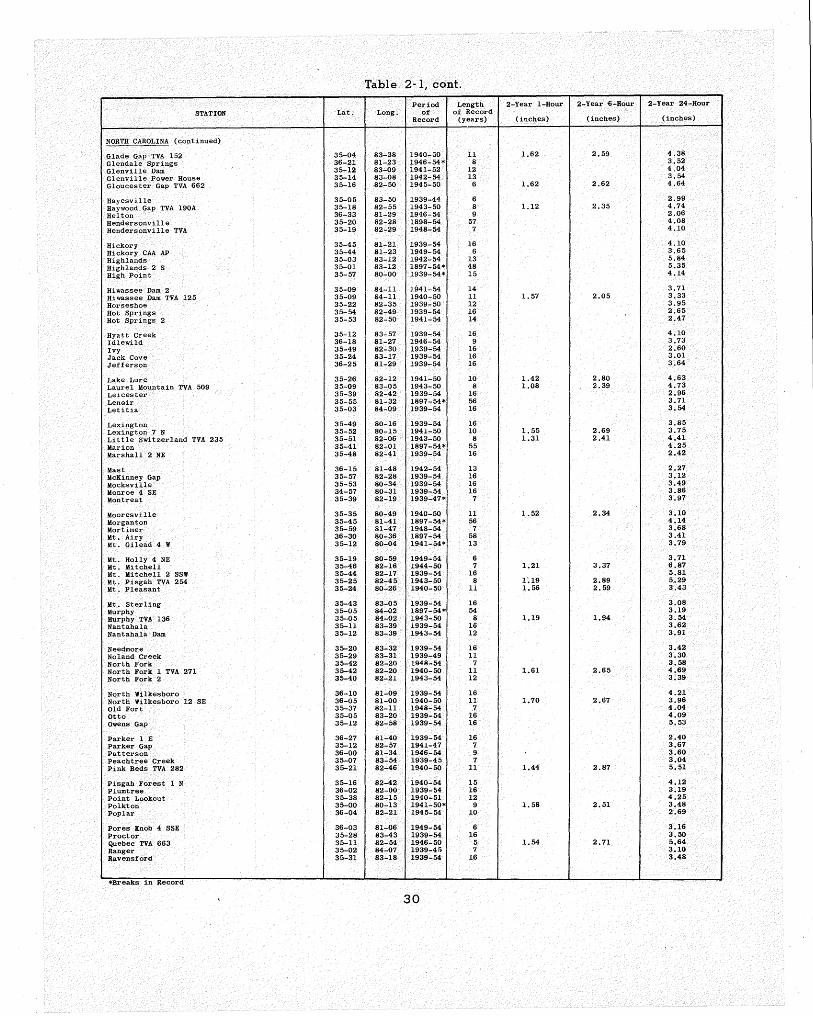
Table 2- 1, cont.
Period Length 2-Year 1-Hour 2-Year ·6-Hour 2-Year 24-Hour
STATION Lat. Long. of of Record Record (years) (inches) (inches) (inches)
NORTH CAROLINA (continued)
Glade Gap TVA 152 35-04 83-38 1940-50 ll 1.62 2.59 4.38
Glendale Springs 36-21 81-23 1946-54* 8 3,52
Glenville Dam 35-12 83-09 1941-52 12 4.04 Glenville Power House 35-14 83-08 1942-54 13 3.54 Gloucester Gap TVA 662 35-16 .82-50 1945-50 6 1.62 2.62 4.64
Hayesville 35-05 83-50 1939-44 6 2.99 Haywood Gap TVA 190A 35-18 82-55 1943-50 8 1.12 2.35 4.74 Helton 36-33 81-29 1946-54 9 2.06 Hendersonville 35-20 82-28 1898-54 57 4.08 Hendersonville TVA 35-19 82-29 1948-54 7 4.10
Hickory 35-45 81-21 1939-54 16 4.10 Hickory CAA AP 35-44 81-23 1949-54 6 3.65 Highlands 35-03 83-12 1942-54 13 5.84 Highlands 2 S 35-01 83-12 1897-54* 48 5,35
High Point 35-57 80-00 1939-54* 15 4.14
Hiwassee Dam 2 35-09 84-ll 1941-54 14 3.71 Hiwassee Dam TVA 125 35-09 84-ll 1940-50 ll 1.57 2.05 3.33 Horseshoe 35-22 82-35 1939-50 12 3.95 Hot Springs 35-54 82-49 1939-54 16 2.65 Hot Springs 2 35-53 82-50 1941-54 14 2.47
Hyatt Creek 35-12 83-57 1939-54 16 4.10 Idlewild 36-18 81-27 1946-54 9 3.73 Ivy 35-49 82-30 1939-"54 16 2.60 Jack Cove 35-24 83-17 1939-54 16 3.01 Jefferson 36-25 81-29 1939-54 16 3.64
Lake Lure 35-26 82-12 1941-50 10 1.42 2.80 4.63 Laurel Mountain TVA 509 35-09 83-05 1943-50 8 1.08 2.39 4.73 Leicester 35-39 82-42 1939-54 16 2.96 Lenoir 35-55 81-32 1897-54* 56 3.71 Letitia 35-03 84-09 1939-54 16 3.54
Lexington 35-49 80-16 1939-54 16 3.85 Lexington 7 N 35-52 80-15 1941-50 10 1.55 2.69 3.75 Little Switzerland TVA 235 35-51 82-06 1943-50 8 1.31 2.41 4.41 Marion 35-41 82-01 1897-54* 55 4.25 Marshall 2 NE 35-48 82-41 1939-54 16 2.42
Mast 36-15 81-48 1942-54 13 2.27 McKinney Gap 35-57 82-28 1939-54 16 3.12 Mocksville 35-53 80-34 1939-54 16 3.49 Monroe 4 SE 34-57 80-31 1939-54 16 3.86 Montreat 35-39 82-19 1939-47* 7 3.97
Mooresville 35-35 80-49 1940-50 ll 1.52 2.34 3.10 Morganton 35-45 81-41 1897-54* 56 4.14 Mortimer 35-59 81-47 1948-54 7 3.68 Mt. Airy 36-30 80-36 1897-54 58 3.41 Mt. Gilead 4 W 35-12 80-04 1941-54* 13 3.79
Mt. Holly 4 NE 35-19 80-59 1949-54 6 3.71 Mt. Mitchell 35-46 82-16 1944-50 7 1.21 3.37 6.87 Mt. Mitchell 2 SSW 35-44 82-17 1939-54 16 5.81 Mt. Pisgah TVA 254 35-25 82-45 1943-50 8 Ll9 2.89 5 .• 29 Mt. Pleasant 35-24 80-26 1940-50 ll 1.56 2.59 3.43
Mt. Sterling 35-43 83-05 1939-54 16 3,08 Murphy 35-05 84-02 1897-54* 54 3.19 Murphy TVA 136 35-05 84-02 1943-50 8 1.19 1.94 3.54 Nantahala 35-ll 83-39 1939-54 16 3.62 Nantahala Dam 35-12 83-39 1943-54 12 3.91
Needmore 35-20 83-32 1939-54 16 3.42 Noland Creek 35-29 83-31 1939-49 11 3.30 North Fork 35-42 82-20 1948-54 7 3.58 North Fork 1 TVA 271 35-42 82-20 1940-50 11 1.61 2.65 4,69 North Fork 2 35-40 82-21 1943-54 12 3.39
North Wilkesboro 36-10 81-09 1939-54 16 4.21 North Wilkesboro 12 SE 36-05 81-00 1940-50 11 1.70 2.67 3.96 Old Fort 35-37 82-11 1948-54 7 4.04 Otto 35-05 83...:20 1939-54 16 4.09 Owens Gap 35-12 82-58 1939-54 16 5.53
Parker 1 E 36-27 81-40 1939-54 16 2.40 Parker Gap 35-12 82-57 1941-47 7 3.67 Patterson 36-00 81-34 1946-54 9 3,60 Peachtree Creek 35-07 83-54 1939-45 7 3.04 Pink Beds TVA 282 35-21 82-46 1940-50 11 1.44 2.87 5.51
Pisgah Forest 1 N 35-16 82-42 1940-54 15 4.12 Plumtree 36-02 82-00 1939-54 16 3.19 Point Lookout 35-38 82-15 1940-51 12 4.25 Polkton 35-00 80-13 1941-50* 9 l. 58 2.51 3.48 Poplar 36-04 82-21 1945-54 10 2.69
Pores Knob 4 SSE 36-03 81-06 1949-54 6 3.16 Proctor 35-28 83-43 1939-54 16 3.50 Quebec TVA 663 35-11 82-54 1946-50 5 1.54 2.71 5.64 Ranger 35-02 84-07 1939-45 7 3.10 Ravensford 35-31 83-18 1939-54 16 3.48
*Breaks in Record
30

Table 2-1, cont.
Period Length 2-Year 1-Hour 2-Year ·6-Hour 2-Year 24-Hour STATION Lat. Long. of of Record
Record (years) (inches) (inches) (inches)
NORTH CAROLINA (continued)
Reese 36-20 81-50 1939-54 16 2.44 Rhodhiss Hydro. Plant 35-46 81-26 1948-54 7 3.86 Rich Mountain Gap TVA 694 36-20 81-43 1941-50* 9 1.10 2.14 3.20 Roaring Gap 1 NE 36-28 80-58 1943-50 8 1.94 3.25 4,93 Rock House 35-00 83-06 1939-54 16 5.35
Rockyface Mountain 35-35 82-48 1939-54 16 3.07 Rosman 35-08 82-50 1939-54 16 5.23 Rural Hall 36-14 80-18 1949-54 6 3.71 Rush Mountain 35-14 82-28 1939-54 16 5.50 Salisbury 35-40 80-29 1897-54 58 3.53
Sams Gap 35-57 82-34 1947-53 7 2.33 Santeetlah Dam 35-23 83-53 1939-54 16 3.65 Santeetlah Gap 35-21 83-54 1941-54 14 3.84 Settle 36-01 80-46 1939-54* 10 3.96 Shelby 35-18 81-32 1939-54 16 3.79
Shelby 2 35-18 81-33 1941-50* 8 1.91 2.61 3.60 Shooting Creek 35-01 83-41 1939-45 7 2.80 Smoky Gap 36-07 81-56 1939-54 16 2.80 Snow Creek 35-58 82-09 1939-54 16 3.13 Sparta 36-30 81-07 1946-54 9 3,48
Spruce Mountain TVA 187 35-37 83-ll 1941-50 10 1.32 1.99 3.37 Spruce Pine 35-54 82-04 1943-54 12 3,30 Statesville 2 W 35-47 80-56 1939-54 16 3.54 Stecoah 35-22 83-41 1939-54 16 3.23 Swannanoa 35-36 82-24 1939-54 16 2.92
Tapoco 35-27 83-56 1939-54 16 3.31 Teyahalee Bald TVA 362 35-15 83-48 1941-50 10 1.39 2.60 4.02 Tipton Hill 36-02 82-16 1939-44 6 2.88 Tomotla 35-08 83-59 1939-54 16 3,53 Transou 36-24 81-18 1946-54 9 4.09
Tryon 35-13 82-14 1939-54 16 5,03 Tuckaseigee 2 S 35-14 83-08 1946-54 9 3,54 Twentymile 35-28 83-53 1949-54 6 4.14 Wadesboro 34-57 80-04 1941-54 14 3,90 Waterville 35-46 83-06 1939-54 16 2.66
Wayah Bald TVA 197 35-ll 83-34 1944-50 7 1.37 2.41 4.27 Waynesville 1 E 35-29 82-58 1939-54* 15 3.06 Weaverville 35-42 82-34 1946-54 9 2.05 Wilbar 2 NW 36-15 81-18 1946-54 9 3.56 Wilkesboro 36-09 81-09 1948-54 7 3. 72
Winston-Salem WB AP 36-07 80-12 1939-54 16 3.79 Yadkinville 8 E 36-08 80-33 1940-50 ll 1.34 2.33 3.26
OHIO
Alma Scioto Trails Forest 39-13 82-58 1940-49 10 1.08 1.54 2.36 Amesville 39-24 81-57 1940-45 6 1.26 1.57 2.32 Athens 5 NW 39-23 82-ll 1950-54 5 2.30 Athens 5 NW 39-23 82-ll 1940-50 ll 1.28 1.91 2.69 Athens 39-20 82-06 1939-54 16 2,78
Barnsville Water Works 39-58 81-10 1948-54 7 2.45 Batavia 4 N 39-07 84-10 1939-50 12 2.80 Beverly Lock 4 39-33 81-39 1939-52 14 2.50 Caldwell 4 W 39-44 81-35 1939-54 16 2.86 Caldwell Highway Department 39-45 81-31 1940-50 ll 1.02 1.53 2.24
Carroll Highway Department 39-48 82-42 1940-48 9 1,56 2.25 2.95 Cherry Fork 38-50 83-34 1940-46 7 2.89 Chesapeake Huntington CAA AP 38-25 82-30 1943-54 12 2.80 Chillicothe 39-20 82-58 1939-54 16 2.70 Chilo Dam 34 38-47 84-08 1939-54 16 2.89
Chilo Dam 34 38-47 84-08 1940-50 ll 1.31 2.04 2.97 Circleville 39-36 82-57 1897-54 58 2.72 Circleville 39-36 82-57 1940-50 ll 1.48 2.20 3.08 Cincinnati Ault Park 39-08 84-25 1943-54 12 2.77 Cincinnati Lunken AP 39-06 84-25 1941-50 .10 1.14 2.07 2.68
Cincinnati WB City 39-06 84-30 1903-51 49 1.33 2.17 2.99 Clarington Lock 14 39-45 80-53 1939-54 16 2.56 Columbus Ohio State University 40-00 83-01 1939-54 16 2.56 Columbus WB AP 40-00 82-53 1941-50 10 1.37 1.99 2.62 Columbus WB City 39-58 83-00 1903-51 49 1.21 1.76 2.39
Columbus Valley Cross 39-56 82-57 1939-54 16 2.53 Dayton 39-45 84-10 1939-54 16 2.58 Dayton WB AP 39-54 84-12 1912-51* 38 1.29 1.90 2.27 Demos 4 SE 39-59 80-59 1939-47 9 2.48 Duffy Dam 15 39-38 80-53 1940-50 ll 1.49 2.12 2.75
Eaton 39-45 84-38 1939-54* ll 2.88 Eaton Public Library 39-45 84-38 1941-50 10 1.14 1.67 2.65 Enterprise 39-35 82-29 1947-54 8 2.65 Fernbank Dam 37 39-07 84-42 1939-54 16 2. 75 Franklin 39-33 84-18 1939-54* 11 3.13
Gallipolis 5 W 38-50 82-17 1939-54 16 2.71 Germantown 3 NE 39-40 84-20 1939-52 14 2.56
*Breaks in Record
31

Table 2-1, cont.
Period Length 2-Year l-Hour 2-Year -6-Hour 2-Year 24-Hour STATION Lat. Long. of of Record
Record (years) (inches) (inches) (inches)
OHIO (continued)
Greenfield Water Works 39-21 83-23 1940-50 ll 1.24 1.65 2.68
Hamilton 39-24 84-34 1939-54 16 2. 72
Hamilton Water Works 39-25 84-33 1939-54 16 2.88
Hamilton Water Works 39-25 84-33 1940-50 ll 1.46 2.17 3.03
Higginsport 38-47 83-48 1947-54 8 2.54
Hillsboro 39-12 83-37 1897-54* 50 3.01
Hillsboro Water Works 39-14 83-37 1941-50 lO 1.39 1.90 2,70
Ironton 38-32 82-40 1939-54 16 2.89
Jackson 39-03 82-38 1939-54 16 2.89 Jackson Highway Department 39-03 82-39 1940-50* lO 1.58 2.15 2.69
Kings Mills 39-21 84-16 1939-54 16 2.82 Lancaster Power Substation 39-43 82-36 1939-54 16 2.86 Lebanon Highway Department 39-26 84-12 1940-50 ll l. 56 2.27 3,18
Logan Highway Department 39-33 82-23 1940-50* 9 1.16 2,03 2.94
London 4 W 39-54 83-31 1939-54 16 2.75
Lowell Lock 3 39-32 81-31 1939-52 14 2.86
Marietta Lock l 39-25 81-27 1949-54 6 2.86
Marietta Lock l 39-25 81-27 • 1940-50 ll 1.68 2.08 2.85
Marietta Water Works 39-25 81-27 1939-54* 14 2.51
McArthur 39-15 82-29 1939-44 6 2.92
McArthur Highway Department 39-15 82-28 1940-50 ll 1.19 1,88 2.47
McConnelsville Lock 7 39-39 81-51 1939-54 16 2.81
Miamisburg 2 E 39-39 84-15 1939-54 16 2.65
Middletown 39-31 84-24 1939-54 16 3.ll
Mt. Healthy Experiment Farm 39-17 84-34 1939-54* ll 2. 52
Mt. Sterling Gas Pump station 39-44 83-16 1945-50 6 1.49 1.94 2.55
New Carlisle 39-56 84-02 1939-54 16 2.40
New Lexington 2 NW 39-44 82-13 1943-54 12 2.78
New Matamoras Dam 16 39-29 81-07 1940-50 ll 1.38 1.98 2.73
North Kenova Dam 28 38-25 82-30 1948-54 7 2.83
Norwich 39-58 81-48 1948-54 7 2.63
Oxford Water Works 39-31 84-44 1940-50 ll 1.18 1.86 2.91
Peebles l S 38-56 83-25 1939-54 16 2.93
Peebles 38-57 83-25 1940-50 ll 1.37 1.97 2.63
Philo 39-52 81-54 1897-54 58 2.53
Philo 3 SW 39-50 81-55 1939-54 16 2.40
Piketon 39-04 83-00 1943-54 12 2.74
Portland Dam 21 39-01 81-46 1948-54 7 2.29
Portsmouth 38-43 82-59 1897-54 58 2.92
Portsmouth U. s. Grant Bridge 38-44 83-00 1939-54 16 3.22
Portsmouth Water Works 38-45 82-55 1940-50 ll 1.48 1.88 2.80
Racine Dam 23 38-53 81-52 1939-54 16 2.70
Rokeby Lock 39-44 81-55 1940-47 8 1.28 1,56 2.33
St. Martin Ursuline School 39-13 83-53 1940-50 ll 1.34 2,39 3.43
Sedalia 39-45 83-29 1948-54 7 2.78
Senecaville Dam 39-55 81-26 1943-54 12 2.27
Sharonville (nr) 39-17 84-26 1940-46 7 1.54 1,83 2.73
Springfield 39-55 83-49 1939-54* ll 2.47
Springfield Water Works 39-57 83-45 1940-50 ll 1.32 1.87 2.51
Springfield Elmwood Avenue 39-55 83-47 1939-50 12 2.45
Summerfield 3 NE 39-49 81-17 1948-54 7 2.82
Thornville 39-54 82-25 1948-54 7 3o22
Tipp City 39-58 84-11 1939-54 16 2.47
Washington Court House 39-32 83-25 1939-54 16 2.66
Waverly 39-08 82-59 1897-54* 55 2,58
West Manchester 3 SW 39-53 84-38 1939-54 16 2.68
Wilmington 39-27 83-50 1939-54 16 2.84
Wilmington Power Plant 39-27 83-49 1941-50 10 1.49 1,87 2.64
Woodsfield Highway Department 39-46 81-07 1940-50 ll 1.66 1.94 2.62
xenia 4 SSW 39-38 83-54 1939-54 16 2,62
Xenia Oldtown Water Works 39-44 83-56 1941-50 lO 1.42 2.24 2.87
Zanesville CAA AP 39-57 81-54 1948-54 7 2.52
Zanesville Lock 10 39-56 82-00 1939-54* 15 2.30
Zanesville Lock 10 39-56 82-00 1940-50 11 1.34 1.77 2.38
PENNSYLVANIA
Rices Landing Lock 6 39-57 80-00 1943-54 12 2.52
Waynesburg l E 39-54 80-10 1938-50 13 1.44 1,83 2.59
Waynesburg l E 39-54 80-10 1948-54 7 2.68
Waynesburg 2 W 39-54 80-13 1939-47 9 2.48
SOUTH CAROLINA
Caesars Head 35-07 82-.:18 1939-54 16 5.94
Cherokee 35-05 81-50 1939-46 8 4.00
Cleveland 2 WNW 35-05 82-32 1943-54 12 4.08
Fort Mill 4 NW 35-00 81-00 1949-54 6 2.68
Gaffney 6 E 35-05 81-34 1945-54 lO 3.61
Gaston Shoals 35-08 81-36 1939-54 16 3.50
Landrum 35-ll 82-ll 1939-54 16 4,18
Ninety Nine Islands 35-03 81-32 1949-54 6 3,16
Rainbow Lake 35-06 81-55 1947-54 8 3.85
Sassafras Mountain· 35-04 82-47 1949-54 6 3,77
Breaks in Record *
32

Table 2-1, cont.
Period Length 2-Year 1-Hour 2-Year ·6-Hour 2-Year 24-Hour STATION Lat. Long. of of Record
Record (years) (inches) (inches) (inches)
TENNESSEE
Abrams Creek 35-37 83-56 1946-54 9 3.66 Alcoa 35-48 83-58 1939-50 12 2.99 Allardt 36-23 84-53 1949-54 6 2.64 Altamont 35-26 85-43 1940-54 15 3.61 Apalachia ·Dam TVA 575A 35-10 84-18 1943-50 8 1.57 2.22 3.32
Apalachia Power House 35-ll 84-26 1944-54 ll 3.52 Arthur 36-33 83-38 1939-54 16 2.93 Ashwood 35-36 87-09 1897-54 58 3. 55 Athens Substation 35-29 84-35 1939-54 16 3.41 Beauty Spot TVA 224 36-07 82-20 1940-50 ll 1.37 2.07" 2.84
Beech Grove 35-38 86-14 1939-54 16 3.78 Belleville 35-15 86-34 1942-54 13 4.20 Belvidere TVA 60 35-08 86-ll 1940-50 ll 1.49 2.57 3.43 Bethel 35-00 87-03 1939-54 16 3.85 Big Barren TVA 331 36-25 83-40 1940-44 5 1.13 2.07 3.07
Big Lick 35-48 85-01 1950-54 5 3. 53 Big Spring 35-24 84-.54 1940-54 15 3.74 Big Sycamore TVA 336 36-31 83-22 1941-50 10 1.36 2.39 3.43 Bledsoe State Forest 35-41 85-16 1941-49 9 3,01 Bluff City 36-28 82-16 1897-54 58 2.41
Bolivar 2 35-i5 88-59 1897-54* 50 4.13 Bolivar 35-15 88-59 1941-50 10 1.66 2.48 3.91 Bolton 35-19 89-46 1949-54 6 3,56 Boonshill 35-13 86-44 1942-54 13 4.06 Boyd Gap TVA 502 35-02 84-25 1944-SO 7 1.56 2.34 4.32
Breedenton 2 NW 35-33 84-48 1940-51 12 3.73 Bristol WB AP 36-29 82-24 1940-50 11 1.61 1.99 2.63 Brownsville 35-36 89-16 1939-54 16 3,89 Brownsville 5 NE 35-38 89-13 1941-50 10 1.56 2.99 4.07 Buchanan TVA 456 36-26 88-14 1940-50 ll 1.36 2.34 3.16
Bulls Gap 36-15 83-05 1939-54 16 2.96 Butler TVA 491 36-22 82-02 1943-50 8 1.30 1.83 2.46 Byrdstown 1 W 36-34 85-09 1939-51 13 3.47 Cagle TVA 438 35-28 85-27 1941-50 10 1.54 2.59 3.38 Calderwood Power House 35-30 83-59 1939-54 16 2.94
Camp Creek Bald TVA 218 36-02 82-43 1940-50 ll 1.62 2.73 3.68 Carthage 36-16 85-57 1897-54 58 3,55 Carthage Lock 7 36-18 86-02 1949..:54 6 3.90 Carthage Lock 7 36-18 86-02 1941-50 10 1.51 2.65 3,33 <:;arthage Substation 36-15 85-58 1940-54 15 3.65
Cavvia 35-50 88-12 1940-54 15 3.90 Cedar Creek 36-22 82-29 1939-54 16 2.45 Cedar Hill 36-33 87-45 1939-46 8 2.88 Celina 36-40 85-31 1939-49 ll 3.68 Center 35-29 84-23 1949-54 6 3.37
Center Hill Dam 36-06 85-49 1946-54 9 3.97 Centerville 35-47 87-28 1945-54 10 4.10 Centerville Substation 35-47 87-28 1940-54 15 3.52 Chapel Hill 35-38 86-42 1939-54 16 3.84 Charleston 35-17 84-45 1939-54. 16 3,58
Chattanooga WB AP 35-04 85-18 1903-48 46 1.56 2.64 3.84 Cherokee Dam 36-10 83-30 1942-54 13 3.08 Chickamauga Dam 35-06 85-14 1941-54 14 3.76 Clarkrange 36-ll 85-01 1939-54 16 3.46 Clarksville 36-31 87-22 1939-54 16 3.08
Cleveland Substation 35-ll 84-49 1940-54 15 3.61 Clifton Junction 35-,.19 87-55 1940-54 15 3.56 Clinton 36-06 84-06 1897-54 58 3.44 Coker Creek 35-16 84-17 1939-54 16 3.37 Coldwater 1 E 35-05 86-44 1939-54 16 3. 56
Colesville 36-27 82-02 1939-54 16 2,65 College Junction 35-31 85-17 1939-54 16 3.40 Collinwood 35-ll 87-44 1949-54 6 3,60 Columbia Power House 35-37 87-01 1940-50 ll 3,88 Columbia 35-37 87-03 1942-54* 10 3.77
Columbia Substation 35-40 87-02 1939-54 16 4.00 Conasauga 1 N 35-01 84-44 1949-54 6 4.39 Concord 35-54 84-ll 1939-54 16 3.56 Cookeville 36-09 85-31 1942-47 6 1.44 2.14 3.32 Cookeville 1 w 36-10 85-30 1939-54* 12 3,35
Copperhill 35-01 84-23 1939-54 16 3.77 Copperhill Substation 35-00 84-23 1939-54 16 3.71 Cosby 35-47 83-13 1941-54 14 3.04 Covington 35-33 89-36 1939-54 16 4.22 Crandull 36-32 81-58 1939-54 16 2.26
Crossville CAA AP 35-57 85-05 1939-54 16 3.53 Crossville Experiment Station 36-01 85-08 1939-54 16 3.28 Cuba Landing TVA 29 35-52 87-53 1940-50 11 1.48 2.35 3,27 Dale Hollow Dam 36-32 85-27 1942-54• g 3.54 Dale Hollow Dam 36-32 85-27 1944-50 7 1.21 2.25 3.47
*Breaks in Record
33

Table 2-1, cont.
Period Length 2-Year 1-Hour 2-Year -6-Hour 2-Year 24-Hour STATION Lat. Long. of of Record
Record (years) (inches) (inches) (inches)
TENNESSEE (continued)
Dandridge 36-01 83-25 1939-54 16 2.52 Decatur 1 N 35-32 84-47 1897-54* 55 3,59 Dibrell 35-48 85-48 1940-54 15 3.91 Dickson 36-04 87-24 1939-54 16 3.47 Dickson 36-04 87-24 1940-50 ll 1.48 2.67 3,63
Double Springs TVA 35-20 84-38 1949-54 6 3,94 Douglas Dam 35-58 83-32 1942-54 13 2.84 Dover Fire Tower 36-23 87-56 1947-54 8 3.29 Dover 1 NW 36-29 87-50 1898-54* 56 3.64 Dresden 36-17 88-43 1939-54 16 3. 56
Dunbar 35-27 88-09 1940-54 15 3.38 Dunlap 35-22 85-24 1939-54 16 4.19 Dyersburg 36-02 89-23 1942-50 9 1.60 2.66 3.52 Dyersburg CAA AP 36-01 89-24 1948-54 7 3,18 Eastland 35-54 85-15 1940-54 15 3.35
Elizabethton 36-21 82-14 1939-54 16 2.45 Elkmont 35-39 83-34 1939-43 5 2.81 Elk Valley 2 W 36-28 84-16 1940-54 15 3,44 Elora 35-01 86-21 1942-54 13 3.47 Embreeville 36-ll 82-28 1939-54 16 3.ll
Englewood 35·-24 84-31 1944-54 ll 3,54 Enville 35-24 88-26 1940-54 15 3,43 Erin 36-10 87-45 1939-54 16 3,86 Erwin 36-10 82-25 1939-54 16 2.52 Ethridge 35-19 87-18 1941-54 14 3.65
Etowah 35-20 84-32 1939-47 9 2.82 Falls Creek Park 35-41 85-19 1940-54 15 3.61 Farner 35-08 84-19 1941-54 14 3,86 Fayetteville 1 NE 35-09 86-,34 1939-54 16 3.77 Flat Gap 36-25 83-13 1939-54 16 2.76
Fort Loudoun Dam TVA 490 35-48 84-15 1950-54 5 3.05 Fort Loudoun Dam TVA 490 35-48 84-15 1941-50 10 1.50 2.32 3,85 Fountain City 36-02 83-56 1945-53 9 3,06 Frankfort 36-07 84-48 1941-54 14 2.99 Franklin 2 SE 35-53 86-51 1939-54 16 3.49
Friendship School 35-16 85-05 1949-54 6 4.29 Gainesboro 36-22 85-37 1940-54 15· 3,67 Gatlinburg 2 SW 35-43 83-31 1939-54 16 2,92 Greeneville Experiment Station 36-04 82-50 1939-54 16 2,96 Greeneville 5 SSW 36-05 82-50 1939-54 16 3.04
Greenfield 36-09 88-48 1942-50* 8 1.79 2.57 3.33 Hales Bar Dam 35-03 85-32 1940-54 15 3.40 Halls 35-51 89-26 1939-49 ll 3",35 Hamptog 36-17 82-10 1949-54 6 2.30 Harriman TVA 484 35,-56 84-33 1941-50 10 1. 51 2.31 4.01
Hartford 35-49 83-09 1939-54 16 2.66 Haw Knob TVA 179 35-19 84-02 1940-50 ll 1.38 2.33 3,87 Hebbertsburg 36-01 84-46 1939-54 16 3.48 Herbert 35-46 85-15 1940-54 15 2,95 Hickory Grove 35-25 84-23 1949-54 6 3.66
Hillsboro 2 SE 35-23 85-57 1950-54 5 4.10 Hohenwald 35-33 87-33 1939-54 16 3.67 Humboldt 35-50 88-55 1940-50 ll 1.48 2.73 3.47 Huntingdon 36-01 88-26 1939-54 16 3,70 Iron City 35-01 87-35 1939-54 16 3,68
Irving College 35-35 85-44 1940-54 15 3,52 Isabella TVA 106 35-02 84-22 1943-50 8 1,60 2.39 4.09 Jacks Creek 35-30 88-30 1944-48 5 4.03 Jackson Experiment Station 35-37 88-50 1939-54 16 4.24 Jackson 2 SE 35-39 88-50 1.939-54 16 4.03
Jackson Substation 35-35 88-48 1939-54 16 3.94 Jamestown 1 NE 36-26 84-56 1950-54 5 2.82 Jasper 35-04 85-37 1940-54 15 3.84 Jearo1dstown 36-22 82-42 1939-54 16 3.72 Jeffex-son City Evaporation 36-07 83-30 1950-54 5 2.83
Jefferson City 2 W 36-06 83-32 1940-50 ll 1.27 1.95 3.19 Johnson City ETSC 36-18 82-22 1949-54 6 2.78 Johnson City Substation 36-20 82-20 1948-54 7 2.39 Johnson City Veterans Hospital 36-19 82-23 1939-54 16 2.64 Johnsonville Steam Plant 36-02 87-59 1939-54 16 3.53
Joppa 36-14 83-37 1939-54 16 2.60 Kenton 36-12 89-01 1940-54 15 3.67 Kingsport 3 SE 36-31 82-30 1939-54 16 2.59 Kingston 35-52 84-32 1939-54 16 3.48 Kingston Springs 2 NE 36-07 87-08 1941-54* 13 3.95
Kit tie 35-27 84-10 1939-54 16 3.10 Knoxville Garage 35-59 83-55 1946-53 8 2.98 Knoxville WB AP 35-49 83-59 1903-51 49 1.48 2.31 3.27 LaFollette 36-22 84-08 1339-54 16 2.28 Lake City 36-14 84-10 1940-50 11 3.23
*Breaks ~n Record
34
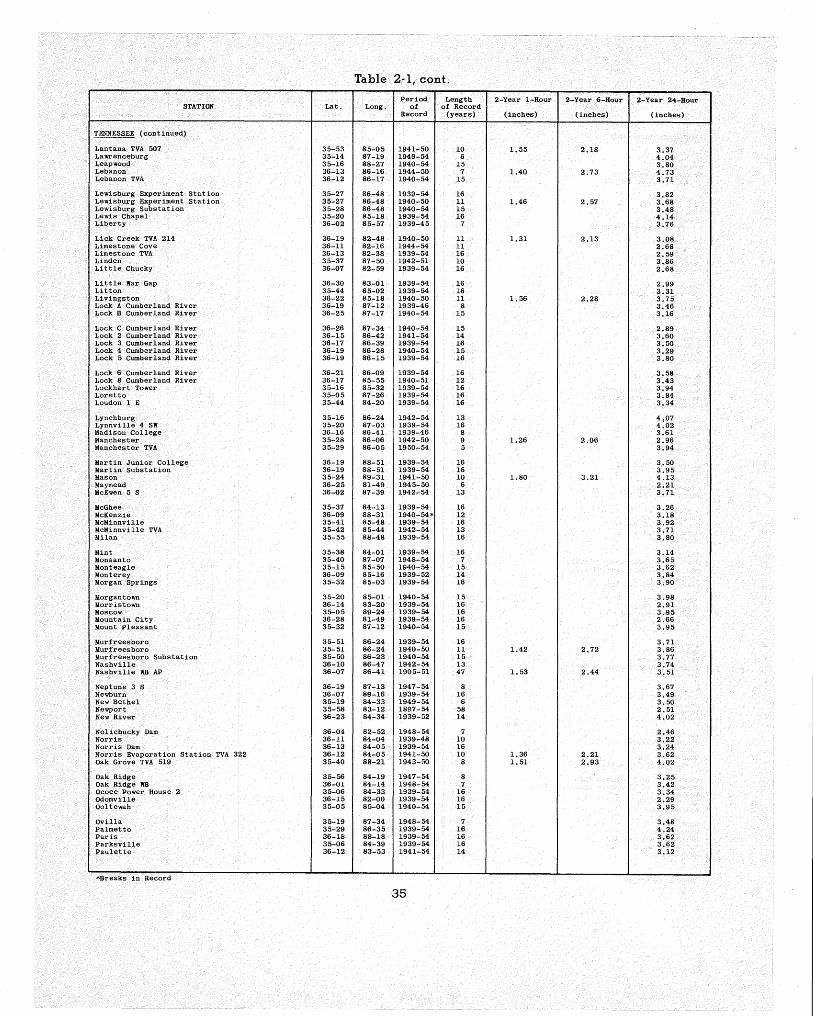
Table 2-1, cont.
Period Length 2-Year 1-Hour 2-Year -6-Hour 2-Year 24-Hour STATION Lat. Long. of of Record
Record (years) (inches) (inches) (inches)
TENNESSEE (continued)
Lantana TVA 507 35-53 85-05 1941-50 10 1.55 2.18 3.37 Lawrenceburg 35-14 87-19 1949-54 6 4.04 Leap wood 35-16 88-27 1940-54 15 3,80 Lebanon 36-13 86-16 1944-50 7 1.40 2,73 4.73 Lebanon TVA 36-12 86-17 1940-54 15 3. 71
Lewisburg Experiment Station 35-27 86-48 1939-54 16 3.82 Lewisburg Experiment Station 35-27 86-48 1940-50 ll 1.46 2.57 3.68 Lewisburg Substation 35-28 86-48 1940-54 15 3,48 Lewis Chapel 35-20 85-18 1939-54 16 4.14 Liberty 36-02 85-57 1939-45 7 3.76
Lick Creek TVA 214 36-19 82-48 1940-50 ll 1.31 2.13 3,08 Limestone Cove 36-ll 82-16 1944-54 ll 2.68 Limestone TVA 36-13 82-38 1939-54 16 2.59 Linden 35-37 87-50 1942-51 10 3.86 Little Chucky 36-07 82-59 1939-54 16 2.68
Little War Gap 36-30 83-01 1939-54 16 2.99 Litton 35-44 85-02 1939-54 16 3.31 Livingston 36-22 85-18 1940-50 ll 1.56 2.28 3. 75 Lock A Cumberland River 36-19 87-12 1939-46 8 3.46 Lock B Cumberland River 36-25 87-17 1940-54 15 3.16
Lock C Cumberland River 36-26 87-34 1940-54 15 2.89 Lock 2 Cumberland River 36-15 86-42 1941-54 14 3,60 Lock 3 Cumberland River 36-17 86-39 1939-54 16 3.50 Lock 4 Cumberland River 36-19 86-28 1940-54 15 3.29 Lock 5 Cumberland River 36-19 86-15 1939-54 16 3.80
Lock 6 Cumberland River 36-21 86-09 1939-54 16 3.58 Lock 8 Cumberland River 36-17 85-55 1940-51 12 3,43 Lockhart Tower 35-16 85-32 1939-54 16 3.94 Loretto 35-05 87-26 1939-54 16 3.84 Loudon 1 E 35-44 84-20 1939-54 16 3.34
Lynchburg 35-16 86-24 1942-54 13 4,07 Lynnville 4 sw 35-20 87-03 1939-54 16 4.02 Madison College 36-16 86-41 1939-46 8 3.61 Manchester 35-28 86-06 1942-50 9 1.26 2.06 2.96 Manchester TVA 35-29 86-05 1950-54 5 3.94
Martin Junior College 36-19 88-51 1939-54 16 3.50 Martin Substation 36-19 88-51 1939-54 16 3,95 Mason 35-24 89-31 1941-50 10 1.80 3.21 4.13 Maymead 36-25 81-49 1945-50 6 2.21 McEwen 5 S 36-02 87-39 1942-54 13 3.71
McGhee 35-37 84-13 1939-54 16 3.26 McKenzie 36-09 88-31 1940-54* 12 3.18 McMinnville 35-41 85-48 1939-54 16 3 .. 92 McMinnville TVA 35-42 85-44 1942-54 13 3.71 Milan 35-55 88-48 1939-54 16 3.80
Mint 35-38 84-01 1939-54 16 3.14 Monsanto 35-40 87-07 1948-54 7 3.65 Monteagle 35-15 85-50 1940-54 15 3,62 Monterey 36-09 85-16 1939-52 14 3,84 Morgan Springs 35-32 85-03 1939-54 16 3.90
Morgantown 35-20 85-01 1940-54 15 3,98 Morristown 36-14 83-20 1939-54 16 2.91 Moscow 35-05 89-24 1939-54 16 3 .. 95 Mountain City 36-28 81-49 1939-54 16 2.66 Mount Pleasant 35-32 87-12 1940-54 15 3.95
Murfreesboro 35-51 86-24 1939-54 16 3,71 Murfreesboro 35-51 86-24 1940-50 ll 1,42 2.72 3,86 Murfreesboro Substation 35-50 86-23 1940-54 15 3.77 Nashville 36-10 86-47 1942-54 13 3,74 Nashville WB AP 36-07 86-41 1905-51 47 1.53 2.44 3. 51
Neptune 3 S 36-19 87-13 1947-54 8 3.67 Newburn 36-07 89-16 1939-54 16 3.49 New Bethel 35-19 84-33 1949-54 6 3.50 Newport 35-58 83-12 1897-54 58 2.51 New River 36-23 84-34 1939-52 14 4.02
Nolichucky Dam 36-04 82-52 1948-54 7 2.46 Norris 36-ll 84-04 1939-48 10 3.22 Norris Dam 36-13 84-05 1939-54 16 3,24 Norris Evaporation Station TVA 322 36-12 84-05 1941-50 10 1,36 2.21 3.62 Oak Grove TVA 519 35-40 88-21 1943-50 8 1.51 2.93 4.02
Oak Ridge 35-56 84-19 1947-54 8 3,25 Oak Ridge WB 36-01 84-14 1948-54 7 3,42 Ocoee Power House 2 35-06 84-33 1939-54 16 3.34 Odomville 36-15 82-00 1939-54 16 2.29 Ooltewah 35-05 85-04 1940-54 15 3,95
Ovilla 35-19 87-34 1948-54 7 3,48 Palmetto 35-29 86-35 1939-54 16 4.24 Paris 36-18 88-18 1939-54 16 3.62 Parksville 35-06 84-39 1939-54 16 3.62 Paulette 36-12 83-53 1941-54 14 3.12
*Breaks in Record
35

Table 2-1, cont.
Period Length 2-Year 1-Hour 2-Year ·6-Hour 2-Year 24-Hour STATION Lat. Long. of of Record
Record (years) (inches) (inches) (inches)
TENNESSEE (continued)
Perryville 35-38 88-02 1939-54 16 3.60
Petersburg 35-19 86-39 1939-54 16 3.91 Petros 36-06 84-26 1939-54 16 3.71 Pickwick Landing Dam 35-04 88-15 1939-54 16 3.56 Pickwick 2 (nr) TVA 39 35-03 88-15 1940-45 6 1. 51 2.49 3. 73
Pigeon Forge 35-47 83-33 1941-54 14 2.40 Pilot Mountain 36-12 84-40 1939-54 16 3.02 Pinewood 35-54 87-28 1939-54 16. 3.42 Pleasantville 35-42 87-44 1940-54 15 3.79 Pt. Park Lookout Mountain 35-00 85-22 1949-54 6 4.03
Porter Lake 35-37 84-50 1941-54 14 3.32 Portland 36-35 86-30 1944-50 7 1.63 2.54 3.39 Portland (nr) 36-33 86-26 1942-47 6 2.94 Providence 35-51 83-47 1939-54 16 3.06 Pulaski 35-12 87-01 1939-54 16 3.83
Reagan TVA 31 35-30 88-20 1940-50 ll 1.34 2.57 3.62 Red Boiling Springs 4 NNW 36-34 85-53 1945-54 10 3.89 Riddles Store 35-37 84-33 1940-54 15 3.50 Ritta 36-03 83-52 1945-54 10 3.06 Roan High Knob TVA 231 36-06 82-08 1940-50 ll 1.25 1.86 3.25
Rock Island 2 NW 35-48 85-38 1939-54>1 15 3.74 Rock Island 2 NW 35-48 85-38 1940-50 ll 1.56 2.46 3.64 Rockwood 35-52 84-41 1941-54 14 4.13 Rocky River 35-39 85-34 1940-54 15 3.43 Roddy TVA 157 35-46 84-46 1943-50 8 1.24 2.39 4.24
Rogersville 1 S 36-24 83-01 1939-54 16 2.62
Rugby 36-22 84-42 1939-48 10 3.72 Samburg Wildlife Refuge 36-23 89-21 1942-54 13 3. 53 Samburg Wildlife Refuge 36-23 89-21 1942-50 9 1.92 2. 78 3.94 Sassafras Knob TVA 101 35-06 84-25 1943-50 8 1.80 2.60 3.80
Savannah 35-14 88-15 1897-54 58 4.07 Savannah TVA 34A 35-13 88-14 1945-50 6 1. 79 2.79 4.40
Selmer 35-10 88-37 1939-54 16 3.91
Sevierville 35-53 83-35 1944-54 11 2.99 Sewanee 35-12 85-55 1939-54 15 3.91
Shady Grove TVA 380 35-43 87-17 1940-50 ll 1.45 2,67 3.88 Shelbyville 35-29 86-28 1940-54 15 3. 76
Shiloh 35-09 88-19 1939-54 16 4.02 Signal Mountain 35-07 85-21 1949-54 6 4.22
Smithville CAA AP 35-55 85-49 1941-48 8 3.43
Smyrna 4 NE 36-00 86-28 1943-54 13 3.46 Sneedville (nr) 36-27 83-14 1939-44 6 2.70 South Holston Dam 36-31 82-05 1948-54 7 2. 57 South Nashville 36-10 86-43 1940-54 15 3. 73 Sparta 2 NW 35-57 85-30 1941-54 14 3.14
Sparta TVA 35-55 85-28 1940-54 15 3.43 Springfield Experiment Station 36-26 86-51 1944-54 ll 3.26 Springfield Experiment Station 36-26 86-51 1940-50 ll 1.45 2.45 3.18 Springville 36-17 88-09 1939-54 16 3.42 Stanley Knobs TVA 516 36-31 82-54 1943-50 8 1.46 1.79 2.50
Stone Mountain 36-12 82-14 1939-54 16 2.68 Strawberry Plains 36-04 83-41 1939-54 16 2.64 Sugar Hill TVA 505 35-33 87-49 1941-50 10 2.09 3.27 4.45 Summitville TVA 443 35-33 85-59 1942-50 9 1.44 2.49 3.80 Sunbright 2 SW 36-14 84-42 1940-50 ll 1. 58 2.12 3.26
Taylors 36-00 85-23 1940-54 15 3.70 Tazewell 2 SE 36-25 83-33 1939-54 16 3.07 Tellico Plains 35-22 84-18 1939-54 16 3.23 Tellico Ranger Station 35-21 84-14 1947-54 8 3.17 Thorn Hill 36-22 83-25 1947-54 8 2.96
· Trade 36-21 81-44 1943-52 10 2.65 Tri City AP 36-29 82-24 1939-48 10 2.53 Trousdale 35-40 85-56 1940-54 15 3.70 Tullahoma 35-22 86-12 1939-54 16 3.67
Turley 36-22 84-16 1942-54 13 2.98
Turtletown 35-07 84-21 ' 1939-54 16 3. 55 Tusculum College 36-10 82-46 1941-53 13 3.26
Union City 36-25 89-04 1939-54 16 3.32 Union City 2 SE 36-25 89-03 1942-50 9 1.68 2.64 3.25
u. S. Cotton Field Station 35-53 83-56 1944-54 ll 3.22
University of Tennessee Farm 35-57 83-57 1949-54 6 3.26 University of Tennessee Lysimeter Plot 35-57 83-57 1944-54 11 3.58 vasper 36-16 84-ll 1939-54 16 2.93 Victory TVA 40 35-06 87-51 1940-50 11 1.61 2.80 3..42 Walkers Ford 36-20 83-42 1941-54 14 3.18
Walland 35-46 83-51 1941-51 ll 3.06
Watauga Dam 36-20 82-07 1947-54 8 2.52 Watts Bar Dam TVA 421 35-37 84-47 1939-54 16 3. 71 Watts Bar Dam TVA 421 35-37 84-47 1940-44 5 1. 50 2.25 3.49
Waynesboro 35-18 87-48 1939-54 16 3,73
* Breaks ~n Record
36

Table 2-1, cont.
Period Length 2-YECar 1-Hour 2-Year ·6-Hour 2-Year 24-Hour STATION Lat. Long. of of Record
Record (years) (inches) (inches) (inches)
TENNESSEE (continued)
Waynesboro 5 NW 35-21 87-50 1945-53 9 3. 79 Well Spring 36-26 83-59 1939-54 16 2.99 West bourne 36-29 84-02 1940-52 13 3.32 White Hollow TVA 327 36-22 83-54 1940-50 ll 1.35 1.78 2.89 White Pine 36-07 83-17 1939-54 16 2.82
Whittle Springs 36-01 83-55 1945-53 9 3.22 Wildersville 35-47 88-22 1939-54 16 3.85 Winchester Substation 35-14 86-06 1949-54 6 4.03 Wolf Creek 35-55 82-56 1939-54 16 2.74 Worsham 36-20 86-41 1939-44 6 3.26
VIRGINIA
Abingdon 36-42 82-00 1949-54* 5 2.76 Big Knob TVA 314 36-40 82-30 1940-50 ll .96 1.51 2.45 Blacksburg 2 37-14 80-25 1897-54 58 2.72 Bristol 36-36 82-10 1941-54 14 2.48 Bristol TVA 36-37 82-10 1948-54 7 2.28
Burkes Garden 37-06 81-20 1897-54 58 2.66 Byllesby 36-48 80-55 1948-54 7 2.60 Catawba Sanitarium 37-23 80-05 19ll-54 44 3.36 Cleveland 36-57 82-09 1939-54 16 3.25 Clinchport 36-40 82-45 1939-54 16 2.68
Copper Hill 37-06 80-07 1948-54 7 4.45 Covington 37-48 80-00 1949-54 6 3.08 Damascus 36-38 81-48 1939-54 16 2.77 Dante 36-59 82-18 1939-54 16 2. 71 Dante 36-59 82-18 1941-50* 9 1.33 2.22 2.90
Darwin 37-05 82-30 1950-54 5 2.34 Davenport 37-07 82-06 1949-54 1:! 2.40 Dunbar 36-58 82-45 1939-54 16 2.63 Dungannon 36-50 82-26 1939-54 16 2.64 Emory 36-46 81-50 1939-51* 12 2.76
Floyd 36-55 80-19 1939-54 16 4.24 Floyd 2 36-55 80-18 1950-54 5 3. 76 Galax 3 S 36-38 80-56 1949-54 6 2.63 Glen Lyn 37-22 80-52 1939-54 16 2. 56 Groseclose 36-52 81-20 1942-54* ll 2.69
Grundy 37-17 82-06 1949-54 6 2.64 Haysi 37-13 82-17 1949-54 6 2.92 High Knob TVA 344 36-54 82-38 1941-50 10 1.68 2.32 2.90 Hillsville 1 NW 36-46 80-45 1948-54 7 3.ll Holston ,36-50 82-05 1939-54 16 2.41
Honaker 3 NE 37-03 82-02 1939-54 16 2.88 Honaker TVA 614 37-01 81-59 1943-50* 7 1.40 2.00 2.44 Hurley 37-26 82-02 1941-50 10 1.42 2.01 2.58 Independence 36-36 81-07 1949-54 6 2.68 Indian Valley 36-54 80-34 1941-50 10 1.54 2.21 2.81
Ivanhoe 36-50 80-58 1939-48* 9 2.60 Jewell Ridge 37-ll 81-47 1939-54 16 2.72 Jonesville 36-41 83-06 1939-49 ll 2.92 Jonesville 2 SSE 36-40 83-06 1947-54 8 2.75 Jordan Mines 37-41 80-05 1940-50 ll 1.40 1. 79 2.56
Loves MiU 36-45 81-41 1939-54 16 2. 53 Marion 36-51 81-31 1939-54 16 2.34 Mendota 36-42 82-18 1905-54 50 2.50 Mountain Lake 37-24 80-30 1939-47 9 3.02 New Castle 37-30 80-06 1949-54 6 2.71
Newport 2 NW 37-19 80-31 1948-54 7 2.64 North Bristol Substation 36-37 82-ll 1948-54 7 2.57 Olinger 36-49 82-52 1939-54 16 2.81 Pennington Gap 1 W 36-45 83-03 1939-54 16 2.66 Pilot 37-03 80-22 1949-54 6 2.77
Pinnacles Meadows Dam 36-41 80-25 1939-49 ll 4.42 Pulaski 37-02 80-47 1949-54 6 2.84 Pulaski CAA AP 37-05 80-47 1950-54 5 2.40 Pulaski CAA AP 37-05 80-47 1942-50 9 1.28 2.14 2.66 Radford 37-05 80-35 1939-54 16 2.38
Rocky Knob 36-51 80-22 1949-54 6 3.40 Rose Hill 36-40 83-22 1939-54 16 3.06 Saltville 36-53 81-46 1941-54 14 2.42 Saltville 1 N 36-53 81-46 1949-54 6 2.66 Slate 37-16 81-56 1948-54 7 1.98
Speedwell 36-49 81-10 1948-54 7 2.39 Spring Creek TVA 355 37-00 81-39 1940-50 ll 1.27 1.86 2.65 Stuart 36-38 80-16 1939-54* 15 3.66 Sugar Grove 36-46 81-25 1939-54 16 2.58 Swords Creek 37-02 81-55 1939-54 16 2.52
Tazewell 37-07 81-31 1939-54 16 2.64 Trout Dale 36-42 81-26 1940-50 ll 1.37 2.34 3.34 Wallace 36-39 82-08 1939-54* 14 2.57 White Gate 37-12 80-50 1941-50 10 1.25 1.84 2.56
* Breaks 1.n Record
37
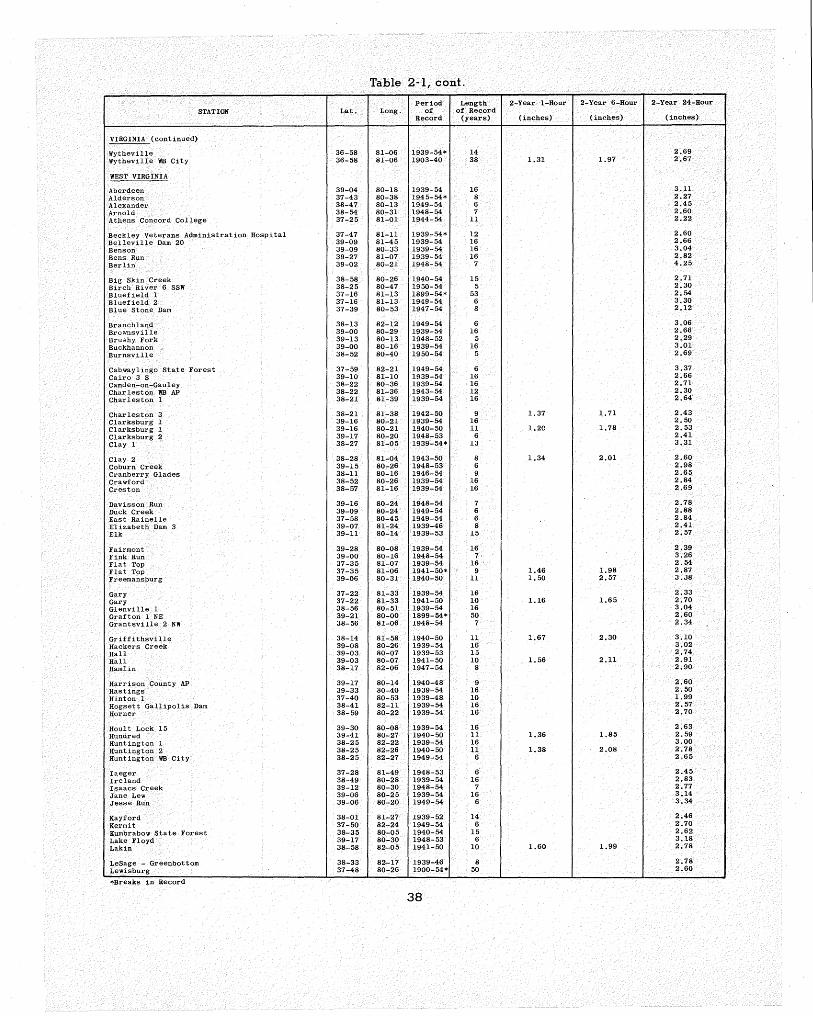
Table 2-1, cont.
Period Length 2-Year 1-Hour 2-Year -6-Hour 2-Year 24-Hour STATION Lat. Long. of of Record
Record (years) (inches) (inches) (inches)
VIRGINIA (continued)
Wytheville 36-58 81-06 1939-54* 14 2.69 Wytheville WB City 36-58 81-06 1903-40 38 1.31 1.97 2.67
WEST VIRGINIA
Aberdeen 39-04 80-18 1939-54 16 3.ll Alderson 37-43 80-38 1945-54* 8 2.27 Alexander 38-47 80-13 1949-54 6 2.45 Arnold 38-54 80-31 1948-54 7 2.60 Athens Concord College 37-25 81-01 1944-54 ll 2.22
Beckley Veterans Administration Hospital 37-47 81-11 1939-54* 12 2.60 Belleville Dam 20 39-09 81-45 1939-54 16 2.66 Benson 39-09 80-33 1939-54 16 3.04 Bens Run 39-27 81-07 1939-54 16 2.82 Berlin . 39-02 80-21 1948-54 7 4.25
Big Skin Creek 38-58 80-26 1940-54 15 2.71 Birch River 6 SSW 38-25 80-47 1950-54 5 2.30 Bluefield l 37-16 81-13 1899-54* 53 2.54 Bluefield 2 37-16 81-13 1949-54 6 3.30 Blue Stone Dam 37-39 80-53 1947-54 8 2.12
Branchland 38-13 82-12 1949-54 6 3.06 Brownsville 39-00 80-29 1939-54 16 2.66 Brushy Fork 39-13 80-13 1948-52 5 2.29 Buckhannon 39-00 80-16 1939-54 16 3.01 Burnsville 38-52 80-40 1950-54 5 2.69
Cabwaylingo State Forest 37-59 82-21 1949-54 6 3·.37
Cairo 3 S 39-10 81-10 1939-54 16 2.66 Camden-on-Gauley 38-22 80-36 1939-54 16 2.71 Charleston WB AP 38-22 81-36 1943-54 12 2.30 Charleston 1 38-21 81-39 1939-54 16 2.64
Charleston 3 38-21 81-38 1942-50 9 1.37 1. 71 2.43 Clarksburg 1 39-16 80-21 1939-54 16 2.50 Clarksburg 1 39-16 80-21 1940-50 11 1.20 1.78 2.53 Clarksburg 2 39-17 80-20 1948-53 6 2.41 Clay 1 38-27 81-05 1939-54* 13 3.31
Clay 2 38-28 81-04 1943-50 8 1.34 2.01 2.60 Coburn Creek 39-15 80-26 1948-53 6 2.98 Cranberry Glades 38-11 80-16 1946-54 9 2.65 Crawford 38-52 80-26 1939-54 16 2.84 Creston 38-57 81-16 1939-54 16 2.69
Davisson Run 39-16 80-24 1948-54 7 2.78 Duck Creek 39-09 80-24 1949-54 6 2.88 East Rainelle 37-58 80-45 1949-54 6 2.84 Elizabeth Dam 3 39-07 81-24 1939-46 8 2.41 Elk 39-ll 80-14 1939-53 15 2.57
Fairmont 39-28 80-08 1939-54 16 2.39 Fink Run 39-00 80-16 1948-54 7 3.26 Flat Top 37-35 81-07 1939-54 16. 2.54 Flat Top 37-35 81-06 1941-50* 9 1.46 1.98 2.87 Freemansburg 39-06 80-31 1940-50 11 1. 50 2.57 3.38
Gary 37-22 81-33 1939-54 16 2.33 Gary 37-22 81-33 1941-50 10 1.16 1.65 2.70 Glenville 1 38-56 80-51 1939-54 16 3.04 Grafton 1 NE 39-21 80-00 1899-54* 50 2.60 Grantsville 2 NW 38-56 81-06 1948-54 7 2.34
Griffithsville 38-14 81-58 1940-50 11 1.67 2.30 3.10 Hackers Creek 39-08 80-26 1939-54 16 3.02 Hall 39-03 80-07 1939-53 15 2.74 Hall 39-03 80-07 1941-50 10 1.56 2.11 2.91 Hamlin 38-17 82-06 1947-54 8 2.90
Harrison County AP 39-17 80-14 1940-48 ·9 2.60 Hastings 39-33 30-40 1939-54 16 2.50 Hinton 1 37-40 80-53 1939-48 10 1.99 Hogsett Gallipolis Dam 38-41 82-11 1939-54 16 2.57 Horner 38-59 80-22 1939-54 16 2.70
Hoult Lock 15 39-30 80-08 1939-54 16 2.63 Hundred 39-41 80-27 1940-50 ll 1.36 1.85 2.59 Huntington l 38-25 82-22 1939-54 16 3.00 Huntington 2 38-25 82-26 1940-50 ll 1.38 2.08 2.78 Huntington WB City 38-25 82-27 1949-54 6 2.65
Iaeger 37-28 81-49 1948-53 6 2.45 Ireland 38-49 80-28 1939-54 16 2.83 Isaacs Creek 39-12 80-30 1948-54 7 2.77 Jane Lew 39-06 80-25 1939-54 16 3.14 Jesse Run 39-06 80-20 1949-54 6 3.34
Kayford 38-01 81-27 1939-52 14 2.46 Kermit 37-50 82--24 1949-54 6 2.70 Kumbrabow State Forest 38-35 80-05 1940-54 15 2.62 Lake Floyd 39-17 80-30 1948-53 6 3,18 Lakin 38-58 82-05 1941-50 10 1.60 1.99 2.78
LeSage - Greenbottom 38-33 82-17 1939-46 8 2.78 Lewisburg 37-48 80-26 1900-54* 50 2.60
* Breaks 1n Record
38

Table 2-1, cont.
Period Length 2-Year 1-Hour 2-Year ·6-Hour 2-Year 24-Hour STATION Lat. Long. of of Record
Record (years) (inches) (inches) (inches)
WEST VIRGINIA (continued)
Lindside 37-27 80-40 1949-54 6 2.34 Little Skin Creek 38-'58 80-25 1948-54* 6 2.95 Liverpool 38-54 81-32 1940-50 ll 1.43 1.81 2.42 Lockney 38-51 80-58 1944-50 7 1.40 1,81 2.35 Logan 37-51 82-00 1902-54* 42 2,67
Logan 37-51 82-00 1941-50 lO 1.36 1.83 2.31 London Locks 38-12 81-22 1939-54 16 2,63 MacFarlan 39-05 81-12 1941-50 10 1.76 2.38 2.94 Madison 38-03 81-49 1939-54* 15 2.98 Man 37-44 81-53 1948-54 7 2.68
Mannington l N 39-33 80-21 1948-54 7 2.66 Mannington l W 39-32 80-22 1939-54 16 2.78 !darlington 38-13 80-05 1899-52* 37 2.62 !darlington 38-13 80-05 1944-50 7 1.21 1.71 2.39 McMechen Dam 13 39-59 80-44 1939-54 16 2.48
Middlebourne 2 ESE 39-29 80-52 1941-54 14. 2.96 Midvale 38-57 80-05 1939-53 15 2.88 Mount Clare 39-13 80-20 1939-54 16 2.57 Naoma 1 SE 37-52 81-30 1950-54 5 2.68 Naoma 1 E 37-52 81-30 1941-50 lO 1.25 l. 70 2.42
New Martinsville 39-39 80-52 1899-54 56 2.50 Oak Hill 37-58 81-09 1943-54 12 2.93 Oak Hill 37-58 81-09 1942-50 9 1.49 1.99 2.63 Parkersburg CAA AP 39-21 81-26 1948-54 7 2.84 Parkersburg WB City 39-16 81-34 1903-51 49 1.23 1.90 2. 52
Philippi 39-09 80-02 1939-54 16 2.57 Pickens 1 38-40 80-13 1939-54* 14 3,18 Pineville 37-35 81-32 1942-54* 12 2.72 Point Pleasant 38-51 82-08 1939-53 15 2.70 Polk Creek 39-03 80-34 1948-54 7 3,25
Princeton 37-22 81-05 1940-54 15 2.33 Rainelle 37-58 80-47 1939-54 16 2,60 Ravenswood Dam 22 38-57 81-46 1939-54 16 2.54 Renick 2 S 37-58 80-21 1949-54 6 2.78 Richwood 2 N 38-15 80-32 1939-54 16 2.93
Right Fork Stonecoal Creek 38-57 80-20 1948-54 7 3,12 Ripley 38-49 81-43 1944-54 ll 2.51 Roanoke 38-56 80-29 1939-54 16 2,53 Rockford 39-08 80-20 1939-54 16 2.95 Rohrbough 38-59 80-30 1948-54 7 2.89
Ryan 38-39 81-28 1939-44 6 3.07 St, Marys 39-23 81-12 1939-54* 15 3,13 Salem 39-17 80-34 1939-53 15 2.90 Sand Fork 38-55 80-26 1947-54 8 2.52 Shady Springs 2 ESE 37-42 81-03 1949-53 5 2.96
Shinnston 39-23 80-18 1939-53 15 2.80 Smithburg 39-17 80-43 1940-50 ll 1.34 2.48 3.06 Spencer 38-48 81-21 1900-54* 51 2.66 Sugarcamp Run 38-50 80-25 1948-54 7 2.62 Summersville 2 38-17 80-51 1941-54 14 2.68
Summersville 2 38-17 80-51 1940-50 ll 1.21 1.92 2.60 Sutton 2 38-40 80-43 1950-54 5 2.64 Sutton 3 SE 38-39 80-40 1945-50 6 1.40 2.47 3.00 Sutton 3 SE 38-39 80-40 1939-50 12 3.26 Sycamore Creek 39-14 80-25 1948-54 7 3.13
Tribble 38-41 81-50 1942-50 9 1.22 1,84 2.73 Tygart Dam 39-19 80-02 1940-50 ll 1.04 1. 73 2.63 Union 37-36 80-32 1939-54 16 2.39 Union 37-36 80-32 1940-50 ll 1.00 1.50 2.14 Upper Davisson Run 39-16 80-26 1947-54 8 2.69
Upper Sycamore Creek 39-14 80-27 1948-53* 5 2.90 Valley Chapel 39-06 80-24 1939-54 16 3.10 Valley Head 38-33 80-02 1939-54 16 2.46 Valley Head 38-33 80-02 1940-50 ll 1.38 2.00 2.63 Vandalia 38-56 80-24 1939-54 16 2.54
Vienna-Briscoe 39-21 81-32 1948-54 7 2.83 Washington Dam 19 39-15 81-42 1939-54 16 2.58 Wayne 38-13 82-26 1939-48 10 2.76 Webster Springs 38-29 80-25 1943-54 12 2.98 Webster Springs 38-29 80-25 1943-50 8 1.26 2.27 2.97
West Milford 39-12 80-24 1939-54 16 2.70 Weston 39-02 80-28 1939-54 16 3,25 White Sulphur Springs 37-48 80-18 1939-54 16 2.16 Williamson 37-40 82-17 1939-54 16 2.87 Winfield Locks 38-32 81-52 1939-54 16 2.68
* Breaks in Record
39

Table 2-2. Station Data (100- Year 1-, 6-, and 24-Hour)
Period Length 100-Year 1-Hour 100-Year 6-Hour 100-Year 24-Hour STATION Lat. Long, of of Record
Record (years) (inches) (inches) (inches)
ILLINOIS
Cairo WB City 37-00 89-10 1903-51 49 3,08 5.52 7.29 Charleston 39-29 88-10 1897-54* 57 6.16 Chester 37-54 89-49 1897-54* 57 8.18 Decatur 39-51 88-58 1897-54 58 5.37 Greenville 38-53 89-24 1897-54 58 6.29
Mascoutah 38-29 89-48 1897-53 57 8.13 McLeansboro 38-05 88-32 1897-54 58 7.40 Mt . Carmel 3 N 38-27 87-46 1898-54* 56 7.24 New Burnside 37-35 88-46 1897-54 58 7.18 Olney Radio Station 38-43 88-04 1897-53 57 6.65
Springfield WB City 39-48 89-39 1903-50 48 3.06 4.69 6.38
INDIANA
Evansville WB AP 38-02 87-32 1903-51 49 2.80 4.60 6.48 Indianapolis WB City 39-46 86-10 1903-51 49 3.10 5,08 5.50 Jeffersonville 38-16 85-45 1897-54 58 6,04 Madison 38-44 85-23 1897-54 58 5.67 Moores Hill 39-07 85-06 1902-54 53 5.34
Mount Vernon 37-56 87-54 1897-54 58 7 .oo Paoli 38-34 86-28 1898-54 57 6,58 Princeton 1 W 38-21 87-35 1897-54 58 6,25
Salem 38-37 86-06 1897-54 58 5.86 Scottsburg 38-42 85-47 1897-54 58 6.42'
Terre Haute WB AP 39-27 87-18 1912-51 40 3,27 5.15 6.49
~ Anchorage 38-16 85-33 1901-54 54 6.82 Berea College 37-34 84-18 1901-54 54 7 .ll Falmouth 38-40 84-20 1897-54 58 6.48 Hopkinsville 36-51 87-30 1897-54 58 7.41 Leitchfield 37-29 86-18 1897-54 58 6.15
Lexington WB AP 38-02 84-36 1903-53* 40 3,21 5,46 7.31 Louisville WB City 38-15 85-46 1903-51 49 2.48 3,72 6,41 Yount Sterling 38-04 83-56 1897-54* 56 5.82 Owensboro 2 W 37-46 87-09 1897-54 58 6.45 Shelbyville 2 W 38-13 85-16 1897-54 58 6,07
Williamsburg 36-44 84-10 1897-54 58 5.86
MISSOURI
Jackson 37-23 89-40 1899-54 56 7.67 Marble Hill 37-18 89-58 1897-54* 57 7.70
NORTH CAROLINA
Asheville WB City 35-36 82-32 1903-51 49 2.67 4,49 7.18 Brevard 35-14 82-44 1902-54* 48 9.29 Charlotte WB City 35-13 80-51 1903-51 49 3,14 4,93 6.90 Hendersonville 35-20 82-28 1898-54 57 9.96 Highlands 2 S 35-01 83-12 1897-54* 48 10.54
Lenoir 35-55 81-32 1897-54* 56 7.68 Marion 35-41 82-01 1897-54* 55 10.41 Morganton 35-45 81-41 1897-54* 56 8,69 Mt. Airy 36-30 80-36 1897-54 58 8.33 Murphy 35-05 84-02 1897-54* 54 6.99
Salisbury 35-40 80-29 1897-54 58 7.66
OHIO
Circleville 39-36 82-57 1897-54 58 5.82 Cincinnati WB City 39-06 84-30 1903-51 49 2.63 4.19 5.65 Columbus WB City 39-58 83-00 1903-51 49 2,63 3,48 4,50
Dayton WB AP 39-54, 84-12 1912-54* 38 2.61 3.78 5.ll Hillsboro 39-12 83-37 1897-54* 50 6,08
Philo 39-52 81-54 1897-54 58 4,83
Portsmouth 38-43 82-59 1897-54 58 5.49 Waverly 39-08 82-59 1897-54*. 55 4.49
~ Ashwood 35-36 87-09 1897-54 58 6.78 Bluff City 36-28 82-16 1897-54 58 3.83 Bolivar 2 35-15 88-59 1897-54* 50 8.38 Carthage 36-16 85-57 1897-54 58 6.46 Chattanooga WB AP 35-04 85-18 1903-48 46 2.90 4.72 6.80
Clinton 36-06 84-06 1897-54 58 7.09 Decatur 1 N 35-32 84-47 1897-54* 55 6.93 Dover 1 NW 36-29 87-50 1898-54* 56 6.84 Knoxville WB AP 35-49 83-59 1903-51 49 3,36 4,92 6.18 Nashville WB AP 36-07 86-41 1905-51 47 2,86 4,54 5.97
Newport 35-58 83-12 1897-54 58 4.30 Savannah 35-14 88-15 1897-54 58 8.14
*Breaks in Record
40

Table 2-2, cont.
Period Length 100-Year 1-Hour 100-Year 6-Hour 100-Year 24-Hour STATION Lat. Long. of of Record
Record (years) (inches) (inches) (inches)
~ Blacksburg 2 37-14 80-25 1897-54 58 5.09 Burkes Garden 37-06 81-20 1897-54 58 4.76 Catawba Sanitarium 37-23 80-05 1911-54 44 7.35 Mendota 36-42 82-18 1905-54 50 3.93 Wytheville WB City 36-58 81-06 1903-40 38 2.95 4.14 5.29
WEST VIRGINIA
Bluefield l 37-16 81-13 1899-54* 53 4.85 Grafton l NE 39-21 80-00 1899-54* 50 5.25 Lewisburg 37-48 80-26 1900-54* 50 4.89 Logan 37-51 82-00 1902-54* 42 5.30 Marlinton 38-13 80-05 1899-52* 37 4.95
New Martinsville 39-39 80-52 1899-54 56 4.40 Parkersburg WB City 39-16 81-34 1903-51 49 2.48 3.90 4.96 Spencer 38-48 81-21 1900-54* 51 5.19
* k Rec Brea s in ord
41

(J)
SEASONAL PROBABILITY _OF INTENSE RAfNFAL..L
1- HOUR- DURATION I 00 0.0 -o.o-0.0 -0.0-0.0-0.0 -0.2-0.2-0.0-0.0-0.0 -o.o
50 0.0-0.e>---:-0:0-0.0 -0.2-·0.0-0.7 --0.7-0.0-0.0-0.0-0.0
40
30
0:: 25 <( w >-z 20
u)• w ::::> .....1 <( > >-.....1 0:: <( w >-lL. 0
a 0 0:: w 0..
z 0:: ::::> ..... w 0:::
15
10
7
5
4
-3
2
J F M A M J J A s 0 N 0
Fig: ·2 . .;..8 Probability in percent of obtaining a rainfall in any month of a
particular year equal to or exceeding the yearly return period values taken- from the isopluvial .maps and diagrams.
42.

en a:: <( w >-
!:! en w :::> _J
~ ">
_J
a::
SEASONAL PROBABILITY OF INTENSE RAINFALL 6-HOUR DURATION
100 0.0-0.0-0.2-0.0-0.0-0.0-0.2-0.0-0.7-0.0-0.0-0.0
50 o.o-o.o-0.2-o.o-o.o -o.o -o.4-0.4-
40
30
25
20
<( 10 w >-LL. 0
a 7 r--~r---+---;---~--~---1 0 a:: w a.. z 5 a:: :::> [;j 4 1----1-----~ a::
3 1----1-----+--1
2
J F M A M
Fig. ~-;- 9 · Probability in percent of obtaining a rainfall in any month of a particular year equal to or exceeding the yearly return period values faken from the isopluvial maps and diagrams.
43

(/) a:: <t: w >-z u) w :::> ...J
~ >-...J a:: <t: w >-LL. 0 Q 0 o: w a.. 2 a:: :::> I-w a::
SEASONAL PROBABILITY OF INTENSE PRECIPITATION 24-HOUR DURATION
100 o.o-o.o-o.o-o.o-o.o-o.o-o.2-0.4-0.2-0.2-o.o-o.o
50 o.o-o.o-o.2-o.2·-o.o-o.2-0.2-o.4~o.4~o.2-o.o-o.o
40
30
25 0.0-0.2-0.9-0.2-0.0 -0.2-0.5-0.5-0.7- 0.4-0.0-0.0 I I
20
15 -+-----t---t-m -.--.----.--10
7
5
4
3
2
J F M A M J J A s 0 N D Fig. 2":"10 ·Probability in percent of obtaining a precipitation in any month of a
particular year equal· to or exceeding· the yearly return per'iod values tak
en fr..om the isopluvial maps and diagrams.
44 U. S. GOVERNMENT PRINTING OFFICE: 1957 0.-428981