Rainfall Intensity -Frequency Regimemi.nws.noaa.gov/oh/hdsc/Technical_papers/TP29P4.pdf · Rainfall...
45
U.S. DEPARTMENT OF COMMERCE LEWIS L. STRAUSS, Secretary WEATHER BUREAU F. W. REICHELDERFER, Chief TECHNICAL PAPER NO. 29 Rainfall Intensity -Frequency Regime Part 4-Northeastern United States (Rainfall regime, with other storm charac- teristics, for durations of 20 minvtes to 24 hours, area from point to 400 square miles, frequencies for return periods from 1 to 100 years, for the region east of longitude 80° W. and north of latitude 41° N.) Prepared by COOPERATIVE STUDIES SECTION HYDROLOGIC SERVICES DIVISION U.S. WEATHER BUREAU for ENGINEERING DIVISION SOIL CONSERVATION SERVICE U.S. DEPARTMENT OF AGRICULTURE WASHINGTON, D.C. MAY 1959 For sale by the Superintendent of Documents, U.S. Government Printing Office, Washington 25, D.C. • Price $1.25
Transcript of Rainfall Intensity -Frequency Regimemi.nws.noaa.gov/oh/hdsc/Technical_papers/TP29P4.pdf · Rainfall...

U.S. DEPARTMENT OF COMMERCE LEWIS L. STRAUSS, Secretary
WEATHER BUREAU F. W. REICHELDERFER, Chief
TECHNICAL PAPER NO. 29
Rainfall Intensity -Frequency Regime
Part 4-Northeastern United States
(Rainfall intensity-dur~tion-area-frequency regime, with other storm characteristics, for durations of 20 minvtes to 24 hours, area from point to 400 square miles, frequencies for return periods from 1 to 100 years, for the region east of longitude 80° W. and north of latitude 41° N.)
Prepared by
COOPERATIVE STUDIES SECTION
HYDROLOGIC SERVICES DIVISION
U.S. WEATHER BUREAU
for
ENGINEERING DIVISION
SOIL CONSERVATION SERVICE
U.S. DEPARTMENT OF AGRICULTURE
WASHINGTON, D.C.
MAY 1959
For sale by the Superintendent of Documents, U.S. Government Printing Office, Washington 25, D.C. • Price $1.25


INTRODUCTION . . . . .
SECTION I. ANALYSIS
Climate
Point Rainfall
Basic data
Duration analysis
Frequency analysis
Isopluvial maps . . .
100- to 2-year ratio maps
Areal Rainfall . . . . . . . . :-· . .
Area-depth relationships
Seasonal Variation
Analysis .
CONTENTS
Sixty-Minute Mass Curves of Rainfall .
SECTION II. APPLICATIONS
Introduction ..
Use of Maps and Tables
Need for judgment
REFERENCES ........ .
iii
Page
1
2
2
2
2
3
3
5
7
8
8
9
9
10
13
13
13
13
16

TABLES
SECTION I. Page
1-1 Sources of point rainfall data 2
1-2 Empirical factors for converting partial-duration series to annual series 5
1-3 Stations used to develop seasonal variation relationship 9
SECTION ll.
2-1 Examples of rainfall intensity (depth) duration-frequen~y-area computations 14
2-2 Station data (2-year 1-, 6-, and 24-hour) 17
2-3 Station data (100-year 1-, 6-, and 24-hour) 29
FIGURES
SECTION I.
1-1 Rainfall intensity (depth) duration diagrams
1-2 :&:'linfall intensity or depth vs. return period
1-3 Area-depth curves
1-4 Relationship between 5- and 60-minute rainfall
1-5 Average mass curves of 60-minute rainfall
SECTION IT.
2-1 Duration, frequency, area-depth diagrams, and examples of computation "(large working copy)
2-2 2-year 1-hour rainfall
2-3 2-year 6~hour rainfall
2-4 2-year 24-hour precipitation
2-5 Ratio of 100-year 1-hour to 2-year 1-hour rainfall
2-6 Ratio of 100-year 6-hour to 2-year 6-hour rainfall
2-7 Ratio of 100-year 24-hour to 2-year 24-hour precipitation
2-8 Seasonal probability of intense rainfall, 1-hour duration
2-9 Seasonal probability of intense rainfall, 6-hour duration
2-10 Seasonal probability of intense precipitation, 24-hour duration
iv
4
6
8
11
12
Inside Back Cover
Facing p. 16
IT
IT
IT
IT
33
34
35

Rainfall
Part 4:
Intensity - Frequency
Northeastern United
Regime
States
Rainfall intensity-duration-area-frequency regime, with other storm characteristics, for durations of 20 minutes to 24 hours, area from point to 400 square miles, frequencies for return periods from 1 to 100 years, for the region east of longitude 80 OW and north of latitude 41 °N.
INTRODUCTION
1. Authority. ·This report is the fourth of a series being prepared on a regional basis for the Soil Conservation Service, Department of Agriculture, to provide material for use in developing planning and design criteria for the Watershed Protection and Flood Prevention program (P. L. 566). Parts 1, 2, and 3 [1, 2, 3,] covered the region east of longitude 90 OW and south of latitude 40 ~.
2. Scope. The point-rainfall analysis is based largely on routine application of the theory of extreme values, with empirical transformation to include consideration of the high values that are excluded from the annual series. Analysis of areal rainfall is a relatively new feature in frequency analysis and is based on the few dense networks that have several years of record and meet other important requirements. Consideration of additional storm characteristics includes portrayal of the seasonal variation in the intensity-frequency regime.
3. Separation of "Analysis" and "Applications". For convenience in practical appli-cation of the results of the work reported in this Technical Paper it is divided into two major sections. The first section, entitled "Analysis", describes what was done with the data, gives reasons for the way some things were done, and evaluates the results. The second section, entitled "Applications", gives step-by-step examples for use of the diagrams and maps in solving certain types of hydrologic problems.
4. Relation to Parts 1, 2, and 3. The general techniques in this part are identical to those used in previous parts of the Technical Paper. Discussions of certain subjects have been abridged or omitted entirely, either because they are of secondary interest or because they have been covered adequately in Parts 1, 2, and 3. Topics presented briefly are the discussions of the analyses of the duration, frequency, and area-depth relationships which were given in Parts 1 and 2. Discussions of mass curves of rainfall and 'among storm' rainfall depth-duration-frequency curves and 'within storm' time distribution curves are given in Part 3.
5. Acknowledgments. This investigation was directed by David M. Hershfield, pro-ject leader, in the Cooperative Studies Section (Walter T. Wilson, Chief) of Hydrologic Services Division (William E. Hiatt, Chief). Technical assistance was furnished by Leonard L. Weiss; collection and processing of data were performed by Margaret R. Caspar, Donald E. Hiller, Robert B. Holleman, Elizabeth C. I' Anson, Anna E. Larkin, E. Eloise Marlowe, William E. Miller, Carlos E. Noboa, and Samuel Otlin; typing was by Normalee S. Foat and Laura L. Nelson, and drafting by Vivian M. Campbell and Caroll W. Gardner. Coordination with the Soil Conservation Service, Department of Agriculture, was maintained through Harold 0. Ogrosky, Staff Hydrologist, of the Engineering Division. Max A. Kohler, Chief Research Hydrologist, and A. L. Shands, Assistant Chief, Hydrologic Services Division~ acted as consultants. Lillian K. Rubin of the Hydrometeorological Section edited the text.
1

SECTION I. ANALYSIS
Climate
6. The region covered by this study lies in the middle latitudes and comes within the influence of the storm systems which move easterly across the United States. The result is a more or less regular succession of storms with intervals of fair weather. Periods of prolonged rainfall result when slow-moving coastal disturbances pass over or near New England. Occasionally, tropical storms in summer or early fall bring heavy rains to the coastal region. A number of the largest 24-hour rainfalls ever observed in this region were associated with the hurricanes of September 21, 1938, and August 18-19, 1955. "Storm Rainfall" [ 4] lists an 18-hour amount of 35. 5 inches for Smethport, Pa., which was associated with the nontropical storm of July 17-18, 1942.
7. The annual precipitation averages vary from about 50 inches in some parts of Pennsylvania to about 30 inches in Northern Maine with variations as large as this occurring in some of the subregions of the Adirondacks. The average annual precipitation at Mt. Washington, N. H., is about 70 inches with extreme individual years and months of more than 100 and less than 20 inches, respectively. Precipitation is rather evenly distributed throughout the year, except in the north and mountain sections, where the winter average is generally half that of summer.
Point Rainfall
Basic data
8. Station data. The sources of data used in this study are indicated in table 1-1. In order to generalize, and to insure proper relationships, it was necessary to examine data from 200 long-record Weather Bureau stations, 20 of whichare in the region of interest. Long records were analyzed from 138 stations to define the frequency relationships, and relatively short portions of the record from 824 additional stations were analyzed to define the regional pattern.
Table 1-1
SOURCES OF POINT RAINFALL DATA
Duration No. of Stations Average Length Source* of Record (yrs)
20 min-24 hr 20 recorder 52 5, 6, 7 (WB first order)
hourly 198 recorder 14 8, 9, 10
6-hour 198 recorder 14 8, 9, 10
daily 198 recorder 14 8, 9, 10
daily 626 non-recorder 13 8
daily 118 non-recorder 54 8
*These numbers indicate references listed on page 16.
2

9. Period and length of record. The non-recording short-record data were compiled for the period 1939-1957 and long-record data from the earliest year available through 1957. The recording gage data covers the period 1940-1950 with selected stations processed through 1957. Data from long-record Weather Bureau stations were processed through 1957. No record of less than five years was used to estimate the 2-year values.
10. Station exposures. In· refined analysis of mean annual and mean seasonal rainfall data it is necessary to evaluate station exposures by methods such as double-mass curve analysis [11]. Such methods do not apply to extreme values. Except for some subjective selection (particularly for longer records) of stations that have had consistent exposures, no attempt has been made to adjust rainfall values to a standard exposure. The effects of varying exposure are implicitly included in the areal sampling error and are averaged out, if not evaluated, in the process of smoothing the isopluviallines.
11. Time increments. Some of the hourly data are clock-hour and some are maxi-mum consecutive 60-minute data; correspondingly, some of the 24-hour data are for the maximum consecutive 1440-minute data, whereas others are for a calendar or observation day. Examination of sufficient data has resulted in reliable empirical conversion factors so that the results refer to maximum consecutive n-minute data for all durations.
12. Rain or snow. The term precipitation has been used in reference to the 24-hour data because snow as well as rain is included in some of the 24-hour amounts. This is particularly true for high-elevation stations. About half of the Mt. Washington, N. H., annual maxima for 24 hours contain some snow and in a few instances are composed entirely of snow. The heaviest 24-hour precipitation and all short-duration precipitation is composed entirely of rain.
Duration analysis
13. Durationinterpolationdiagrams. A generalized duration relationship is portrayed in the diagrams of figure 1-1 in which the rainfall rate or depth can be computed for any duration, from 20 minutes to 24 hours, provided the values for 1, 6, and 24 hours for a particular return period are given. This convenient generalization was obtained empirically from data from 200 first-order Weather Bureau stations and is the same relation presented in previous parts of Weather Bureau Technical Paper No. 29. For example, the 30-minute intensity or 3-hour rainfall depth may be obtained if the 1-hour and 6-hour depth's are given, and the 12-hour or 10-hour depth is a simple function of the 6-hour and 24-hour depths. The values are obtained merely by laying a straightedge across the two given values (1 and 6, or 6 and 24 hours) and reading the value for the desired duration. No regional variation is evidentin this durationdepth or duration-intensity relationship.
14. The 1-, 6-, and 24-hour values for use in figure 1-1 are obtained from isopluvial maps which will be described later. Two large working copies (figure 2-1) containing diagrams and instructions with examples (table 2-1) for obtaining the desired depth-area-duration-frequency values are furnished in the pocket inside the back cover of this paper.
Frequency analysis
15. Return-period interpolation diagram. The return-period diagram of figure 1-2 is based on data from the long-record Weather Bureau stations and is identical with the returnperiod diagram in previous parts of Technical Paper No. 29. The shape of the diagram -that is, the spacing of the ordinates - is partly empirical and partly theoretical. From 1 to 10 years it is entirely empirical, based on fre~hand curves drawn through plottings of partialduration series data. For the 20-year and longer return periods, reliance was placed on Gumbel [ 12] analysis of annual series data [13]. The transition was smoothed subjectively between 10- and 20-year return periods. If values between 2 and 100 years are taken from the return-period diagram of figure 1-2, then converted to annual-series values and plotted on either Gumbel or log-normal paper the points will very nearly define a straight line.
16. Partial-duration vs. annual series. The partial-duration series includes all the high values whereas the annual series consists of the highest value for each year. The highest value of record, of course, is the top value of each series, but at lower frequency levels {shorter return periods) the two series diverge (see figure 1-4 in Part 1 of Technical Paper No. 29).
3

RAINFALL INTENSITY (DEPTH) DURATION DIAGRAMS
INTENSITY OR DEPTH OF RAINFALL FOR DURATIONS LESS THAN 6 HOURS
NOTE·· For 20 min. to 60 min. rainfall, values oro in inches per hour; for longer durations thB vo.luBs orB in inchBs dBpth.
9
10-
11-r-
a 9- 7
12 1.o-r- I--
8 7 I--
II 9 6
I--
10 7 6 I--a 5
1--9
7 f-.6- 5
I--"' i5 a r- 4 :c 6 r-5 1--
"' w 4 a. 7
"' I--
w 5 4 3 :c
~ 6 I---3-
4-5 3 I--
2
4- 3 2 I--
J-3 -2
I
2 r- I 1--I I
1- -.___ 0
12
--
-II
-
-10
-
-
-
-
-
-
-
-6
-
-
-
-4
-
-
-
-
'---'-
-
-
-0
MINUTES 20 30 405060 eo 100 120 150 1eo 240 300 360 HOURS I 2 3 4 5 6
DURATION- 20 MIN. TO 6 HRS.
Figure 1-1
DEPTH OF RAINFALL FOR DURATIONS OF 6 TO 24 HOURS
24
-r---'-r--
-22
-
-20
-
-18
-
-16
-
-14 14
1-- -
1-- -12 12
I-- -
1-- -10 io
1-- -
1-- -i=e a. w 1-- -0
"' w :c r-- -u ~6
1-- -
I-- -4
r-- -
t-- -
1-- -
- -0 0
6 10 12 14 16 18 20 22 24 OURATION-6 TO 24 HRS.
The partial-duration series, having the highest values regardless of the year in which they occur, recognizes that the second highest of one year sometimes exceeds the highest of another year. The processing of partial-duration data is verylaborious;furthermore, there is no theoretical basis for extrapolating this data beyond the length of record, nor is there a good basis for defining values for return periods approaching the length of record. Table 1-2, based on a sample of 50 widely scattered U. S. stations, gives the empirical factors for converting the partial-duration series to the annual series. Tests with samples of record length from 10 to 50 years, indicate that these factors are not a function of record length.
4

Table 1-2
EMPIRICAL FACTORS FOR CONVERTING PARTIAL -DURATION SERIES TO ANNUAL SERIES
Return Period
2-year 5-year
10-year
Conversion Factor
0.88 0.96 0.99
For example, if the 2-, 5-, and 10-year partial-duration series values estimated from the return-period diagram are 3. 00, 3. 75, and 4. 21 inches, respectively, the annual series values are 2. 64, 3. 60, and 4. 17 inches after multiplying by the conversion factors in table 1-2.
17. Use of diagram. The two intercepts needed for the frequency relation in the dia-gram of figure 1-2 are the 2-year values obtained from the 2-year maps and the 100-year values obtained by multiplying the 2-year values by those given on the 100-year to 2-year ratio maps. Thus, given the rainfall values for both 2- and 100-year return periods, values for other return periods are functionally related and may be determined from the frequency diagram which is entered with the 2- and 100-year values. The 100-year values for the firstorder stations were taken from Gumbel analysis of the annual series.
18. General applicability of diagram. The frequency diagram is independent of the units used as long as the same units (inches, tenths of inches, etc.) are used for any given problem. Tests have shown that within the range of the data and the purpose of this paper, the diagram is also independent of duration. In other words, for one hour, or 24 hours, or any other duration within the scope of this report, the 2-year and 100-year values define the values for other return periods in a consistent manner. Studies have disclosed no regional pattern that would improve the diagram of figure 1-2 which thus far appears to have application over the entire region of interest and perhaps the entire United States.
19. The use of short-record data introduces the question of possible secular trend and biased sample. Routine tests with data of different periods of record showed no significant trend indicating that the direct use of the relatively recent short-record data was legitimate. The additional years of data processed for the first-order stations have resulted in sliFht differences, with no bias, between the results of this paper and Technical Paper No. 25 L14] -the average difference being less than 5 percent for any combination of duration and return period.
20. Storms combined into one distribution. The question of whether the distribution of extreme rainfall is a function of storm type (tropical or nontropical storm) was investigated in a recent study [ 15) . The results showed that no well-defined dichotomy exists between the hydrologic characteristics of hurricane rainfall and of rainfall having other initial causes. The conventional procedure of analyzing the annual maxima regardless of storm type is to be preferred because it eliminates nonsystematic sampling and avoids having to attach a storm label to the rainfall, which in some cases of intermediate storm types is arbitrary.
Isopluvial maps
21. General. For generalization over the region of interest, three maps have been prepared which show rainfall depths for 1, 6, and 24hours for a return period of 2 years. Three additional maps show the ratio of 100-year to 2-year rainfall for the same durations. This set of six maps appears as figures 2-2 to 2-7 in Section II of this report. For interpolation among the durations given on these maps, and for return periods other than 2 or 100 years, the diagrams of figures 1-1 and 1-2 are used.
22. Isopluvial analysis. In general, the isopluvials were drawn in a straightforward and fairly objective manner. The 2-year 24-hour pattern is based on more than 900 stations whereas the 2-year 1-hour and 2-year 6-hour patterns are each based on about 200 stations. While the 2-year value is well defined even by short records, there was a tendency in drawing
503414 0 - 59 - 2 5

15
14
13
12
11
10
I 9 1-Q. w 0
a:: 0
>- 8
!:::: (/)
z w 1-~ 7 ...J ...J <( l.i.. z <( a:: 6
5
4
3
2
0 1
RAINFALL INTENSITY OR DEPTH VS. RETURN PERIOD
15 ~ -
- -
14
- ""'7
- -13
- -
- -12
- -
- -11
- -
--,. __,
10 - -
- -9
- -
1-- -8
1-- -
1-- -7
1-- -
1-- -6
1-- -
- -5
- -
- -4
- -
- -3
·- -
- .-
2
- -
- -1
- -
- -0
2 3 4 5 . lO 15 20 25 30 35 4045 50 60 70 80 90 100
RETURN PERIOD IN YEARS, PARTIAL-DURATION SERIES
Figure 1-2
6
I 1-Q. w 0
a:: 0
>-!:::: (/)
z w 1-~ ...J ...J <( l.i.. z <{ a::

the isopluvial lines to give more weight to the longer-record data. Useful guides in smoothing the 1-hour and 6-hour isopluvials were the knowledge that the ratio of 1-hour or 6-hour values to corresponding 24-hour values for the same return period does not vary greatly over a small region and the standard deviation of point rainfall for the 2-year return period for a flat area of 300 square miles is about 20 percent of the mean values.
23. Evaluation. A subjective estimate of the standard error of the 2-year values ran-ges from a minimum of about 20 percent, where a point value can be used directly as taken from a "flat" part of one of the 2-year maps, to at least 40 percent, where a value of shortduration rainfall must be estimated for an appreciable area in a more rugged portion of the region. Some significant variation in the 2-year values has undoubtedly been masked as a result of smoothing, as in ~ountainous areas where large local variations have been obscured.
24. Comparison with Yarnell's maps. Differences between the isopluvial maps of fig-ures 2-2 to 2:-7 and earlier maps, such as Yarnell's [ 16], come from several sources. The maps in this paper are based on longer records and a vastly greater number of stations. Values shown on the maps of this paper are adjusted to partial-duration series and are for maximum n-minutes - that is, the 24-hour values are the maximum for any successive 1440 minutes, not a calendar day. For example, rainfall values for the 2-year return period for partialduration series and maximum 1440 minutes are about 30 percent greater than for ·annual series and calendar day.
100- to 2-year ratio maps
25. Limitations of data. Since the 100- to 2-year ratio estimates are from sample data, they are subject to error due to spatial and temporal sampling variability. Spatial variability is a result of the chance occurrence of a storm at one station but not at a nearby station. Similarly, temporal variability results in an unrepresentative sample of storms occurring during a short period. Generally, the addition of one large value to the series results in a much larger change in the numerator than in the denominator and a subsequent increase in the ratio. For example, more than 12 inches was observed in 24 hours at Hartford during the hurricane of August 18-19, 1955 - nearly twice as much as the previously observed maximum. The subsequent increase in the 100-year to 2-year ratio was 36 percent, to 2. 67. The ratio increased from 2. 2 to 3. 1 at Springfield, Mass., a station with 50 years of record.
26. Areal analysis. Rather than indiscriminately prune the effects of this one extreme event, it was considered worthwhile to obtain some perspective about the areal magnitude of this storm. All available ·24-hour rainfall records for stations within about a 50-mile radius of Hartford were examined. This amounted to 7 4 stations with a total of 1, 532 station-years of data. Thirteen of the 7 4 stations had 24-hour rainfalls greater than 10 inches and all were associated with the 1955 hurricane. These rainfalls varied from 60 percent to more than 300 percent as large as the previously observed maximums. Since the numerator or 100-year value is sensitive to extremely rare events, the ratios were increased abnormally. Examination of 508 long-record stations from previous studies revealed that less than 3 percent have ratios as great as 2. 7.
27. There is little doubt about the rarity of a storm of such magnitude but how rare is uncertain.. The ratios at 14 nearby stations with more than 40 years of record vary from less than 2. 0 to greater than 3. 0, the average being 2. 3. Ten of these stations were not unduly influenced by this one storm. Unfortunately, no measurable orographic or meteorological factors are available for explaining the marked consistent discrepancies between the ratios at nearby stations. It appears then to be a reasonable presumption that a significant part of this discrepancy is due to sampling vagaries.
28. Subjective selection of ratio. A reasonable choice appeared to be either 2. 4 or 2. 6, both values giving some weight to this one large storm. Actually, 2. 6. was used, and the 100-year value was computed to be 8. 8 inches with the 12. 12 inches assigned a return period of about 1000 years. If 2. 4 had been used, the 100-year value would be 7. 2 inches and the return period for the 12.12 inch rainfall would be in the neighborhood of 10,000 years. Both of these estimates are well within the margin of error in expressing the data on a frequency basis.
7

29. Station data tables. In order to make unsmoothed data available to the user, all the observed 2-year 1-, 6-, and 24-hour values are given in table 2-2. The 100-year values for long-record first-order and cooperative observer data are presented in table 2-3. The t::>tation names and locations shown in these two tables are those listed in the climatological 'lblications for the latest year of record used in this study.
Areal Rainfall
Area-depth relationships
30. Construction of area-depth diagram. The area-depth diagram of figure 1-3 is based on data from 20 -;:Jense networks of rain gages and is identical with the diagram in previous parts of this paper. The ordinate of the upper curve, for example, is conveniently expressed as a fraction whose numerator is the 2-year 24-hour rainfall over the area and whose denominator is the average of the 2-year 24-hour value for points in the area. The numerator is obtained from an annual series of values, each of which is the maximum average depth for a given area during the year - the times of beginning and ending of the 24-hour duration being the same for each station in the area covered by the dense network. The denominator is the mean of the individual station values, each being the 2-year 24-hour rainfall obtained from the annual series of point values without regard to when the 24-hour period occurs among the stations. The element of simultaneity in the numerator restricts the magnitude of the areal depths to values equal to or less than the average of the point rainfall depths.
_.J _.J
~ z <(<( o:::w
0::: r<C z oz a_W
> l.L.(.!) 0 ro::: zf2 w (.)
0::: w a..
AREA-DEPTH CURVES
24-HOUR
90
6-HOUR
I 80 3-HOUR
I-HOUR
50~-------L------~------~--------L-------L-------~-------L------~
0 50 100 150 200 250 300 350 400
AREA (SQ-UARE MILES)
Figure 1-3
8

31. Generalization. The results from the limited number of widely scattered dense networks were studied in detail and it was found that (1) there was no systematic regional variation of the area-depth relation, (2) the relationship varies with duration as shown in figure 1-3, and (3) storm magnitude is not a parameter. A more complete discussion of the rationale and development of this relationship is given in Parts 1 and 2.
Seasonal Variation
32. Monthly vs. annual series. The frequency analysis so far discussed has followed the conventional procedures of using only the annual maxima or the n-maximum events for n-years of record. Obviously, some months contribute more events to these series than others and, in fact, some months might not contribute at all to these two series. The purpose of this analysis is to show how often these rainfall events occur during part of the year, or a specific calendar month.
33. Basic data. The seasonal variation relationship was developed from 19 first-order stations in the region of interest. The stations and length of record are shown in table 1-3.
Table 1-3
STATIONS USED TO DEVELOP SEASONAL VARIATION RELATIONSHIP
Station
Hartford, Conn. New Haven, Conn. Eastport, Me. Portland, Me. Boston, Mass. Nantucket, Mass. Concord, N. H. Albany, N. Y. Binghamton, N. Y. Buffalo, N. Y.
Analysis
Length of Record (yrs)
53 53 55 60 61 58 48 59 56 56
Station
Canton, N. Y. Oswego, N. Y. Rochester, N. Y. Syracuse, N. Y. Scranton, Pa. Block Island, R. I. Providence, R. I. Burlington, Vt. Northfield, Vt.
Length of Record (yrs)
41 46 57 55 57 44 53 51 43
34. Computation of monthly probabilities. For each of three durations (1, 6, and 24 hours) all the events which make up the partial-duration series -the maximum n events for n years of record - were classified according to month of occurrence and magnitude on the return-period scale. After the data for each station were summarized, the frequencies were computed for each month by determining the ratio, expressed as a percentage, of the number of occurrences equal to or greater than the magnitude of a particular event to the total possible number of occurrences (years of record). The magnitude of any rainfall event is approximately related to the probability of its occurrence in any year. Cases of nonoccurrence as well as occurrence of rainfall events were considered in order to arrive at numeri.cal probabilities. The results were then plotted as a function of return period and season.
35. Construction of seasonal probability diagrams. Some variation exists from sta-tion to station, suggesting a slight regional pattern, but no attempt was made to define it because there is uncertainty whether this pattern is a climatic fact or an accident of sampling. Duration seems to be the only parameter having significant effect on the shape of the seasonal probability relationships. The data from all 19 stations were combined, giving 1006 stationyears of record, and smoothed isopleths of frequency were drawn for each significant duration: 1, 6, and 24 hours. These isopleths appear as figures 2-8 to 2-10 in Section II of this report. The probability lines in these diagrams were examined to make sure the aggregate probabilities
9

agreed with the definition of return period; e. g., the 2-year value occurs on the average about 50 percent of th~ time or once every two years.
36. Application to areal rainfall. To test the applicability of these diagrams for the range of area in 1this report, a limited amount of areal data was analyz~d in the same manner as the point data. The results exhibited no substantial difference from those of the point data, which lends additional confidence for using these diagrams as a guide for small areas.
37. Comparison with monthly probabilities in Parts 1, 2, and 3. The seasonal proba-bility curves in this paper follow the same general pattern as those in Parts 1, 2, and 3. They differ in that they are more peaked for all three durations than the curves of the preceding parts. This means that the larger amounts are relatively more likely to occur during the summer months. There is some regional discontinuity between the curves of the four papers which can be smoothed locally for all practical purposes.
Sixty-Minute Mass Curves of Rainfall
38. A useful tool for the hydraulic engineer is the mass curve which shows the cumu-lative depth of rainfall with time. The analysis described below discusses the construction of two mass curves.
39. One hundred four 60-minute rainfalls from 52 first-order stations east of the Mis'sissippi were selected for analysis. The criteria of selection were: (1) the total rainfall duration had to be at least 60 minutes. If durations shorter than 60 minutes had been used, there would be no maximum 5-minute amounts occurring in, say, the 12th 5-minute interval; (2) the 60-minute depth had to be at least one inch; and (3) little or no rain occurred immediately before or after the 60-minute rainfall selected for analysis. This method insured the selection of the maximum 60-minute rainfall in the storm and not just a 60-minute period containing the maximum 5-minute rainfall.
40. For each storm, the maximum 5-minute rainfall was plotted versus the 60-minute rainfall that contained it. The unstable relationship is illustrated in figure 1-4 which shows that the 5- to 60-minute ratio varies from 12 to 31 with a mean of 18. 5. In addition, no evidence is apparent of any systematic relationship between. this ratio and the 60-minute rainfall magnitude. In an attempt to refine this relationship, the points were labeled with a third variable - the 5-minute interval (numbered from 1 to 12) in which the maximum rainfall occurred. No systematic pattern emerged upon which to construct a set of contour lines, which means that the addition of the third variable does not improve the relationship for estimating the dependent variable, viz., the 5-minute rainfall. This analysis emphasizes the large variation that exists in the 5-minute distribution of the 60-minute rainfall.
41. In order to provide the engineer with some relationship between cumulative depth and time, two mass curves were constructed (see figure 1-5). Both are based on the same average 5-minute to 60-minute ratio, 10-minute to 60-minute, etc. , as determined from the 104 storms; i.e., 18. 5 percent of the 60-minute rainfall was used as the maximum 5-minute increment. The difference between the two curves is a result of the 5-, lO~minute, etc. , interval in which these ratios were placed. The curve on the left is based on the modal interval or most likely interval and the curve on the right on the mean interval. The frequency distribution of the maximum 5-minute intervals is shown in the insert of figure 1-4. This distribution supplies a useful picture of the way in which the intervals have varied.
10

.......
.......
RELATIONSHIP BETWEEN 5- AND 60-MINUTE RAINFALL .7r---------------~--------------~----~--------.-----------~---,--------------~--------------~
"' Q) .£: 0 c
~ I I
··1 I I ., 83
&4 &5 ~
04
.5 2• •3-- 2.~.2 &3
&3 &51
~ I 9• 3• •2
•2
6 • 83
~ &3 •2
.4r-------------------~--------------------+--~~--------~-----+--------------------+--------------------+------------------~ ...J ...J 87 88 <1: •2 3•
LL. 82 84 I I I DISTRIBUTION OF INTERVALS IN WHICH Z MAXIMUM 5-MINUTE RAINFALL ~ &3 OCCURRED Q: Ol &2 ~
N o LLJ ::;;
~ .3 fll3 20 19
z :a: ]8 6& &2 84 1 &10 6& fll9 &3
10 &9 &5 &3 &5
&4 9-2
89 3& &2 fliT 3 82
. z Li~:::'" ~~:;' .. 1--
:~ I 0 2
I 3
Label: (3) Interval in which maximum 5-minute rainfall occurred.
I 60-MINUTE RAIN FALL (Inches)
Figure 1-4
I 4
18 17 16
(f)
w 15 .. z (f) 14 .. <t
j 13 .. w
u.. 12 .. ::;;
0 ll .. O::JO .. ~ 9 .. ::;; 8
~ 7 61 . . . . . . . . . 5 • • • • • • • • • 4 ••••••••••
2 •••••••••• 31 ......... . 1 ••••••••••••
I 2 3 4 5 6 7 8 9 10 lll2 5-MINUTE INTERVAL
I 5 6

AVERAGE MASS CURVES OF 60-MINUTE RAINFALL
_J 70 _J
<t IJ.. z <t a:: w 60 1-~ z :?! I
0 50 <.0
IJ.. 0
w (!)
<t 40 .I-z w (.)
a:: w a..
30
10
o~~--~--~~--~--~--~-+--~--~~--~
0 10 20 30 40 50 60
DURATION .(MINUTES)
Figure 1-5
12

SECTION II. APPLICATIONS
Introduction
42. This Technical Paper has the primary purpose of presenting rainfall data for hy-drologic analysis and design criteria. The degree of detail presently available, and tha.introductiort of areal and seasonal influences, have complicated the field engineer's work so that in many instances he must use a combination of maps and diagrams in a rather long series of operations. After having read how these aids were prepared he is ready to use them, and by having them together in one section of this paper he can easily find them for future use, without having. to look through the entire paper each time he needs to refer to the maps or diagrams. Hypothetical examples of a few representative problems are included with the maps and diagrams in this section of the paper.
Use of Maps and Tables
Need for judgment
43. Site location. The tabulated data may be used in conjunction with the isopluvial maps in obtaining the best possible registration of the map with the stations and drainage areas themselves. Where there are steep gradients or complicated patterns in the isopluvials and in the contours of a region, the tabulated station data serve as identifying "bench marks". The station can be located on the ground and tied in with the station as shown on the map. If there are errors of printing registration, or of interpolation in the isopluvial pattern, adjustments can thus be made.
44. Orographic influences. Whether to use the smoothed values from the isopluvial maps, or whether to use the individual station data, or some combination of the two, depends largely upon local physiography. In a plains region there is little question but that the smoothed isopluvials give a better estimate of the rainfall regime of a locality than single station data. In a rugged region, while sampling error exists, much of the variation among nearby stations may be properly ascribed to orographic influences. The assessment of how much of the variation can be ascribed to these influences may have to be made by a person familiar with local conditions who has more information of storm patterns, and who has observed them. He may even be able to transfer a local topographic relation from a mountain slope where there are good data to a similar nearby slope which lacks data. ·
45. Average depth over an area. The three examples given in table 2-1 include re-duction for area. If the particular area of interest is large enough and the isopluvial pattern is complicated enough, there may be a question as to what point in the area should be taken as representative. The point value to which the area-reduction factor should be applied is the average point value in the area. For practical purposes the average point value can be determined adequately by inspection of the isopluvial map or maps.
503414 0 - 59 - 3 13

Table 2-1, with 3 examples, outlines the steps in the order they should be carried through in solving for the required rainfall intensities or depths.
1.
2.
3.
4.
5.
6.
7.
8.
9.
10.
11.
12.
13.
14.
15.
16.
Table 2-1
EXAMPLES OF RAINFALL INTENSITY (DEPTH) DURATION - FREQUENCY - AREA COMPUTATIONS
Location 43° 00' N 45° 00' N 72° 00' w 69° 00' w
Required Intensity (Depth) 25-Year 3-Hour 50-Year 12-Hour Duration-Frequency-Area Rainfall (Inches) Rainfall (Inches)
for 100 Square Miles for 400 Square Miles
2-Year 1-Hour Rainfall 1.1 Inches Figure 2-2
2-Year 6-Hour Rainfall 2.1 Inches 2. 0 Inches Figure 2-3
2-Year 24-Hour Precip. 2. 9 Inches Figure 2-4
Straightedge connecting {3) and {4) or (4) and (5) (2-Year 3-Hour) (2-Year 12-Hour) intersects required dura-tion. 1. 7 Inches 2o 5 Inches
Figure 1-1
100-Year 1-Hour Rainfall 2-Year 1-Hour Rainfall 2.2 Figure 2-5
100-Year 6-Hour Rainfall 2-Year 6-Hour Rainfall 2.1 2o3 Figure2-6
100-Year 24-Hour Precip. 2-Year 24-Hour Precip. 2.5 Figure 2-7
(7) X (3) (100-Year 1-Hour) 2. 4 Inches
(8) X {4) {100-Year 6-Hour) (100-Year 6-Hour) 4. 4 Inches 4. 6 Inches
{9) X (5) {100-Year 24-Hour) 7. 3 Inches
Straightedge connecting {10) and {11) or (11) and
{10/0-Year 3-Hour) {100-Year 12-Hour) (12) intersects required duration. 3. 5 Inches 6o 0 Inches
Figure 1-1
Straightedge connecting {6) and (13) intersects
2. 8 Inches 5o 3 Inches required return periodo Figure 1-2
Percent of Point Rainfall 85 87 Figure 1-3
(14) X (15) = (2) 2. 4 Inches 4. 6 Inches
14
42° 00' N 77° 00' w
15-Year 30-Min Intensity {In/Hr) for 50 Square Miles
1. 3 Inches
1. 8 Inches
(2-Year 30-Min) 2o 3 In/Hr
2.1
2o1
{100-Year 1-Ho}lr) 2. 7 Inches i
/
{100-Year 6-Hour) 3. 8 Inches
{100-Year 30-Min) 4. 3 In/Hr
3. 3 In/Hr
69
2. 3 In/Hr

46. Examples illustrating use of seasonal probability diagrams.
Example 1
Determine the probability of occurrence of a 5-year 1-hour rainfall for the months May through October. From figure 2-8, the probabilities for each month are interpolated to be 1, 3, 7, 5, 3, and 1 percent, respectively. In other words, the probability of occurrence of a 5-year 1-hour rainfall in May of any particular year is 1%; for June, 3%, etc.
Example 2
Determine the probability of occurrence in July of a 1-hour rainfall with the range of magnitude of the 1- and 2-year values. The 1-year 1-hour value of 0. 9 inch for Boston is estimated from a combination of figures 1-2, 2-2, and 2-5. From figure 2-8, the empirical probability that the 1-year 1-hour rainfall will be equalled or exceeded in July of any one year is 27% or 27 chances out of 100. Similarly, the probability that Boston's 2-year 1-hour value of 1. 1 inches will be equalled or exceeded in any one July is 16% by interpolation. The difference (27% - 16% = 11%) is the probability of occurrence in any one July of a 1-hour rainfall within the range 0. 9 - 1. 1 inches, inclusive.
Example 3
Assume the hurricane season to be June through October and determine the probability of getting 2. 0 inches or more in 6 hours during this season at a point near Hartford, Conn. For a first approximation, determine from the isopluvial map the 2-year 6-hour value near Hartfoxd to be 2. 3 inches. Referring to the seasonal probability chart for 6 hours for the 2-year return period, it may be seen that for June through October there is about a 42% chance of getting 2. 3 inches or more for 6 hours (corresponding to the 2-year 6-hour return period) during the hurricane season. Since the chance of equalling or exceeding 2. 0 is obviously greater than for 2. 3 inches, use the return-period diagram for a second approximation to get a rainfall value for the 1-year return period. At the point of interest near Hartford, (referring to the map of figure 2-6) we find that the ratio of 100-year to 2-year rainfall is about 2. 2. Multiplying 2. 3 inches by the ratio, 2. 2, to get the 100-year value, we then enter the return-period diagram of figure 1-2 with the 2-year value, 2. 3, and 100-year value, 5. 1, and estimate 2. 0 inches to be the 1. 3-year value. Interpolating along the 1. 3-year line of figure 2-9 gives 8, 15, 16, 13, and 8 as the probabilities for June through October, respectively, or a total of 60%. In other words, the probability of 2. 0 inches or more rain in 6 hours during the hurricane season is 60%; this depth of rainfall will be equalled or exceeded in six seasons out of ten.
Example 4
As an example where interpolation between durations is necessary, consider the first example of table 2-1 where the 25-year 3-hour rainfall is estimated to be 2. 8 inches. If the probability of occurrence for July is required, 1. 3 and 0. 9% are estimated from the 1- and 6-hour seasonal probability charts, respectively. The 3-hour probability is then interpolated to be 1.1% or 11 chances in 1, 000 of equalling or exceeding a 3-hour rainfall of 2. 8 inches in July of a particular year.
15

REFERENCES
1, 2, and 3. United States Weather Bureau, Technical Paper No. 29, "Rainfall intensity-frequency regime, Part 1: The Ohio Valley", June 1957; "Part 2: Southeastern United States", March 1958; "Part 3: The Middle Atlantic Region", July 1958.
4. Corps of Engineers, U. S. Army, "Storm rainfall in the United States", February 1954.
5. United States Weather Bureau, Climatological Record Book, 1890-1957.
6. United States Weather Bureau, Form 1017, 1890-1950.
7. United States Weather Bureau, Climatological Data, National Summary, 1950-1957.
8. United States Weather Bureau, Climatological Data, 1888-1957.
9. United States Weather Bureau, Hydrologic Bulletin, 1940-1948.
10. United States Weather Bureau, Hourly Precipitation Data, 1951-1957.
11. R. K. Linsley, Jr., M. A. Kohler, and J. L. H. Paulhus, Applied Hydrology, McGraw-Hill, New York, 1949, p. 76.
12. E. J. Gumbel, "The return periods of flood flows", The Annals of Mathematical Statistics, Volume Xll, June 1941, pp. 163 ... 190.
13. D. M. Hershfield and M. A. Kohler, "An empirical appraisal of the Gumbel extreme-value procedure". (To be published.)
14. United States Weather Bureau, Technical Paper No. 25, "Rainfall intensity-duration-frequency curves for selected stations in the United States, Alaska, Hawaiian Islands, and Puerto Rico", December 1955.
15. D. M. Hershfield and W. T. Wilson, "A comparison of extreme rainfall depths from tropical. and nontropical storms". (To be published. )
16. United States Department of Agriculture, Miscellaneous Publication No. 204, 1935.
16

U. S. DEPARTMENT OF COMMERCE WEATHER BUREAU
RAINFALL INTENSITY (DEPTH) DURATION Dl A GRAMS
DEPTH OF RAINFALL INTENSITY OR DEPTH OF RAINFALL FOR DURATIONS LESS THAN 6 HOURS FOR DURATIONS OF 6 TO 24 HOURS
For 20 min. to rainloll, values are ln inches
for lonqer durations the values ln inches depth
r--f-··
9·
"Tl 7
12
~:+ 1--
1--
" rn 10 • 7-:s
5
-9
7 L.a-. -
"' ~ 6 4
·-~5- -- I
7 4·
--
"' :r 5 1•- 3
~ s-
~· 1--
5 4
I •- I--
2
4 3 J2• 1--
l-•-3 I--
I
2 ,_1,· 1--,,_ I
T 1--'--- 0 MINUTES 20 30 405060 80 100 120 150 180
HOURS I 2 3 DURATION- 20 MIN. TO HRS.
112
-hour; :-
-
11
-
-
10
--
-9
-
-8
-
-7
-
-6
-
; -
5
-
-
4
--
-3
--
-
--I
--
-0
240 300 360 5
14
12
10
~8 <n w :I: u :;,;6
1--
1--
1--
-
-
--
-1--
1--
1--
1---
1--
1--
6
FIGURE 1-1
they should be carri<ld
TABLE 2-1
24
-
r f--- 22
-
I I --
-
I I
-
I -I
-
-I
-
-
ffi, : -
I -
--
--
-
-~
I
8 10 12 14 16 18 20 22 24
DURATION-S TO 24 HRS
:r: ,_ Cl. w 0
COOPERATIVE STUDIES SECTION
RAINFALL INTENSITY OR DEPTH VS. RETURN PERIOD
.5,---~-,~~-,-~,--,-----~~~,~-.--~~··r~~~~-~~~,1 11~5
~ -
! II t4~·-···-----~1 -----J-~·····-~r----~---+~--+-~
1~~~~+-~~+-~J4 I I I I -
I- -
13 -------~t---~~+-~f-+----------+--· ----+~ f--~!--+-1-++-+-- -----~ 13 i --
i
- -
t t------------~t-----+---l---t-1 -------t--- --+------+--+--+--t--l+l-+-t---1--1 -t---r-H- It
l I -
-3~·· ----+_----~-~~--r-----~--~---·--t-+-+-~~---4-~~+-~1-13
I- ' li,------t-----1----l----l----·····~---t----~-~++-t-~-+---+~~~L+~-l
. ~ I I I I 1-0L-----~~-------~~~--L-----_L~_L __ L_~~i_LL~_L_L~L-~
4 10 15 20 25 30 35 4045 50 60 70 80 90 RETURN IN PARTIAL-DURATION SERIES
FIGURE 1-2
AREA-DEPTH CURVES
AREA (SQUARE MILES}
FIGURE 1-3
FIGURE 2-1. DURATION, FREQUENCY, AREA- DEPTH DIAGRAMS, AND EXAMPLES OF COMPUTATION FOR
WEATHER BUREAU TECHNICAL PAPER NO. 29, PART 4 (PREPARED DEC., 1958)
0

0 z
ci.
"' C)
~
"" U"l
0
2-YEAR 1-HOUR RAINFALL
LEGEND
• Recording Gage Station
SCALE· STATUTE MILES
L L L.J" t.J t.J U' i 76• 75•
Prepared By 45• -----r------___j
COOPERATIVE STUDIES SECTION
HYDROLOGIC SERVICES DIVISION
WEATHER BUREAU
Washington, D. C.
78•
December 1958
,"/ ,.~*"
,/~,_~ ..
!-·~.
T /-i I '\ (...__ 0/ 1.. ,.r-• ' ...,~JJ"'l......., '/-,GfortKent
~// '
69" 68" 67•
46" \ 1~/l+t\ \\\\II\\\ IIIII\ I\\\ II\\\ I I\\ 1
1(1~ 1
\ I\ 'i I I I~ VI
r ,.J
/" (
eskowht:Ban ~t--,. .. ~J--e /:J1:i'" I \ /( I ·-·:~" M _8_HoghgateFJIIs GNe~port -....,~ \
-~-~~~-~------ ·--.J~) "'\1' 'I _!_ •''"'"'" I' \ •'""'e':.~:~" I ;~wB AP 8 S! "":''"( ~""'~· 8 BolO''
I / ' ., //J~\Mooo!Wo>boog!ooOOPookbom\~:,::d '~"-.t!or\hfleldNqrftlf.hun,versoty OLandM!
o~:·;;;;,;;~B~~'")I \.''""'" <Dsw'"''''" I 1"'- ;zr·v v \ I ~I
\\t
8AugustaAP
~,
8'""'""'"''''"' z\) $NcwDmham {
:~ '"!"'"-·, -
.,,;,m '·JO \ \ I \ II I \ I \ I \ \ I \ \ \ \ \ \ II II II II I \ I I I I \ I I rn
ATLANTIC OCEAN
• w
);-~--------~~------~--:k~----~====~----~::~~~--~::~~:t~~;;~:~:~3~~2~{:~~~:3~~~~~~~~3:::::::~~----------~e-----------~----------~~-----------i41• 67" ~ w w
71• 70"
Figure 2-2

ci z
0. Q)
<.>
~
"' "' 0
2-YEAR 6-HOUR RAINFALL
LEGEND
• Recording Gage Station
Isop!uvia!s of
of
SCALE STATUTE MILES
LLLJ 2W ·uo Uo 'I 76• 75'
Prepared By 45' -------lr--------l
COOPERATIVE STUDIES SECTION
HYDROLOGIC SERVICES DIVISION
WEATHER BUREAU
Washington, D. C. December 1958
ecantonWBC1ty
8Wanakl!n~Rang90cit_..--
44' t,..,~ I :::f .--"" 78' 77• I • W."•·•···- ~ - ~ u, T. I eco•mlh I • LmooiO ~ • / I · 1 ~
I
• """ • "'""' ""'" 2 w I !' :;::::: : ~ eEdmeston
/-"-. ePtymouth2SSE / /
I \ eSouthNewBetlon //
·-- ,':'"1"'"''. \ •• t_, ·~1.0"'"~---\ 8 e Homo" Almood D•m l'"" J ""'" Co'e" ""'"r"'' 8 Sm•l"""' fl.e!L _.-: I West Almond e Arnot SCS Rrihl'!!_d f!--Wb•trreyl'Otnto;";;l -- -- 8 PraHsvllle
I • )''""''"" • ''"'" '"" 2 N)." • w .. , "~·:"""'00 / • B "'""""" WB AP • Ch "'
-----------.!£;\~~K-'0;:;; -- I eoownsvtlle e Uoooc.,, .!""''" PENNSYLVANIA -- ---~·~:::::_- -------- '-!'~"-"-;s:t-- , / I -. r
e ''""''"'";/ -.1
Jock"o S<>mm•l -+ PENNSVLVAN" \ I \ "'""'ooe
• I .,OOINN:'"'""'"'"''"w•ySh:"'''""d ew,,,,,.l,, OM•I:::~:~" I OMOOIIO<o3EHghw1,.... •"""'"" ·r''"''\ : • '''""'"' "'"''" 6\V c ...... G I ee""'"' Mo<>OI I w • J I
/
1
ro,·e • C~rler Camp 2 W • Canton 1
NW 8Honesd11el6 N Tanners Falls ~ eeps•e 1.; •
, ... .,_,~,SEO.,m."'""'""· .''""""""' /E0"'"'""' \I ~ ;lg e;,,'""'"' I •"'"'"''' 80.,,l000 •'"''""c'"'" •''''"""' "i~er""""'""""'': • .,, 15 ~'"'"o1>~ ~HoyJS a ... ,.,,,,.,.:':.c.,dlowoodL"'
• Medox Run • p k c k • Scranlon we AP q'?- 0 -\ .... lh I
1 e '"'"' "'"' I • Rooo.o 6S Siolo c., p I W """'""' WB AP '( "' F
8Amherst
.Sterhng3NW
eworcesterW.nterHoll
eworcester2 e·westBn~fmld
70'
I I
I
69'
/-i I '\ ~-~cl \.. ~· ' ~~'/~ ' ........ -·•'""""'
;"t!.l '
eCiilytonL.,~c
eGre•·•w•lle
(\ 1·--1 ;.,,,_,,p
ATLANTIC
68' 67'
79• 78•
77•
iJ?u __ ,___ I I I ~ 41 '
71' 70' 69' 68' 67'
eParkerst.lndml;IE 80u8oos7[ eLockH~ven2 ~ I
Fig-u.re 2-3

0 z
0.
"' (.)
"' "" ~
0
2-YEAR 24- HOUR PRECIPITATION
LEGEND
• Recording Gage Station
SCALE STATUTE MILES
L L 'L .. J" 20l..1 LJ Wo 'I 76• 75'
Prepared By 45' -----t-------
COOPERATIVE STUDIES SEpiON
HYDROLOGIC SERVICES DIVISION
WEATHER BUREAU
Washington, D. C.
78'
December 1958
CANADA ---u:s7--
e•Mount Moms 2 W
79•
ecantonWSC1ty
8 WanakenaRanr,\.'rSchool
77•
70' 69' 68'
/-i li l, _ _>'?C' 47' /'
46' I I, ~~~ I I I I I I, I I \ I I I I \ \ \ I U/1, \/111 \ \ I \ \ ~n \ I I 'i I I ~
ATLANTIC
Figure 2-4

0 z
ci. <lJ ()
ri':
"' "' 0
"' "' 0
"'
RATIO OF 100-YEAR 1-HOUR TO 2-YEAR 1-HOUR RAINFALL
LEGEND
• Recording Gage Station
SCALE STATUTE MILES
76• 75•
Prepared By 45' -----1---------l
COOPERATIVE STUDIES SECTION
HYDROLOGIC SERVICES DIVISION
WEATHER BUREAU
Washington, D. C.
Figure 2-5
47•
70' 69' 68' 67•
--~\ .~ ~ ~ \ // \·/?-~- ~- i (' / I
)
I I
I
8C!ay!onlilkt'
46' 111(1 1, 1, I, I\\ I I\\\\\\ II II\\ \1\\\\ \\\\\\~I I\ II I I q
(
r---~~ +4'.2- \
\:
G""' LokoLoom' _ ...., \
I
86angorAP
.Skowhegan
ATLANTIC OCEAN
:~1? I I I I ~4!• "71o 70° 69" 68° 67°

0 z
0. ., (,)
<1l ~
;;;
0
"' "' 0
"'
RATIO OF 100-YEAR 6-HOUR TO 2-YEAR 6-HOUR RAINFALL
LEGEND
• Recording Gage Station
SCALE STA lUTE MILES
LLWO 'L7 'U 'U' i 76' 75'
w lw I 1-------- ~u~c--,-"'/ NEWYORK
Prepared By
COOPERATIVE STUDIES SECTION I" ~t- e Wh<~plcvolle
'~"" ,/" 0CantonW8Coty
HYDROLOGIC SERVICES DIVISION
WEATHER BUREAU
, ("
,.1
,.~"
70'
I I
I
( 8G1""""!'
73·
7
l' ('-~z~r ., ... ,~ /
~i--""·"'--, -c~:;····~\ . P;I{J
1_$_H•gogolof"'' &Nowoo ~.~~ .L, "'·--------~ fiSko.O<goo
Ia ~ ~~- ;""Al:'~~.b"~
69' 68' '67·
(
( O Mo\tonorket '-'\ ... _)
\~ \
ft.Grandlakc~trcam""" A ·•-2 .. '2-
eaangorAP
~J 8 """"'"' +). 0·- > \ \! I / /"' i Gorham Ice e Bett:et 8 Bo,mgloo WB AP ~/51 ><h:<Co~ j 9 ~ G1
1ood
I I /f;o./ / 01mNo<oo ---j
I ~ // Mo:.""'"'''/ Pm'j\ {) \ ---j ·--~ u r·-0+·-/ I I
I ± ""'""ldWBCIIy ). /lilllowlo I eswoo•'""-1
I . (\, ·~ / ec'"j'" . f I ) ~ ' r ' , ' •·-" ''
Washington, D. C. December 1958
fb Augu~taAP
~;;;I "'w,",_- / ~\T"oode<ogf•WBAP &Stockb;,o :!.:::,:."liD•m /1 l\~ ).,.;.,.,-.;;,~~8 AP
(I I ,/ 8BmJOI zl{ / ~ ~ ""'""""•:"\, / ~ 1~ / J'""'""'""' 0
"eNowol.o•/m I I gr~ eyson ~~~II I 1\. ~ \ ;jf£ 1 ~~~ ewoodoll eslookw""D"m A \ 11 I I I \ I O~klmgolloD•ml '!!:> / ,'~ I \,O·CoocmdWBj,/! I \Ill \l\lllll\\
11\\ 11\ii\\l
\ j _i"jc'""$G.,IIlo j •"'"'"""'~ 0~• Ill\ \ I Ill , I .... I .. I I \ ~,."""'''"'",. / ;;w""'l' /~HMrl""'"'~+ 111111111\ :j· \ -+; 6-wiJ-=-e!:-M,L,"iul,sjscJs -~~:U-W--J-J++f+~H~8~,,~1 e~,,t.t,J. .. b~"j"''~' Htf~F-H*t-~"i=t!es. t,1,.,1"''~51~3~,0~n / '.. $Hudson rv''
ef;:"""'''j,.'"
15
"":
1 1
'; ! /'\1~~"""";"~1 \ VERMONT \:J!..:::".:::'.:" NE:::::~A~R.:.:-~('INE I YORockpmiiESE I, I /•:::~::: I ,,,~·:D:Ll',ir/-- ---..rn.~"' ••• ,,,_ , ·"" / J / J j eEctm'"'" ; '' ' '
2/ I lll"""'i'' /
I ' I •"-""" I \ I ' ,_.,, ( !' / I / OSoolhNewBo"" '(' \~!.8/, } --~i'Oeso,.ooWBAP " -/..""• r '"""'- ••~/ '""- '--L--- r'"";:F.:.-,--~-'" .,z -~·----;.~, ,
\ ~ 11
CIHommooct"""" """'C'I"'""'"j:'"' &sm,JO"'"""' I OP"""j'' ~ ~&KmgOI••IIeDM> ~ ~Wm".t.i'2 ________ " ~,"'. ~ \ Gle}~\:~~~eHAmondDamt [ ( ·-<> ~"'fi'"'"_'_ ~,,,_,I ~·-"\'" ( ·-· : " -"0''''"'
/) \ \ r l IIDBmgoomlooWBAP - - I ~ M~HUSETT~ /
: /' es"'""""'"' \ ewe.IJ,~,:""'"'"\ \ : ~ ec'""" ODP•"""'''--2;()-'- I ,_: , r------~. ~,-z.:' ,.~"~:'.:'" J /"''"mL' I /esrolw" 0 "" '" J \ I J NEWYOP.K ~~ Mlll.,looJ /~Nmlolk2SW _e-tl=wiiAP-------~~Purnam ~ ~\~~6- / ---/.--------~~-'~'--~'-::!' ""'-.--&A~o~"'/ -T-----r- \ -,;;;A;;;A- \/ ·~Kmg.,oo / T_-_- eRookolllo : ~l.. -'-2 "- /
e
5
PENNSYL:tAr~rA ~ 0
'''""""' ' , ' " /{-""' o- / o> '""" ?J1 _,,,. eunonCory 8Youngswrrc~ "'-" ·-· I \ ''""'"'I \ "'""""'~~~ •-• / .,,;;;:J. :::::.:---~ "'. ,,, '~' '~1--.-d•dli•d r;7j I
lllsm"""""'''"''""" / \ fi>Towoocto\ \ &Pl"""MoooiiW ~ &Poogok<o""'~ NowB"I""~'P-- '{!IS \ LJ J.r----3/ I I ~ ~ • .,,_, r , · " ~ "· t-o-"'" ~· "'' · , --"0
• '""' ----- ) / ""~"" I ; "'"'-"'""7 ;I! /""""'''~ ~ !r!,. 'lll:'l''~~-;,:"'" ·o/'\_ &fll""'"' "'""'IBwco.,/ ' ~:::-c,mo2W/ I $Do"'J\311
, 8 \""'""'"I'APII \I~ 0
"""""'"''" ;ziz"./c'"dl<w<>odl>l' z(-·-·, §r,.. ~~ 0
• "" "
A / I \ • ~ .... '"'""""'' f \ -2. ~- • """'"'"I , \ "'f''' 1 "'""" o, ,_ 1 ~z. _ I 67• OEag/csMcre \\ \ I -2 4'-i- ··A,,,., 8BwM """WB/ 8Now "'"WB AP n "" VP 68"
e Scralllon \'f8 AP q'/' 'it.:-..,: 1:,- r. I / .J\ 8
Ct (8, Block Island OPokesCreek ~_../ / <r, -..o,, / -~2.0-. Bloc""""'w ' 69'
'I I J<•'., , ~:;> / fiiB,dgopq,WBAP ~· ,.,_~ '-., Omgm""'"'y0 'c,.., -c. -- /-" ~ 4.Q, --'" ('\ -v 70' ~~ooo1Pocoot2N AP"'"""'R•ymoodo,:::-~;'v(,;"-{ ___../"' /L"r& ""~,(,,';{1.,_ 71' 7,;• "''"'" Cmom .<]:_ Ch.,lollobo•g ~'•"""~'" to"< ·7~~ e';,;""""' 73• 72'
78• 77•
$tr.d<anla~e2SW
78' 77•
OCEAN ATLANTIC
Figure 2-6

Table 2-2. Station Data 2-Year 1-, 6-, and 24-Hour
Period Length 2-Year 1-Hour 2-Year ·6-Hour 2-Year 24-Hour STATION Lat. Long. of of Record Rainfall Rainfall Precipitation
Record (years) (inches) (inches) (inches)
CONNECTICUT
Ansonia 41 20 73 05 1948-57. 10 3. 98 Bakersville 41 50 73 02 1948-57 10 4.41 Baltic 41 37 72 06 1942-57* 14 3.44 Barkhamsted 41 56 72 57 1941-57 J.7 3.97 Bloomfield 41 50 72 44 1941-57* 16 .87 2.14 3.17
Bridgeport 41 12 73 12 1897-51* 47 3.41 Bridgeport WB AP 41 10 73 08 1949-57 9 1.32 2.56 3.21 Bristol 3 W 41 41 72 59 1941-56 16 3,95 Bulls Bridge Dam 41 39 73 29 1948-57 10 3.62 Burlington 41 48 72 .58 1940-57 18 4.34
Candlewood Lake 41 29 73 28 1941-57 17 .92 1.89 2.82 Canton 41 50 72 50 1896-22 27 4.26 Cockaponset Ranger Station 41 28 72 31 1942-57* :).4 3.70 Colchester 41 34 72 17 1896-57* 57 3. 31 Collinsville 1 s 41 48 72 56 1940-54 15 3.58
Cream Hill 41 52 73 20 1897-57 61 3,06 Danbury 41 23 73 28 1942-57* 14 3.67 Dawson Lake 41 22 72 59 1941-57* 16 3.78 East Hartland 42 00 72 55 1916-41* 22 3.85 East Haven 41 17 72 52 1948-57* 7 3.42
Easton Lake Reservoir 41 14 73 15 1948-57 10 3. 61 Falls Village 41 57 73 22 1942-57 16 3.62 Greenwich 41 05 73 42 1948-53 6 3.32 Groton 41 21 72 03 1948-57 10 3.74 Hartford 41 46 72 42 1941-57 17 1.18 2.35 3.27
Hartford WB AP 41 56 72 41 1905-57 53 1.20 2.20 3,20 Hemlocks Reservoir 41 14 73 16 1949-57 9 3. 95 Jewett City 41 38 71 54 1942-57 16 1.33 2.55 3.22 Lake Konomoc 41 24 72 ll 1942-57* ll 3.41 Laurel Reservoir 41 10 73 33 1948-57 10 4.22
Manchester 41 46 72 29 1941-57* 16 3.13 Mead Pond Reservoir 41 12 73 31 1948-57 10 3. 55 Middletown 4 W 41 33 72 43 1896-57* 22 2.53 Milford 41 12 73 05 1948-57* 9 3.60 Mohawk Ranger Station 41 50 73 18 1948-57 10 4.15
Moodus Reservoir 41 30 72 26 1940-57 18 1.08 2.48 3.27 Mount Carmel 41 25 72 55 1940-57 18 3.53 Natchaug Ranger Station 41 53 72 05 1948-57 10 3.05 Nathan Hale State Forest 41 46 72 21 1950-57 8 3.52 New Britain 41 41 72 46 1941-47 7 1. 33 2.10 2.64
New Hartford 41 53 72 57 1941-57* 16 3.25 New Haven WB AP 41 16 72 53 1905-57 53 1.33 2.51 3.43 Newington 41 42 72 44 1941-57 17 1.09 2.23 2. 91 New London 41 21 72 06 1897-55* 57 3.13 Norfolk 2 SW 41 58 73 13 1946-57 12 3.90
Norfolk 2 SW 41 58 73 13 1941-57 17 1.15 2.51 3.84 North Branford 41 20 72 46 1941-57* 16 3.40 North Guilford 41 23 72 43 1941-57* 16 3.35 Norwalk Gas Plant 41 07 73 25 1896-57* 55 3.47 Norwich Public Utility Plant 41 32 72 04 1948.,.57* 9 3.48
Pauchaug Forest 41 35 71 51 1948-57* 9 2.89 Peoples Ranger Station 41 56 73 00 1941-57 17 3.77 Prospect 41 30 72 57 1941-57* 16 3.84 Putnam 41 54 71 54 1939-57 19 3.41 Putnam 41 54 71 54 1940-57 18 1.33 2.44 3.08
Putnam Lake 41 05 73 38 1948-57 10 3.83 Rockville 41 52 72 26 1942-57 16 1.29 2.38 3.22 Rocky River Dam 41 35 73 26 1948-57 10 3.70 Round Pond 41 18 73 32 1948-57 10 3.73 Salisbury 41 59 73 27 1942-57 16 3.52
Saugatuck Reservoir 41 15 73 21 1948-57 10 3.62 Shepaug Dam 41 43 73 18 1941-48 8 1.21 2.43 3.50 Shuttle Meadow Reservoir 41 39 72 49 1941-57 17 3.80 Southington 41 35 72 51 1897-21 25 3.62 Stafford Springs 41 58 72 18 1941-56* 14 3,65
Stamford 5 N 41 08 73 32 1948-57 10 3.86 Stevenson Dam 41 23 73 10 1948-57 10 3.49 Storrs 41 48 72 15 1939-57 19 3.62 Storrs 41 48 72 15 1940-57 18 1. 35 2.72 3.55 Thompsonville 42 00 72 36 1941-56 14 3,56
Torrington 41 48 73 07 1948-57 10 3.95 Torrington 2 41 48 73 08 1948-57 10 4.57 Trap Falls Reservoir 41 17 73 09 1948-57 10 4.39 Wallingford 41 28 72 51 1910-15 6 3.46 Washington 41 38 73 19 1947-53 7 3.20
Waterbury 41 33 73 02 1896-53* 57 3.44 Waterbury City Hall 41 34 73 02 1941-48 8 1.24 2.77 3.86 Wepawaug Reservoir 41 18 73 02 1948-57* 9 3.82 Westbrook 41 18 72 26 1942-57 16 3.42 West Hartford 41 45 72 47 1942-57 16 3.68
West Hartland 42 09 72 58 1941-57 17 4.05
*Breaks in Record
17

Table 2-2, cont.
Period Length 2-Year 1-Hour 2-Year ·6-Hour 2-Year 24-Hour STATION Lat. Long. of of Record Rainfall Rainfall Precipitation
Record (years) (inches) (inches) (inches)
CONNECTICUT _( con"!:_inued)
Whigville Reservoir 41 44 72 57 1941-57 17 4.14 Whitney Lake 41 20 72 55 1941-57* 16 3,60 Wigwam Reservoir 41 40 73 08 1948-57* 9 4.27 Willimantic 41 43 72 14 1948-57 10 3.49 Windsor Locks CAA AP 41 56 72 41 1942-53* 9 3,18
Wolcott Reservoir 41 37 72 56 1942-57 16 4.44 Woodbury 3 W 41 34 73 16 1948-57 10 3.55
MAINE
Augusta AP 44 19 69 48 1942-57* 14 ,97 1.99 2.67 Augusta CAA AP 44 19 69 48 1946-57 12 3,17 Bangor 44 48 68 48 1942-52 ll 2.46 Bangor AP 44 48 68 49 1941-47 7 .88 1.91 2,56 Bangor Dow Field 44 48 68 49 1953-57 5 3,20
Bar Harbor 44 23 68 12 1942-57 16 3.0& Belfast 44 24 69 00 1947-57 11 3.52 Bethel 44 25 70 48 1947-51 5 .83 1.80 2,61 Brassua Dam 45 40 69 50 1942-57 16 2,33 Brunswick 43 55 69 57 1942-46 5 3.ll
Caribou WB AP 46 52 68 01 1941-57 17 ,95 1.81 2,57 Clayton Lake 46 37 69 32 1943-57* 14 .73 1.29 1.91 Corinna 44 57 69 13 1948-57 10 2.63 Eastport 44 55 66 59 1953-57 5 .67 1.79 2.33 Eastport WB City 44 54 56 59 1896-52* 55 .83 1.72 2,50
East Sangerville 5 SE 45 08 69 16 1948-57 10 2.29 East Winthrop 44 19 69 54 ""-" I 16 2,72 Ellsworth 44 32 68 26 1939-57 19 2.72 Eustis 45 13 70 29 1939-51* 12 2,30 Eustis 7 NW 45 17 70 35 1941-57* 13 .91 1.59 2.32
Farmington 44 40 70 09 1897-57* 60 2,88 Fort Fairfield 46 48 67 46 1942-57 16 2.53 Fort Kent 47 15 68 36 1939-57* 18 2.26 Fort Kent 47 15 68 36 1941-57* 16 .61 1.30 1.88 Gardiner 44 13 69 47 1896-57 62 2,84
Gilead 44 24 70 58 1948-57 10 3.42 Gilead 44 24 70 58 1947-51 5 .79 2.39 3,32 Grand Lake Stream 45 ll 67 48 1942-57 16 .87 1.87 2,57 Greenville 45 27 59-35 1907-57 51 2,90 Greenville 45 27 69 35 1941-57 17 1.14 2.00 3,01
Hiram 2 S 43 51 70 48 1942-57 16 3,54 Houlton CAA AP 46 07 67 48 1949-57 9 2.76 Houlton l NE 46 08 67 50 1902-57* 55 2,26 Houlton 1 NE 46 08 67 50 1942-57 16 ,84 1.71 2.46 Jackman 45 37 70 16 1939-57 19 2,29
Jonesboro 44 39 67 39 1949-57 9 2.76 Lewiston 44 06 70 14 1896-57 62 2,91 Machias 44 43 67 28 1942-57 16 3.47 Madison 44 48 69 54 1905-57 53 2,72 Middle Dam 44 47 70 55 1942-57 16 2.41
Millinocket 45 39 68 42 1903-57 55 2.82 Millinocket 45 39 68 42 1941-57 17 1.04 1.83 2.49 Millinocket CAA AP 45 39 68 41 1948-57 10 2,72 Millinocket Dam 46 17 68 55 1949-55 7 1.96 Milo 45 17 69 01 1939-49 ll 2,84
Milton 44 27 70 39 1947-51 5 .90 2.01 2.95 Moose head 45 35 69 43 1942-57 16 2,83 North Andover 44 39 70 47 1947-51 5 .86 1.99 2.83 North Bridgton 44 08 70 43 1896-53* 56 3,15 Old Town 44 56 68 39 1939-56 18 2.88
Old Town CAA AP 44 57 68 40 1949-57 9 2.80 Orono 44 52 68 42 1942-57* 13 2.06 Portland 43 40 70 15 1939-57 19 3,50 Portland WB AP 43 39 70 19 1897-57* 60 ,98 2.17 3.01 Prentiss 45 27 68 10 1949-54 6 2.96
Presque Isle 46 39 68 00 1910-57* 46 2.24 Presque Isle AP 46 41 68 03 1940-48 9 .67 1.42 2.10 Ripogenus Dam 45 53 69 ll 1939-57 19 2.51 Rockland 44 06 69 07 1942-57 16 3,28 Rockland l w 44 06 69 08 19"41-57 17 ;t.ll 2,40 3.22
Roxbury 44 40 . 70 36 1948-57 10 2.71 Roxbury 44 40 70 36 1947-51 5 1.08 1.62 2,54 Rumford l SSE 44 33 70 33 1900-57 58 2.98 Rumford 1 SSE 44 33 70 33 1941-57* 16 ,95 1.94 2.90 Rumford 3 SW 44 31 70 34 1949-57 9 3.07
Skowhegan 44 46 69 43 1941-57 17 1.06 2,02 2,96 South Andover 44 36 70 44 1948-57* 9 2.44 South Andover 44 36 70 44 1947-51 5 .84 1.95 2.83 Southwest Harbor 3 SSE 44 14 68 18 1941-57 17 ,93 2,23 2.94 Squa Pan Dam 46 32 68 20 1948-57 lO 2,68
Sunday River 44 30 70 52 1947-51 5 1.04 2.37 3,53 Swans Falls 44 02 70 59 1941-57 17 1.00 1.96 3,10
*Breaks in Record
18

Table 2-2, cont.
Period Length 2-Year 1-Hour 2-Year ·6-Hour 2-Year 24-Hour STATION Lat. Long. of of Record Rainfall Rainfall Precipitation
Record (years) (inches) (inches) (inches)
MAINE (continued)
The Forks 45 20 69 58 1939-57 19 2.48 Upper Dam 44 52 70 52 1942-57 16 2.30 Vanceboro 45 34 67 26 1942-48 7 2.51 Winslow 44 33 69 38 1905-57* 52 2.85 Woodland 45 09 67 24 1939-57 19 2.84
MASSACHUSETTS
Adams 42 39 73 06 1941-57 17 3,22 Amherst 42 24 72 32 1896-39 44 3.15 Amherst 42 24 72 32 1940-57 18 1.30 2.01 2.86 Ashburnham 42 39 71 53 1948-57 10 3.85 Ashland 42 18 71 28 1942-57 16 3.67
Athol 3 E 42 35 72 10 1948-57 10 3,10 Beechwood 42 13 70 49 1942-57 16 4.02 Belchertown 42 17 72 21 1948-57 10 3.96 Birch Hill Dam 42 38 72 07 1948-57 10 2.90 Birch Hill Dam 42 38 72 07 1940-57 18 1.08 2.12 2.94
Blue Hill 42 13 71 07 1896-57 62 3.30 Blue Hill 42 13 71 07 1940-57 18 1.14 2,23 3,28 Boston ~WB AP 42 22 71 02 1896-57* 61 l.ll 2,18 3,13 Boylston 42 21 71 43 1942-57* 15 3.17 Brockton 42 03 71 01 1942-57 16 3.52
Cambridge 42 23 71 07 1940-57* 16 • 93 2. 21 3. 31 Chatham Light Station 41 40 69 57 1945-57* 9 2.58 Chester 42 17 72 59 1942-56 15 4.13 Chesterfield 42 23 72 51 1939-57 19 3,43 Chestnut Hill 42 20 71 10 1942-57 16 3.61
Clinton 42 24 71 41 1906-57 52 2,86 Cohasset 42 16 70 50 1948-57 10 3,20 Col brook 42 23 72 03 1948-57 10 3,50 Concord 42 27 7J.. 22 1939-49 ll 2,75 East Wareham 41 46 70 40 1939-57 19 3,32
Edgartown 41 23 70 31 1946-57 12 3.23 Fall River 41 42 71 10 1897-57 61 3,19 Fitchburg 2 S 42 34 71 46 1896-57 62 3,20 Framingham 42 17 71 25 1896-57* 53 3,00 Franklin 42 06 71 24 1939-57* 17 3.76
Gardner 42 35 71 59 1942-57 16 3.16 Gloucester 42 37 70 39 1942-46 5 3,36 Groton 42 36 71 35 1942-57 16 2.94 Hardwick 42 21 72 12 1939-57* 18 3.29 Harvard Forest 42 32 72 11 1940-53 14 1.40 2.44 3.13
Hatchville 41 37 70 32 1940-57 18 3.55 Haverhill 42 46 71 04 1909·-57* 45 2.73 Heath 42 40 72 49 1942-57 16 3.43 Holyoke 42 13 72 36 1942-57 16 3.86 Hoosac Tunnel 42 41 72 58 1942-57 16 3.05
Hubbardston 42 29 72 00 1939-57 19 3,04 Hyannis 3 NE 41 41 70 15 1896-57* 56 3.35 Hyannis 3 NE 41 41 70 15 1942-57 16 1.14 2.28 3.21 Ipswich 42 40 70 52 1939-57 19 3.16 Jefferson 42 22 71 54 1942-57* 14 3,25
Knightville Dam 42 17 72 52 1948-57 10 3.58 Knightville Dam 42 17 72 52 1940-57 18 1.14 2,30 3. 27 Lake Cochituate 42 19 71 23 1942-57 16 3.68 Lawrence 42 41 71 10 1942-57 16 3.19 Lowell 42 39 71 18 1898-57* 56 2,90
Mansfield 42 03 71 12 1942-57 16 3.50 Mendon AP 42 06 71 34 1940-49 10 1.43 2.41 2.95 Middleboro 41 53 70 54 1942-57 16 3.46 Middleton 42 36 71 01 1942-57 16 3.25 Milford 42 10 71 31 1942-57 16 3.72 Millbury 42 1·2 71 45 1942-57 16 3,29 Montague City 42 35 72 35 1942-57 16 3.02 Nantucket WB AP 41 15 70 04 1897-57* 58 1.15 2.22 3.05 New Bedford 41 39 70 55 1896-57* 55 3.21 New Bedford 41 39 70 55 J..940-57 18 • 91 2.00 3.ll Newburyport 42 50 70 55 948-57 10 3,32 New Salem 42 28 72 20 1949-57 9 3.35 !Newton 42 18 71 13 948-54 7 2,88 Northbridge 42 07 71 40 942-57 16 3.83 !North Truro 42 02 70 04 944-50 7 .88 1,86 2,61 Pelham 42 23 72 24 948-57 10 3.16 Pembroke 42 01 70 49 942-57 16 3,34 Peru 42 27 73 04 942-57 16 3,44 Petersham 4 N 42 32 72 11 942-57* 12 3,64 Pittsfield 42 27 73 15 ~939-48 10 3.17 !pittsfield WB AP 42 26 73 17 947-57 11 1.45 2.23 2,95 Plainfield 42 31 72 55 942-57 16 3,53 Plymouth 41 59 70 42 905-57 53 3.16 !Princeton 42 27 71 52 942-57* 14 3.22 Provincetown· 3 N 42 04 70 13 899-57* 51 2.87
*Breaks in Record
19

Table 2,2, cont.
Period Length 2-Year 1-Hour 2-Year ·6-Hour 2-Year 24-Hour
STATION Lat. Long. of of Record Rainfall Rainfall Precipitation Record (years) (inches) (inches) (inches)
MASSACHUS.E:I'TS (continued)
Quabbin Intake 42 22 72 17 1948-57 10 3.16 Rockport 1 ESE 42 39 70 37 1902-57* 54 3.,21 Rockport 1 ESE 42 39 70 37 1942-57 16 1. 05 2.20 3.28 Sandwich 41 46 70 30 1946-57 12 3,31 Segreganset 41 50 71 07 1942-57* 14 3.32
Shelburne Falls 42 36 72 44 1942-57 16 3.18 Southbridge 3 SW 42 03 72 05 1939-57 19 3.49 South Egremont 42 10 73 25 1939-57 19 3.59 Spot Pond 42 27 71 06 1942-57 16 4.28 Spr ingf ie ld Armory 42 06 72 35 1900-57* 48 3.22
State Farm 41 57 70 57 1940-55 16 1.26 2.38 3,21 Sterling 42 27 71 48 1942-57 15 2.94 Sterling 3 NW 42 28 71 48 1947-57 11 1.07 2.04 3.16 Stockbridge 42 17 73 19 1942-57 16 2.88 Swampscott 42 28 70 54 1942-56 15 3.14
Taunton 41 54 71 04 1896-57* 44 3.11 Turners Falls 42 36 72 33 1903-57 55 2.90 Walpole 42 11 71 15 1949-57 9 4.04 Ware 42 17 72 17 1948-57 10 4.01 Ware 2 42 16 72 18 1942-57 16 3,36
Washington 2 42 22 73 09 1940-57 18 1.23 2.14 3.10 Webster 42 03 71 53 1942-57 16 3.30 West Brimfield 42 10 72 16 1941-57* 15 1.04 1. 96 2.82 West Cwnmington 42 29 72 58 1942-57* 10 3.18 westfield 42 06 72 42 1942-57 16 4.30
weston 42 23 71 19 1942-57 16 3.47 West Otis 42 11 73 09 1939-57 19 3.48 West Rutland 42 22 71 59 1942-57 16 3.59 Williamstown 42 43 73 12 1939-45* 5 2.46 Winchendon 42 42 72 03 1896-57* 46 3.11
Worcester 42 18 71 49 1896-57 62 2.97 Worcester WB AP 42 16 71 52 1948-57 10 3,53 worcester Winter Hill 42 18 71 49 1941-45 5 1. 12 2.04 2.35 worcester 2 42 13 71 48 1941-48 8 1. 36 2. 31 2.69
NEW HAMPSHIRE
Alexandria 43 39 71 53 1947-53 7 3,43 Bath 2 sw 44 09 71 59 1948-57 10 2.06 Benton 44 06 71 53 1948-57* 9 2.46 Berlin 44 29 71 10 1898-57* 49 2,70 Bethlehem 44 17 71 42 1942-57 16 2.77
Blackwater Dam 43 19 71 43 1949-53 5 2.57 Blackwater Dam 43 19 71 43 1945-57 13 1.2.2 2.06 2.92 Bow Garvins Falls 43 10 71 31 1948-57 10 2;59 Bradford 43 15 71 58 1949-57 9 3,04 Bristol 43 36 71 43 1940-57 18 . 91 1.84 2,93
Bucks Corner 43 44 71 59 1349-57 9 3.13 Campton 43 52 71 38 1948-57 10 2.81 Cannon Mountain 44 10 71 42 1952-57 6 2.70 Center Harbor 43 43 71 28 1948-57 10 2.54 Claremont 43 23 72 21 1948-57 10 2. 93
Concord WB AP 43 12 71 30 1905-57* 48 1.07 1.89 2.80 Dixville Notch 44 52 71 20 1942-57 16 2.45 Dublin 42 54 72 04 1948-57 10 2.75 Durham 43 08 70 56 1896-57 62 3,10 Durham 43 08 70 56 1941-57 17 1.05 2. 25 2.99
East Deering 43 04 71 49 1948-57 10 3.17 Eastman Falls Dam 43 27 71 40 1948-57 10 2.90 Errol 44 47 71 08 1942-57 16 2.40 Errol 44 47 71 08 1941-57 17 .82 1.63 2.30 Fabyan 44 16 71 27 1949-57 9 3.13
First Connecticut Lake 45 06 71 17 1939-57 19 2.45 Fitzwilliam 42 47 72 09 1942-48 7 2.98 Fitzwilliam 3 SW 42 45 72 11 1948-57 10 2.78 Franklin Falls Dam 43 28 71 39 1949-57 9 2.93 Franklin Falls Dam 43 28 71 39 1945-57 13 .97 1.96 2,96
Franklin 1 NW 43 27 71 40 1907-57 51 2.86 Gilmanton 43 25 71 25 1948-57 10 2.44 Glencliff 43 59 71 54 1942-53 12 3.24 Gorham 44 2'3 71 11 1947-51 5 .88 2.14 3, 36 Hanover 43 42 72 17 1896-57 62 2.51
Hanover 43 42 72 17 1940-57 13 .96 1. 78 2. 51 Hillsboro 2 w 43 07 71 57 1940-57 18 .98 2.11 3.11 Hudson 42 47 71 26 1951-57 7 1.18 2.40 3.18 Jefferson 44 25 71 28 1948-57 10 2.58 Keene 42 56 72 17 1896-57 62 2.64
Lakeport 43 33 71 28 1942-57 16 3.11 Lakeport 2 43 32 71 28 1949-57 9 2.70 Lancaster 44 29 71 34 1948-57 10 2.02 Landaff 44 11 71 54 1940-37 18 1.03 l. 68 2.30 Lebanon CAA AP 43 38 72 19 1944-57* 13 2.52
Lincoln 44 03 71 40 1939-57* 18 2.98
*Breaks in Record
20
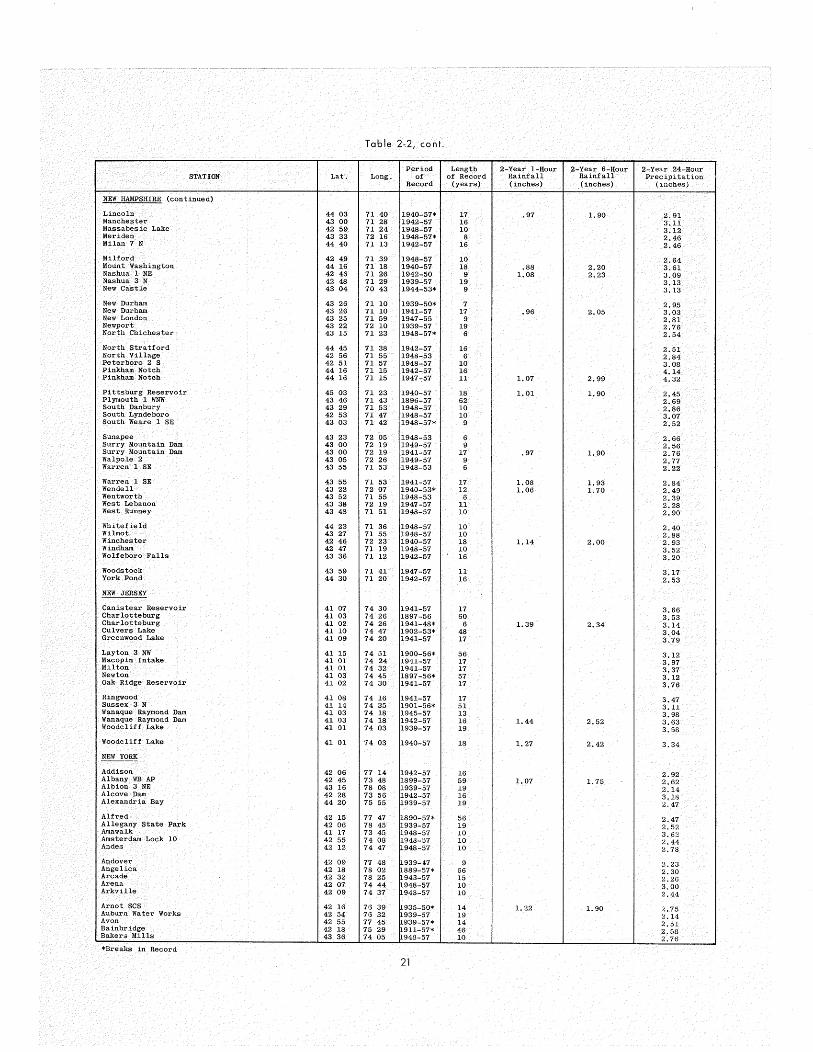
Table 2c2, cont.
Period Length 2-Year 1-Hour 2-Year ·6-Hour 2-Year 24-Hour STATION Lat. Long. of of Record Rainfall Rainfall Precipitation
Record (years) (inches) (inches) (l.nches)
NEW HAMPSHIRE (continued)
Lincoln 44 03 7l 40 1940-57* 17 .97 l. 90 2. 91 Manchester 43 00 71 28 1942-57 16 3.11 Massabesic Lake 42 59 71 24 1948-57 10 3.12 Meriden 43 33 72 16 1948-57* 8 2.46 Milan 7 N 44 40 71 13 1942-57 16 2.46
Milford 42 49 71 39 1948-57 10 2.64 Mount Washington 44 16 71 18 1940-57 18 .88 2.20 3. 61 Nashua 1 NE 42 46 71 26 1942-50 9 1.08 2. 23 3.09 Nashua 3 N 42 48 7l 29 1939-57 19 3.13 New Castle 43 04 70 43 1944-53* 9 3.13
New Durham 43 26 71 10 1939-50* 7 2. 95 New Durham 43 26 71 10 1941-57 17 .96 2.05 3.03 New London 43 25 7l 59 1947-55 9 2.81 Newport 43 22 72 10 1939-57 19 2.76 North Chichester 43 15 71 23 1948-57* 6 2.54
North Stratford 44 45 71 38 1942-57 16 2.51 North Village 42 56 71 55 1948-53 6 2.84 Peterboro 2 S 42 51 71 57 1948-57 10 3.08 Pinkham Notch 44 16 71 15 1942-57 16 4.14 Pinkham Notch 44 16 7l 15 1947-:57 11 1.07 2.99 4.32
Pittsburg Reservoir 45 03 71 23 1940-57 18 1.01 l. 90 2. 45 Plymouth l WNW 43 46 71 43 1896-57 62 2.69 South Danbury 43 29 7l 53 1948-57 10 2.86 South Lyndeboro 42 53 71 47 1948-57 10 3.07 South Weare l SE 43 03 71 42 1948-57* 9 2. 52
Sunapee 43 23 72 05 1948-53 6 2. 66 Surry Mountain Dam 43 00 72 19 1949-57 9 2.56 Surry Mountain Dam 43 00 72 19 1941-57 17 .97 1.90 2.76 Walpole 2 43 05 72 26 1949-57 9 2.77 Warren l SE 43 55 71 53 1948-53 6 2.22
Warren l SE 43 55 71 53 1941-57 17 1.08 l. 93 2.84 Wendell 43 22 72 07 1940-53* 12 1.06 l. 70 2.49 Wentworth 43 52 71 55 1948-53 6 2.39 West Lebanon 43 38 72 19 1947-57 11 2.28 West Rumney 43 48 71 51 1948-57 10 2.90
Whitefield 44 23 71 36 1948-57 10 2.40 Wilmot 43 27 71 55 1948-57 10 2.88 Winchester 42 46 72 23 1940-57 18 1.14 2.00 2.93 Windham 42 47 7l 19 1948-57 10 3.52 Wolfeboro Falls 43 36 7l 12 1942-57 16 3.20
Woodstock 43 59 71 41 1947-57 11 3.17 York Pond 44 30 7l 20 1942-57 16 2.53
NEW JERSEY
Canistear Reservoir 41 07 74 30 1941-57 17 3.66 Charlotte burg 41 03 74 26 1897-56 60 3. 53 Charlotte burg 41 02 74 26 1941-48* 6 1.39 2.34 3.14 Culvers Lake 41 10 74 47 1902-53* 48 3.04 Greenwood Lake 41 09 74 20 1941-57 17 3 .. 79
Layton 3 NW 41 15 74 51 1900-56* 56 3.12 Macopin Intake 41 01 74 24 1941-57 17 3. 97 Milton 41 01 74 32 1941-57 17 3.37 Newton 41 03 74 45 1897-56* 57 3.12 Oak Ridge Reservoir 41 02 74 30 1941-57 17 3. 76
Ringwood 41 08 74 16 1941-57 17 3.47 Sussex 3 N 41 14 74 35 1901-56* 51 3.11 Wanaque Raymond Dam 41 03 74 18 1945-57 13 3.98 Wanaque Raymond Dam 41 03 74 18 1942-57 16 1.44 2.52 3.63 Woodcliff Lake 41 01 74 03 1939-57 19 3.58
Woodcliff Lake 41 01 74 03 1940-57 18 1. 27 2.42 3.34
NEW Y~~
Addison 42 06 77 14 1942-57 16 2.92 Albany WB AP 42 45 73 48 1899-57 59 l. 0'7 l. 75 2. 62 Albion 3 NE 43 16 78 08 1939-57 19 2.14 Alcove Dam 42 28 73 56 1942-57 16 3.18 Alexandria Bay 44 20 75 55 1939-57 19 2. 47
Alfred 42 15 77 47 1890-57* 56 2. 47 Allegany State Park 42 06 78 45 1939-57 19 2. 52 Amawalk 41 17 73 45 1948-57 10 3.6:< Amsterdam Lock 10 42 55 74 08 1948-57 10 2.44 Andes 42 12 74 47 1948-57 10 2. 78
Andover 42 09 77 48 l939-47 9 2. 23 Angelica 42 18 78 02 889-57* 66 2. 30 Arcade 42 32 78 25 943-57 15 2.26 Arena 42 07 74 44 948-57 10 3,00 Arkville 42 09 74 37 948-57 10 2.44
Arnot SCS 42 16 76 39 935-50* 14 l. 22 l. 90 2. 75 Allburn Water Works 42 54 713 32 939-57 19 2.14 Avon 42 55 77 45 939-57* 14 2. 51 Bainbridge 42 18 75 29 911-57* 46 2. 58 Bakers Mills 43 36 74 05 948-57 10 2. 76
*Breaks in Record
21

Table 2~2, cont.
Period Length 2-Year 1-Hour 2-Year ·6-Hour 2-Year 24-Hour STATION Lat. Long. of of Record Rainfall Rainfall Precipitation
Record (years) (inches) (inches) (inches)
NEW YORK (continued)
Baldwinsville 43 09 76 20 1942-57 16 2.47 Balsam Lake 42 02 74 36 1948-57 10 3.74 Barker 4 NE 43 22 78 29 1942-57 16 2. 21 Batavia 43 00 78 ll 1942-57 16 2,30 Bear Mountain WB 41 19 74 00 1941-50 10 1.18 2.07 3.19
Beaver Falls 43 53 75 26 1939-57 19 2.23 Bedford Hills 41 14 73 43 1897-56* 59 3.30 Bennetts Bridge 43 32 75 57 1945-57 13 2.99 Big Moose 3 E 43 49 74 52 1939-57 19 2. 69 Binghamton 42 06 75 55 1951-57 7 3.13
Binghamton WB AP 42 13 75 59 1901-57* 56 1.12 1.84 2.52 Blaclt River l sw 44 00 75 49 1948-57 10 2,16 Bolivar 42 03 78 ll 1943-51* 8 2.66 Bolivar 42 03 78 ll 1938-57 20 1,08 1. 74 2,48 Boonville 2 N 43 31 75 21 1939-57 19 2.80
Boonville 2 ssw 43 27 75 21 1950-57 8 2,68 Bovina 42 16 74 44 1948-57 10 3,13 Boyds Corners 41 27 73 44 1948-57 10 3,96 Bradford 42 22 77 06 1948-57 10 2,50 Brewerton Lock 23 43 14 . 76 12 1942-57 16 2.81
Brews tar (nr) 41 26 73 36 1941-47 7 1,67 2.18 3.10 Bristol Springs 42 43 77 22 1942.-57 16 2.14 Broadalbin 43 05 74 10 1948-57 10 2.63 Brockport 2 NW 43 15 77 58 1904-57* 48 2,10 Buffalo WB AP 42 56 78 44 1898-57* 56 1.02 1,60 2.19
Burdett 1 NE 42 25 76 50 1942-57 16 2.30 Bushnellsville 1 NE 42 10 74 24 1948-57 10 2.89 Butternut Brook 41 55 74 40 1948-57 10 3.41
. Cairo 42 19 74 01 1939-57 19 3,32 Callicoon 41 46 75 03 1949-57 9 2,83
Camden 43 20 75 44 1947-57 ll 2.75 Canajoharie 42 54 74 34 1942-57 16 2.53 Canandaigua 3 S 42 51 77 17 1943-57 15 2.05 Canastota 1 SW 43 04 75 45 1942-57 16 2. 96 Candor 42 14 76 21 1948-57 10 2.20
Canisteo 42 16 77 37 1949-57 9 2.15 Canton 44 36 75 10 1890-57* 60 2.33 Canton WB City 44 35 75 10 1907-50* 41 .98 l. 64 2,38 Carmel 1 SW 41 25 73 42 1939-57 19 3,77 Cayuga Lock 1 42 57 76 44 1942-57 16 2.42
Chasm Falls 44 45 74 13 1942-57 16 2,28 Chazy 3 E 44 53 73 23 1904-57* 51 2.17 Chemung 42 00 76 38 1942-57 16 2.35 Cherry Plain 42 37 73 25 1943-49 7 3 .. 91 Cherry Valley 2 NNE 42 50 74 45 1949-57 9 2.88
China 42 10 75 24 1935-50* 15 1.05 1.85 2.59 Cincinnatus 42 32 75 54 1942-57 16 2,78 Claryville 3 SW 41 53 74 36 1948-57 10 3.16 Cleveland 43 H 75 53 1942-51 10 2,65 Clyde Lock 26 43 04 '76 50 1942-57 16 2.32
Cobleskill 42 40 74 30 1946-55 10 2.38 Cohocton SCS 42 28 77 30 1948-57 10 2.36 Cold Brook 42 01 7! 16 1948-57 10 4.70 Colton 3 N 44 35 74 57 1939-57 19 2,46 Conklingville Dam l 43 19 73 56 1939-57 19 2.86
Conklingville Dam 1 43 19 73 56 1941-57 17 1.09 1,81 2,96 Conkl ingville Dam 2 43 19 73 55 1948-57 10 2,84 Constantia 43 15 76 00 1952-57 6 3,18 Cooperstown 42 42 74 55 1890-57* 67 2.54 Copenhagen 43 54 75 41 1939-45 7 2.50
Corning 42 08 77 03 1942-57 16 2.72 Cortland 42 36 76 ll 1892-57 66 2,54 Craigie Clair 41 58 74 52 1948-57 10 2,82 Cross River 41 16 73 41 1948-57 10 3.94 Croton Falls l :>!E 41 21 73 40 1948-57 10 4,00
Croton Lake 41 14 73 48 1948-57 10 3. 76 Cutchogue 41 01 72 29 1899-56* 46 3.38 Cutchogue 41 01 72 30 1940-50 ll 1.13 2. 58 3,64 Dannemora 44 43 73 43 1906-57 52 2,21 Dansville 42 34 77 42 1939-57* 17 2.24
Dansville CAA AP 42 35 77 43 1948-53 6 2.04 Davenport 42 28 74 51 1945-50 6 .86 1.68 2.34 Delhi 42 16 74 55 1939-57 19 2.87 Delta 43 17 75 27 1942-57 16 2.74 Derby 2 NW 42 42 79 01 1945-57 13 2,40
De Ruyter 4 N 42 49 75 53 1942-57 16 2,64 Dobbs Ferry 41 01 73 52 1946-57 12 3,74 Dolgeville 43 05 74 46 1939-57 19 2.42 Downsville 42 05 75 00 1948-57 10 3.01 Downsville 42 06 75 00 1'341-49 9 1. 51 2. 20 2.67
Dunkir'-t 42 29 79 21 1941-57 17 1.15 1.88 2.41 Dunkirk CAA AP 42 30 79 17 1948-53 6 2.09
*Breaks in Record
22

Table 2-2, cont.
Period Length 2-Year 1-Hour 2-Year ·6-Hour 2-Year 24-Hour STATION Lat. Long. of of Record Rainfall Rainfall Precipitation
Record (years) (inches) (inches) (inches)
NEW YORK (continued)
Eagle Bay 43 46 74 49 1953-57 5 3.07 Eagle Falls 43 54 75 11 1939-57 19 2.47 East Branch 41 24 73 35 1948-57 10 4,32 East Delhi 42 17 74 55 1948-54 7 3.18 East Homer 2 42 43 76 07 1949-57 9 2.60
East Jewett 42 15 74 ll 1948-57 10 3.79 Edgewood 42 08 74 14 1948-57 10 4,45 Edmeston 42 41 75 15 1940-50* 10 .90 1,47 2. 38 Elizabethtown 44 13 73 36 1942-57* 14 2.34 Elka Park 42 10 74 10 1948-57 10 5.30
Ellenburg Depot 44 54 73 48 1947-57 ll 2.12 Ellenville 41 43 74 24 1948-57 10 3.70 Elma 42 51 78 39 1943-57* 9 2.24 Elma 42 51 78 39 1945-50 6 .95 L70 2.33 Elmira 42 05 76 48 1939-57 19 2.40
Elmira CAA AP 42 10 76 54 1948-57 10 2.18 Ephratah 43 01 74 32 1948-57 10 2.60 Fishs Eddy 41 58 75 11 1953-57 5 2, 33 Forestport 43 26 75 13 1942-57 16 2.90 Fort Plain 42 56 74 37 1941-50* 9 1.01 1.58 2,17
Frankfort 43 04 75 07 1942-57 16 2.68 Franklinville 42 21 78 27 1939-57* 14 2.42 Fredonia 42 26 79 22 1914-57 44 2.44 Freeville 2 NE 42 32 76 19 1948-57 10 2.77 Friendship 5 SW 42 10 78 12 1952-57 6 2. 23
Frost Valley 41 58 74 31 1948-57 10 3.72 Fulton 43 19 76 25 1942-57 16 2.09 Gabriels 44 26 74 ll 1939-48* 7 2.02 Geneva Experiment Station 42 53 77 00 1889-57* 49 2.30 Geneva Experiment Station 42 53 77 00 1940-57 18 1.11 1,65 2.22
Glenford 42 01 74 08 1948-57 10 4.22 Glenham 41 31 73 56 1939-57 19 3. 31 Glens Falls CAA AP 43 21 73 37 1948-57 10 2.64 Glens Falls Farm 43 19 73 44 1943-57 15 3.17 Glens Falls Foeder Dam 43 17 73 40 1948-55 8 2.99
Glens Falls Fire Station 43 19 73 39 1942-56 15 2.62 Gloversville 43 03 74 21 1892-57 66 2.56 Gloversville Pecks Pond 43 06 74 26 1948-57 10 2.94 Gouverneux· 44 20 75 28 1939-57 19 2.38 Gowanda State Hospital 42 29 78 56 1946-57 12 2.34
Grafton 1 NW 42 47 73 28 1951-57 7 2.81 Grahamsville 41 51 74 33 1948-57 10 3. 38 Grand Gorge 42 22 74 30 1948-57 10 3.12 Gravesville 2 N 43 16 75 07 1950-37 8 2.47 Greene 42 20 75 46 1939-57 19 2,47
Greenfield Center 43 07 73 50 1939-54 16 2.60 Halcott Center 2 NNE 42 13 74 28 1948-57 10 2.93 Hale Eddy 4 NNW 42 04 75 26 1953-57 5 2.11 Hamilton 42 49 75 32 1939-57* 17 2.50 Hammondsport 1 s 42 24 77 13 1942-57 16 2,42
Hammondsport 2 42 24 77 15 1936-46* 9 1.12 1.48 2. 25 Harpursville 42 09 75 37 1948-55 8 2.46 Harvard 42 01 75 07 1948-57 10 2.88 Haskinville 42 25 77. 34 1896-57* 61 2. 23 Hemlock 42 47 77 37 1904-57 54 2. 32
Higgins Bay 43 24 74 32 1943-48 6 1. 30 2,07 2.82 High Falls 41 50 74 08 1939-57 19 3.01 Higlunarket 43 35 75 31 1939-57 19 3,06 Highmarket 1 SE 43 35 75 30 1940-57 18 1,03 1, 90 2.90 Highmount 42 09 74 29 1948-57 10 3.42
Hilton 43 17 77 47 1946-57 12 2.11 Hinckley 43 18 75 07 1942-57 16 3. 31 Hoffmeister 43 23 74 43 1939-57 19 3.30 Honk Falls 41 45 74 23 1939-52 14 3.01 Hooker 43 41 75 45 1945-57* 10 2.15
Hope 43 21 74 16 19:m-57 19 3. 34 Hornell Almond Dam 42 21 77 42 1940-57 18 1.02 1.43 2.11 Hudson 2 42 15 73 47 1941-57'• 15 1. 31 2.18 2.90 Hmtts Corners 42 26 76 07 1940-57 18 1.08 l, 73 2.59 Indian Lake 2 SW 43 45 74 17 1900-57 58 2.57
Indian Lake 2 SW 43 45 '/4 17 1942-57 16 1.00 1,98 2.84 Inghams 43 04 74 46 1948-57 10 2.53 Ithaca Cornell University 42 27 76 28 1889-57 69 2.62 Ithaca Cornell University 42 27 76 28 1943-50 8 1.16 2.05 2.70 Ithac:a WB City 42 27 76 29 1911-42* 28 1. 23 1.89 2,71
Jacksonburg 43 01 74 56 1942-57 16 2.40 Jarnestow11 42 06 79 15 1939-57 19 2.76 Jamestown 42 06 79 15 1938-57 20 1.19 2,02 2, 56 Jeffersonville 41 47 74 fjG 1939-47 9 2.71 Johnsonville 42 55 73 31 1948-57 10 2.76
Kendall 43 20 78 02 19-H-50* 8 2.00
*Breaks l.n Record
23
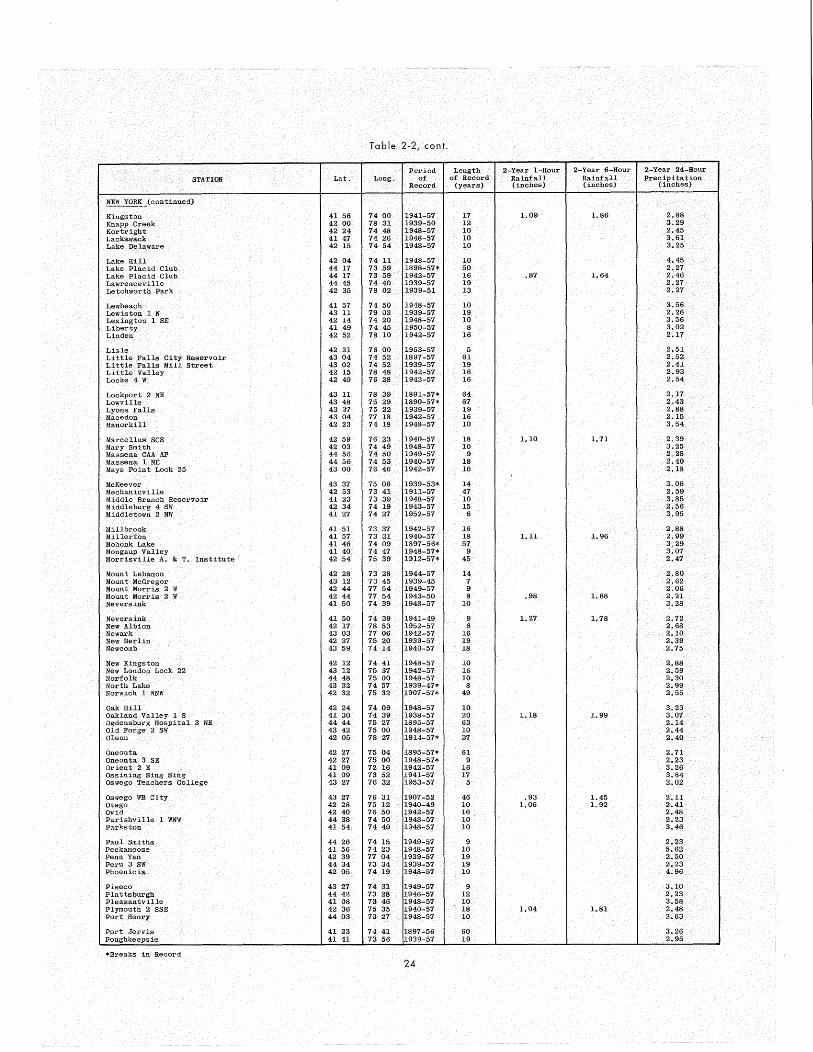
Table 2-2, cont.
Period Length 2-Year 1-Hour 2-Year ·6-Hour 2-Year 24-Hour
STATION Lat. Long. of of Record Rainfall Rainfall Precipitation Record (years) (inches) (inches) (inches)
NEW YOR!_ (continued)
Kingston 41 56 74 00 1941..:.57 17 1.09 1.86 2.88 Knapp Creek 42 00 78 31 1939-50 12 3.29 Kortright 42 24 74 48 1948-57 10 2.45 Lackawack 41 47 74 26 1948-57 10 3.61 Lake Delaware 42 15 74 54 1948-57 10 3,25
Lake Hill 42 04 74 ll 1948-57 10 4.45 Lake Placid Club 44 17 73 59 1898-57* 50 2. 27 Lake Placid Club 44 17 73 59 1942-57 16 ,87 1.64 2,46 Lawrenceville 44 45 74 40 1939-57 19 2,27 Letchworth Park 42 35 78 02 1939-51 13 2.27
Lew beach 41 57 74 50 1948-57 10 3,56 Lewiston 1 N 43 11 79 03 1939-57 19 2. 26 Lexington 1 SE 42 14 74 20 1948-57 10 3.56 Liberty 41 49 74 45 1950-57 8 3,02 Linden 42 52 78 10 1942-57 16 2.17
Lisle 42 21 76 00 1953-57 5 2.51 Little Falls City Reservoir 43 d4 74 52 1897-57 61 2.52 Little Falls Mill Street 43 02 74 52 1939-57 19 2.41 Little Valley 42 15 78 48 1942-57 16 2,93 Locke 4 W 42 40 76 28 1942-57 16 2.54
Lockport 2 NE 43 ll 78 39 1891-57* 64 2.17 Lowville 43 48 75 29 1890-57* 67 2,43 Lyons Falls 43 a1 75 22 1939-57 19 2,88 Macedon 43 04 77 18 1942-57 16 2.15 Manorkill 42 2;3 74 18 1948-57 10 3.54
Marcellus SCS 42 59 76 23 1940-57 18 1,10 1.71 2.39 Mary Smith 42 03 74 49 1948-57 10 3.25 Massena CAA AP 44 56 74 50 1949-57 9 2.28 Massena 1 NE 44 56 74 53 1940-57 18 2.40 Mays Point Lock 25 43 00 76 46 1942-57 16 2.18
McKeever 43 37 75 06 1939-53* 14 3.06 Mechanicville 42 53 73 41 19ll-57 47 2,59 Middle Branch Reservoir 41 23 73 39 1948-57 10 3.85 Middleburg 4 SW 42 34 74 19 1943-57 15 2.56 Middletown 2 NW 41 27 74 27 1952-57 6 3,95
Millbrook 41 51 73 37 1942-57 16 2.88 Millerton 41 57 73 31 1940-57 18 l,ll 1.96 2,99 Mohonk Lake 41 46 74 09 1897-56* 57 3,29 Mongaup Valley 41 40 74 47 1948-57* 9 3,07 Morrisville A. & T. Institute 42 54 75 39 1912-57* 45 2.47
Mount Lebanon 42 28 73 28 1944-57 14 2.80 Mount McGregor 43 12 73 45 1939-45 7 2.62 Mount Morris 2 W 42 44 77 54 1949-57 9 2.06 Mount Morris 2 W 42 44 7'/ 54 1943-50 8 .98 1.68 2. 21 Neversink 41 50 74 39 1948-57 10 3.28
Neversink 41 50 74 39 1941-49 9 1.27 1.78 2.72 New Albion 42 17 78 53 1952-57 6 2.68 Newark 43 03 77 06 1942-57 16 2.10 New Berlin 42 37 75 20 1939-57 19 2,39 Newcomb 43 59 74 14 1940-57 18 2.75
New Kingston 42 12 74 41 1948-57 10 2.88 New London Lock 22 43 12 75 37 1942-57 16 2.59 Norfolk 44 48 75 00 1948-57 10 2.30 North Lake 43 32 74 57 1939-47* 8 2.99 Norwich 1 WNW 42 32 75 32 1907-57* 49 2.55
Oak Hill 42 24 74 09 1948-57 10 3,23 Oakland Valley 1 s 41 30 74 39 1938-57 20 1.18 1.99 3.07 Ogdensburg Hospital 3 NE 44 44 75 27 1895-57 63 2.14 Old Forge 2 SW 43 42 75 00 1948-57 10 2.44 Olean 42 05 78 27 1914-57* 37 2.40
Oneonta 42 27 75 04 1895-57* 61 2.71 Oneonta 3 SE 42 27 75 00 1948-57* 9 2.23 Orient 2 E 41 09 72 16 1942-57 16 3,26 Ossining Sing Sing 41 09 73 52 1941-57 17 3.84 Oswego Teachers College 43 27 76 32 1953-57 5 2.02
Oswego WB City 43 27 76 31 1907-52 46 ,93 1.45 2.ll Otego 42 28 75 12 1940-49 10 1,06 1. 92 2.41 Ovid 42 40 76 50 1942-57 16 2.48 Parishville 1 WNW 44 38 74 50 1948-57 10 2.23 Parkston 41 54 74 49 1948-57 10 3.46
Paul Smiths 44 26 74 15 1949-57 9 2.23 Peekarnoose 41 56 74 23 1948-57 10 5.62 Penn Yan 42 39 77 04 1939-57 19 2,50 Peru 3 SW 44 34 73 34 1939-57 19 2.23 Phoenicia 42 05 74 19 1948-57 10 4.96
Piseco 43 27 74 31 1949-57 9 3,10 Plattsburgh 44 42 73 28 1946-57 12 2,23 Pleasantville 41 08 73 46 1948-57 10 3.58 Plymouth 2 SSE 42 36 75 35 1940-57 18 1.04 1.81 2.48 Port Henry 44 03 "73 27 1948-57 10 2,63
Port Jervis 41 23 74 41 1897-56 60 3,26 Poughkeepsie 41 41 73 56 1939-57 19 2.95
*Breaks in Record
24

Table 2-2, cont.
Period Length 2-Year 1-Hour 2-Year ·6-Hour 2-Year 24-Hour STATION Lat. Long. of of Record Rainfall Rainfall Precipitation
Record (years) (inches) (inches) (inches)
NEW YORK (continued)
Poughkeepsie CAA AP 41 38 73 53 1949-57 9 2.94 Poughkeepsie 1 N 41 43 73 56 1941-57 17 1.16 1. 98 2.80 Prattsburg 2 NW 42 32 77 18 1948-57 10 2.74 Prattsville 42 19 74 26 1948-57 10 3.26 Prattsville 42 19 74 26 1942-57 16 1.02 1. 90 2.82
Preston Hollow 42 26 74 12 1948-57 10 2.90 Pulaski 43 34 76 08 1948-57* 7 2.98 Raquette Lake 43 49 74 40 1939-51 13 2.56 Relay 42 19 74 38 1948-57 10 3.12 Richford 42 21 76 12 1940-53 14 .96 1.64 2.35
Rifton 1 N 41 51 74 03 1939-57 19 3.14 Rochester WB AP 43 07 77 40 1896-57* 57 1-.03 1. 58 2.13 Rockdale 42 23 75 24 1943-57 15 2.50 Rome Griffiss Field 43 14 75 25 1948-57 10 2,86 Roxbury 42 17 74 34 1939-57 19 2.57
Sabattis 3 NE 44 07 74 40 1939-57 19 2.20 Salamanca 2 NE 42 10 78 41 1938-57 20 1.08 1.78 2.60 Salem 43 10 73 20 1943-57 15 2.58 Salisbury 43 09 74 51 1939-57 19 2.66 Saranac Lake 44 19 74 07 1948-57 10 2.42
Saratoga Springs 4NW 43 06 73 50 1942-51 10 2.69 Schaghticoke 1 W 42 54 73 36 1948-57 10 2.93 Schenectady 42 50 73 55 1951-57 7 2.78 Schenectady City 42 50 73 55 1943-50 8 1.27 1.75 2.53 Schroon Lake 43 51 73 46 1949-57 9 2.59
Schroon River 43 57 73 44 1948-57* 9 2.65 Schuylerville 43 06 73 35 1942-57 16 1.06 1,97 2.93 Schuylerville Lock 5 43 07 73 35 1948-57 10 3.54 Scio 42 10 77 59 1939-57 19 2.16 Scotia 42 49 73 59 1942-57 16 2.38
Seager 42 03 74 33 1948-57 10 3, 71 Sharon Springs 1 N 42 48 74 36 1939-53 15 2.50 Sharon Springs 2 sw 42 47 74 40 1939-51 13 2.44 Sherburne 42 40 75 30 1939-57 19 2. 39 Sherman 42 10 79 36 1952-57 6 2.83
Shokan Brown Station 41 57 74 13 1948-57 10 4.04 Shrub Oak 41 19 73 49 1950-57 8 4.58 Skaneateles 42 57 7.6 26 1895-57* 61 2.29 Slide Mountain 42 01 74 25 1948-57 10 5.51 Smiths Bas in 43 22 73 30 1942-57 16 2.45
Smithville Flats 42 24 75 48 1940-57 18 1.01 1.64 2.31 Sodus 2 SSW 43 13 77 04 1939-57 19 2. 22 South Edwards 1 E 44 16 75 12 1939-57 19 2.44 South New Berlin 42 32 75 26 1935-50* 15 1.05 1.66 2.37 South Wales Emery Park 42 43 78 36 1939-57 19 2.·30
Sparkill 41 02 73 56 1940-50 11 1.31 2.55 3.18 Speculator 43 30 74 22 1949-57 9 2.39 Spencer 42 13 76 29 1945-57 13 3.11 Spencertown 42 20 73 33 1943-57 15 3.02 Spier Falls 43 14 73 45 1902-57 56 2.88
Spring Valley 41 07 74 03 1940-50 ll 1. 38 2.75 3.64 Sprite Creek 43 08 74 40 1948-57 10 2.36 Stafford 42 59 78 05 1939-57 19 2.16 Stamford 42 24 74 37 1948-57 10 2.94 Stewart Field 41 30 74 06 1948-57 10 3.29
Stewarts Landing 43 08 74 36 1948-57 10 2.75 Stillwater Reservoir "43 53 75 02 1939-57 19 2.54 Stillwater Reservoir 43 53 75 02 1940-57 18 1.01 1.68 2.59 Suffern Water Works 41 07 74 09 1941-571' 15 3 • .')4 Sundown 41 53 74 28 1948-57 10 4,08
Syracuse WB AP 43 07 76 07 1903-57 55 1.15 1.76 2.46 Tannersville 42 11 74 10 1948-57 10 5.16 Terry Clove 42 08 74 54 19-:l~-57 10 2.78 Theresa 44 13 75 47 1948-57 10 2.54 Thurston 42 12 77 20 1940-50* 10 .91 1.66 2.42
Ticonderoga 43 51 73 26 1941-57* 16 2.45 Ticonderoga WB AP 43 53 73 24 1940-48 9 ,96 1.92 2.61 Titicus 41 20 73 39 1948-57 10 3.89 Trenton Falls 43 16 75 09 1939-57 19 3.26 Tribes Hill 42 57 74 17 1910-57 48 2.38
Tribes Hill 42 57 74 17 1942-57 16 .98 1.67 2.44 Troupsburg 4 NE 42 04 77 29 1948-57 10 2.75 Truxton 42 43 76 02 1948-57* 8 2.27 Truxton 4 N 42 46 76 02 1933-49 17 1. 20 1. 93 2.61 Truxton 5 N 42 47 76 02 1941-50 10 1.10 1.56 2.32
Tupper Lake Sunmount 44 14 74 27 1939-57 19 2.14 Unadilla 42 19 75 19 1943-57* ll 2.50 Utica CAA AP 43 09 75 23 1951-57 7 2.65 Utica Harbor Point 43 07 75 14 1939-48 10 2.81 Utica Southern Reservoir 43 05 75 14 1889-57* 40 2.41
Utica Southern Reservoir 43 05 75 14 1941-57 17 1.12 1. 75 2,63 Valhalla 2 E 41 04 73 46 1948-57 10 3.82
*Breaks in Record
25
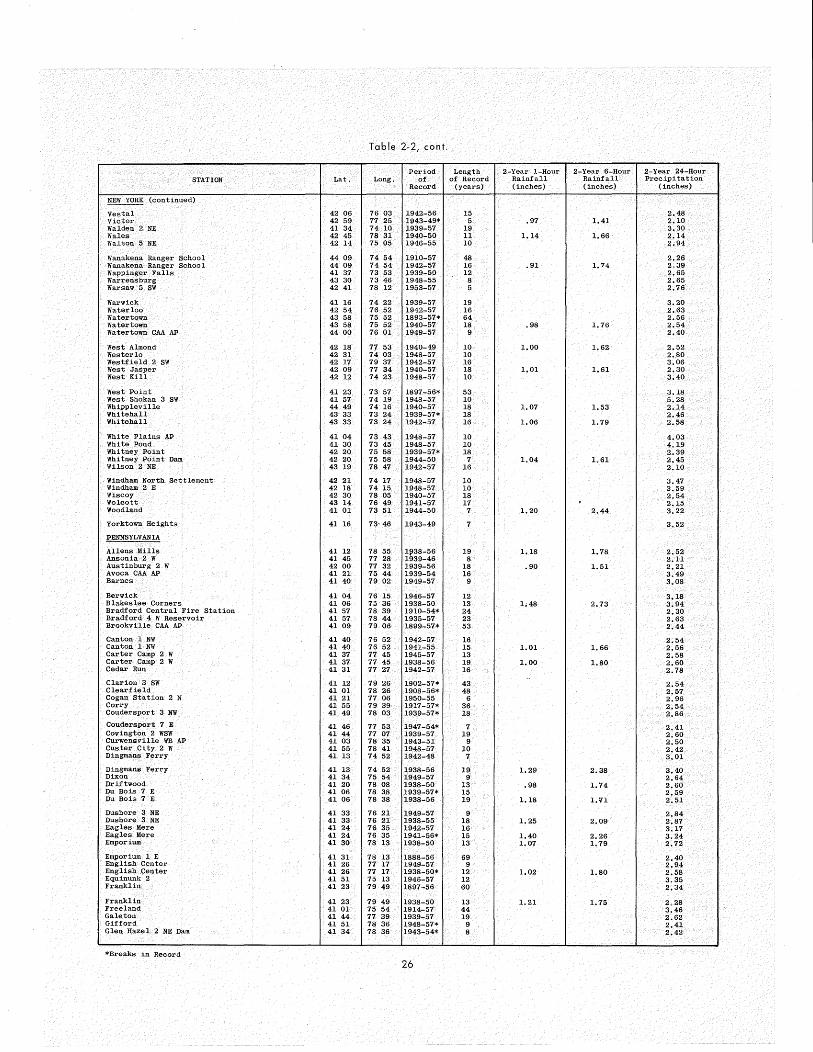
Table 2-2, cont.
Period Length 2-Year 1-Hour 2-Year ·6-Hour 2-Year 24-Hour STATION Lat. Long. of of Record Rainfall Rainfall Precipitation
Record (years) (inches) (inches) (inches)
NEW YORK (continued)
Vestal 42 06 76 03 1942-56 15 2.48 Victor 42 59 77 25 1943-49* 5 .97 1.41 2.10 Walden 2 NE 41 34 74 10 1939-57 19 3.30 Wales 42 45 78 31 1940-50 ll 1.14 1.66 2.14 Walton 5 NE 42 14 75 05 1946-55 10 2.94
Wanakena Ranger School 44 09 74 54 1910-57 48 2.26 Wanakena Ranger School 44 09 74 54 1942-57 16 .91 1.74 2.39 Wappinger Falls 41 37 73 53 1939-50 12 2.65 Warrensburg 43 30 73 46 1948-55 8 2,65 Warsaw 5 SW 42 41 78 12 1953-57 5 2.76
Warwick 41 16 74 22 1939-57 19 3.20 Waterloo 42 54 76 52 1942-57 16 2.63 Watertown 43 58 75 52 1893-57* 64 2.56 Watertown 43 58 75 52 1940-57 18 .98 1.76 2.54 Watertown CAA AP 44 00 76 01 1949-57 9 2.40
West Almond 42 18 77 53 1940-49 10 1,00 1. 62 2.52 Westerlo 42 31 74 03 1948-57 10 2.80 Westfield 2 SW 42 17 79 37 1942-57 16 3.06 West Jasper 42 09 77 34 1940-57 18 1.01 1,61 2.30 West Kill 42 12 74 23 1948-57 10 3,40
West Point 41 23 . 73 57 1897-56* 53 3.18 West Shokan 3 sw 41 57 74 19 1948-57 10 5.28 Whippleville 44 49 74 16 1940-57 18 1.07 1.53 2.14 Whitehall 43 33 73 24 1939-57* 18 2.46 Whitehall 43 33 73 24 1942-57 16 1.06 1.79 2.58
White Plains AP 41 04 73 43 1948-57 10 4.03 White Pond 41 30 73 45 1948-57 10 4.19 Whitney Point 42 20 75 58 1939-57* 18 2,39 Whitney Point Dam 42 20 75 58 1944-50 7 1.04 1.61 2.45 Wilson 2 NE 43 19 78 47 1942-57 16 2.10
. Windham North Settlement 42 21 74 17 1948-57 10 3.47 Windham 2 E 42 18 74 15 1948-57 10 3,59 Wiscoy 42 30 78 05 1940-57 18 2,54 Wolcott 43 14 76 49 1941-57 17 . 2.15 Woodland 41 01 73 51 1944-50 7 1. 20 2.44 3.22
Yorktown Heights 41 16 73· 46 1943-49 7 3,52
PENNSYLVANIA
Allens Mills 41 12 78 55 li'J38-56 19 1.18 1.78 2.52 Ansonia 2 W 41 45 77 28 1939-46 8 2.ll Austinburg 2 W 42 00 77 32 1939-56 18 .90 1.51 2,21 Avoca CAA AP 41 21 75 44 1939-54 16 3,49 Barnes 41 40 79 .02 1949-57 9 3,08
Berwick 41 04 76 15 1946-57 12 3.18 Blakeslee Corners 41 06 75 36 1938-50 13 1;48 2.73 3,94 Bradford Central Fire Station 41 57 78 39 1910-54* 24 2.30 Bradford 4 W Reservoir 41 57 78 44 1935-57 23 2.63 Brookville CAA AP 41 09 79 06 1899-57* 53 2.44
Canton 1 NW 41 40 76 52 1942-57 16 2,54 Canton·l NW 41 40 76 52 1941-55 15 1.01 1.66 2.56 Carter Camp 2 W 41 37 77 45 1945-57 13 2,58 Carter Camp 2 W 41 37 77 45 1938-56 19 1.00 1.80 2.60 Cedar Run 41 31 77 27 1942-57 16 2. 78
Clarion 3 SW 41 12 79 26 1902-57* 43 2.54 Clearfield 41 01 78 26 1908-56* 48 2.57 Cogan Station 2 N 41 21 77 06 1950-55 6 2.96 Corry 41 55 79 39 1917-57* 36 2.54 Coudersport 3 NW 41 49 78 03 1939-57* 18 2.86
Coudersport 7 E 41 46 77 53 1947-54* 7 2.41 Covington 2 WSW 41 44 77 07 1939-57 19 2,60 Curwensville WB AP 41 03 78 35 1943-51 9 2,50 Custer City 2 W 41 55 78 41 1948-57 10 2.42 Dingmans Ferry 41 13 74 52 1942-48 7 3,01
Dingmans Ferry 41 13 74 52 1938-56 19 1.29 2.38 3,40 Dixon 41 34 75 54 1949-57 9 2,64 Driftwood 41 20 78 OS 1938-50 13 .98 1.74 2.60 DuBois 7 E 41 06 78 38 1939-57* 15 2.59 Iiu Bois 7 E 41 06 78 38 1938-56 19 1.18 1.n 2,51
Dushore 3 NE 41 33 76 21 1949-57 9 2.84 Dushore 3 NE 41 33 76 21 1938-55 18 1. 25 2.09 2.87 Eagles Mere 41 24 76 35 1942-57 16 3.17 Eagles Mere 41 24 76 35 1941-56* 15 1.40 2.26 3.24 Emporium 41 30 78 13 1938-50 13 1,07 1,79 2.72
Emporium 1 E 41 31 78 13 1888-56 69 2,40 English Center 41 26 77 17 1949-57 9 2.94 English .Center 41 26 77 17 1938-50* 12 1,02 1.80 2,58 Equinunk 2 41 51 75 13 1946-57 12 3,35 Franklin 41 23 79 49 1897-56 60 2,34
Franklin 41 23 79 49 1938-50 13 1.21 1.75 2,28 Freeland 41 01 75 54 1914-57 44 3.46 Galeton 41 44 77 39 1939-57 19 2.62 Gifford 41 51 78 36 1948-57* 9 2.41 Glen Hazel 2 NE Dam 41 34 78 36 1943-54* 8 2.42
*Breaks in Record
26

Table 2-2, cont.
Period Length 2-Year 1-Hour 2-Year ·6-Hour 2-Year 24-Hour STATION Lat. Long. of of Record Rainfall Rainfall Precipitation
Record (years) (inches) (inches) (inches)
PENNSYLVANIA (continued)
Gouldsboro 41 15 75 27 1914-57* 43 3.36 Hawley 41 29 75 10 1939-57 19 3,60 Hawley 1 S Dam 41 28 75 ll 1948-57 10 4.09 Hawley 1 S Wallen Dam 41 28 75 ll 1930-50* 19 .92 1.65 2.60 Hollisterville 41 23 75 26 1939-57 19 3.52
Honesdale 4 NW 41 37 75 19 1948-57 10 3,23 Honesdale 6 N Tanners Falls 41 39 75 17 1940-49* 9 1.14 2.46 3,42 Hop Bottom 2 SE 41 43 75 43 1945-57 13 2.34 Jackson Sununi t 41 57 77 01 1940-50 ll 1.26 1.81 2.53 Kane 1 NNE 41 41 78 48 1932-57 26 2.58
Kane 1 NNE 41 41 78 48 1938-56 19 1. 20 1. 96 2.83 Karthaus 41 07 78 07 1942-57 16 2.45 Lafayette McKean Park 41 48 78 40 1948-55 8 2.28 Lakeville 1 NNE 41 27 75 16 1939-57* 18 3.84 Lawrenceville 2 S 41 59 77 07 1897-56 60 2.39
Le Roy 41 41 76 43 1948-57 10 2.64 Lewis Run 3 SE 41 50 78 39 1948-57 10 2.46 Lock Haven 41 08 77 27 1888-56* 66 2.61 Lock Haven 2 41 08 77 27 1937-50 14 1. 22 1. 98 2.80 Long Pond 2 W 41 03 75 30 1948-57 10 3.79
Marienville 41 28 79 07 1938-50 13 1.24. 1.81 2.33 Matamoras 41 22 74 42 1914-57 44 2.98 May burg 41 36 79 13 1949-57 9 3.08 Medix Run 41 17 78 24 1949-57 9 2.38 Medix Run 41 17 78 24 1942-56 15 1.25 1.92 2.76
Milan 4 WNW 41 56 76 35 1940-56 17 1.28 1.78 2.49 Milanville 41 40 75 04 1946-57 12 3.07 Millville 2 SW 41 06 76 34 1949-57 9 2.24 Millville 2 SW 41 06 76 34 1938-56 19 1.06 1.90 2.6"3 Monroeton 2 S 41 42 76 28 1942-48 7 3.10
Montrose 1 E 41 50 75 51 1904-56* 52 2.64 Montrose 3 E Highway Shed 41 50 75 49 1938-50 13 1.02 1. 91 2.84 Mountaintop AP 41 ll 75 53 1942-46 5 1.64 2.64 3.43 Mount Pocono 2 N AP 41 09 75 22 1915-56* 40 3.80 Mount Pocono 2 N AP 41 08 75 22 1941-50* 9 1. 30 2.57 4.08
Orwell 3 N 41 55 76 16 1943-57 15 2.33 Parker 41 05 79 41 1893-56 64 2. 55 Parkers Landing 41 06 79 41 1939-51 13 2.47 Parkers Landing 1 E 41 06 79 41 1938-50 13 1. 22 1.65 2.32 Paupack 2 WNW 41 24 75 14 1939-57* 14 4.19
Pecks Pond 41 17 75 06 1946-57 12 4;27 Pikes Creek 41 18 76 08 1951-57 7 2.95 Pikes Creek 41 18 76 08 1938-50 13 1. 25 2.05 2.91 Pimple Hill 41 02 75 30 1950-57 8 4.25 Pleasant Mount 1 w 41 44 75 27 1948-57 10 2,63
Pleasant Mount 1 w 41 44 75 27 1938-56 19 1.17 2.01 3.07 Port Allegany 41 49 78 16 1943-51 9 2.34 Raymond 41 52 77 52 1938-50 13 1.18 2.03 2.86 Renovo 41 20 77 46 1896-56* 59 2.54 Renovo 6 S State Camp 41 14 77 46 1938-50 13 1.03 1.67 2.86
Retreat 1 SW 41 12 76 06 1939-53* 9 2.90 Rew 41 54 78 32 1948-57 10 2.30 Ridgway 41 26 78 44 1938-50 13 1.12 1.74 2.62 Ridgway 3 W 41 25 78 47 1893-56* 49 2.42 Rush 41 47 76 03 1943-57 15 2.45
Rushville 41 47 76 07 1949-57 9 2.22 Scandia 2 E 41 55 79 01 1942--56 15 1.33 2.25 2.92 Scranton WB AP 41 20 75 44 1901-57 57 1. 21 2.01 2,83 Sheffield 6 W Cherry Grove 41 41 79 09 1938-50 13 1.27 1.92 2.72 Smethport Highway Shed 41 48 78 27 1938-56 19 1.07 1. 92 2.70
Stump Creek 41 01 78 50 1948-57 10 2. 58 Susquehanna 41 57 75 36 1939-57* 18 2.74 Tamarack 2 S Fire Tower 41 24 77 51 1942-57* 15 2.42 Tionesta 2 SE Dam 41 29 79 26 1942-57 16 2,69 Tionesta 2 SE Dam 41 29 79 26 1941-56 16 1.16 1.89 2.64
Titusville 41 38 79 40 1938-56 19 1. 35 1.96 2.70 Titusville Water Works 41 38 79 42 1944-57 14 2.59 Towanda 41 46 76 26 1895-56 62 2.56 Towanda 41 46 76 26 1937-50 14 ,95 1.83 2.68 Tunkhannoclt 1 SAP 41 32 75 57 1942-48 7 1.30 1. 71 2.64
Union City 41 54 79 50 1939-57 19 2.65 Union City 41 54 79 50 1938-56 19 1. 22 1.94 2.54 Warren 41 51 79 08 1893-56 64 2.56 Wellsboro 2 E 41 45 77 15 1940-50 ll 1.07 1.73 2.46 Wellsboro 3 s 41 43 77 16 1888-56* 67 2.70
Wilkes-Barre 41 15 75 52 1890-56* 66 2.79 Willi"'.msport 41 15 77 01 1895-49 55 2.95 Williamsport WB AP 41 15 76 55 1944-57 14 3.00 Williamsport WB AP 41 15 76 55 1938-56 19 1. 30 2.09 2.96 Williamsport 4 SE 41 13 76 57 1942-48 7 2.89
Youngsville 41 51 79 19 1938-50 13 1. 20 1. 71 2. 59
*Breaks in Record
27

Table 2-2, cont.
Period Length 2-Year !-Hour 2-Year ·6-Hour 2--Year 24-Hour STATION Lat. Long. of of Record Rainfall Rainfall Precipitation
Record (years) (inches) (inches) (inches)
RHODE ISLAND
Austin 41 36 7l 39 1948-56 9 3.64 Block Island WB AP 41 10 7l 35 1951-57 7 1.45 3. 27 4.08 Block Island WB City 41 10 71 36 1903-48* 44 1.14 2.24 2.97 Fort Adams 41 28 71 20 1940-47 8 1.27 2.23 3.01 Greenville 41 53 71 34 1947-57 11 3,59
Kingston 41 29 71 32 1896-57 62 3.55 Newport Water Works 41 30 71 18 1950-57 8 1.12 2.04 3,01 Providence WB AP 41 44 71 26 1905-57 53 1.17 2.19 3.04 Woonsocket 41 59 71 29 1941-57* 15 1.05 2. 32 3,05
VERMONT
Barre 44 14 72 33 1948-57 10 2.11 Bellows Falls 43 08 72 27 1942-57 16 2.76 Bennington 2 NW 42 54 73 13 1941-57* 14 2,89 Bethel 43 50 72 38 19-4.3-55 8 2.32 Bloomfield 44 16 71 36 1907-57 51 2.48
Bloomfield 44 46 7l 36 1940-57 18 1.08 1.83 2,43 Burlington WB AP 44 28 73 09 1906w57* 51 1.00 1.37 2.30 Canaan 45 00 71 32 1948-57 10 2,00 Cavendish 43 23 72 35 1903-57 55 2.82 Chelsea 43 59 72 27 1896-57 62 2.47
Chittenden 43 41 72 5 .. 1948-57 10 2.52 Corinth 44 02 72 17 1940-57 18 1.04 1.73 2.29 Cornwall 43 57 73 13 1896-57* 59 2.25 Dorset 1 S 43 14 73 06 1942-57 16 2.96 East Barnet 44 20 72 02 1942-57 16 2,47
Enosburg Falls 44 52 72 45 1896-57* 58 2.33 Essex Junction 44 30 73 07 1948-57 10. 2.51 Gilman 44 25 71 43 1942-57 16 2.28 Grafton 43 11 72 37 1940-57 18 .99 1.81 2.64 Highgate Falls 44 56 73 03 1941-57 17 1.16 1.95 2.36
Lemington 44 54 7l 31 1944-57* 13 2.34 Manchester Center 43 11 73 02 1942-57* 15 1.00 2.00 2,83 Marshfield 44 25 72 16 1948-57 10 2.14 Mays Mill 42 45 72 45 1942-57 16 3.17 Mcindoe Falls 44 15 72 03 1944-57 14
I 2.69
Middlesex 44 18 72 40 1948-57 10 2.46 Morrisville 44 34 72 36 1942-57 16 .95 1.87 2.39 Newport 44 56 72 12 1939-57 19 2.42 Newport 44 56 72 12 1941-57 17 l. 01 1.68 2.33 Northfield Norwich University 44 08 72 40 1896-57 62 2.41
Northfield Norwich University 44 08 72 40 1944-57 14 .89 1.60 2.44 Northfield WB City 44 08 72 40 1899-43* 43 1.00 1.61 2.42 Peru 43 14 72 54 1948-57 10 2.89 Plymouth Union 43 32 72 44 11948-57* 6 3.07 Randolph Center 43 57 72 36 !1948-57* 7 2.51
Reading Hill 43 31 72 34
1'""-" 10 3.00
Readsboro 1 SSE 42 45 73 02 1942-57 16 3.20 Rochester 43 52 72 48 1942-57 16 2.82 Rutland 43 37 72 58 1939-57 19 2.93 St. Albans Bay 44 48 73 10 1940-57 1~ 2.42
st. Johnsbury 44 25 72 00 1896-57 62 2.34 St. Johnsbury 44 25 72 00 1940-57 18 .89 1.76 2.37 Salisbury 43 54 73 06 1948-57 10 2.26 Searsburg Mountain 42 50 72 57 1942-57 16 3,50 Searsburg Station 42 52 72 55 1942-57 16 3.37
Searsburg Station 42 52 72 55 1942-57 16 1.02 2.14 3,41 Somerset 42 58 72 57 1912-57 46 3.30 South Londonderry 43 11 72 49 1948-57* 8 3.02 Spr ingf ie ld 43 16 72 27 11948-55* 7 2,88 Stockbridge 43 47 72 45 1940-57* 17 .87 1.65 2.60
Townshend 43 02 72 40 11948-56 9 2.95 Townshend 43 02 72 40 1941-56* 11 .78 l. 88 2.84 Tyson 43 28 72 42 1940-57 18 1.11 1,97 2.79 Union Village Dam 43 48 72 16 1951-57 7 1.27 2.08 2.91 Vernon 42 46 72 31 11896-57*. 44
li 2,90
i i ! Wardsboro 43 03
! 72 47 1948-57 I 10 3.53
Waterbury 3 NNW 44 22 72 46 il942-57 16 11 2.56 West Burke 44 38 71 58 11939-57 19 I! 2.39 West Danville 44 24 72 09 1948-55 8 I: I
2,62 West Hartford 43 43 72 25 !1942-57 I 16 2.63
j I! Weston 2 S 43 17 72 48 1948-55* 7
11 3.17
West Topsham 44 08 72 18 1948-56* 7 2.59 White River Junction 1 N 43 39 72 19 11942-57 16 2,50 Whitingham 3 W 42 47 72 55 1941-57 17 3.53 Wilder 43 41 72 18 1942-57 16
I 2.38
Woodstock 3. ENE 43 38 172 28 !1896-57 62 I 2.77
I !
I *Breaks in Record
28

Table 2- 3. Station Data 100-Year 1-, 6-, and 24-Hour
Period Length 100-Year 1-Hour 100-Year 6-Hour 100-Year 24-Hour STATION Lat. Long. of of Record Rainfall Rainfall Precipitation
Record (years) (inches) (inches) (inches)
CONNECTICUT
Bloomfield 41 50 72 44 1941-57* 16 3.52 6.72 9.62 Bridgeport 41 12 73 12 1897-51* 47, 7.20 Candlewood Lake 41 29 73 28 ~- 1941-57 17 2.52 5.00 7.77 Canton 41 50 72 50 1896-22 27 9.02 Colchester 41 34 72 17 1896-57* 57 6.07
Cream Hill 41 52 73 20 1897:...57 61 6.18 Hartford 41 46 72 42 1941-57 17 2.47 6.00 8.97 Hartford WB AP 41 56 72 41 1905-57 53 2.67 4.57 8.54 Jewett City 41 38 71 54 1942-57 16 2.74 5.17 5. 93 Moodus Reservoir 41 30 72 26 1940-57 18 2.08 4.97 6.50
New Hav~en WB AP 41 16 72 53 1905-57 53 2.60 4.73 7.17 Newington 41 42 72 44 1941-57 17 3.74 5.86 6.54 New London 41 21 72 06 1897-55* 57 6.25 Norfolk 2 SW 41 58 73 13 1941-57 17 2.74 6.82 12.90 Norwalk Gas Plant 41 07 73 25 1896-57* 55' 8.05
Putnam 41 54 71 54 1940-57 18 2. 51 5.66 6.52 Rockville 41 52 72 26 1942-57 16 2.45 7.09 9.86 Southington 41 35 72 51 1897-21 25 8.03 Storrs 41 48 72 15 1940-57 18 3.12 6.21 7.94 Waterbury 41 33 73 02 1896-53* 57 7.10
MAINE
Caribou WB AP 46 52 68 01 1941-57 17 2.15 5.43 6.94 Eastport WB City 44 54 66 59 1896-52* 55 1.89 3. 61 5.39 Farmington 44 40 70 09 1897-57* 60 5.58 Fort Kent 47 15 68 36 1941-57* 16 1. 81 2.65 4.01 Gardiner 44 13 69 47 1896-57 62 6,02
Grand Lake Stream 45 ll 67 48 1942-57 16 1.89 4.55 5. 95 Greenville 45 27 69 35 1907-57 51 6, 99 Greenville 45 27 69 35 1941-57 17 2.70 4.15 7,92 Houlton 1 NE 46 OS 67 50 1902-57* 55 4.18 Houlton 1 NE 46 OS 67 50 1942-57 16 1.94 4.68 6,69
Lewiston 44 06 70 14 1896-57 62 6,73 Madison 44 48 69 54 1905-57 53 5,03 Millinocket 45 39 68 42 1903-57 55 6.32 Millinocket 45 39 68 42 1941-57 17 3.02 4,68 6.15 North Bridgton 44 OS 70 43 1896-53* 56 6.84
Portland WB AP 43 39 70 19 1897-57* 60 2.08 4.78 6.14 Presque Isle 46 39 68 00 1910-57* 46 4.97 Rockland 1 W 44 06 69 OS 1941-57 17 2.67 6.59 7.97 Rumford 1 SSE 44 33 70 33 1900-57 58 6,49 Rumford 1 SSE 44 33 70 33 1941-57* 16 2.25 4.75 6,23
Skowhegan 44 46 69 43 1941-57 17 2.44 4.94 7.03 Southwest Harbor 3 SSE 44 14 68 18 1941-57 17 1.95 5,06 6,02 Swans Falls 44 02 70 59 1941-57 17 2.45 4,56 6,30 Winslow 44 33 69 38 1905-57* 52 6.48
MASSACHUSETTS
Amherst 42 24 72 32 1896-39 44 6,75 Amherst 42 24 72 32 1940-57 18 2.87 3.70 6.82 Birch Hill Dam 42 38 72 07 1940-57 18 2.42 4.92 6.22 Blue Hill 42 13 71 07 1896-57 62 7.66 Blue Hill 42 13 71 07 1940-57 18 2.39 6.62 10.83
Boston WB AP 42 22 71 02 1896-57* 61 2.29 4.75 7,03 Cambridge 42 23 71 07 1940-57* 16 2.81 7.12 10.34 Clinton 42 24 71 41 1906-57 52 6.63 Fall River 41 42 71 10 1897-57 61 6.85 Fitchburg 2 S 42 34 71 46 1896-57 62 7.14
Framingham 42 17 71 25 1896-57* 53 7.37 Haverhill 42 46 71 04 1909-57* 45 6. 31 Hyannis 3 NE 41 41 70 15 1896-57* 56 6.99 Hyannis 3 NE 41 41 70 15 1942-57 16 2.19 5.32 6.97 Knightville Dam 42 17 72 52 1940-57 18 2,66 4.97 9.73
Lowell 42 39 71 18 1898-57* 56 6.08 Nantucket WB AP 41 15 70 04 1897-57 58 2.30 4.41 5.71 New Bedford 41 39 70 55 1896-57* 55 6.42 New Bedford 41 39 70 55 1940-57 18 2.16 5,98 6.91 Plymouth 41 59 70 42 1905-57 53 6.77
Provincetown 3 N 42 04 70 13 1899-57* 51 8.01 Rockport 1 ESE 42 39 70 37 1902-57* 54 7.15 Rockport 1 ESE 42 39 70 37 1942-57 16 2.94 5.79 8.53 Springfield Armory 42 06 72 35 1900-57* 48 9,33 State Farm 41 57 70 57 1940-55 16 3.06 6,81 9.57
Taunton 41 54 71 04 1896-57* 44 6.95 Turners Falls 42 36 72 33 1903-57 55 5,87 Washington 2 42 22 73 09 1940-57 18 2.~03 4. 31 7.60 West Brimfield 42 10 72 16 1941-57* 15 2.17 6.85 13,32 Winchendon 42 42 72 03 1896-57* 46 7.34
Worcester 42 18 71 49 1896-57 62 7,33
*Breaks in Record
29

Table 2-3, cont.
Period Length 100-Year 1-Hour 100-Year 6-Hour 100-Year 24-Hour STATION Lat. Long. of of Record Rainfall Rainfall Precipitation
Record (years) (inches) (inches) (inches)
NEW HAMPSHIRE
Berlin 44 29 71 10 1898-57* 49 6.29 Bristol 43 36 71 43 1940-57 18 2.02 4.oi 5.38 Concord WB AP 43 12 71 30 1905-57* 48 2.50 4.26 5.93 Durham 43 08 70 56 1896-57 62 7.35 Durham 43 08 70 56 1941-57 17 2.03 4.79 5,70
Errol 44 47 71 08 1941-57 17 2.41 3,62 4·.63 Franklin lNW 43 27 71 40 1907-57 51 6.02 Hanover 43 42 72 17 1896-57 62 4.76 Hanover 43 42 72 17 1940-57 18 2.26 3.19 4,71 Hillsboro 2 w 43 07 71 57 1940-57 18 2.43 5.07 6.93
Keene 42 56 72 17 1896-57 62 4,65 Landaff 44 ll 71 54 1940-57 18 2.43 3.37 4.51 Lincoln 44 03 71 40 1940-57* 17 2.36 3.82 5.79 Mount Washington 44 16 71 18 1940-57 18 2.37 4.39 6,53 New Durham 43 26 71 10 1941-57 17 2.14 5.35 6.36
Pittsburg Reservoir 45 03 71 23 .1940-57 18 2.80 5.25 5.88 Plymouth 1 WNW 43 46 71 43 1896-57 62 5.17 Surry Mountain Dam 43 00 72 19 1941-57 17 1.77 3,51 5,07 Warren 1. SE 43 55 71 53 1941-57 17 2.88 6,79 7,64 Winchester 42 46 72 23 1940-57 18 2.46 4.30. i'i.02
NEW JERSEY
Charlotte burg 41 03 74 26 1897-56 60 6,97 Culvers Lake 41 10 74 47 1902-53* 48 5,93 Layton 3 NW 41 15 74 51 1900-56* 56 6,95 Newton 41 03 74 45 1897-56* 57 7.40 Sussex 3 N 41 14 74 35 1901-56* 51 6.53
Wanaque Raymond Dam 41 03 74 18 1942-57 16 4.72 6.89 8.20 Woodcliff Lake 41 01 74 03 1940-57 18 2.66 4.67 6.32
NEW YORK
Albany WB AP 42 45 73 48 1899-57 59 2.16 3,02 4.68 Alfred 42 15 77 47 1890-57* 56 5.64 Angelica 42 18 78 02 1889-57* 66 4.88 Bainbridge 42 18 75 29 19ll-57* 46 5.18 Bedford Hills 41 14 73 43 1_897-56* 59 6.84
Binghamton WB AP 42 13 75 59 1901-57* 56 2.57 3.51 4.98 Bolivar 42 03 78 ll 1938-57 20 2.47 3.86 6.62 Brockport 2 NW 43 15 77 58 1904-57* 48 3.88 Buffalo WB AP 42 56 78 44 1898-57*' 56 2.43 3,60 4.14 Canton 44 36 75 10 1890-57* 60 4.83
Canton WB City 44 35 75 10 1907-50* 41 2.57 3.82 4.70 Chazy 3 E 44 53 73 23 1904-57* 51 4,12 China 42 10 75 24 1935-50* 15 2.74 3,56 6,03 Conklingville Dam 1 43 19 73 56 1941-57 17 1. 97 3.12 5.59 Cooperstown 42 42 74 55 1890-57* 67 5.32
Cortland 42 36 76 ll 1892-57 66 6.73 Cutchogue 41 01 72 29 1899-56* 46 7.06 Dannemora 44 43 73 43 1906-57 52 3,90 Dunkirk 42 29 79 21 1941-57 17 2,36 4.21 5,19 Fredonia 42 26 79 22 1914-57 44 5,84
Geneva Experiment Station 42 53 77 00 1889-57* 49 4,92 Geneva Experiment Station 42 53 77 00 1940-57 18 2.80 3.27 4.33 Gloversville 43 03 74 21 1892-57 66 4.59 Haskin ville 42 25 77 34 1896-57* 61 3,94 Hemlock 42 47 77 37 1904-57 54 5.08
Highmarket 1 SE 43 35 75 30 !J.940-57 18 2.20 3.75 4.8.0 Hornell Almond Dam 42 21 77 42 940-57 18 2.02 3,09 4.26 Hudson 2 42 15 73 47 941-57* 15 3,52 4.55 5.76 Hunts Corners 42 26 76 07 940-57 18 2.62 3,35 5.13 Indian Lake 2 SW 43 45 74 17 900-57 58 5.00
Indian Lake 2 SW 43 45 74 17 942-57 16 2.06 4.31 5,79 Ithaca Cornell University 42 27 76 28 889-57 69 5.38 Ithaca WB City 42 27 76 29 9ll-42* 28 2. 91 4.79 7.85 Jamestown 42 06 79 15 938-57 20 2.37 4,60 5.33 Kingston 41 56 74 00 941-57 17 3.00 4.ll 6.44
Lake Placid Club 44 17 73 59 898-57* 50 4.27 Lake Placid Club 44 17 73 59 942-57 16 1.82 3.21 4.72 Little Falls City Reservoir 43 04 74 52 897-57 61 4.80 Lockport 2 NE 43 ll 78 39 891-57* 64 4.54 Lowville 43 48 75 29 890-57* 67 4.92
Marcellus SCS 42 59 76 23 940-57 18 2,86 3,70 4.00 Mechanicville 42 53 73 41 9ll-57 47 5.54 Millerton 41 57 73 31 940-57 18 2.65 4,24 8.89 Mohonk Lake 41 46 74 09 897-56* 57 6.64 Morrisville A. & T. Institute 42 54 75 39 912-57* 45 4,79
Norwich 1 WNW 42 32 75 32 907-57* 49 5.94 Oakland Valley 1 S 41 30 74 39 938-57 20 2.89 4.63 7.86 Ogdensburg Hospital 3 NE 44 44 75 27 895-57 63 4.07 Olean 42 05 78 27 914-57* 37 5,51 Oneonta 42 27 75 04 895-57* 61 6,14
*Breaks in Record
30

Table 2-3, cont.
Period Length 100-Year 1-Hour 100-Year 6-Hour 100-Year 24-Hour STATION Lat. Long. of of Record Rainfall Rainfall Precipitation
Record (years) (inches) (inches) (inches)
NEW YORK (continued)
Oswego WB City 43 27 76 31 1907-52 46 1.88 2.89 3,80 Plymouth 2 SSE 42 36 75 35 1940-57 18 2,41 3,73 5.76 Port Jervis 41 23 74 41 1897-56 60 7.68 Poughkeepsie 1 N 41 43 73 56 1941-57 17 2.62 4.53 7.14 Prattsville 42 19 74 26 1942-57 16 2.27 3.50 5, 91
Rochester WB AP 43 07 77 40 1896-57* 57 2.52 3.62 4.23 Salamanca 2 NE 42 10 78 41 1938-57 20 2. 61 3.72 5.10 Schuylerville 43 06 73 35 1942-57 16 2.83 5.81 7.18 Skaneateles 42 57 76 26 1895-57* 61 4.95 Smithville Flats 42 24 75 48 1940-57 18 1.67 2.91 4.45
South New Berlin 42 32 75 26 1935-50* 15 2.38 4.49 7.02 Spier Falls 43 14 73 45 1902-57 56 6.88 Stillwater Reservoir 43 53 75 02 1940-57 18 2.07 3.14 5,09 Syracuse WB AP 43 07 76 07 1903-57 55 2.73 4.25 4,94 Tribes Hill 42 57 74 17 1910-57 48 4.40
Tribes Hill 42 57 74 17 1942-57 16 1.79 3,26 4.43 Truxton 4 N 42 46 76 02 1933-49 17 2.50 4.45 5.32 Utica Southern Reservoir 43 05 75 14 1889-57* 40 5.18 Utica Southern Reservoir 43 05 75 14 1941-57 17 2.61 3,05 4.95 Wanakena Ranger School 44 09 74 54 1910-57 48 4.32
Wanakena Ranger School 44 09 74 54 1942-57 16 1.94 3,06 3,63 Watertown 43 58 75 52 1893-57* 64 5.39 Watertown 43 58 75 52 1940-57 18 2.64 6.01 6.74 West Jasper 42 09 77 34 1940-57 18 2.32 3,27 5,30 West Point 41 23 73 57 1897-56* 53 6,64
Whippleville 44 49 74 16 1940-57 18 2.80 2,81 3.77 Whitehall 43 33 73 24 1942-57 16 2,44 4.16 5.52
PENNSYLVANIA
Allens Mills 41 12 78 55 1938-56 19 2.74 3.59 5.21 Austinburg 2 W 42 00 77 32 1939-56 18 1.72 2.84 5.00 Brookville CAA AP 41 09 79 06 1899-57* 53 4.07 Canton 1 NW 41 40 76 52 1941-55 15 2.06 3.07 4.39 Carter Camp 2 W 41 37 77 45 1938-56 19 2.32 4.33 5. 99
Clarion 3 SW 41 12 79 26 1902-57* 43 5.00 Clearfield 41 01 78 26 1908-56* 48 4,83 Corry 41 55 79 39 1917-57* 36 5,05 Dingmans Ferry 41 13 74 52 1938-56 19 2.82 5.33 7.43 Du Bois 7 E 41 06 78 38 1938-56 19 2.18 3,40 4,64
Dushore 3 NE 41 33 76 21 1938-55 18 2,70 5.00 6, 93 Eagles Mere 41 24 76 35 1941-56* 15 3,50 6,69 7,55 Emporium 1 E 41 31 78 13 1888-56 69 4.79 Franklin 41 23 79 49 1897-56 60 4,40 Freeland 41 01 75 54 1914-57 44 8.40
Gouldsboro 41 15 75 27 1914-57* 43 9.33 Hawley 1 S Wallen Dam 41 28 75 ll 1930-50* 19 2.03 3.53• 5.74 Kane 1 NNE 41 41 78 48 1932-57 26 5.54 Kane 1 NNE 41 41 78 48 1938-56 19 3,01 4.80 5.86 Lawrenceville 2 s 41 59 77 07 1897-56 60 5.01
Lock Haven 41 08 77 27 1888-56* 66 5.16 Matamoras 41 22 74 42 1914-57 44 7,13 Medix Run 41 17 78 24 1942-56 15 3,09 3,17 5,11 Milan 4 WNW 41 56 76 35 1940-56 17 2.74 3,91 4.95 Millville 2 SW 41 06 76 34 1938-56 19 2.68 5.06 6,18
Montrose 1 E 41 50 75 51 1904-56* 52 4.87 Mount Pocono 2 ·N AP 41 09 75 22 1915-56* 40 6.75 Parker 41 05 79 41 1893-56 64 5.17 Pleasant Mount 1 w 41 44 75 27 1938-56 19 2.45 4.46 6.37 Renovo 41 20 77 46 1896-56* 59 5.03
Ridgway 3 W 41 25 78 47 1893-56* 49 4.09 Scandia 2 E 41 55 79 01 1942-56 15 2.65 4.74 5,05 Scranton WB AP 41 20 75 44 1901-57 57 2.48 3,70 5. 51 Smethport Highway Shed 41 48 78 27 1938-56 19 2.04 4.89 7.35 Tionesta 2 SE Dam 41 29 79 26 1941-56 16 2.59 4.72 5.40
Titusville 41 38 79 40 1938-56 19 2.66 4.56 5.54 Towanda 41 46 76 26 1895-56 62 4,43 Union City 41 54 79 50 1938-56 19 2.74 3,48 4.58 Warren 41 51 79 08 1893-56 64 5,06 Wellsboro 3 S 41 43 77 16 1888-56* 67 6,76
Wilkes-Barre 41 15 75 52 1890-56* 66 5,75 Williamsport 41 15 77 01 1895-49 55 6,02 Williamsport WB AP 41 15 76 55 1938-56 19 2,51 4.59 6,06
RHODE ISLAND
Block Island WB City 41 10 71 36 1903-48* 44 2,31 4.28 5,43 Kingston 41 29 71 32 1896-57 62 7.62 Providence WB AP 41 44 71 26 1905-57 53 2,72 5.03 6,58 Woonsocket 41 59 71 29 1941-57 15 2.52 6.34 7.97
VERMONT
Bloomfield 44 46 71 36 1907-57 51 5,82
*Breaks ~n Record
31

Table 2-3, cont.
Period Length 100-Year 1-Hour 100-Year 6-Hour 100-Year 24-Hour STATION Lat. Long. of of Record Rainfall Rainfall Precipitation
Record (years) (inches) (inches) (inches)
VERMONT (continued)
Bloomfield 44 46 71 36 1940-57 18 2.44 3.77 4.44 Burlington WB AP 44 28 73 09 1906-57* 51 2.20 2.80 4.82 Cavendish 43 23 72 35 1903-57 55 5.33 Chelsea 43 59 72 27 1896-57 62 4.90 Corinth 44 02 72 17 1940-57 18 2.06 3.28 4.46
Cornwall 43 57 73 13 1896-57* 59 4.29 Enosburg Falls 44 52 72 45 1896-57* 58 4.41 Grafton 43 11 72 37 1940-57 18 1.63 3.16 4.90 Highgate Falls 44 56 73 03 1941-57 17 3.43 4.15 4.65 Manchester Center 43 11 73 02 1942-57* 15 2.37 4.78 5.81
Morrisville 44 34 72 36 1942-57 16 1,95 4.18 5.36 Newport 44 56 72 12 1941-57 17 2.05 3.54 4.96 Northfield Norwich University 44 08 72 40 1896-57 62 5.47 Northfield WB City 44 08 72 40 1899-43* 43 2.22 3.51 5.84 St. Johnsbury 44 25 72 00 1896-57 62 5,48
st. Johnsbury 44 25 72 00 1940-57 18 2.21 3.56 4,45 Searsburg Station 42 52 72 55 1942-57 16 2.10 3.99 6.09 Somerset 42 58 72 57 1912-57 46 8.32 Stockbridge 43 47 72 45 1940-57* 17 1.68 3.17 5.20 Tyson 43 28 72 42 1940-57 18 2,57 4.39 5,27
Vernon 42 46 72 31 1896-57* 44 5.47 Woodstock 3 ENE 43 38 72 28 1896-57 62 5,08
*Breaks in Record
32

CJ)
SEASONAL PROBABILITY OF INTENSE RAIN FALL
I- HOUR DURATION
100 o.o-o.o-o.o-o.o-o.o-o.2-0.3-0.2-0.2-0.I-o.o-o.o
50 o.o- o.o-o.o-o.o-o.1- o.3- o.a- o.s- 0.2- o.o-o.o -o.o
40 ~--4---~---4----~--4----+---1~--~--;----+---;~--+---~
3 0 1----+----+-----+----+-----+-----t--1
~ 25 LLI >z20 ~--4---~---4----~--~---+-1-_,----~\--;----+--_,----r---~
CJ)
LLI ::::> _I <( >
~ 0::: <( LLI >-u.. 0
a 0 0::: LLI CL
z 0::: ::::> ..... LLI 0:::
15
10
7
5
4
3 ~--4-.;__-+---1---+-----
0.4--0.1 J F M A M J J A s 0 N
0,3 D
Probability in percent of obtaining a rainfall in any month of a
parti:::ular year equal to or exceeding the yearly return period values
taken from the isopluvial maps and d.iagrams.
Figure 2-8
33

SEASONAL PROBABILITY OF INTENSE RAINFALL
6- HOUR DURATION too o.o-o.o-o.o-o.o-o.o-o.3-o.o-o.4-0.3-o.o-o.o-o.o
50 0.0-0.0-0.0--0.0-0.0-0.6-0.5-0.0-0.8-0.0-0.1-0.0
40 r--~--+-~r---+---r~_, __ +---r--+--r--;---+---
(f) 30 r--~--+-~r--+---r-_,--+---+a:: <{
w 25 >-
~ 20 1--+---+---+----lr--+-____.:-+--t+-----t--+-1-+---+---+---
(f) w 3 I 5 r--~---+----t---1--+---+-<l: > >_J
a:: <{ 10 w >-IJ... 0
Q 7 1----+----+---lf---+---t--1 0 a: w a.. z 5 a: ::::> 1- 4 1----+---+--1----t----1 w a:
3 1----t---t---+---lf----
2
N 0
Probability in percent of obtaining a rainfall in any month of a
particular year equal to or exceeding the yearly return period values
taken from the isopluvial maps and diagrams.
·Figure 2-9
34

SEASONAL PROBABILITY OF INTENSE PRECIPITATION
24- HOUR DURATION 100 o.o-o.o-o.o-o.o-o.o-o.2-o.o-o.3-0.3-o.I-O.I-o.o
50 0.0- 0.0 - 0.0- 0.0- 0.0 - 0.4- 0.1- 0.0 - 0.7- 0.4-0.4- 0.0
40
(/) 30 0:: <(
w 25 0.0-0.0-0.0-0.0-0.1 -0.0-0.7->-z -20
en w :::> ..J 15 <(
>
~ 0::: <(
10 w 0.1 - 0.0-0.1-0.1-0.4-0.7->-LL 0 1
a 7 0
0::: w a.. z 5 --0.0-0.1-0.3-0.0-0.5
~ 4 I'_ w 0:::
3 1------1----1---+----+---
2
Probability in percent of obtaining a precipitation in any month of o
particular year equal to or exceeding the yearly return period values
taken from the i sop I uvia I maps and diogra ms.
Figure 2-10
35 U,S, GOVERNMENT PRINTING OFFICE: 1959 0-503414