A CT-based radiomics nomogram for distinguishing between ...

Available online at www.sciencedirect.com
Magnetic Resonance Imaging 30 (2012) 1234–1248
Radiomics: the process and the challengesVirendra Kumar a, Yuhua Gu a, Satrajit Basu b, Anders Berglund c, Steven A. Eschrich c,
Matthew B. Schabath d, Kenneth Forster e, Hugo J.W.L. Aerts f, h, Andre Dekker f,David Fenstermacher c, Dmitry B. Goldgof b, Lawrence O. Hall b, Philippe Lambin f,
Yoganand Balagurunathan a, Robert A. Gatenby g, Robert J. Gillies a, g,⁎aDepartment of Cancer Imaging and Metabolism, H. Lee Moffitt Cancer Center and Research Institute, Tampa, FL, USA
bDepartment of Computer Science and Engineering, University of South Florida, Tampa, FL, USAcDepartment of Bioinformatics, H. Lee Moffitt Cancer Center and Research Institute, Tampa, FL, USA
dDepartment of Cancer Epidemiology, H. Lee Moffitt Cancer Center and Research Institute, Tampa, FL, USAeDepartment of Radiation Oncology, H. Lee Moffitt Cancer Center and Research Institute, Tampa, FL, USAfDepartment of Radiation Oncology (MAASTRO), GROW-School for Oncology and Developmental Biology,
Maastricht University Medical Center, Maastricht, the NetherlandsgDepartment of Radiology, H. Lee Moffitt Cancer Center and Research Institute, Tampa, FL, USA
hComputational Biology and Functional Genomics Laboratory, Department of Biostatistics and Computational Biology,Dana-Farber Cancer Institute, Harvard School of Public Health, Boston, MA, USA
Received 23 March 2012; revised 19 June 2012; accepted 21 June 2012
Abstract
“Radiomics” refers to the extraction and analysis of large amounts of advanced quantitative imaging features with high throughput frommedical images obtained with computed tomography, positron emission tomography or magnetic resonance imaging. Importantly, these dataare designed to be extracted from standard-of-care images, leading to a very large potential subject pool. Radiomics data are in a mineableform that can be used to build descriptive and predictive models relating image features to phenotypes or gene–protein signatures. The corehypothesis of radiomics is that these models, which can include biological or medical data, can provide valuable diagnostic, prognostic orpredictive information. The radiomics enterprise can be divided into distinct processes, each with its own challenges that need to beovercome: (a) image acquisition and reconstruction, (b) image segmentation and rendering, (c) feature extraction and feature qualification and(d) databases and data sharing for eventual (e) ad hoc informatics analyses. Each of these individual processes poses unique challenges. Forexample, optimum protocols for image acquisition and reconstruction have to be identified and harmonized. Also, segmentations have to berobust and involve minimal operator input. Features have to be generated that robustly reflect the complexity of the individual volumes, butcannot be overly complex or redundant. Furthermore, informatics databases that allow incorporation of image features and imageannotations, along with medical and genetic data, have to be generated. Finally, the statistical approaches to analyze these data have to beoptimized, as radiomics is not a mature field of study. Each of these processes will be discussed in turn, as well as some of their uniquechallenges and proposed approaches to solve them. The focus of this article will be on images of non-small-cell lung cancer.© 2012 Elsevier Inc. All rights reserved.
Keywords: Radiomics; Imaging; Image features; Tumor; Segmentation
1. Introduction
“Radiomics” involves the high-throughput extraction ofquantitative imaging features with the intent of creating
⁎ Corresponding author. Cancer Imaging and Metabolism, RadiologyH. Lee Moffitt Cancer Center and Research Institute, Tampa, FL 33612USA. Tel.: +1 813 745 8355; fax: +1 813 745 7265.
E-mail address: [email protected] (R.J. Gillies).
0730-725X/$ – see front matter © 2012 Elsevier Inc. All rights reserved.http://dx.doi.org/10.1016/j.mri.2012.06.010
,,
mineable databases from radiological images [1]. It isproposed that such profound analyses and mining of imagefeature data will reveal quantitative predictive or prognosticassociations between images and medical outcomes. Incancer, current radiological practice is generally qualitative,e.g., “a peripherally enhancing spiculated mass in the lowerleft lobe.” When quantitative, measurements are commonlylimited to dimensional measurements of tumor size via one-dimensional (Response Evaluation Criteria In Solid Tumors
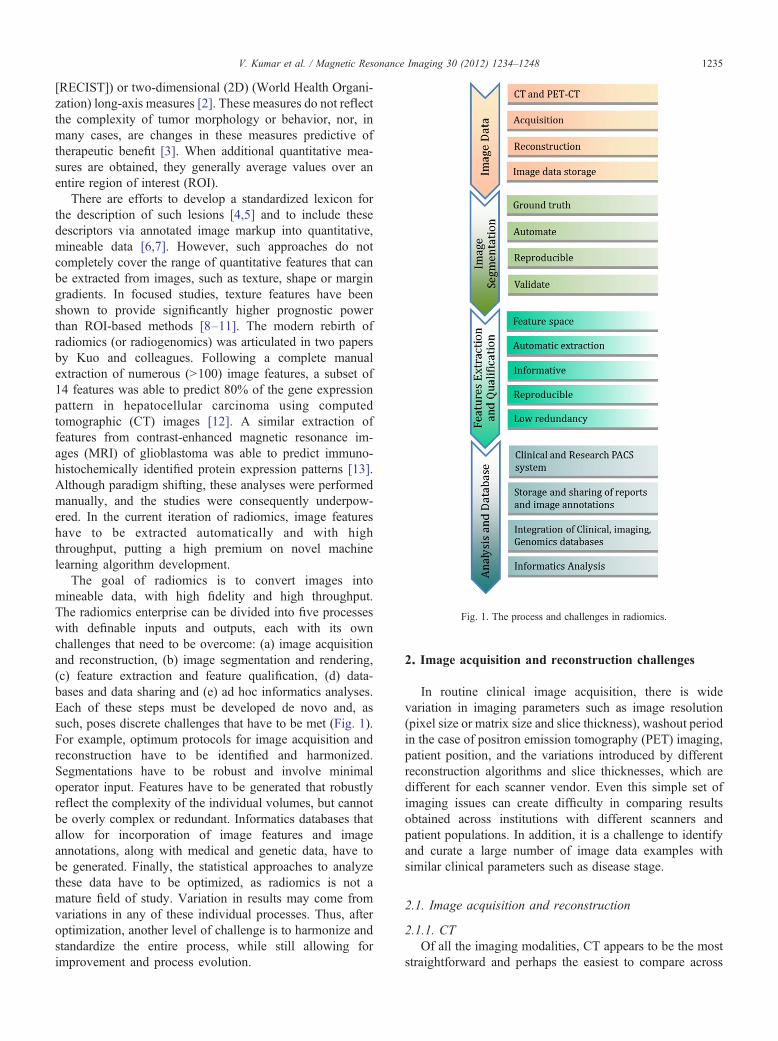
Fig. 1. The process and challenges in radiomics.
1235V. Kumar et al. / Magnetic Resonance Imaging 30 (2012) 1234–1248
[RECIST]) or two-dimensional (2D) (World Health Organi-zation) long-axis measures [2]. These measures do not reflectthe complexity of tumor morphology or behavior, nor, inmany cases, are changes in these measures predictive oftherapeutic benefit [3]. When additional quantitative mea-sures are obtained, they generally average values over anentire region of interest (ROI).
There are efforts to develop a standardized lexicon forthe description of such lesions [4,5] and to include thesedescriptors via annotated image markup into quantitative,mineable data [6,7]. However, such approaches do notcompletely cover the range of quantitative features that canbe extracted from images, such as texture, shape or margingradients. In focused studies, texture features have beenshown to provide significantly higher prognostic powerthan ROI-based methods [8–11]. The modern rebirth ofradiomics (or radiogenomics) was articulated in two papersby Kuo and colleagues. Following a complete manualextraction of numerous (N100) image features, a subset of14 features was able to predict 80% of the gene expressionpattern in hepatocellular carcinoma using computedtomographic (CT) images [12]. A similar extraction offeatures from contrast-enhanced magnetic resonance im-ages (MRI) of glioblastoma was able to predict immuno-histochemically identified protein expression patterns [13].Although paradigm shifting, these analyses were performedmanually, and the studies were consequently underpow-ered. In the current iteration of radiomics, image featureshave to be extracted automatically and with highthroughput, putting a high premium on novel machinelearning algorithm development.
The goal of radiomics is to convert images intomineable data, with high fidelity and high throughput.The radiomics enterprise can be divided into five processeswith definable inputs and outputs, each with its ownchallenges that need to be overcome: (a) image acquisitionand reconstruction, (b) image segmentation and rendering,(c) feature extraction and feature qualification, (d) data-bases and data sharing and (e) ad hoc informatics analyses.Each of these steps must be developed de novo and, assuch, poses discrete challenges that have to be met (Fig. 1).For example, optimum protocols for image acquisition andreconstruction have to be identified and harmonized.Segmentations have to be robust and involve minimaloperator input. Features have to be generated that robustlyreflect the complexity of the individual volumes, but cannotbe overly complex or redundant. Informatics databases thatallow for incorporation of image features and imageannotations, along with medical and genetic data, have tobe generated. Finally, the statistical approaches to analyzethese data have to be optimized, as radiomics is not amature field of study. Variation in results may come fromvariations in any of these individual processes. Thus, afteroptimization, another level of challenge is to harmonize andstandardize the entire process, while still allowing forimprovement and process evolution.
2. Image acquisition and reconstruction challenges
In routine clinical image acquisition, there is widevariation in imaging parameters such as image resolution(pixel size or matrix size and slice thickness), washout periodin the case of positron emission tomography (PET) imaging,patient position, and the variations introduced by differentreconstruction algorithms and slice thicknesses, which aredifferent for each scanner vendor. Even this simple set ofimaging issues can create difficulty in comparing resultsobtained across institutions with different scanners andpatient populations. In addition, it is a challenge to identifyand curate a large number of image data examples withsimilar clinical parameters such as disease stage.
2.1. Image acquisition and reconstruction
2.1.1. CTOf all the imaging modalities, CT appears to be the most
straightforward and perhaps the easiest to compare across

Fig. 2. The CT phantom. This phantom has several regions to test imagequality such as low contrast detectability and spatial resolution.
Fig. 3. Effect of two different reconstruction algorithms on same raw CT dathe same raw data reconstructed using a higher contrast algorithm. To appvertical lines are shown (C and D, respectively). Even the average HUs in
1236 V. Kumar et al. / Magnetic Resonance Imaging 30 (2012) 1234–1248
institutions and vendors. Standard phantoms such as the CTphantom have become the standard of the industry (Fig. 2).The phantom is based on the American Association ofPhysicists in Medicine (Task Group Report-1) and hasseveral sections to evaluate imaging performance. There aresections (a) to evaluate the true slice thickness and variation
ta (A anreciate tthe tum
of Hounsfield units (HUs) with electron density, (b) to lookat the ability to visualize small variations in density (lowcontract delectability) and another (c) for detecting specialresolution, high contrast detectability, and a region ofuniform medium to examine variation in HUs. The imagingperformance of a scanner will depend also on the imagingtechnique. As the slice thickness is reduced, the photonstatistics within a slice are reduced unless the mA or kVp isincreased. The axial field of view will also change the voxelsize within a slice, and the reconstruction matrix size can alsobe varied from 512×512 up to 1024×1024, which alsochanges the voxel size.
Pitch is a parameter that is frequently optimized by eachscanner manufacturer so that only certain pitches are allowedfor an image acquisition. These pitches are unique to eachscanner, and as a result, comparing noise between scannerscan only be performed by investigating images acquiredusing axial, as opposed to helical or spiral, acquisitions.However, helical image acquisitions are used most often in aclinical setting. HUs can also vary with reconstructionalgorithm. A single acquisition of a thoracic tumor is shownin Fig. 3A and B using two different reconstructionalgorithms. While this is a single data acquisition, there aresignificant variations in tumor texture between the twoimages. The variation in HUs or texture along the vertical
d B) where panel (A) shows a “standard smooth image” and panel (B) showshe effect of these reconstruction algorithms, the profiles (in HUs) along theor are different for the different algorithms.

1237V. Kumar et al. / Magnetic Resonance Imaging 30 (2012) 1234–1248
paths in Fig. 3A and 3B is shown on the graphs (Fig. 3C and3D, respectively).
For clinical trials, significant effort will be required tomatch reconstruction protocols and image noise betweenscanners. While the CAT phantom is a reasonable initial stepto compare different scanners, more sophisticated phantomsmay be required to match the effects of reconstructionalgorithms. Although there can be some variation, differentvendors have algorithms that are similar enough to bequantitatively comparable. Indeed, the focus of our approachis to use features with (a) sufficient dynamic range betweenpatients, (b) intrapatient reproducibility and (c) insensitivityto image acquisition and reconstructions protocol.
2.1.2. PET–CTQuantitative imaging with 2-deoxy-2-[18F]fluoro-D-glu-
cose (18-FDG) PET scans is a challenge because it not onlyrequires calibration of the scanner and standardization of thescan protocol but also requires the patient and staff to adhereto a strict patient protocol [14,15]. From a technicalviewpoint, the main challenges are the dose calibration andthe metabolic volume or volume-of-interest (VOI) recon-struction that depends heavily on the scan protocol andsource-to-background ratio [16]. Before a scanner is used ina quantitative manner, interinstitution cross-calibration andquality control such as proposed recently [14] are necessary(Fig. 4). From a patient protocol perspective, administrationissues (residual activity in syringe, paravenous administra-tion), blood glucose level [17], uptake period, breathing,patient comfort and inflammation all influence the quanti-tation of the standardized uptake value (SUV) of 18-FDG.Complying with a strict protocol such as has been proposedby the Society of Nuclear Medicine and the EuropeanAssociation of Nuclear Medicine is another prerequisite toquantitative PET imaging.
2.1.3. MRIThe signal intensities in MR images arise from a complex
interplay of inherent properties of the tissue, such as
Fig. 4. Metabolic volume calibration; PET phantom with differently sizedsphere sources filled with FDG activity within a background activity. Byvarying the source-to-background-activity ratio, the capability of the PETscanner to reconstruct the correct sphere volume can be quantified.
relaxation times and acquisition parameters. Therefore, it isdifficult to derive information about the physical propertiesof tissue from MR image signal intensities alone. This is incontrast to CT images where signal intensity can becorrelated with the density of the tissue. However, certaintechniques, such as diffusion-weighted imaging (DWI) anddynamic contrast-enhanced (DCE) MRI, allow assessmentof physiological properties of tissue. For example, theapparent water diffusion coefficient determined using DWIvaries inversely with tissue cellularity. DCE can be used toextract vascular flow, permeability and volume fractions.Although both of these techniques provide quantitativeinformation, their reliability and reproducibility remaindependent on acquisition parameters and conditions. DWimages can be of low spatial resolution and are sensitive tomotion and magnetic susceptibility, and the quantitation isdependent on k-space trajectory, gradient strengths and b-values. DWI has been proposed as a cancer imagingbiomarker, and there are efforts to develop quality controlprotocols [18,19]. Results of the DCE MRI depend on thecontrast agent dose, method of administration, pulsesequence used, field strength of the scanner and the analysismethod used [20–22]. Different investigators use differentmethods to convert DCE MRI signal intensities to contrastagent concentration [23–25]. Recently, a group of theRadiological Society of North America known as theQuantitative Imaging Biomarker Alliance initiated a stan-dardization of the protocol for DCE MRI [26].
Ideally, MR images will all have the same field of view,field strength and slice thickness. Where possible, e.g., braintumors, multiple sequences with contrast enhancement such asT1-weighted, T2-weighted and Fluid attenuated inversionrecovery (FLAIR) can be very useful. InMR images of humanbrain tumors, radiomics has the potential to play an importantrole in categorizing the tumor. It is possible to view the tumoras having different regions using image features, includingtexture, wavelets, etc. For example, there will be areas ofenhancement and potentially necrosis. The tumor bed can beextracted as an expanded region around the postcontrast T-weighted image, for example. Unsupervised clustering can beused to group the data into regions using data from multipleregistered sequences. The extraction of image features fromthose regions, including such things as their locationwithin thetumor bed, can allow for new types of tumor characterization.It has been observed that enhancement in individual tumorscan be heterogeneous and that analysis of this heterogeneityhas prognostic value [9]. The location and characteristics ofsuch regions have the potential to provide new insights intotumor prognosis and howwell it is likely to respond to targetedtreatments. The opportunity to acquire images over time willallow for comparisons and contrasts between regions.
2.2. Need for large image data sets
The acquisition of images is time consuming and costly.Because of this, our approach is to focus on standard-of-care

1238 V. Kumar et al. / Magnetic Resonance Imaging 30 (2012) 1234–1248
images, with the expectation that this will generate large datasets and have more clinical impact compared to morecontrolled and dedicated prospective image acquisitions.Radiomics requires large image data sets with the expecta-tion that large numbers may be able to overcome some of theheterogeneities inherent in clinical imaging. Image datasharing across sites will be important to make large data setsavailable for radiomics analysis.
Various online repositories are available that host imagedata. The image data contains the image series for eachpatient and each series containing image slices. One of thelargest online CT image repositories is the NationalBiomedical Image Archive (NBIA) hosted by the NationalCancer Institute. Apart from the images, image annotationsand outcomes data are also important components to share.There should be a uniform image annotation format whichcould be read by other users to compare with their ownsegmentations. This format should support multiple annota-tions from alternative image analysis algorithms to supporthigher-level processing and prediction. The image data arelinked to the metadata in DICOM-format images; themetadata contain information about the acquisition, scannerand other details of the images. Currently available clinicalimage data which may be used for radiomics study includesthe Lung Image Database Consortium, the Reference ImageDatabase to Evaluate Response to therapy in lung cancer andothers [27,28]. Radiomics analyses require refined imagedata based on image characteristics (resolution, reconstruc-tion and acquisition parameters) and clinical parameters(stage of disease, type of disease and outcomes).
A major use of the information extracted from CT scanimages and clinical data is the development of automatedprediction models. A challenge in modeling any classifier ismaking it robust enough for clinical use. Development ofrobust models requires a sufficiently robust training set. Thelack of standardization in imaging makes it difficult to
Fig. 5. The variation in slice thickness (A) and p
determine the effectiveness of image features being devel-oped and prediction models built to work on those featurevalues. A snapshot of the extent of the lack of standardiza-tion in image acquisition and reconstruction can be seen inFig. 5. This figure represents the variation in slice thicknessand pixel size (in mm) for a data set of CT scan images from74 patients used by Basu et al. [29] to develop predictionmodels for classifying non-small-cell lung cancer (NSCLC)tumor types using image features. This variation affects theinformation being extracted by image feature algorithms,which in turn affects classifier performance. In this scenario,without the presence of a large standardized repository,setting performance benchmarks for effectiveness of imagefeature algorithms and classifier models built upon thosefeatures becomes difficult.
3. Segmentation challenges
Segmentation of images into VOIs such as tumor, normaltissue and other anatomical structures is a crucial step forsubsequent informatics analyses. Manual segmentation byexpert readers is often treated as ground truth. However, itsuffers from high interreader variability and is laborintensive; thus, it is not feasible for radiomics analysisrequiring very large data sets. Many automatic andsemiautomatic segmentation methods have been developedacross various image modalities like CT, PET and MRI andalso for different anatomical regions like the brain, breast,lung, liver, etc. Though different image modalities and organsystems require ad hoc segmentation approaches, all share afew common requirements. The segmentation methodshould be as automatic as possible with minimum operatorinteraction, should be time efficient, and should provideaccurate and reproducible boundaries. Most commonsegmentation algorithms used for medical images include
ixel size (B) for a data set of 74 patients.
1239V. Kumar et al. / Magnetic Resonance Imaging 30 (2012) 1234–1248
region-growing-based methods (click-and-grow), level setsand graph cuts. Region-growing methods require an operatorto select a seed point within the VOI. While these methodsare most suitable for relatively homogenous regions, theycan be user dependent and often introduce significantinterobserver variation in the segmentations. We describehere some major challenges encountered while developingsegmentation methods for NSCLC.
3.1. Challenges in segmentation of lung tumors
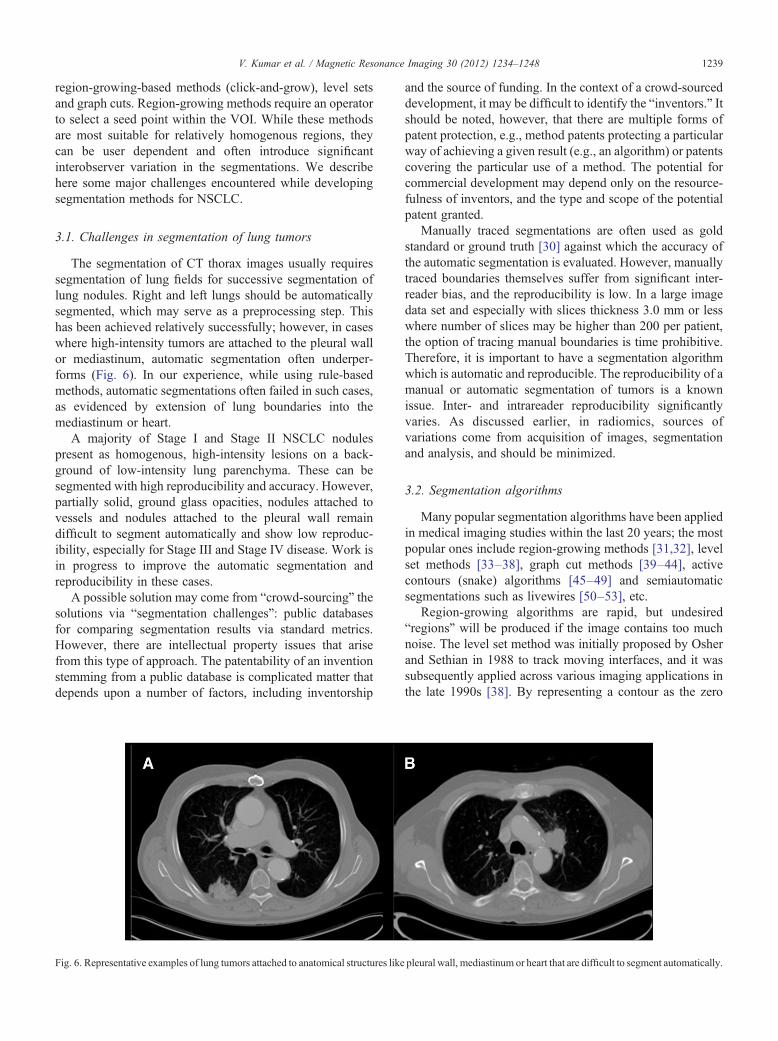
The segmentation of CT thorax images usually requiressegmentation of lung fields for successive segmentation oflung nodules. Right and left lungs should be automaticallysegmented, which may serve as a preprocessing step. Thishas been achieved relatively successfully; however, in caseswhere high-intensity tumors are attached to the pleural wallor mediastinum, automatic segmentation often underper-forms (Fig. 6). In our experience, while using rule-basedmethods, automatic segmentations often failed in such cases,as evidenced by extension of lung boundaries into themediastinum or heart.
A majority of Stage I and Stage II NSCLC nodulespresent as homogenous, high-intensity lesions on a back-ground of low-intensity lung parenchyma. These can besegmented with high reproducibility and accuracy. However,partially solid, ground glass opacities, nodules attached tovessels and nodules attached to the pleural wall remaindifficult to segment automatically and show low reproduc-ibility, especially for Stage III and Stage IV disease. Work isin progress to improve the automatic segmentation andreproducibility in these cases.
A possible solution may come from “crowd-sourcing” thesolutions via “segmentation challenges”: public databasesfor comparing segmentation results via standard metrics.However, there are intellectual property issues that arisefrom this type of approach. The patentability of an inventionstemming from a public database is complicated matter thatdepends upon a number of factors, including inventorship
Fig. 6. Representative examples of lung tumors attached to anatomical structures like
and the source of funding. In the context of a crowd-sourceddevelopment, it may be difficult to identify the “inventors.” Itshould be noted, however, that there are multiple forms ofpatent protection, e.g., method patents protecting a particularway of achieving a given result (e.g., an algorithm) or patentscovering the particular use of a method. The potential forcommercial development may depend only on the resource-fulness of inventors, and the type and scope of the potentialpatent granted.
Manually traced segmentations are often used as goldstandard or ground truth [30] against which the accuracy ofthe automatic segmentation is evaluated. However, manuallytraced boundaries themselves suffer from significant inter-reader bias, and the reproducibility is low. In a large imagedata set and especially with slices thickness 3.0 mm or lesswhere number of slices may be higher than 200 per patient,the option of tracing manual boundaries is time prohibitive.Therefore, it is important to have a segmentation algorithmwhich is automatic and reproducible. The reproducibility of amanual or automatic segmentation of tumors is a knownissue. Inter- and intrareader reproducibility significantlyvaries. As discussed earlier, in radiomics, sources ofvariations come from acquisition of images, segmentationand analysis, and should be minimized.
3.2. Segmentation algorithms
Many popular segmentation algorithms have been appliedin medical imaging studies within the last 20 years; the mostpopular ones include region-growing methods [31,32], levelset methods [33–38], graph cut methods [39–44], activecontours (snake) algorithms [45–49] and semiautomaticsegmentations such as livewires [50–53], etc.
Region-growing algorithms are rapid, but undesired“regions” will be produced if the image contains too muchnoise. The level set method was initially proposed by Osherand Sethian in 1988 to track moving interfaces, and it wassubsequently applied across various imaging applications inthe late 1990s [38]. By representing a contour as the zero
pleural wall, mediastinum or heart that are difficult to segment automatically
.
1240 V. Kumar et al. / Magnetic Resonance Imaging 30 (2012) 1234–1248
level set of a higher dimensional function (level set function),level set method formulates the motion of the contour as theevolution of the level set function. The graph cut method isrelatively new in the area of image segmentation, whichconstructs an image-based graph and achieves a globallyoptimal solution of energy minimization functions. Sincegraph cut algorithms try to identify a global optimum, it iscomputationally expensive. Another problem for graph cut isthe oversegmentation.
The active contours (snake) algorithm works like astretched elastic band being released. The start points aredefined around the object which needs to be extracted. Thepoints then move through an iterative process to a point withthe lowest energy function value. The active contoursalgorithm requires a good initialization; it is also sensitiveto noise, which may lead the snake to undesired locations.The livewire (intelligent scissor) method is motivated by thegeneral paradigm of the active contour algorithm: it convertsthe segmentation problem into an optimal graph searchproblem via local active contour analysis, and its costfunction is minimized by using dynamic programming. Aproblem with the livewire approach is that it is semiauto-matic, requiring multiple human interactions.
There is no universal segmentation algorithm that canwork for all medical image applications. With properparameters settings, each segmentation could segment theregion of interest automatically or semiautomatically.However, the result of each segmentation will be quitedifferent, and even for the same algorithm performedmultiple times with different initializations, results may bevariable. Hence, it is very important to develop agreed-uponmetrics to evaluate segmentation algorithms.
3.3. Performance metrics
Accuracy, reproducibility and consistency are three ofthe most important factors to evaluate a segmentationalgorithm for medical images. However, conventionalevaluation metrics normally utilize the manual segmenta-tion provided by radiologists, which is subjective, errorprone and time consuming. In the majority of cases, manualsegmentation tends to overestimate the lesion volume toensure the entire lesion is identified [54], and the process ishighly variable [55,56]. In other words, "ground truth"segmentation does not exist. Hence, we believe thatreproducibility and consistency are more important thanaccuracy. That is, for a given a tumor, an algorithm mustreproducibly provide the same segmentation results that areuser independent.
There is no consensus on the metrics for evaluation ofimage segmentation algorithms. The metric should addressthe particular characteristic of the algorithm to be compared,as automated as possible, quantitative and easily computed.Many metrics have been used, like volume, center of volumeand maximum surface distance, to compare characteristicslike robustness and accuracy [57,58].
The Jaccard Similarity Index (SI) is the measure of theoverlap of two or more volumes and is calculated as the ratioof voxel-wise intersection to union of target and referenceimages [59]:
SIab =Sa∩SbSa∪Sb
; ð1Þ
where Sa and Sb are segmentations of target and referenceimages, respectively. An SI of 1.0 represents completeoverlap (volume, location and shape), and 0 means nooverlap. In our current project, we have calculated SI betweeneach pair of 20 independent computer-generated segmen-tations of individual lung tumors and report the average SIfor each lesion, calculated using following equation:
AverageSIi =120
∑20
m=1
119
∑20
n≠m; n=1SIim ;in
" #; ð2Þ
where i∈[1,#ofcases] is the case index, SIim,in is from Eq.(1). For manual segmentations, the average SI was 0.73. Forautomated segmentations, the average SI was 0.93.
4. Feature extraction and qualification
Once tumor regions are defined, imaging features can beextracted. These features describe characteristics of thetumor intensity histogram (e.g., high or low contrast), tumorshape (e.g., round or spiculated), texture patterns (e.g.,homogeneous or heterogeneous), as well as descriptors oftumor location and relations with the surrounding tissues(e.g., near the heart).
4.1. Tumor intensity histogram
Tumor intensity histogram-based features reduce thethree-dimensional (3D) data of a tumor volume into a singlehistogram. This histogram describes the fractional volumefor a selected structure for the range of voxel values (e.g.,Hounsfield units for a CT scan or SUVs for an FDG-PETscan). From this histogram, common statistics can becalculated (e.g., mean, median, min, max, range, skewness,kurtosis), but also more complex values, such as metabolicvolume above an absolute SUV of 5 or the fraction of high-density tissue measured with CT [60,61]. Such thresholdvalues have shown promise in developing classifier models,and optimum thresholds for a given task can be identifiedwith receiver operator characteristic (ROC) analyses. As theoutcome (e.g., time to recurrence) to which the threshold isbeing compared can also have a variable threshold, 3D ROCapproaches have been developed to represent a surface tooptimize both the biomarker and the outcome thresholds.

1241V. Kumar et al. / Magnetic Resonance Imaging 30 (2012) 1234–1248
4.2. Shape-based features
Quantitative features describing the geometric shape of atumor can also be extracted from the 3D surface of therendered volumes [62]. For example, the total volume orsurface area can be an important characteristic. Also, thesurface-to-volume ratio can be determined, where aspeculated tumor has a higher value than a round tumorwith a similar volume. Furthermore, descriptors of tumorcompactness and shape (sphericity, etc.) can also becalculated [63].
4.3. Texture-based features
Second-order statistics or co-occurrence matrix featurescan be used for texture classification [64–66] and are widelyapplied in medical pattern recognition tasks [67–71]. Thebasis of the co-occurrence features lies on the second-orderjoint conditional probability density function P(i,j;a,d) of agiven texture image. The elements (i,j) of the co-occurrencematrix for the structure of interest represent the number oftimes that intensity levels i and j occur in two voxelsseparated by the distance (d) in the direction (a). Here, amatrix can be selected to cover the 26-connected directionsof neighboring voxels in 3D space. The matrix size isdependent on the intensity levels within the 3D structure.Subsequently, from this conditional probability densityfunction, features can be extracted, e.g., describing autocor-relation, contrast, correlation, cluster prominence, clustershade, cluster tendency, dissimilarity, energy, homogeneity,maximum probability, sum of squares, sum average, sumvariance, sum entropy or difference entropy, etc. Further-more, gray level run length features, derived from run lengthmatrices and using run length metrics as proposed byGalloway [66], can be extracted. A gray level run is thelength, in number of pixels, of consecutive pixels that havethe same gray level value. From the gray level run lengthmatrix, features can be extracted describing short and longrun emphasis, gray level nonuniformity, run length non-uniformity, run percentage, low gray level run emphasis andhigh gray level run emphasis. As expected, such analyses cangenerate hundreds of variables, some of which may beredundant. Thus, it is important to assess the redundancy ofthese data using covariance.
4.4. Feature qualification
As described above, a dauntingly large number of imagefeatures may be computed. However, all these extractedfeatures may not be useful for a particular task. In addition,the numbers of extracted features can be higher than thenumber of samples in a study, reducing power and increasingthe probability of overfitting the data. Therefore, dimen-sionality reduction and selection of task-specific features forbest performance are necessary steps. Different featureselection methods can be used for this purpose and mayexploit machine learning or statistical approaches [72–76].
Dimensionality reduction can also be achieved by combin-ing or transforming the original features to obtain a new setof features by using methods like principal componentanalysis (PCA) [73]. In addition to feature selection forinformative and nonredundant features, high reproducibilityof the features is important in the development of clinicalbiomarkers, which requires the availability of a test–retestdata set.
To reduce the dimensionality of our feature space, we havechosen to combine different ad hoc methods that areagnostically applied to the behavior of the features them-selves prior to evaluating their ability to develop predictivemodels. Thus, we evaluated features to fulfill three mainrequirements: highly reproducible, informative and nonre-dundant. We have applied three methods in serial manner,where the methods were applied successively to selectfeatures. The resulting features of one method were used asinput to the next. First, using a test–retest lung CT image dataset, highly reproducible features were selected based onconcordance correlation coefficient, CCC, with a cutoff of0.85 for high reproducibility. Subsequently, the CCC-prioritized features were analyzed for dynamic range,calculated as the ratio of scalar biological range to the test–retest absolute difference. Features showing high dynamicrange were considered to be informative. A dynamic range of,e.g., 100 can be arbitrarily used as a cutoff, although featureswith lower dynamic range may also be informative. Finally,the redundancy in the features, selected after passing throughreproducibility and dynamic range requirements, can bereduced by identifying highly correlated features based oncorrelation coefficients across all samples. Correlationcoefficients greater than 0.95 are considered to be highlyredundant and thus can be combined into a single descriptor.In a test set, the serial application of these three methods wasable to reduce a set of 327 quantitative features to 39 that werereproducible, informative and not redundant. More featurescould be added by relaxing the dynamic range threshold,which was arbitrarily set at 100. These selected features canalso be used to develop classifier models based on machinelearning algorithms to improve the performance [29].
5. Databases and data sharing
5.1. Deidentification
To follow the principle of providing the minimum amountof confidential information (i.e., patient identifiers) necessaryto accommodate downstream analysis of imaging data, rawDICOM image data can be stripped of identified headers andassigned a deidentified number. Maintaining deidentifiedimages and clinical data is an important patient privacysafeguard [77]. In the context of DICOM images, Supple-ment 142 from the DICOM Standards Committee providesguidance in the process of deidentifying images, includingpixel-level data. Software packages, including NBIA [78],implement these standards. Likewise, molecular data can be

1242 V. Kumar et al. / Magnetic Resonance Imaging 30 (2012) 1234–1248
deidentified using a similar approach. However, identifiersmust be linked between imaging, molecular data and clinicaldata in order to build classifier models. This can be achievedthrough institutional review board approval or through themore expedient use of an “honest broker.” The clinical dataare deidentified by removing personal identifiers (includingmedical record numbers, patient names, social securitynumbers and addresses) and providing calculated interval-based survival times instead of actual dates which are alsopersonal identifiers. The approach taken within our radiomicseffort is to avoid the use of identified imaging or clinical dataunless specifically required. This also facilitates the sharingof data within and across institutions since the deidentifica-tion occurs at the creation of the data set.
5.2. RDB: an integrated radiomics database
The goal of radiomics is to link the image features tophenotypes or molecular signatures, and this requiresdevelopment of an integrated database wherein the imagesand the extracted features are linked to clinical and moleculardata (Fig. 7). The use of such a database must also beintegrated in the workflow starting from image retrieval andcalculation of image features up to the joint analysis of imagefeatures, clinical data and molecular data. Furthermore, aspart of a larger network of quantitative imaging sites, wemust also be able to exchange data according to an evolvingset of standards. Below are some of the challenges discussedin more detail.
5.2.1. Image storageUsing clinical Picture Archiving and Communications
Systems (PACS) systems is not amenable for researchprojects. First, the clinical system is used for operational
Fig. 7. Architecture of the proposed RDB. High-level database schema capturing theclinical (blue) and molecular (green) data. Each box represents a set of normalizedimages series, using multiple segmentations generating different image features.
purposes, and introducing additional Input/Output (I/O)load and increased storage could negatively impact clinicalcare. Second, the requirements between research andclinical systems are different and often incompatible. Theresearch image storage server needs to be fully integratedwith the downstream data, including molecular and clinicalresearch data. If the imported DICOM images containMedical Records Numbers, these need to be linked to otherclinical data that are stored on other systems, and then theDICOM headers will be deidentified (e.g., patient name).This allows for transparent merging of clinical data acrosssystems. In a research setting, some of the analyses orimaging feature generation software packages also needdirect access to the DICOM images. Having direct accessto the file system where the images are stored makes itpossible to create project folders, with all images selectedfor a specific project, which are specific for the softwareused for the image feature extraction. In our instance, weare using open-source Clear Canvas as a research PACSsystem, although others are available.
5.2.2. Integration to create a simple work streamIn a research setting, it is common that several different
software packages are used for image analysis (e.g., 3D-Slicer, Definiens Developer, Medical Imaging Toolkit[MITK]) and statistical analysis (e.g., R, SAS, Stata). Manyof these software packages may be developed by industry, in-house or by other academic groups. This requires that theRDB import data from analysis projects using these softwarepackages in a simple way without sacrificing data integrity.This can be achieved by having the RDB application directlyreading working directories and/or results files from thesoftware used. If unique tags have been used when creating
following data types: image types (orange), image features (purple), patienttables. This schema supports multiple tumors for one patient, with multiple
/

1243V. Kumar et al. / Magnetic Resonance Imaging 30 (2012) 1234–1248
image filenames, it is easy to link these data with the rightimage and downstream clinical and molecular data.
5.2.3. Integration of clinical and molecular dataIntegrating data across systems is always a challenge in
large settings. The RDB application needs to integrate thedata from several systems, such as outcomes and demo-graphic data (Cancer Registry), clinical trial data (e.g.,Oncore) or other systems that store clinical and patientinformation. The manual input of such data should be kept toa minimum through the use of an extract, transform and loadtool that captures the physical metadata information tomaintain data provenance and minimizes the risk of humanerrors. The use of a well-developed data dictionary withextensive metadata is essential when integrating data acrosssystems. Therefore, a new data warehouse model thatincorporates the metadata layer into the data model,including a comprehensive data dictionary along withcalculated data quality attributes such as completeness,accuracy and consistency, has been utilized for the radiomicsproject [79]. This new data structure was specificallydesigned to provide easy semantic integration of internaldata from multiple heterogeneous source systems as well asprovide an easy solution for harmonizing clinical, molecularand imaging data with external members of the quantitativeimaging network. Along this path, it has also been importantto ensure that the RDB structure and semantics arecompatible with those from other institutions and (inter)national databases.
5.2.4. Reporting and exporting the dataAdvanced statistical analyses of radiomics data require
tools such as R, SAS, or MATLAB. The application must beable to export data in such a way that it minimizes any needfor processing of data outside the RDB application and thuskeeping the data aligned and correct. Longitudinal studiesadd an extra layer of complexity with the potential need ofreporting changes over time, such as imaging features orclinical parameters. A flexible selection of which data shouldbe included and in which format the data should be exportedis important.
6. Statistical and radioinformatics analysis
Analysis within radiomics must evolve appropriateapproaches for identifying reliable, reproducible findingsthat could potentially be employed within a clinical context.Applying the existing bioinformatics “toolbox” to radio-mics data is an efficient first step since it eliminates thenecessity to develop new analytical methods and leveragesaccepted and validated methodologies. Radiomics-specificanalysis issues will exist, as in any field; therefore, animportant step in achieving consensus on appropriateanalysis and evaluation techniques requires availability ofreal-world data. The goals of the Quantitative ImagingNetwork (QIN) in providing infrastructure to effectively
share radiomics data will enable the further development ofmethodology and best practices within the field.
Some of the more significant methods or developmentsfrom the bioinformatics toolbox include (a) multiple testingissues, (b) supervised and unsupervised analysis and (c)validating biomarker classifiers. Another important analyt-ical consideration is the incorporation of clinical and patientrisk factor data since they may have a causal effect orcorrelation with image features or they may confoundstatistical associations. Thus, synergizing biostatistics,epidemiology and bioinformatics approaches is necessaryto build robust, parsimonious and clinically relevantpredictive models relating image features to phenotypes/end points or gene–protein signatures.
6.1. High-dimensional biomarker discovery and validation
The field of high-dimensional biomarker discovery andvalidation has evolved rapidly over the past decade sincesome of the earliest microarray-based results were reported[80]. In particular, these advances have prompted manystudies to address clinical prediction (e.g., prognosis,response to therapy). Many of the lessons learned andtools developed within this field are immediately relevant tothe analysis of radiomics data sets.
6.1.1. Multiple testingMany of the significant developments within the field of
so-called “large-p, small-n” data analysis problems arerobust methods for accommodating multiple testing issues.In many data sets in these areas, it is not unusual to test thesignificance of tens of thousands of variables (p=50,000)using a univariate test (e.g., a t test) across 50 samples (n=50). Any single test may have a low expected false-positive rate; however, the cumulative effect of manyrepeated tests guarantees that many statistically significantfindings are due to random chance. The false positives(type I errors in statistics) are controlled using anappropriate P value threshold (e.g., Pb.05) in the case ofsingle test. However, performing 50,000 tests createsserious concerns over the accumulated type I error fromsuch an experiment. This multiple testing problem hasbeen addressed in statistics in many ways; however, themost familiar, and conservative, Bonferroni correctionsseverely limit the power of the test in the 50,000-testexperiments [81]. False discovery rates [82–84] have beendeveloped to provide more reasonable error estimates.Incorporating this type of correction is an essential step,even in discovery-oriented analysis, to give researchersreasonable guidance on the validity of their discoveries.
6.1.2. Unsupervised and supervised data analysisDepending on the type of analysis, there are both
unsupervised and supervised analysis options available. Thedistinction in these approaches is that unsupervised analysisdoes not use any outcome variable, but rather providessummary information and/or graphical representations of

1244 V. Kumar et al. / Magnetic Resonance Imaging 30 (2012) 1234–1248
the data. Supervised analysis, in contrast, creates modelsthat attempt to separate or predict the data with respect toan outcome or phenotype (for instance, patient outcomeor response).
Clustering is the grouping of like data [85] and is oneof the most common unsupervised analysis approaches.There are many different types of clustering, althoughseveral general types are commonly used within bioinfor-matics approaches. Hierarchical clustering, or the assign-ment of examples into clusters at different levels ofsimilarity into a hierarchy of clusters, is the most commontype. Similarity is based on correlation (or Euclideandistance) between individual examples or clusters. Mostsignificantly, the data from this type of analysis can begraphically represented using the cluster heat map. Fig. 8represents a heat map of NSCLC patients with quantitativeimaging features extracted. The heat map is an intuitivedisplay that simultaneously reveals row and columnhierarchical cluster structure in a data matrix that consistsof a rectangular tiling with each tile shaded on a colorscale to represent the value of the corresponding elementof the data matrix. This cluster heat map is a synthesis ofvarious graphic displays developed by statisticians overmore than a century [86].
Supervised analysis consists of building a mathematicalmodel of an outcome or response variable. The breadth oftechniques available is remarkable and spans statistics anddata mining/machine learning. Approaches we have usedinclude neural networks [87], linear regression [87] andCox proportional hazards regression [88]. Some essentialcriteria in selecting an approach include the stability andreproducibility of the model. Neural networks or ensemblemethods, if they involve an element of randomness, canlead to results that cannot be replicated without the samerandom sequences generated. In light of many of thedifficulties surrounding genomic-based models, understand-ability of the generated models is an important consideration.For clinical validation, alternate assays or measurementsmay be required, and thus, an understanding of the way inwhich variables are combined in a decision model isnecessary for translation. In the case of NSCLC imaging,methods that generate understandable decisions can beimportant for combining this information with existingadvances in genotyping patients (e.g., EGFR mutation,EML4-ALK rearrangements).
Multivariate data analysis tools such as PCA [89] andpartial least squares projection to latent structures [90] (PLS)can be used to analyze quantitative features together withadditional data. PCA allows for an unsupervised analysis ofthe data where important features can be extracted andvisualized. PCA extracts the underlying structures, principalcomponents, so that a high-dimensional space can bevisualized in a 2D or 3D space. Additional layers ofinformation can be added by using coloring, shapes and sizeof the objects on the graphs. PCA can be utilized to findgrouping, outliers and other artifacts within the data. To find
common underlying structures and correlation between twomatrices, PLS can be used. PLS has been shown to work wellon large and complex data sets with more variables thanobservations, on collinear variables and where there aresome missing data.
A final, key contribution from the field of bioinformaticsis the approach developed to provide validation of predictionfindings from high-dimensional experiments. As was notedin Ref. [91], many genomics-based studies that have beenpublished contain significant analytical errors. These errorscompromise the estimates of predictor accuracy or overallfindings. Following the best practices in developing and thenindependently validating the observations in a distinct cohortis essential for reproducible results [92]. For instance, in ourradiomics study, we have provided for several validationcomponents, including validation between MAASTROClinic (Netherlands) and Moffitt sample sets, as well asvalidation in prospectively collected Moffitt samples. Whenmodel building and cross-validation efforts are completed,the entire group will determine the appropriate model(s) toevaluate in independent validation.
6.1.3. Sample size issuesHigh-throughput technologies (CT images, genomic/
proteomic, etc.) provide us with an enormous amount ofmultivariate data describing the complex biological process.Ability to predict risks or to draw inferences based on clinicaloutcomes is bogged by sample size. Efron et al. havepioneered the work, studied various cross-validationmethods and proposed unbiased error estimation called thebootstrap [93,94]. Inference in small samples has seenrenewed interest with the advent of genomics technologies,especially in classification [95]. There has been extensivestudies to make unbiased inference in small samples, oneapproach was to create synthetic samples following thedistribution of the sample groups and report errors of thenewly formed population [96]. In addition, most popularerror estimates has been studied in context of small sampleclassification [97].
6.2. Clinical and risk factor data
Incorporating detailed clinical and patient risk factor datainto radiomics is important because imaging features maybe influenced by patient parameters. Patient parameters mayinfluence the image features via a direct causal associationor exert a confounding effect on statistical associationswhereby the parameter is correlated with both theindependent and dependent variables. For instance, smok-ing-related lung cancers differ from lung cancers in patientswho never smoked, and thus, smoking status couldinfluence image features, clinical parameters (histology),phenotypes, molecular signatures and end points (i.e.,survival, recurrence). Addressing the influence of patientparameters in radiomics research by using epidemiologicand biostatistical approaches will minimize spurious re-lationships by avoiding type I error. Moreover, predictive

Fig. 8. Unsupervised hierarchical clustering of lung tumor image features extracted from CT images from 276 NSCLC patients. Tumor segmentation for each CTimage was performed in a semiautomated fashion. Quantitative imaging features were calculated using Definiens (Munchen, Germany) and represent many 2Dand 3D characteristics of the tumor. Aspects such as tumor volume, shape and texture were represented. Each of the numerical imaging features was mediancentered, and all features were clustered using complete linkage, with correlation used as the similarity measure. The resulting heat map is visualized using red torepresent higher than median feature values and green to represent lower than median feature values. Each row of the heat map represents a specific imagingfeature across patients, and each column represents all features for a patient's lung tumor from CT.
1245V. Kumar et al. / Magnetic Resonance Imaging 30 (2012) 1234–1248

1246 V. Kumar et al. / Magnetic Resonance Imaging 30 (2012) 1234–1248
models which are more precise and clinically relevant maybe developed which target well-characterized and -definedpatient subgroups rather than a broad heterogeneous diseasegroup. For example, a model that includes all patients withadenocarcinoma of lung would not likely be clinicallyrelevant because of the heterogeneity (biological andclinical) of this histologic subtype. However, a predictivemodel which focused on adenocarcinoma patients with aspecific molecular feature (e.g., EML4-ALK fusion) wouldlikely be informative because of the biological and clinicalhomogeneity and subsequent targeted therapies. Thus, asnoted with the bioinformatics “toolbox,” existing epidemi-ologic and biostatistical approaches can be leveragedtowards radiomics research to develop robust and clinicallyrelevant prognostic models, to reveal factors that mayinfluence (casually or by confounding) radiomics features,and to explore and mine complex data sets.
Acknowledgment
Radiomics of NSCLC U01 CA143062.
References
[1] Lambin P, Rios-Velazquez E, Leijenaar R, Carvalho S, Stiphout RV,Granton P, et al. Radiomics: extracting more information from medicalimages using advance feature analysis. Eur J Cancer 2012;48(4):441–6.
[2] Jaffe CC. Measures of response: RECIST, WHO, and new alternatives.J Clin Oncol 2006;24(20):3245–51.
[3] Burton A. RECIST: right time to renovate? Lancet Oncol 2007;8(6):464–5.
[4] Rubin DL. Creating and curating a terminology for radiology: ontologymodeling and analysis. J Digit Imaging 2008;21(4):355–62.
[5] Opulencia P, Channin DS, Raicu DS, Furst JD. Mapping LIDC,RadLex™, and lung nodule image features. J Digit Imaging2011;24(2):256–70.
[6] Channin DS, Mongkolwat P, Kleper V, Rubin DL. The annotation andimage mark-up project 1. Radiology 2009;253(3):590–2.
[7] Rubin DL, Mongkolwat P, Kleper V, Supekar K, Channin DS. Medicalimaging on the semantic web: annotation and image markup. 2008.AAAI Spring Symposium Series, Semantic Scientific KnowledgeIntegration, Stanford University, 2008.
[8] Jackson A, O'Connor JPB, Parker GJM, Jayson GC. Imaging tumorvascular heterogeneity and angiogenesis using dynamic contrast-enhanced magnetic resonance imaging. Clin Cancer Res 2007;13(12):3449–59.
[9] Rose CJ,Mills SJ, O'Connor JPB, Buonaccorsi GA, Roberts C,WatsonY, et al. Quantifying spatial heterogeneity in dynamic contrast‐enhancedMRI parameter maps. Magn ResonMed 2009;62(2):488–99.
[10] Gibbs P, Turnbull LW. Textural analysis of contrast‐enhanced MRimages of the breast. Magn Reson Med 2003;50(1):92–8.
[11] Canuto HC,McLachlan C, KettunenMI, Velic M, Krishnan AS, NevesAA, et al. Characterization of image heterogeneity using 2DMinkowskifunctionals increases the sensitivity of detection of a targeted MRIcontrast agent. Magn Reson Med 2009;61(5):1218–24.
[12] Segal E, Sirlin CB, Ooi C, Adler AS, Gollub J, Chen X, et al. Decodingglobal gene expression programs in liver cancer by noninvasiveimaging. Nat Biotechnol 2007;25(6):675–80.
[13] Diehn M, Nardini C, Wang DS, McGovern S, Jayaraman M, Liang Y,et al. Identification of noninvasive imaging surrogates for brain tumorgene-expression modules. Proc Natl Acad Sci 2008;105(13):5213.
[14] Boellaard R, O'Doherty MJ, Weber WA, Mottaghy FM, LonsdaleMN, Stroobants SG, et al. FDG PET and PET/CT: EANM procedureguidelines for tumour PET imaging: version 1.0. Eur J Nucl Med MolImaging 2010;37(1):181–200.
[15] Boellaard R. Standards for PET image acquisition and quantitative dataanalysis. J Nucl Med 2009;50(Suppl. 1):11S–20S.
[16] Ollers M, Bosmans G, van Baardwijk A, Dekker A, Lambin P, Teule J,et al. The integration of PET–CT scans from different hospitals intoradiotherapy treatment planning. Radiother Oncol 2008;87(1):142–6.
[17] Janssen MH, Ollers MC, van Stiphout RG, Riedl RG, van den BogaardJ, Buijsen J, et al. Blood glucose level normalization and accuratetiming improves the accuracy of PET-based treatment responsepredictions in rectal cancer. Radiother Oncol 2010;95(2):203–8.
[18] Padhani AR, Liu G, Koh DM, Chenevert TL, Thoeny HC, Takahara T,et al. Diffusion-weighted magnetic resonance imaging as a cancerbiomarker: consensus and recommendations. Neoplasia 2009;11(2):102–25.
[19] Delakis I, Moore EM, Leach MO, De Wilde JP. Developing a qualitycontrol protocol for diffusion imaging on a clinical MRI system. PhysMed Biol 2004;49(8):1409–22.
[20] Yang X, Knopp MV. Quantifying tumor vascular heterogeneity withdynamic contrast-enhanced magnetic resonance imaging: a review. JBiomed Biotechnol 2011;2011:732848.
[21] Galbraith SM, Lodge MA, Taylor NJ, Rustin GJ, Bentzen S, StirlingJJ, et al. Reproducibility of dynamic contrast-enhanced MRI in humanmuscle and tumours: comparison of quantitative and semi-quantitativeanalysis. NMR Biomed 2002;15(2):132–42.
[22] Makkat S, Luypaert R, Sourbron S, Stadnik T, De Mey J.Quantification of perfusion and permeability in breast tumors with adeconvolution-based analysis of second-bolus T1-DCE data. J MagnReson Imaging 2007;25(6):1159–67.
[23] Yang C, Stadler WM, Karczmar GS, Milosevic M, Yeung I, HaiderMA. Comparison of quantitative parameters in cervix cancer measuredby dynamic contrast-enhanced MRI and CT. Magn Reson Med2010;63(6):1601–9.
[24] Priest AN, Gill AB, Kataoka M, McLean MA, Joubert I, Graves MJ,et al. Dynamic contrast-enhanced MRI in ovarian cancer: initialexperience at 3 tesla in primary and metastatic disease. Magn ResonMed 2010;63(4):1044–9.
[25] McGrath DM, Bradley DP, Tessier JL, Lacey T, Taylor CJ, Parker GJ.Comparison of model-based arterial input functions for dynamiccontrast-enhanced MRI in tumor bearing rats. Magn Reson Med2009;61(5):1173–84.
[26] Jackson E, Ashton E, Evelhoch J, Buonocore M, Karczmar G, RosenM, et al. Multivendor, multisite DCE-MRI phantom validation study.2009. In: Proceedings of the 95th Scientific Assembly and AnnualMeeting of the Radiological Society of North America (RSNA '10);December 2009; Chicago, IL, USA.
[27] Armato III SG, McLennan G, Hawkins D, Bidaut L, McNitt-Gray MF,Meyer CR, et al. The Lung Image Database Consortium (LIDC) andImage Database Resource Initiative (IDRI): a completed referencedatabase of lung nodules on CT scans. Med Phys 2011;38(2):915–31.
[28] Armato III SG, Meyer CR, McNitt-Gray MF, McLennan G, ReevesAP, Croft BY, et al. The Reference Image Database to EvaluateResponse to therapy in lung cancer (RIDER) project: a resource for thedevelopment of change-analysis software. Clin Pharmacol Ther2008;84(4):448–56.
[29] Basu S, Hall L, Goldgof D, Gu Y, Kumar V, Choi J, et-al. Developinga classifier model for lung tumors in CT-scan images. IEEEInternational Conference on Systems, Man and Cybernetics (SMC2011), Anchorage, Alaska, 10/2011.
[30] Stroom J, Blaauwgeers H, van Baardwijk A, Boersma L, Lebesque J,Theuws J, et al. Feasibility of pathology-correlated lung imaging foraccurate target definition of lung tumors. Int J Radiat Oncol Biol Phys2007;69(1):267–75.
[31] Hojjatoleslami S, Kittler J. Region growing: a new approach. IEEETrans Image Process 1998;7(7):1079–84.

1247V. Kumar et al. / Magnetic Resonance Imaging 30 (2012) 1234–1248
[32] Dehmeshki J, Amin H, Valdivieso M, Ye X. Segmentation ofpulmonary nodules in thoracic CT scans: a region growing approach.IEEE Trans Med Imaging 2008;27(4):467–80.
[33] Sethian JA. Level set methods and fast marching methods: evolvinginterfaces in computational geometry, fluid mechanics, computervision, and materials science. 2nd ed. Cambridge: CambridgeUniversity Press; 1999.
[34] Malladi R, Sethian JA, Vemuri BC. Shape modeling with frontpropagation: a level set approach. IEEE Trans Pattern Anal Mach Intell1995;17(2):158–75.
[35] Gao H, Chae O. Individual tooth segmentation from CT images usinglevel set method with shape and intensity prior. Pattern Recognition2010;43(7):2406–17.
[36] Chen YT. A level set method based on the Bayesian risk for medicalimage segmentation. Pattern Recognition 2010;43(11):3699–711.
[37] Krishnan K, Ibanez L, Turner WD, Jomier J, Avila RS. An open-source toolkit for the volumetric measurement of CT lung lesions. OptExpress 2010;18(14):15256–66.
[38] Osher S, Sethian JA. Fronts propagating with curvature-dependentspeed: algorithms based on Hamilton–Jacobi formulations. J ComputPhys 1988;79(1):12–49.
[39] Boykov Y, Veksler O, Zabih R. Fast approximate energy minimizationvia graph cuts. IEEE Trans Pattern Anal Mach Intell 2001;23(11):1222–39.
[40] So RWK, Tang TWH, Chung A. Non-rigid image registration of brainmagnetic resonance images using graph-cuts. Pattern Recognition2011:2450–67.
[41] Xu N, Bansal R, Ahuja N. Object segmentation using graph cuts basedactive contours. IEEE 2003;42:II-46–53.
[42] Slabaugh G, Unal G. Graph cuts segmentation using an elliptical shapeprior. IEEE 2005:II-1222–5.
[43] Liu X, Veksler O, Samarabandu J. Graph cut with ordering constraintson labels and its applications. IEEE 2008:1–8.
[44] Ye X, Beddoe G, Slabaugh G. Automatic graph cut segmentation oflesions in CT using mean shift superpixels. J Biomed Imaging2010;2010:19.
[45] Liu W, Zagzebski JA, Varghese T, Dyer CR, Techavipoo U, Hall TJ.Segmentation of elastographic images using a coarse-to-fine activecontour model. Ultrasound Med Biol 2006;32(3):397–408.
[46] He Q, Duan Y, Miles J, Takahashi N. A context-sensitive activecontour for 2D corpus callosum segmentation. Int J Biomed Imaging2007;2007(3):24826.
[47] Chen C, Li H, Zhou X, Wong S. Constraint factor graph cut–basedactive contour method for automated cellular image segmentation inRNAi screening. J Microsc 2008;230(2):177–91.
[48] Suzuki K, Kohlbrenner R, Epstein ML, Obajuluwa AM, Xu J, Hori M.Computer-aided measurement of liver volumes in CT by means ofgeodesic active contour segmentation coupled with level-set algo-rithms. Med Phys 2010;37:2159.
[49] Wang L, Li C, Sun Q, Xia D, Kao CY. Active contours driven by localand global intensity fitting energy with application to brain MR imagesegmentation. Comput Med Imaging Graph 2009;33(7):520–31.
[50] Mortensen EN, Barrett WA. Interactive segmentation with intelligentscissors. Graph Models Image Process 1998;60(5):349–84.
[51] Souza A, Udupa JK, Grevera G, Sun Y, Odhner D, Suri N, SchnallMD. Iterative live wire and live snake: new user-steered 3D imagesegmentation paradigms. In: Medical Imaging 2006: Image Proces-sing. Reinhardt JM, Pluim JP, editors. Proceedings of the SPIE,2006;6144:1159-1165.
[52] Lu K, Higgins WE. Interactive segmentation based on the live wire for3D CT chest image analysis. Int J Comput Assist Radiol Surg2007;2(3):151–67.
[53] Lu K, HigginsWE. Segmentation of the central-chest lymph nodes in 3DMDCT images. Comput Biol Med 2011;41(9):780–9. Epub 2011 Jul 12.
[54] Rexilius J, Hahn HK, Schluter M, Bourquain H, Peitgen HO.Evaluation of accuracy in MS lesion volumetry using realistic lesionphantoms. Acad Radiol 2005;12(1):17–24.
[55] Tai P, Van Dyk J, Yu E, Battista J, Stitt L, Coad T. Variability of targetvolume delineation in cervical esophageal cancer. Int J Radiat OncolBiol Phys 1998;42(2):277–88.
[56] Cooper JS, Mukherji SK, Toledano AY, Beldon C, Schmalfuss IM,Amdur R, et al. An evaluation of the variability of tumor-shapedefinition derived by experienced observers from CT images ofsupraglottic carcinomas (ACRIN protocol 6658). Int J Radiat OncolBiol Phys 2007;67(4):972–5.
[57] Jameson MG, Holloway LC, Vial PJ, Vinod SK, Metcalfe PE. Areview of methods of analysis in contouring studies for radiationoncology. J Med Imaging Radiat Oncol 2010;54(5):401–10.
[58] Warfield SK, Zou KH, Wells WM. Simultaneous truth andperformance level estimation (STAPLE): an algorithm for thevalidation of image segmentation. IEEE Trans Med Imaging2004;23(7):903–21.
[59] Zijdenbos AP, Dawant BM, Margolin RA, Palmer AC. Morphometricanalysis of white matter lesions in MR images: method and validation.IEEE Trans Med Imaging 1994;13(4):716–24.
[60] Holub O, Ferreira ST. Quantitative histogram analysis of images.Comput Phys Commun 2006;175(9):620–3.
[61] El Naqa I, Grigsby P, Apte A, Kidd E, Donnelly E, Khullar D, et al.Exploring feature-based approaches in PET images for predictingcancer treatment outcomes. Pattern Recognition 2009;42(6):1162–71.
[62] O'Sullivan F, Roy S, O'Sullivan J, Vernon C, Eary J. Incorporation oftumor shape into an assessment of spatial heterogeneity for humansarcomas imaged with FDG-PET. Biostatistics 2005;6(2):293–301.
[63] Jain AK. Fundamentals of digital image processing. New Jersey:Prentice-Hall, Inc.; 1988.
[64] Lam SWC. Texture feature extraction using gray level gradient basedco-occurence matrices. IEEE 1996;261:267–71.
[65] Haralick RM, Shanmugam K, Dinstein IH. Textural features for imageclassification. IEEE Trans Syst Man Cybern 1973;3(6):610–21.
[66] Galloway MM. Texture analysis using gray level run lengths. ComputGraph Image Process 1975;4(2):172–9.
[67] Castellano G, Bonilha L, Li LM, Cendes F. Texture analysis of medicalimages. Clin Radiol 2004;59(12):1061–9.
[68] Zinovev D, Raicu D, Furst J, Armato III SG. Predicting radiologicalpanel opinions using a panel of machine learning classifiers.Algorithms 2009;2(4):1473–502.
[69] Soh LK, Tsatsoulis C. Texture analysis of SAR sea ice imagery usinggray level co-occurrence matrices. IEEE Trans Geosci Remote Sens1999;37(2):780–95.
[70] Suárez J, Gancedo E, Álvarez JM, Morán A. Optimum compactnessstructures derived from the regular octahedron. Engineering Structures2008;30(11):3396–8.
[71] Tang X. Texture information in run-length matrices. IEEE Trans ImageProcess 1998;7(11):1602–9.
[72] Kramer K, Goldgof DB, Hall LO, Remsen A. Increased classificationaccuracy and speedup through pair-wise feature selection for supportvector machines. IEEE 2011:318–24.
[73] Song F, Guo Z, Mei D. Feature selection using principal componentanalysis. Yichang IEEE 2010:27–30.
[74] Heshmati A, Amjadifard R, Shanbehzadeh J. ReliefF-based featureselection for automatic tumor classification of mammogram images.Tehran IEEE 2011:1–5.
[75] Jain A, Zongker D. Feature selection: evaluation, application, andsmall sample performance. IEEE Trans Pattern Anal Mach Intell1997;19(2):153–8.
[76] Fu J, Lee SK,Wong STC,Yeh JY,WangAH,WuH. Image segmentationfeature selection and pattern classification for mammographic micro-calcifications. Comput Med Imaging Graph 2005;29(6):419–29.
[77] Liu J, Erdal S, Silvey SA, Ding J, Riedel JD, Marsh CB, et al. Toward afully de-identified biomedical information warehouse. AMIA AnnuSymp Proc 2009;2009:370–4.
[78] Freymann JB, Kirby JS, Perry JH, Clunie DA, Jaffe CC. Image datasharing for biomedical research — meeting HIPAA requirements forde-identification. J Digit Imaging 2012;25(1):14–24.

1248 V. Kumar et al. / Magnetic Resonance Imaging 30 (2012) 1234–1248
[79] Fenstermacher DA, Wenham RM, Rollison DE, Dalton WS.Implementing personalized medicine in a cancer center. Cancer J2011;17(6):528–36.
[80] Golub TR, Slonim DK, Tamayo P, Huard C, Gaasenbeek M, MesirovJP, et al. Molecular classification of cancer: class discovery and classprediction by gene expression monitoring. Science 1999;286(5439):531–7.
[81] Benjamini Y, Hochberg Y. Controlling the false discovery rate: apractical and powerful approach to multiple testing. J R Stat Soc B1995:289–300.
[82] Tusher VG, Tibshirani R, Chu G. Significance analysis of microarraysapplied to the ionizing radiation response. Proc Natl Acad Sci U S A2001;98(9):5116–21.
[83] Storey JD. The positive false discovery rate: a Bayesian interpretationand the q-value. Ann Stat 2003:2013–35.
[84] Reiner A, Yekutieli D, Benjamini Y. Identifying differentiallyexpressed genes using false discovery rate controlling procedures.Bioinformatics 2003;19(3):368–75.
[85] Jain A, Dubes R. Algorithms that cluster data. Englewood Cliffs, NJ:Prentice Hall; 1988.
[86] Wilkinson L, Friendly M. The history of the cluster heat map. Am Stat2009;63(2):179–84.
[87] Eschrich S, Yang I, Bloom G, Kwong KY, Boulware D, Cantor A,et al. Molecular staging for survival prediction of colorectal cancerpatients. J Clin Oncol 2005;23(15):3526–35.
[88] Shedden K, Taylor JM, Enkemann SA, Tsao MS, Yeatman TJ, GeraldWL, et al. Gene expression-based survival prediction in lung adenocar-cinoma: amulti-site, blinded validation study.NatMed 2008;14(8):822–7.
[89] Jolliffe IT. Principal component analysis. 2nd ed. New York: Springer;2002.
[90] Wold S, Ruhe A, Wold H, Dunn III W. The collinearity problem inlinear regression. The partial least squares (PLS) approach togeneralized inverses. SIAM J Sci Statist Comput 1984;5:735.
[91] Dupuy A, Simon RM. Critical review of published microarray studiesfor cancer outcome and guidelines on statistical analysis and reporting.J Natl Cancer Inst 2007;99(2):147–57.
[92] Simon RM, Paik S, Hayes DF. Use of archived specimens inevaluation of prognostic and predictive biomarkers. J Natl Cancer Inst2009;101(21):1446–52.
[93] Efron B. Bootstrap methods: another look at the jackknife. Ann Stat1979;7(1):1–26.
[94] Efron B. Estimating the error rate of a prediction rule: improvement oncross-validation. J Am Stat Assoc 1983:316–31.
[95] Dougherty ER. Small sample issues for microarray‐based classifica-tion. Compar Funct Genom 2001;2(1):28–34.
[96] Kim S, Dougherty ER, Barrera J, ChenY, BittnerML, Trent JM. Strongfeature sets from small samples. J Comput Biol 2002;9(1):127–46.
[97] Braga-Neto U, Hashimoto R, Dougherty ER, Nguyen DV, Carroll RJ.Is cross-validation better than resubstitution for ranking genes?Bioinformatics 2004;20(2):253–8.