Radeon GPU Profiler Documentation
85
Radeon GPU Profiler Documentation Release 1.12.0 AMD Developer Tools Jan 20, 2022
Transcript of Radeon GPU Profiler Documentation
Radeon GPU Profiler DocumentationRelease 1.12.0
AMD Developer Tools
Jan 20, 2022

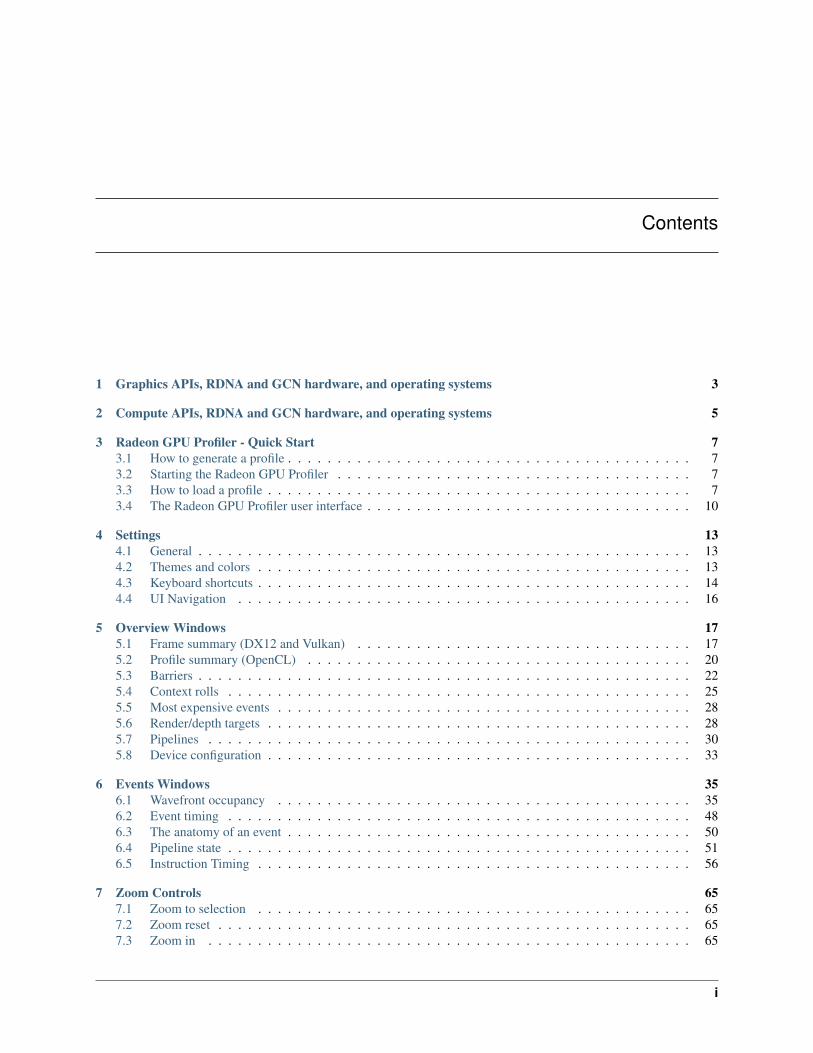
Contents
1 Graphics APIs, RDNA and GCN hardware, and operating systems 3
2 Compute APIs, RDNA and GCN hardware, and operating systems 5
3 Radeon GPU Profiler - Quick Start 73.1 How to generate a profile . . . . . . . . . . . . . . . . . . . . . . . . . . . . . . . . . . . . . . . . . 73.2 Starting the Radeon GPU Profiler . . . . . . . . . . . . . . . . . . . . . . . . . . . . . . . . . . . . 73.3 How to load a profile . . . . . . . . . . . . . . . . . . . . . . . . . . . . . . . . . . . . . . . . . . . 73.4 The Radeon GPU Profiler user interface . . . . . . . . . . . . . . . . . . . . . . . . . . . . . . . . . 10
4 Settings 134.1 General . . . . . . . . . . . . . . . . . . . . . . . . . . . . . . . . . . . . . . . . . . . . . . . . . . 134.2 Themes and colors . . . . . . . . . . . . . . . . . . . . . . . . . . . . . . . . . . . . . . . . . . . . 134.3 Keyboard shortcuts . . . . . . . . . . . . . . . . . . . . . . . . . . . . . . . . . . . . . . . . . . . . 144.4 UI Navigation . . . . . . . . . . . . . . . . . . . . . . . . . . . . . . . . . . . . . . . . . . . . . . 16
5 Overview Windows 175.1 Frame summary (DX12 and Vulkan) . . . . . . . . . . . . . . . . . . . . . . . . . . . . . . . . . . 175.2 Profile summary (OpenCL) . . . . . . . . . . . . . . . . . . . . . . . . . . . . . . . . . . . . . . . 205.3 Barriers . . . . . . . . . . . . . . . . . . . . . . . . . . . . . . . . . . . . . . . . . . . . . . . . . . 225.4 Context rolls . . . . . . . . . . . . . . . . . . . . . . . . . . . . . . . . . . . . . . . . . . . . . . . 255.5 Most expensive events . . . . . . . . . . . . . . . . . . . . . . . . . . . . . . . . . . . . . . . . . . 285.6 Render/depth targets . . . . . . . . . . . . . . . . . . . . . . . . . . . . . . . . . . . . . . . . . . . 285.7 Pipelines . . . . . . . . . . . . . . . . . . . . . . . . . . . . . . . . . . . . . . . . . . . . . . . . . 305.8 Device configuration . . . . . . . . . . . . . . . . . . . . . . . . . . . . . . . . . . . . . . . . . . . 33
6 Events Windows 356.1 Wavefront occupancy . . . . . . . . . . . . . . . . . . . . . . . . . . . . . . . . . . . . . . . . . . 356.2 Event timing . . . . . . . . . . . . . . . . . . . . . . . . . . . . . . . . . . . . . . . . . . . . . . . 486.3 The anatomy of an event . . . . . . . . . . . . . . . . . . . . . . . . . . . . . . . . . . . . . . . . . 506.4 Pipeline state . . . . . . . . . . . . . . . . . . . . . . . . . . . . . . . . . . . . . . . . . . . . . . . 516.5 Instruction Timing . . . . . . . . . . . . . . . . . . . . . . . . . . . . . . . . . . . . . . . . . . . . 56
7 Zoom Controls 657.1 Zoom to selection . . . . . . . . . . . . . . . . . . . . . . . . . . . . . . . . . . . . . . . . . . . . 657.2 Zoom reset . . . . . . . . . . . . . . . . . . . . . . . . . . . . . . . . . . . . . . . . . . . . . . . . 657.3 Zoom in . . . . . . . . . . . . . . . . . . . . . . . . . . . . . . . . . . . . . . . . . . . . . . . . . 65
i
7.4 Zoom out . . . . . . . . . . . . . . . . . . . . . . . . . . . . . . . . . . . . . . . . . . . . . . . . . 667.5 Zoom Panning . . . . . . . . . . . . . . . . . . . . . . . . . . . . . . . . . . . . . . . . . . . . . . 667.6 Synchronized Zoom . . . . . . . . . . . . . . . . . . . . . . . . . . . . . . . . . . . . . . . . . . . 66
8 User Debug Markers 678.1 DirectX12 User Markers . . . . . . . . . . . . . . . . . . . . . . . . . . . . . . . . . . . . . . . . . 678.2 Using PIX3 event instrumentation for DirectX12 user debug markers . . . . . . . . . . . . . . . . . 678.3 Using AGS for DirectX12 user debug markers . . . . . . . . . . . . . . . . . . . . . . . . . . . . . 698.4 Vulkan User Markers . . . . . . . . . . . . . . . . . . . . . . . . . . . . . . . . . . . . . . . . . . . 728.5 Viewing User Markers . . . . . . . . . . . . . . . . . . . . . . . . . . . . . . . . . . . . . . . . . . 72
9 RenderDoc & Radeon GPU Profiler interop BETA 759.1 Intended usage . . . . . . . . . . . . . . . . . . . . . . . . . . . . . . . . . . . . . . . . . . . . . . 759.2 Obtaining a profile from RenderDoc . . . . . . . . . . . . . . . . . . . . . . . . . . . . . . . . . . . 759.3 Navigating between events . . . . . . . . . . . . . . . . . . . . . . . . . . . . . . . . . . . . . . . . 769.4 Known limitations . . . . . . . . . . . . . . . . . . . . . . . . . . . . . . . . . . . . . . . . . . . . 809.5 Disclaimer . . . . . . . . . . . . . . . . . . . . . . . . . . . . . . . . . . . . . . . . . . . . . . . . 80
ii
Radeon GPU Profiler Documentation, Release 1.12.0
The Radeon GPU Profiler is a performance tool that can be used by developers to optimize DirectX®12, Vulkan®and OpenCL™ applications for AMD RDNA™ and GCN hardware. It is part of a suite of tools comprised of thefollowing software:
• Radeon Developer Mode Driver - This is shipped as part of the AMD public Adrenaline driver and supportsthe developer mode features required for profiling.
• Radeon Developer Service (RDS) - A system tray application that unlocks the Developer Mode Driver featuresand supports communications with high level tools. A headless version is also available called RadeonDevelop-erServiceCLI.
• Radeon Developer Panel (RDP) - A GUI application that allows the developer to configure driver settings andgenerate profiler data from DirectX12, Vulkan and OpenCL applications.
• Radeon GPU Profiler (RGP) - A GUI tool used to visualize and analyze the profile data.
This document describes how to generate a profile using the Radeon Developer Panel and how the RadeonGPU Profiler can be used to examine the output profiles. The Radeon GPU Profiler is currently designed towork with compute applications and frame based graphics applications. It is specifically designed to addressthe issues that developers are dealing with in the move from traditional graphics APIs to explicit APIs. It alsoprovides the visualization of GCN hardware specific information allowing the developer to tune an applicationto the full potential of the architecture. The tool provides unique visualizations of queue synchronization usingfences and semaphores, asynchronous compute, and barrier timings. Currently, it supports the explicit graphicsAPIs (DirectX12 and Vulkan), compute APIs (OpenCL) and will NOT work with older graphics APIs such asDirectX11 or OpenGL.
Contents 1
Radeon GPU Profiler Documentation, Release 1.12.0
2 Contents
CHAPTER 1
Graphics APIs, RDNA and GCN hardware, and operating systems
Supported APIs
• DirectX12
• Vulkan
Supported RDNA and GCN hardware
• AMD Radeon RX 6000 series
• AMD Radeon RX 5000 series
• AMD Radeon VII
• AMD RX Vega 64 and RX Vega 56
• AMD Ryzen™ Processors with Radeon Vega Graphics
• AMD Radeon R9 Fury and Nano series
• AMD Radeon RX 400 and RX 500 series
• AMD Tonga R9 285, R9 380
Supported Operating Systems
• Windows® 10
• Windows® 11
• Ubuntu 18.04 LTS (Vulkan only)
• Ubuntu 20.04 LTS (Vulkan only)
3

Radeon GPU Profiler Documentation, Release 1.12.0
4 Chapter 1. Graphics APIs, RDNA and GCN hardware, and operating systems
CHAPTER 2
Compute APIs, RDNA and GCN hardware, and operating systems
Supported APIs
• OpenCL
Supported RDNA and GCN hardware
• AMD Radeon RX 6000 series
• AMD Radeon RX 5000 series
• AMD Radeon VII
• AMD RX Vega 64 and RX Vega 56
• AMD Ryzen Processors with Radeon Vega Graphics
Supported Operating Systems
• Windows 10
• Windows 11
5
Radeon GPU Profiler Documentation, Release 1.12.0
6 Chapter 2. Compute APIs, RDNA and GCN hardware, and operating systems
CHAPTER 3
Radeon GPU Profiler - Quick Start
3.1 How to generate a profile
The first thing you will need to do is generate a profile. Currently, this is done via the Radeon Developer Panel. Readthe documentation provided with this distribution for information on how to capture a profile. This can be obtainedfrom within the Radeon Developer Panel or from the link on the Radeon GPU Profiler “Welcome” view. The RadeonDeveloper Panel documentation can also be viewed online at: https://radeon-developer-panel.readthedocs.io/en/latest/
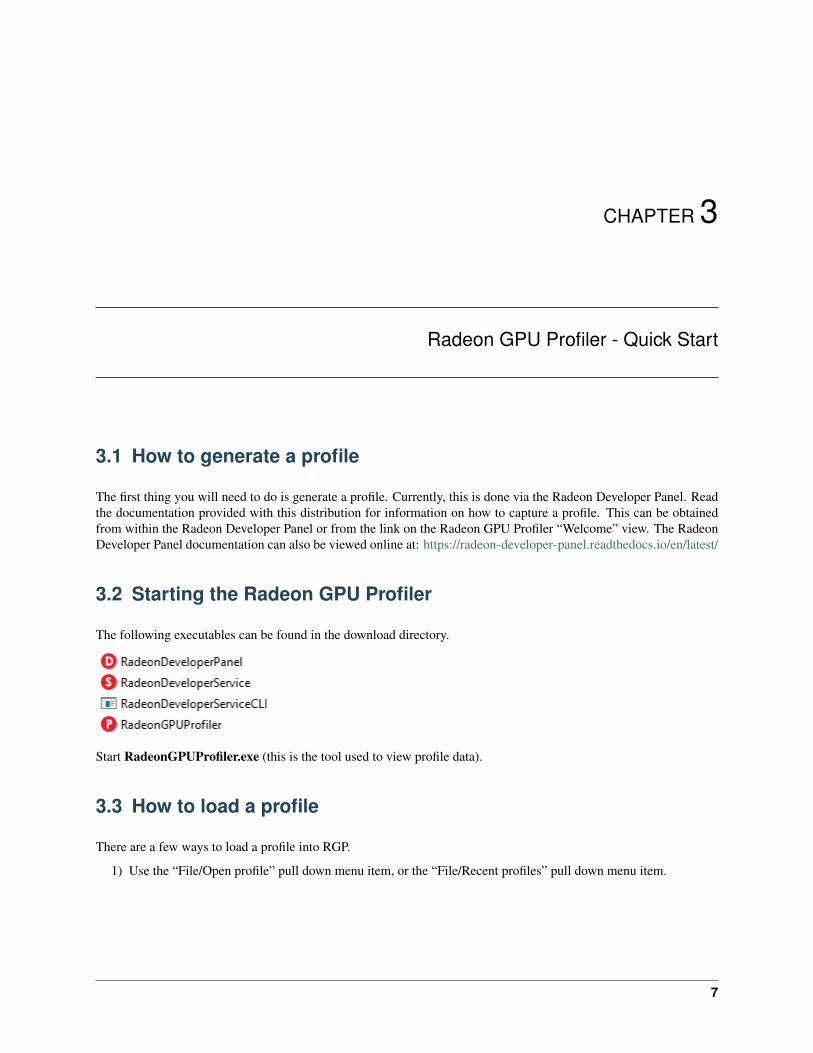
3.2 Starting the Radeon GPU Profiler
The following executables can be found in the download directory.
Start RadeonGPUProfiler.exe (this is the tool used to view profile data).
3.3 How to load a profile
There are a few ways to load a profile into RGP.
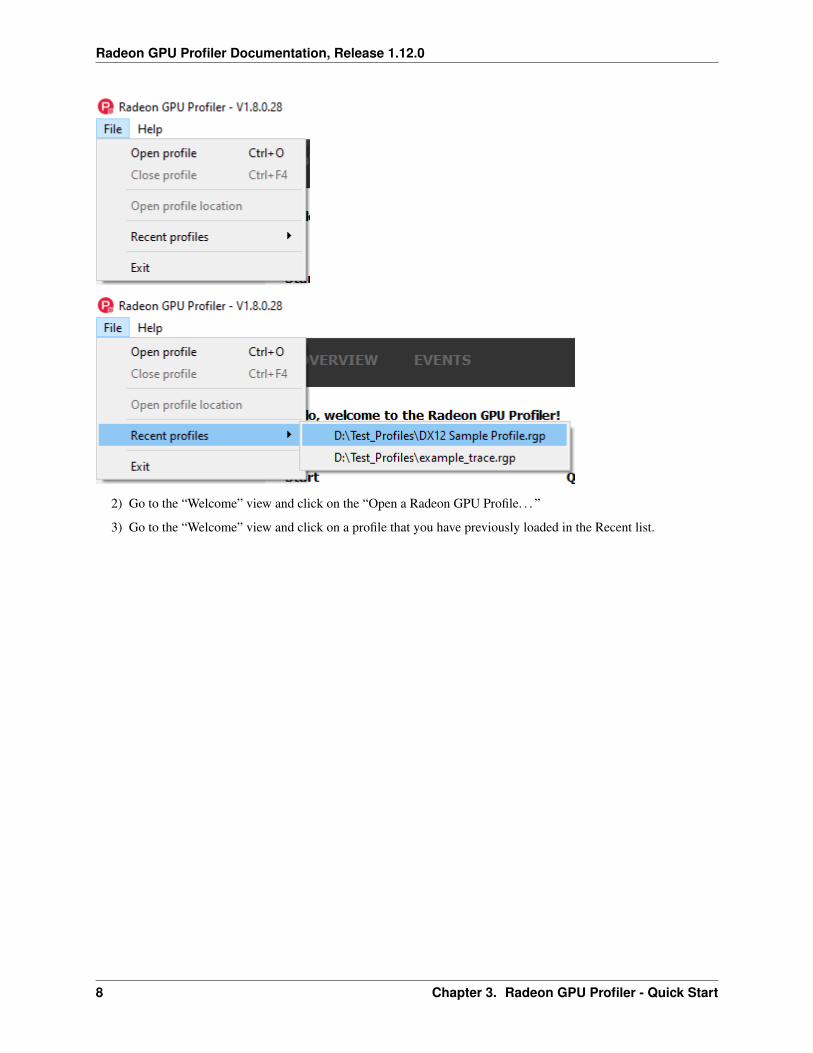
1) Use the “File/Open profile” pull down menu item, or the “File/Recent profiles” pull down menu item.
7
Radeon GPU Profiler Documentation, Release 1.12.0
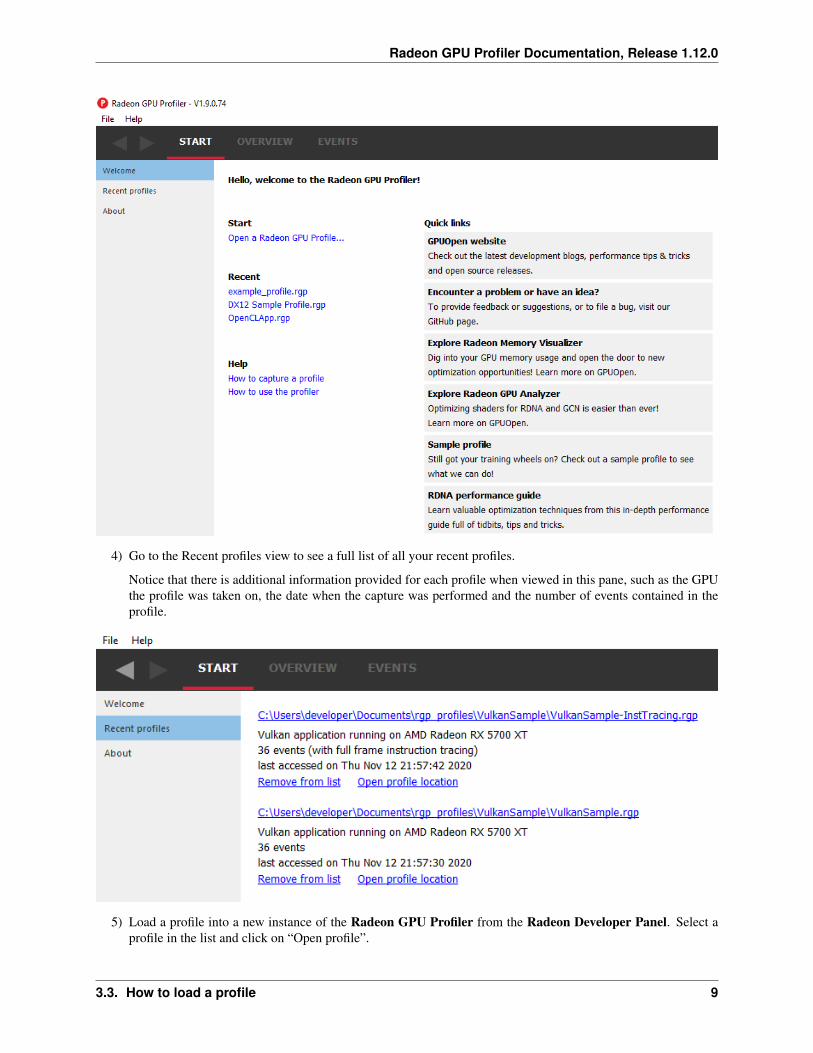
2) Go to the “Welcome” view and click on the “Open a Radeon GPU Profile. . . ”
3) Go to the “Welcome” view and click on a profile that you have previously loaded in the Recent list.
8 Chapter 3. Radeon GPU Profiler - Quick Start
Radeon GPU Profiler Documentation, Release 1.12.0
4) Go to the Recent profiles view to see a full list of all your recent profiles.
Notice that there is additional information provided for each profile when viewed in this pane, such as the GPUthe profile was taken on, the date when the capture was performed and the number of events contained in theprofile.
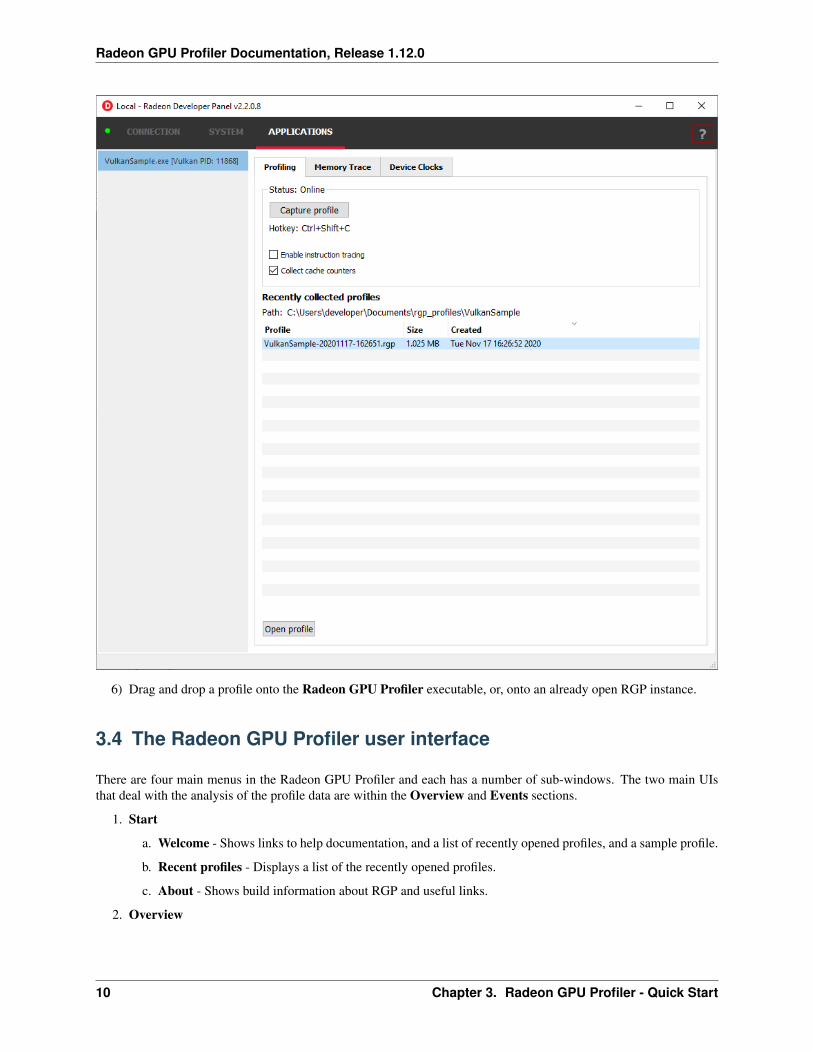
5) Load a profile into a new instance of the Radeon GPU Profiler from the Radeon Developer Panel. Select aprofile in the list and click on “Open profile”.
3.3. How to load a profile 9
Radeon GPU Profiler Documentation, Release 1.12.0
6) Drag and drop a profile onto the Radeon GPU Profiler executable, or, onto an already open RGP instance.
3.4 The Radeon GPU Profiler user interface
There are four main menus in the Radeon GPU Profiler and each has a number of sub-windows. The two main UIsthat deal with the analysis of the profile data are within the Overview and Events sections.
1. Start
a. Welcome - Shows links to help documentation, and a list of recently opened profiles, and a sample profile.
b. Recent profiles - Displays a list of the recently opened profiles.
c. About - Shows build information about RGP and useful links.
2. Overview
10 Chapter 3. Radeon GPU Profiler - Quick Start
Radeon GPU Profiler Documentation, Release 1.12.0
a. Frame Summary - Contains a summary of the structure of the graphics frame. This overview section isnot available for OpenCL profiles.
b. Profile Summary - Contains a summary of the structure of the OpenCL profile.
c. Barriers - Details of the barrier usage in the profile.
d. Context rolls - Details of the hardware context register usage. This overview section is not available forOpenCL profiles.
e. Most expensive events - List of the most expensive events.
f. Render/depth targets - Overview of render targets used throughout the graphics frame. This overviewsection is not available for OpenCL profiles.
g. Pipelines - Details of the pipeline usage in the profile.
h. Device configuration - Information about the GPU the profile was generated on.
3. Events
a. Wavefront occupancy - Shows detailed information about wavefront occupancy and event timings.
b. Event timing - Tree view of profile events and their timing data.
c. Pipeline state - Tree view of profile events and their graphics/compute pipeline state.
d. Instruction timing - Shows detailed instruction timing information for each instruction of a single shader.
4. Settings
a. General - Adjust desired time units, state buckets, GPU boundness percentage, and wavefront view detaillevels.
b. Themes and colors - Customize colors for graphics API and hardware data.
c. Keyboard shortcuts - Shortcuts for navigating various parts of the UI.
3.4. The Radeon GPU Profiler user interface 11
Radeon GPU Profiler Documentation, Release 1.12.0
12 Chapter 3. Radeon GPU Profiler - Quick Start

CHAPTER 4
Settings
4.1 General
Check for updates on startup: Radeon GPU Profiler will check for an available update during startup. If an updateis available, a notification will appear on the Welcome page
Units: This tells the profiler whether to work in clocks, nanoseconds, microseconds, or milliseconds. Refer to thekeyboard binding in the section below to quickly toggle between these time units.
State buckets: Specify how the profiler should generate its own state buckets. This can be based off a combination ofshader base address, depth buffer address, render target address and API PSO hash.
Sync event time windows: Keep the Wavefront Occupancy and Event Timing panes in sync while browsing throughdifferent time ranges.
Processor boundness: Specific to the Frame Summary and Profile Summary, this value will tell RGP at which pointto consider an application as being GPU bound or CPU bound.
Wavefront occupancy detail: Increase the visual quality of wavefronts in the Wavefront Occupancy pane. Thisallows users to see a more accurate representation of GPU occupancy at the expense of some profiler performance.
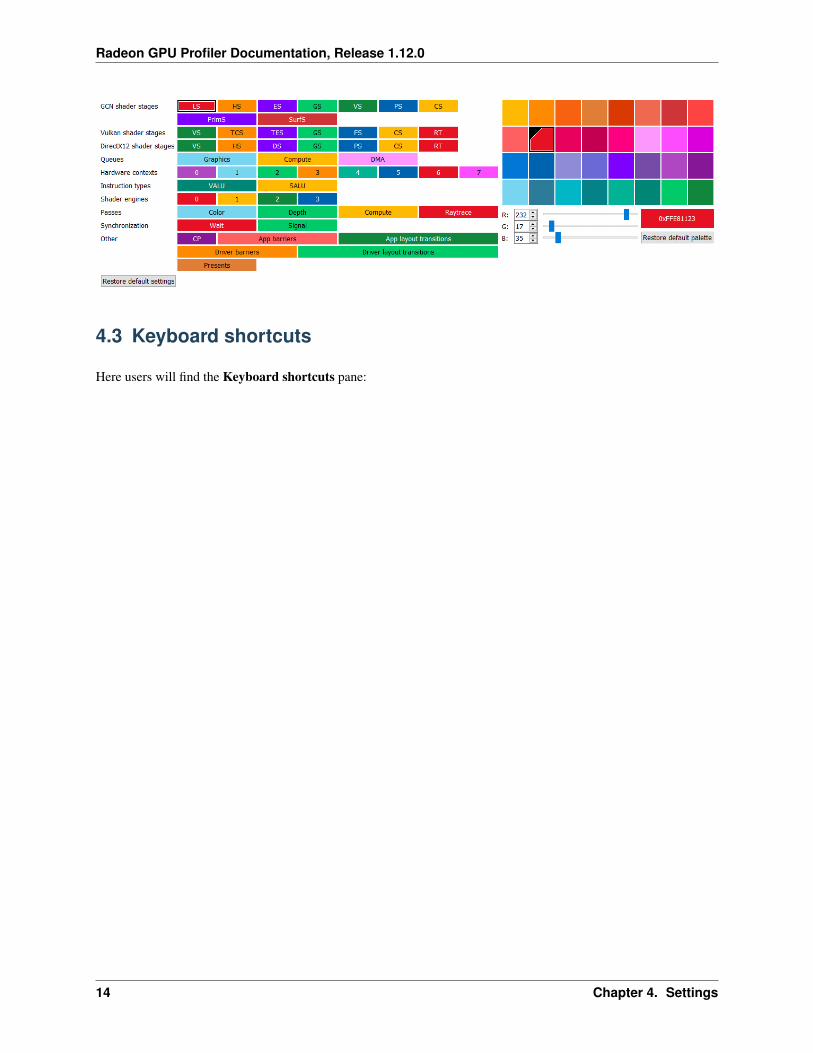
4.2 Themes and colors
The profiler makes heavy use of coloring to display its information. This pane allows users to thoroughly customizethose colors.
13
Radeon GPU Profiler Documentation, Release 1.12.0
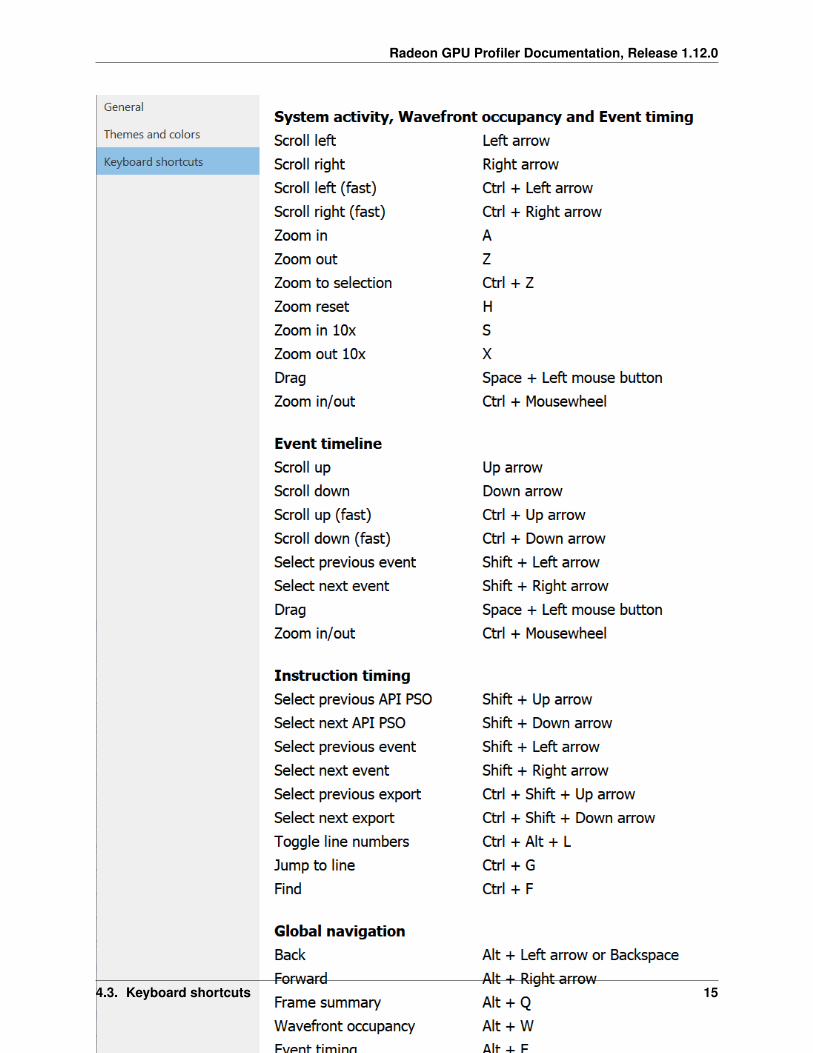
4.3 Keyboard shortcuts
Here users will find the Keyboard shortcuts pane:
14 Chapter 4. Settings
Radeon GPU Profiler Documentation, Release 1.12.0
4.3. Keyboard shortcuts 15
Radeon GPU Profiler Documentation, Release 1.12.0
The System activity, Wavefront occupancy and Event timing shortcuts are specific to zooming and panning oper-ations that can be performed within the Frame Summary and Events subtabs. See the section entitled Zoom Controlsfor more information.
The Event timeline section refers to panning and event selection operations for the bottom graph within the Wavefrontoccupancy view.
The Instruction timing section refers to keystrokes to change API PSO, event and export selection, toggle line num-bers, and jump to a specific instruction.
The Global navigation section refers to keystrokes that aid user navigation, and are always detected regardless ofwhich pane is visible.
The Global hotkeys section refers to any hotkeys available anywhere in the product. Pressing CTRL + T allows theuser to quickly cycle through the different time units (cycles, milliseconds, microseconds or nanoseconds) from anypane, rather than having to go to the settings. The user can also open or close a profile from any pane using the Globalhotkeys.
We encourage all users to adopt these keystrokes while using RGP.
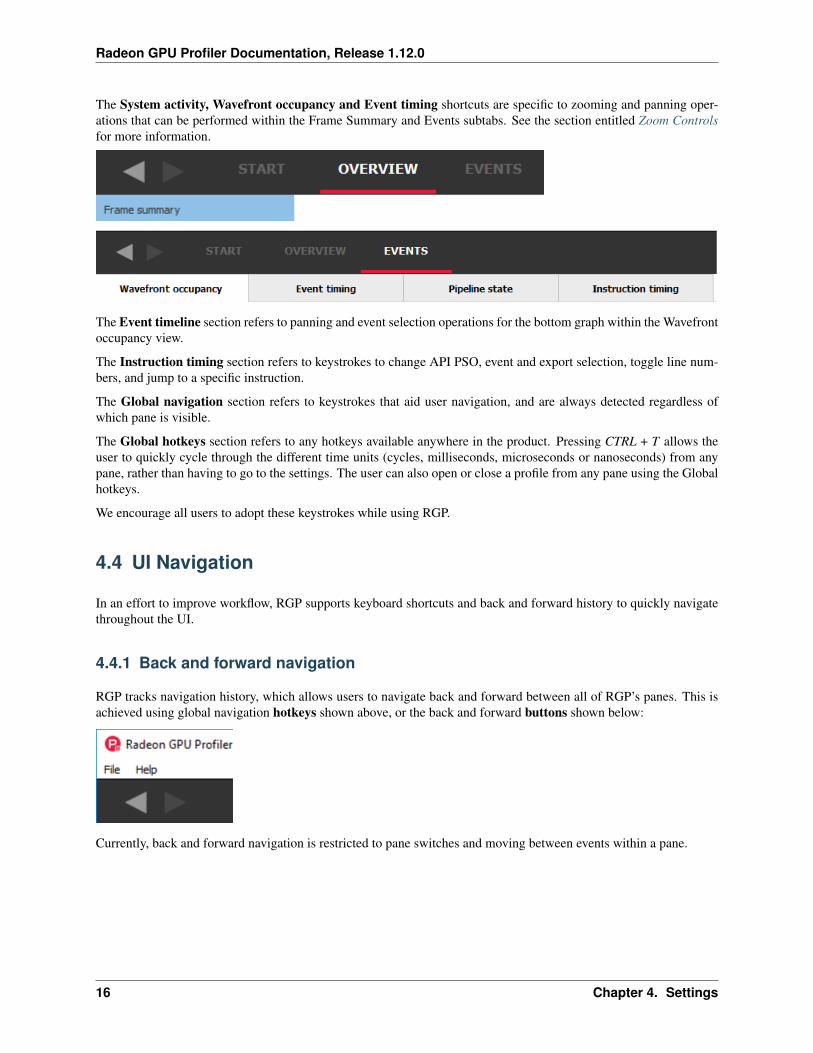
4.4 UI Navigation
In an effort to improve workflow, RGP supports keyboard shortcuts and back and forward history to quickly navigatethroughout the UI.
4.4.1 Back and forward navigation
RGP tracks navigation history, which allows users to navigate back and forward between all of RGP’s panes. This isachieved using global navigation hotkeys shown above, or the back and forward buttons shown below:
Currently, back and forward navigation is restricted to pane switches and moving between events within a pane.
16 Chapter 4. Settings
CHAPTER 5
Overview Windows
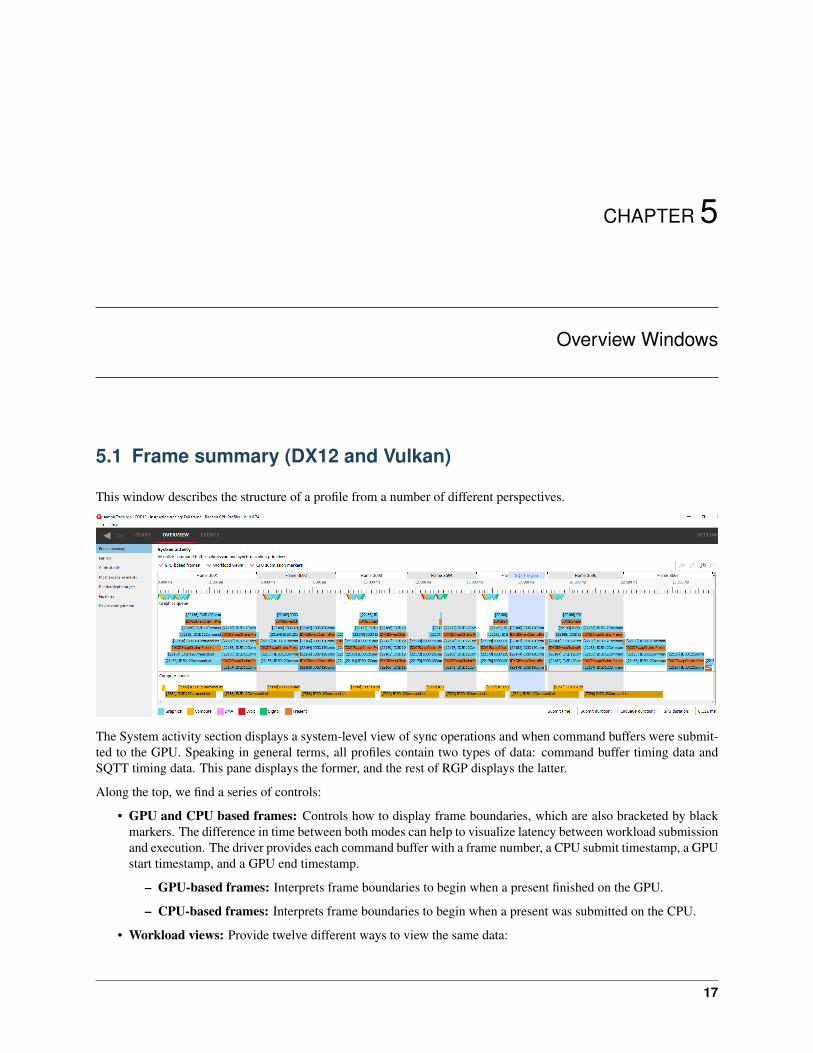
5.1 Frame summary (DX12 and Vulkan)
This window describes the structure of a profile from a number of different perspectives.
The System activity section displays a system-level view of sync operations and when command buffers were submit-ted to the GPU. Speaking in general terms, all profiles contain two types of data: command buffer timing data andSQTT timing data. This pane displays the former, and the rest of RGP displays the latter.
Along the top, we find a series of controls:
• GPU and CPU based frames: Controls how to display frame boundaries, which are also bracketed by blackmarkers. The difference in time between both modes can help to visualize latency between workload submissionand execution. The driver provides each command buffer with a frame number, a CPU submit timestamp, a GPUstart timestamp, and a GPU end timestamp.
– GPU-based frames: Interprets frame boundaries to begin when a present finished on the GPU.
– CPU-based frames: Interprets frame boundaries to begin when a present was submitted on the CPU.
• Workload views: Provide twelve different ways to view the same data:
17
Radeon GPU Profiler Documentation, Release 1.12.0
– Command buffers: Shows a list of all command buffers in a submission. Disabling this will condense allcommand buffers into a single submission block which also specifies the number of contained commandbuffers.
– Sync objects: Toggles whether to display signals and waits.
– Sequential: An alternate view which shows data linearly as opposed to stacked. The dark right-mostportion of command buffers and submits indicates execution time on the GPU.
– GPU only: A flat view of the data which represents solely GPU work. This helps visualize parallelismamong all GPU queues.
• CPU submission markers: Draw vertical lines to help visualize when the CPU issued certain types of work-loads to the GPU.
• Zoom controls: Consistent with the rest of the tool, these allow users to drill down into points of interest. Moreinformation can be found under the Zoom Controls section.
In the middle, we find the actual view. Each queue (Graphics, Compute, Copy) gets its own section. The alternatinggrey and white backgrounds indicate frame boundaries. The blue region indicates which command buffers wereprofiled with SQTT data, for more detailed event analysis in other sections of the tool. Note that command buffers arevisualized using two shades of the same color. The lighter shade represents time spent prior to reaching the GPU, andthe darker shade represents actual execution.
Please note that the view is interactive, making it possible for users to select and highlight command buffers, syncobjects, and submission points.
Users can correlate between command buffer timing data and SQTT data by right-clicking on a command buffer withinthe “Detailed GPU events” region. This will bring up a context menu which contains three menu items for finding thefirst event within the selected command buffer. Selecting one of the menu items will navigate to the appropriate paneand set focus on the specified event.
Along the bottom, we find information about user selections:
• Submit time: Specifies when work was issued by the CPU
• Submit duration: Specifies the full duration of the submit
• Enqueue duration: Specifies how long the work was queued before beginning on the GPU
• GPU duration: Specifies how long the GPU took to execute it.
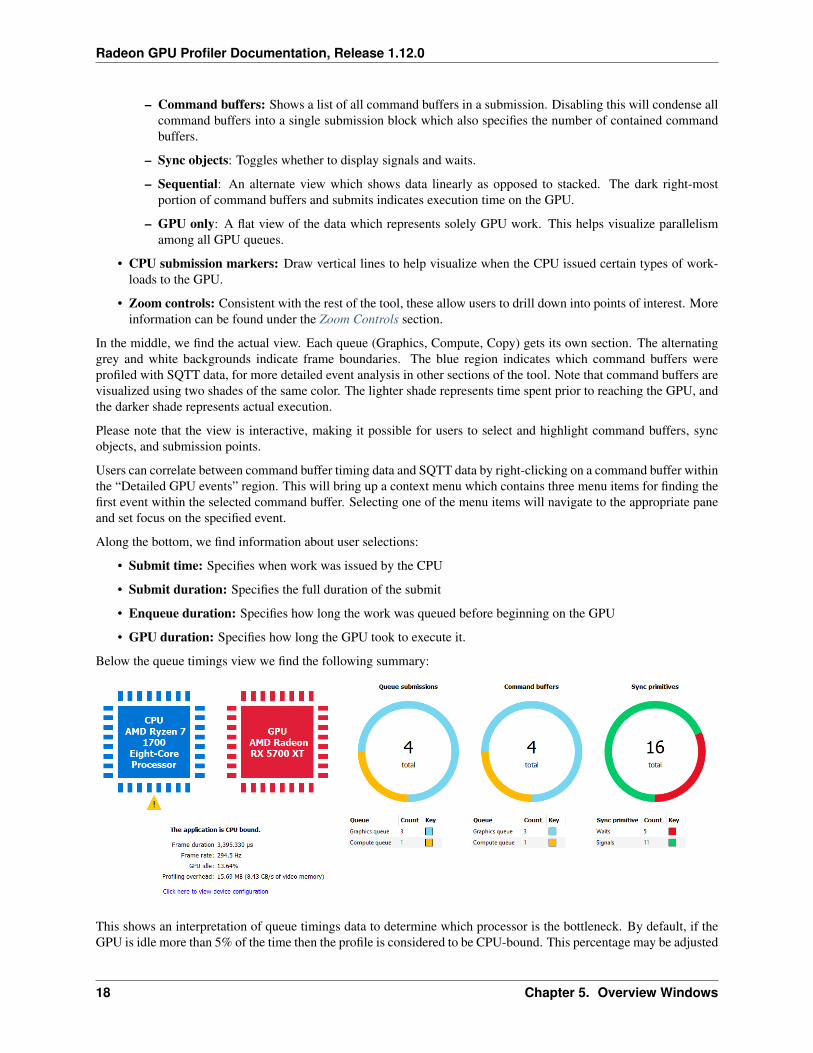
Below the queue timings view we find the following summary:
This shows an interpretation of queue timings data to determine which processor is the bottleneck. By default, if theGPU is idle more than 5% of the time then the profile is considered to be CPU-bound. This percentage may be adjusted
18 Chapter 5. Overview Windows
Radeon GPU Profiler Documentation, Release 1.12.0
in RGP settings.
Please note that the values displayed for Frame duration and Frame rate are sourced from SQTT data. In otherwords, they are based on duration and shader clock frequency used in other RGP panes such as Wavefront occupancy.
The Profiling overhead shows the amount of profiling data that was written to video memory by the hardware whilegathering the RGP profile. The profiling overhead is also expressed in terms of memory bandwidth used to write thedata. The profiling overhead is comprised of both SQTT data and the cache counter data collected while profiling.
The Queue submissions and Command buffers pie charts show the number of queue submissions and commandbuffers in the frame broken down by the Direct and Compute queues. Compute submissions are colored in yellowand graphics submissions are colored in light blue. The Sync Primitives section counts how many unique signal andwait objects were detected throughout the profile. Please note that only signals and waits from queue operations areincluded in the profile data. For instance, any Vulkan signals originating from vkAcquireNextImageKHR will notappear since that is not a queue operation.
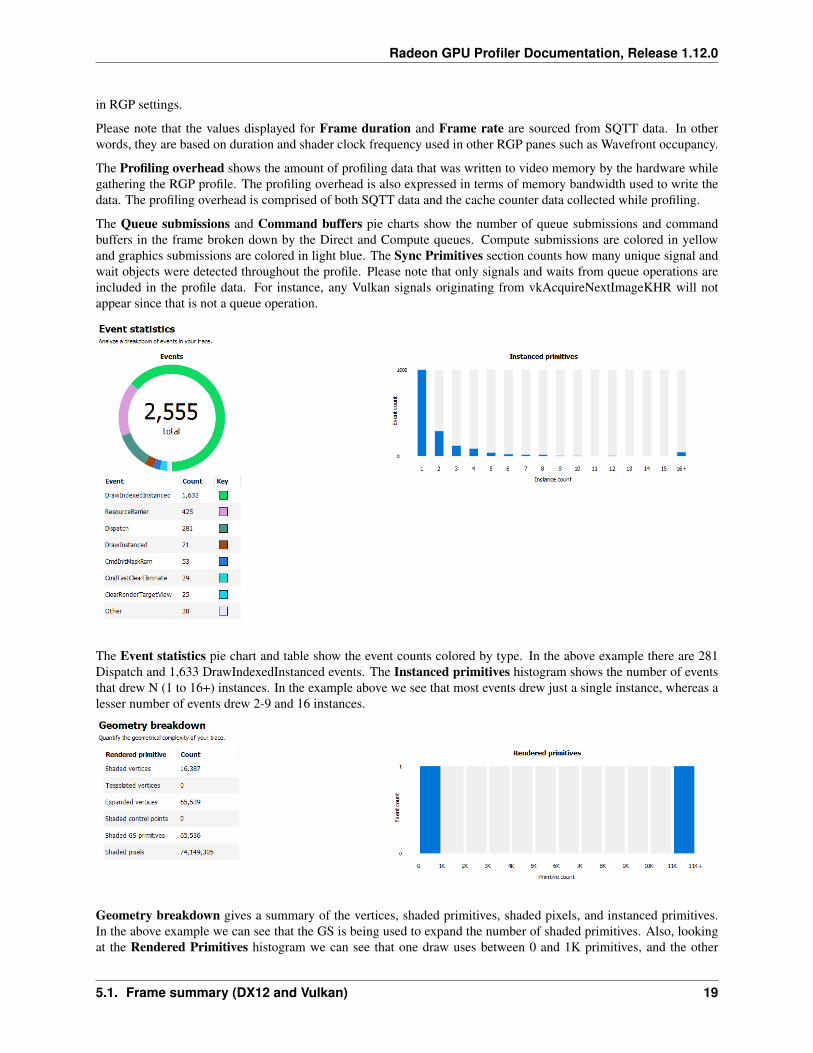
The Event statistics pie chart and table show the event counts colored by type. In the above example there are 281Dispatch and 1,633 DrawIndexedInstanced events. The Instanced primitives histogram shows the number of eventsthat drew N (1 to 16+) instances. In the example above we see that most events drew just a single instance, whereas alesser number of events drew 2-9 and 16 instances.
Geometry breakdown gives a summary of the vertices, shaded primitives, shaded pixels, and instanced primitives.In the above example we can see that the GS is being used to expand the number of shaded primitives. Also, lookingat the Rendered Primitives histogram we can see that one draw uses between 0 and 1K primitives, and the other
5.1. Frame summary (DX12 and Vulkan) 19
Radeon GPU Profiler Documentation, Release 1.12.0
draw call uses 11k or more primitives. This makes sense given that the profile is from the D3D12nBodyGravity SDKsample.
5.2 Profile summary (OpenCL)
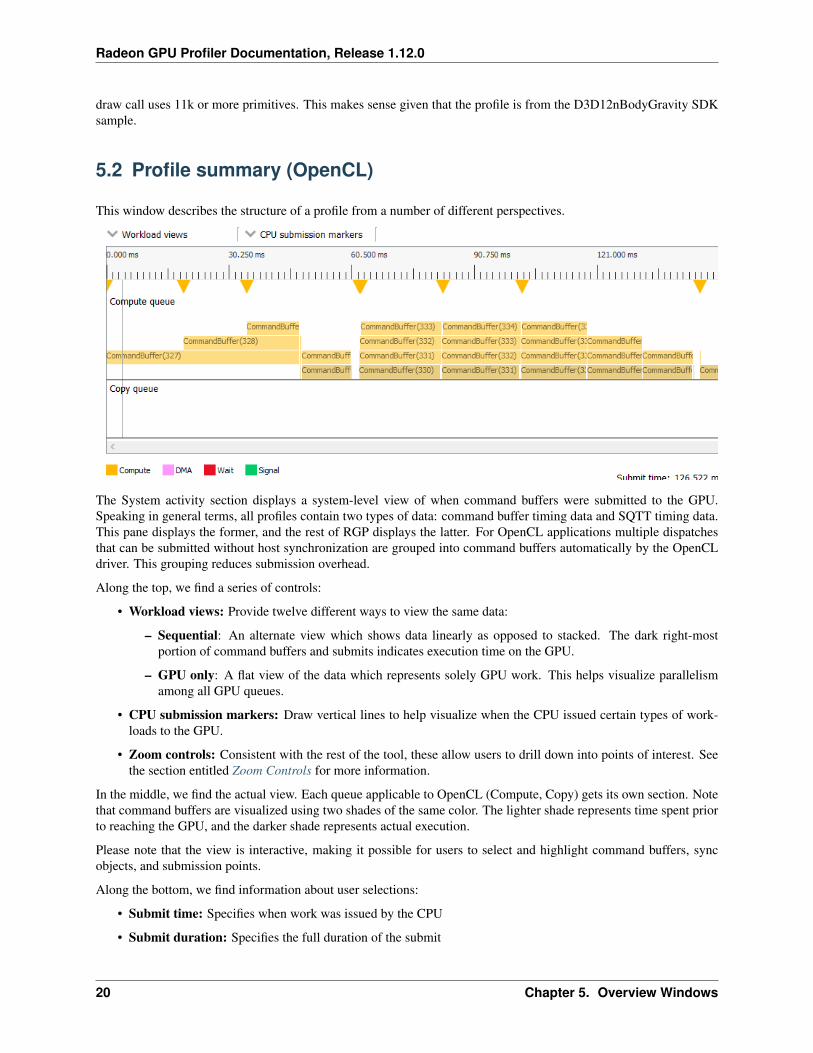
This window describes the structure of a profile from a number of different perspectives.
The System activity section displays a system-level view of when command buffers were submitted to the GPU.Speaking in general terms, all profiles contain two types of data: command buffer timing data and SQTT timing data.This pane displays the former, and the rest of RGP displays the latter. For OpenCL applications multiple dispatchesthat can be submitted without host synchronization are grouped into command buffers automatically by the OpenCLdriver. This grouping reduces submission overhead.
Along the top, we find a series of controls:
• Workload views: Provide twelve different ways to view the same data:
– Sequential: An alternate view which shows data linearly as opposed to stacked. The dark right-mostportion of command buffers and submits indicates execution time on the GPU.
– GPU only: A flat view of the data which represents solely GPU work. This helps visualize parallelismamong all GPU queues.
• CPU submission markers: Draw vertical lines to help visualize when the CPU issued certain types of work-loads to the GPU.
• Zoom controls: Consistent with the rest of the tool, these allow users to drill down into points of interest. Seethe section entitled Zoom Controls for more information.
In the middle, we find the actual view. Each queue applicable to OpenCL (Compute, Copy) gets its own section. Notethat command buffers are visualized using two shades of the same color. The lighter shade represents time spent priorto reaching the GPU, and the darker shade represents actual execution.
Please note that the view is interactive, making it possible for users to select and highlight command buffers, syncobjects, and submission points.
Along the bottom, we find information about user selections:
• Submit time: Specifies when work was issued by the CPU
• Submit duration: Specifies the full duration of the submit
20 Chapter 5. Overview Windows
Radeon GPU Profiler Documentation, Release 1.12.0
• Enqueue duration: Specifies how long the work was queued before beginning on the GPU
• GPU duration: Specifies how long the GPU took to execute it.
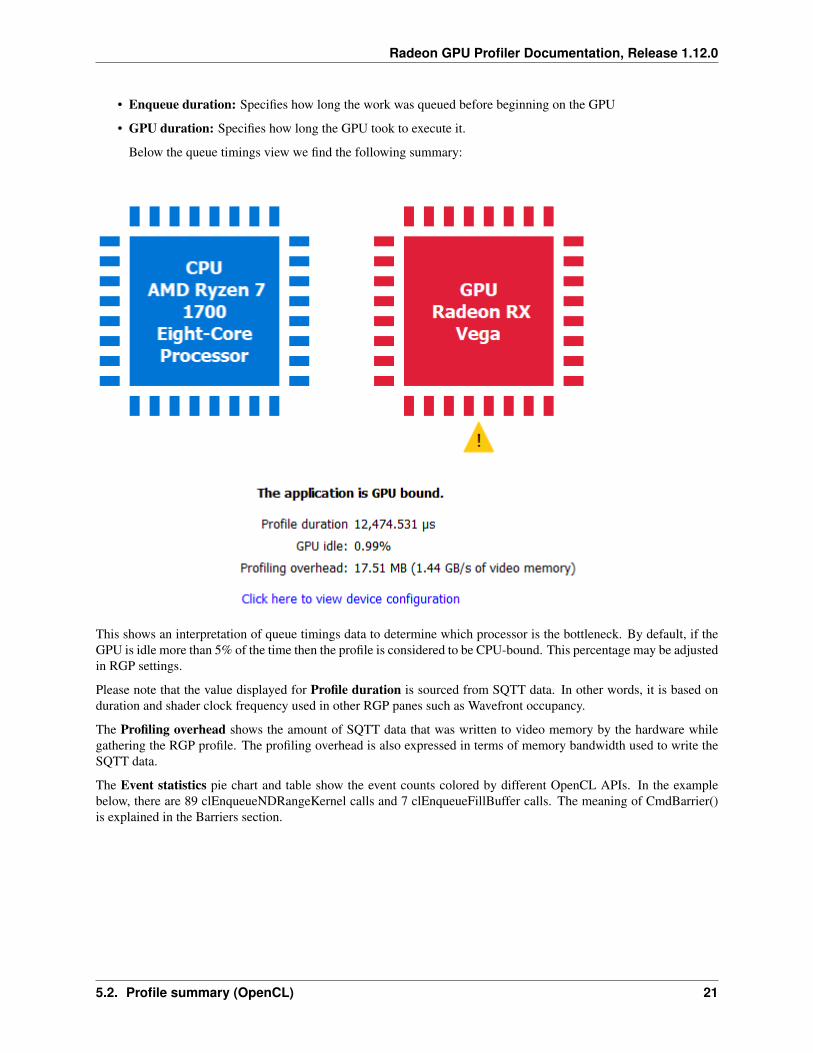
Below the queue timings view we find the following summary:
This shows an interpretation of queue timings data to determine which processor is the bottleneck. By default, if theGPU is idle more than 5% of the time then the profile is considered to be CPU-bound. This percentage may be adjustedin RGP settings.
Please note that the value displayed for Profile duration is sourced from SQTT data. In other words, it is based onduration and shader clock frequency used in other RGP panes such as Wavefront occupancy.
The Profiling overhead shows the amount of SQTT data that was written to video memory by the hardware whilegathering the RGP profile. The profiling overhead is also expressed in terms of memory bandwidth used to write theSQTT data.
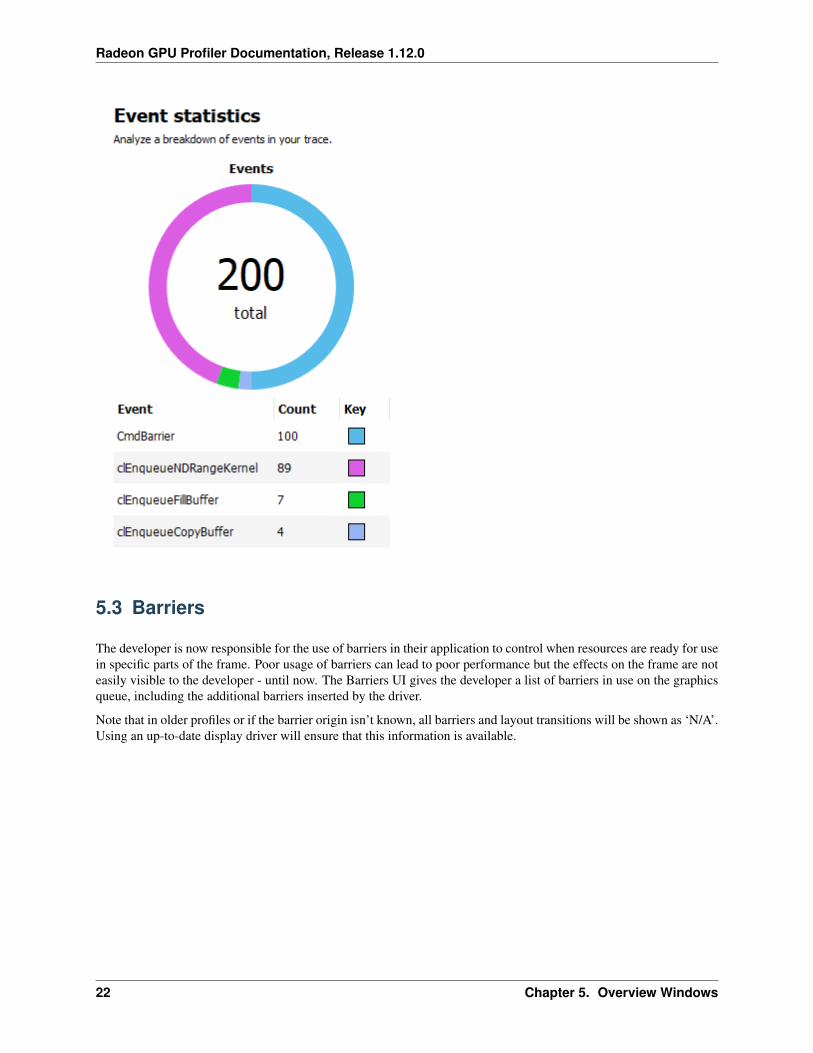
The Event statistics pie chart and table show the event counts colored by different OpenCL APIs. In the examplebelow, there are 89 clEnqueueNDRangeKernel calls and 7 clEnqueueFillBuffer calls. The meaning of CmdBarrier()is explained in the Barriers section.
5.2. Profile summary (OpenCL) 21
Radeon GPU Profiler Documentation, Release 1.12.0
5.3 Barriers
The developer is now responsible for the use of barriers in their application to control when resources are ready for usein specific parts of the frame. Poor usage of barriers can lead to poor performance but the effects on the frame are noteasily visible to the developer - until now. The Barriers UI gives the developer a list of barriers in use on the graphicsqueue, including the additional barriers inserted by the driver.
Note that in older profiles or if the barrier origin isn’t known, all barriers and layout transitions will be shown as ‘N/A’.Using an up-to-date display driver will ensure that this information is available.
22 Chapter 5. Overview Windows
Radeon GPU Profiler Documentation, Release 1.12.0
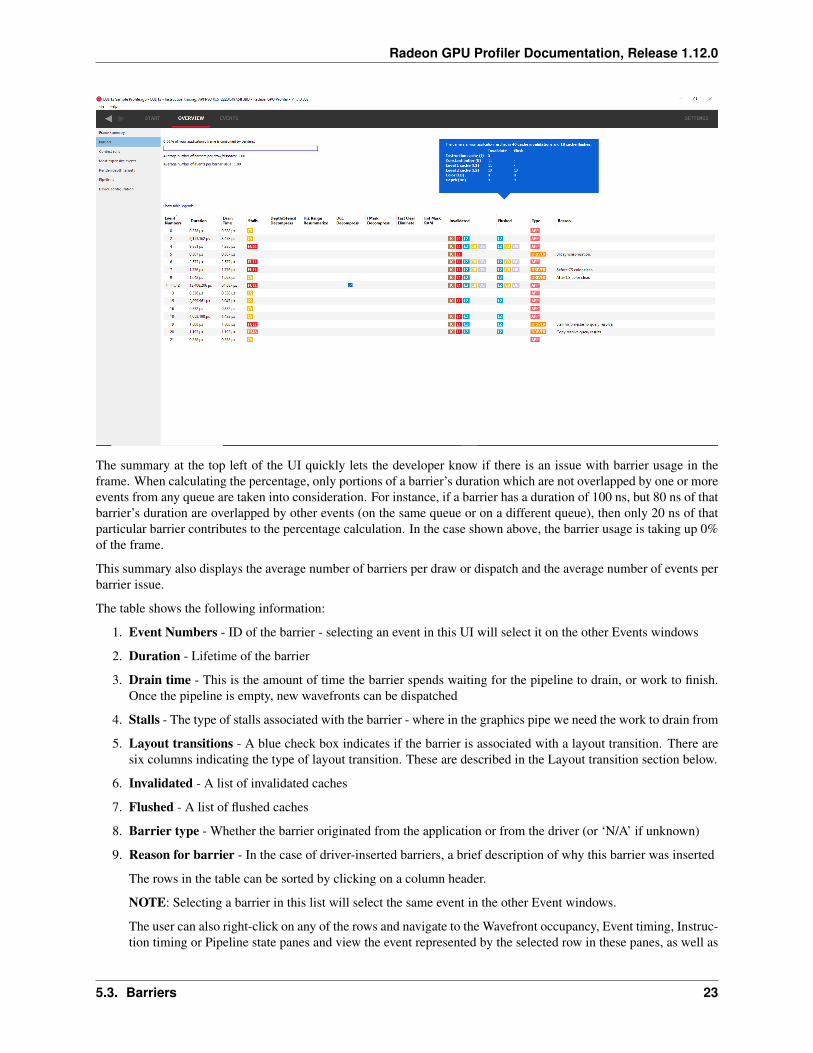
The summary at the top left of the UI quickly lets the developer know if there is an issue with barrier usage in theframe. When calculating the percentage, only portions of a barrier’s duration which are not overlapped by one or moreevents from any queue are taken into consideration. For instance, if a barrier has a duration of 100 ns, but 80 ns of thatbarrier’s duration are overlapped by other events (on the same queue or on a different queue), then only 20 ns of thatparticular barrier contributes to the percentage calculation. In the case shown above, the barrier usage is taking up 0%of the frame.
This summary also displays the average number of barriers per draw or dispatch and the average number of events perbarrier issue.
The table shows the following information:
1. Event Numbers - ID of the barrier - selecting an event in this UI will select it on the other Events windows
2. Duration - Lifetime of the barrier
3. Drain time - This is the amount of time the barrier spends waiting for the pipeline to drain, or work to finish.Once the pipeline is empty, new wavefronts can be dispatched
4. Stalls - The type of stalls associated with the barrier - where in the graphics pipe we need the work to drain from
5. Layout transitions - A blue check box indicates if the barrier is associated with a layout transition. There aresix columns indicating the type of layout transition. These are described in the Layout transition section below.
6. Invalidated - A list of invalidated caches
7. Flushed - A list of flushed caches
8. Barrier type - Whether the barrier originated from the application or from the driver (or ‘N/A’ if unknown)
9. Reason for barrier - In the case of driver-inserted barriers, a brief description of why this barrier was inserted
The rows in the table can be sorted by clicking on a column header.
NOTE: Selecting a barrier in this list will select the same event in the other Event windows.
The user can also right-click on any of the rows and navigate to the Wavefront occupancy, Event timing, Instruc-tion timing or Pipeline state panes and view the event represented by the selected row in these panes, as well as
5.3. Barriers 23
Radeon GPU Profiler Documentation, Release 1.12.0
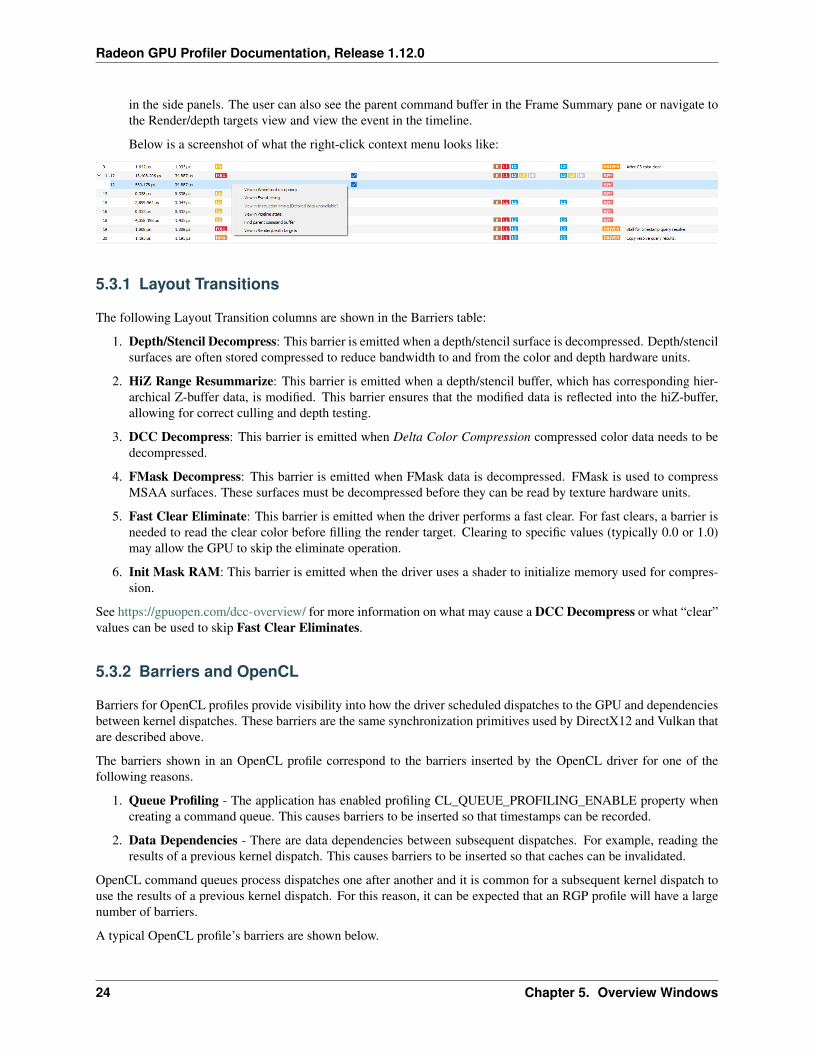
in the side panels. The user can also see the parent command buffer in the Frame Summary pane or navigate tothe Render/depth targets view and view the event in the timeline.
Below is a screenshot of what the right-click context menu looks like:
5.3.1 Layout Transitions
The following Layout Transition columns are shown in the Barriers table:
1. Depth/Stencil Decompress: This barrier is emitted when a depth/stencil surface is decompressed. Depth/stencilsurfaces are often stored compressed to reduce bandwidth to and from the color and depth hardware units.
2. HiZ Range Resummarize: This barrier is emitted when a depth/stencil buffer, which has corresponding hier-archical Z-buffer data, is modified. This barrier ensures that the modified data is reflected into the hiZ-buffer,allowing for correct culling and depth testing.
3. DCC Decompress: This barrier is emitted when Delta Color Compression compressed color data needs to bedecompressed.
4. FMask Decompress: This barrier is emitted when FMask data is decompressed. FMask is used to compressMSAA surfaces. These surfaces must be decompressed before they can be read by texture hardware units.
5. Fast Clear Eliminate: This barrier is emitted when the driver performs a fast clear. For fast clears, a barrier isneeded to read the clear color before filling the render target. Clearing to specific values (typically 0.0 or 1.0)may allow the GPU to skip the eliminate operation.
6. Init Mask RAM: This barrier is emitted when the driver uses a shader to initialize memory used for compres-sion.
See https://gpuopen.com/dcc-overview/ for more information on what may cause a DCC Decompress or what “clear”values can be used to skip Fast Clear Eliminates.
5.3.2 Barriers and OpenCL
Barriers for OpenCL profiles provide visibility into how the driver scheduled dispatches to the GPU and dependenciesbetween kernel dispatches. These barriers are the same synchronization primitives used by DirectX12 and Vulkan thatare described above.
The barriers shown in an OpenCL profile correspond to the barriers inserted by the OpenCL driver for one of thefollowing reasons.
1. Queue Profiling - The application has enabled profiling CL_QUEUE_PROFILING_ENABLE property whencreating a command queue. This causes barriers to be inserted so that timestamps can be recorded.
2. Data Dependencies - There are data dependencies between subsequent dispatches. For example, reading theresults of a previous kernel dispatch. This causes barriers to be inserted so that caches can be invalidated.
OpenCL command queues process dispatches one after another and it is common for a subsequent kernel dispatch touse the results of a previous kernel dispatch. For this reason, it can be expected that an RGP profile will have a largenumber of barriers.
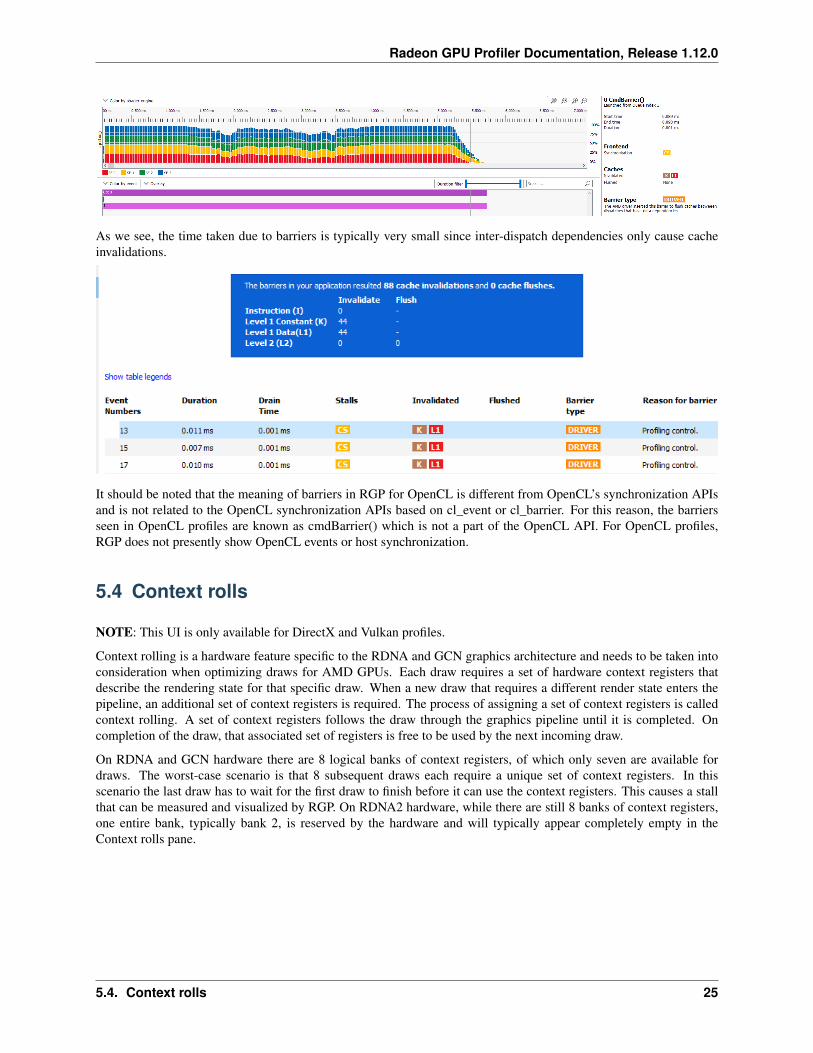
A typical OpenCL profile’s barriers are shown below.
24 Chapter 5. Overview Windows
Radeon GPU Profiler Documentation, Release 1.12.0
As we see, the time taken due to barriers is typically very small since inter-dispatch dependencies only cause cacheinvalidations.
It should be noted that the meaning of barriers in RGP for OpenCL is different from OpenCL’s synchronization APIsand is not related to the OpenCL synchronization APIs based on cl_event or cl_barrier. For this reason, the barriersseen in OpenCL profiles are known as cmdBarrier() which is not a part of the OpenCL API. For OpenCL profiles,RGP does not presently show OpenCL events or host synchronization.
5.4 Context rolls
NOTE: This UI is only available for DirectX and Vulkan profiles.
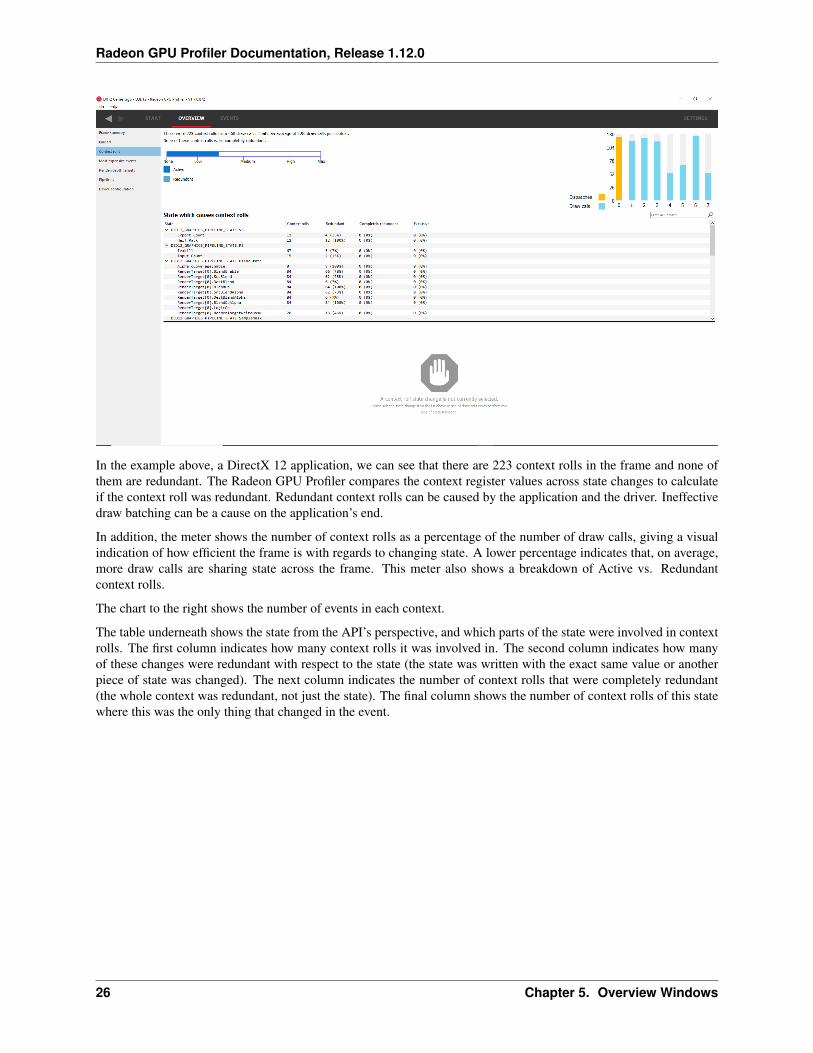
Context rolling is a hardware feature specific to the RDNA and GCN graphics architecture and needs to be taken intoconsideration when optimizing draws for AMD GPUs. Each draw requires a set of hardware context registers thatdescribe the rendering state for that specific draw. When a new draw that requires a different render state enters thepipeline, an additional set of context registers is required. The process of assigning a set of context registers is calledcontext rolling. A set of context registers follows the draw through the graphics pipeline until it is completed. Oncompletion of the draw, that associated set of registers is free to be used by the next incoming draw.
On RDNA and GCN hardware there are 8 logical banks of context registers, of which only seven are available fordraws. The worst-case scenario is that 8 subsequent draws each require a unique set of context registers. In thisscenario the last draw has to wait for the first draw to finish before it can use the context registers. This causes a stallthat can be measured and visualized by RGP. On RDNA2 hardware, while there are still 8 banks of context registers,one entire bank, typically bank 2, is reserved by the hardware and will typically appear completely empty in theContext rolls pane.
5.4. Context rolls 25
Radeon GPU Profiler Documentation, Release 1.12.0
In the example above, a DirectX 12 application, we can see that there are 223 context rolls in the frame and none ofthem are redundant. The Radeon GPU Profiler compares the context register values across state changes to calculateif the context roll was redundant. Redundant context rolls can be caused by the application and the driver. Ineffectivedraw batching can be a cause on the application’s end.
In addition, the meter shows the number of context rolls as a percentage of the number of draw calls, giving a visualindication of how efficient the frame is with regards to changing state. A lower percentage indicates that, on average,more draw calls are sharing state across the frame. This meter also shows a breakdown of Active vs. Redundantcontext rolls.
The chart to the right shows the number of events in each context.
The table underneath shows the state from the API’s perspective, and which parts of the state were involved in contextrolls. The first column indicates how many context rolls it was involved in. The second column indicates how manyof these changes were redundant with respect to the state (the state was written with the exact same value or anotherpiece of state was changed). The next column indicates the number of context rolls that were completely redundant(the whole context was redundant, not just the state). The final column shows the number of context rolls of this statewhere this was the only thing that changed in the event.
26 Chapter 5. Overview Windows
Radeon GPU Profiler Documentation, Release 1.12.0
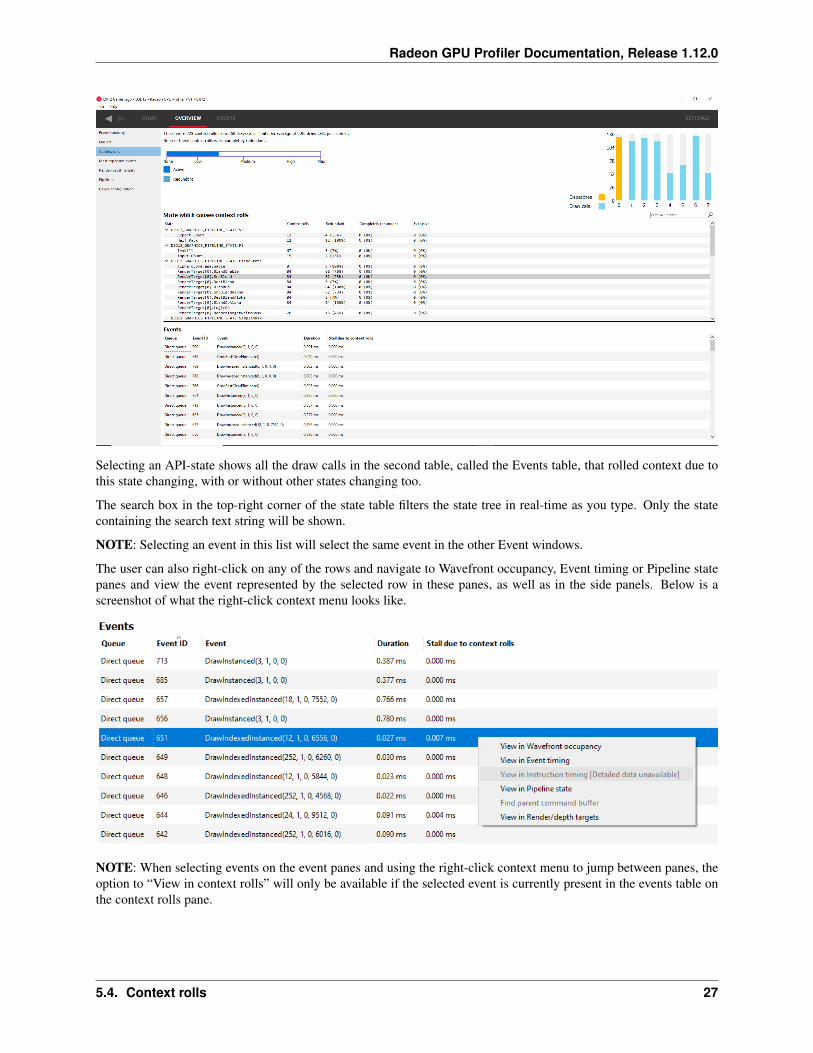
Selecting an API-state shows all the draw calls in the second table, called the Events table, that rolled context due tothis state changing, with or without other states changing too.
The search box in the top-right corner of the state table filters the state tree in real-time as you type. Only the statecontaining the search text string will be shown.
NOTE: Selecting an event in this list will select the same event in the other Event windows.
The user can also right-click on any of the rows and navigate to Wavefront occupancy, Event timing or Pipeline statepanes and view the event represented by the selected row in these panes, as well as in the side panels. Below is ascreenshot of what the right-click context menu looks like.
NOTE: When selecting events on the event panes and using the right-click context menu to jump between panes, theoption to “View in context rolls” will only be available if the selected event is currently present in the events table onthe context rolls pane.
5.4. Context rolls 27
Radeon GPU Profiler Documentation, Release 1.12.0
5.5 Most expensive events
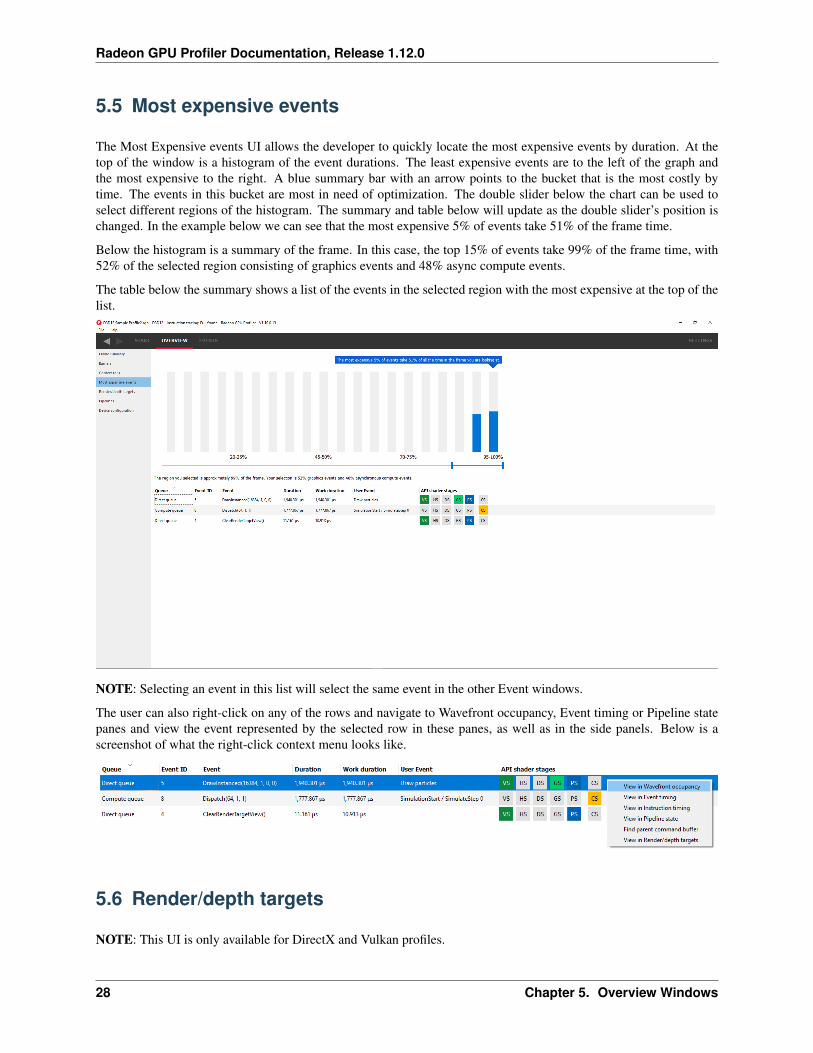
The Most Expensive events UI allows the developer to quickly locate the most expensive events by duration. At thetop of the window is a histogram of the event durations. The least expensive events are to the left of the graph andthe most expensive to the right. A blue summary bar with an arrow points to the bucket that is the most costly bytime. The events in this bucket are most in need of optimization. The double slider below the chart can be used toselect different regions of the histogram. The summary and table below will update as the double slider’s position ischanged. In the example below we can see that the most expensive 5% of events take 51% of the frame time.
Below the histogram is a summary of the frame. In this case, the top 15% of events take 99% of the frame time, with52% of the selected region consisting of graphics events and 48% async compute events.
The table below the summary shows a list of the events in the selected region with the most expensive at the top of thelist.
NOTE: Selecting an event in this list will select the same event in the other Event windows.
The user can also right-click on any of the rows and navigate to Wavefront occupancy, Event timing or Pipeline statepanes and view the event represented by the selected row in these panes, as well as in the side panels. Below is ascreenshot of what the right-click context menu looks like.
5.6 Render/depth targets
NOTE: This UI is only available for DirectX and Vulkan profiles.
28 Chapter 5. Overview Windows
Radeon GPU Profiler Documentation, Release 1.12.0
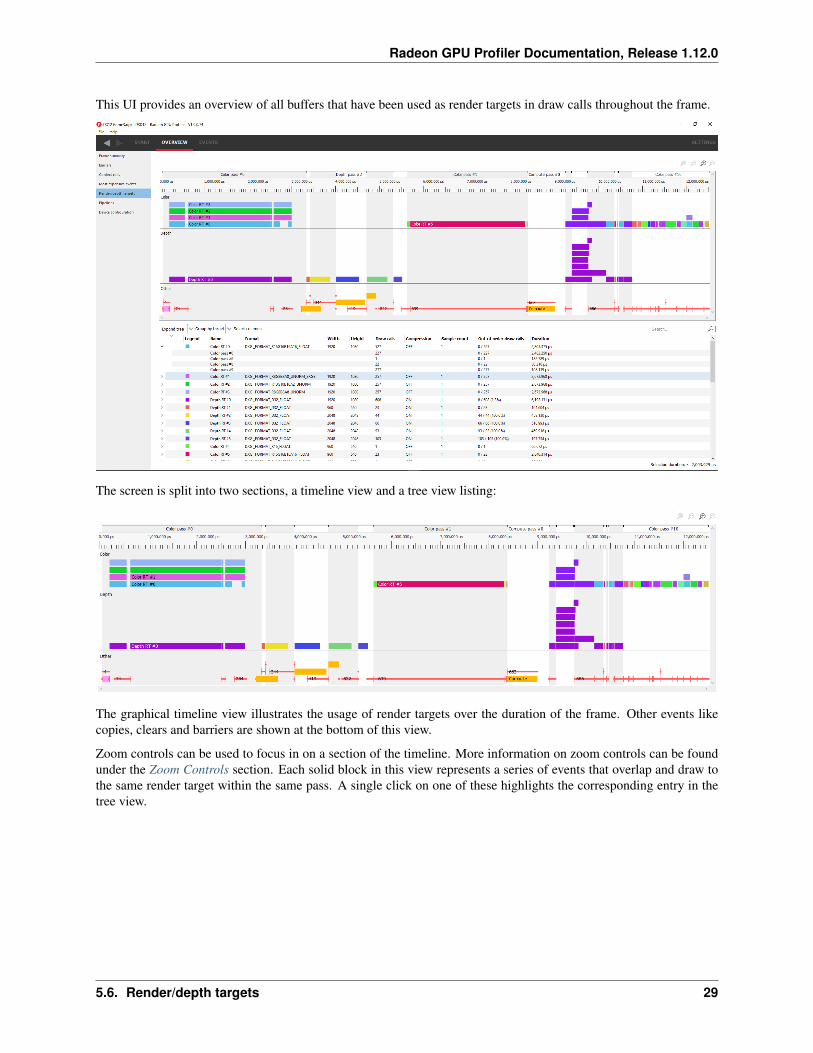
This UI provides an overview of all buffers that have been used as render targets in draw calls throughout the frame.
The screen is split into two sections, a timeline view and a tree view listing:
The graphical timeline view illustrates the usage of render targets over the duration of the frame. Other events likecopies, clears and barriers are shown at the bottom of this view.
Zoom controls can be used to focus in on a section of the timeline. More information on zoom controls can be foundunder the Zoom Controls section. Each solid block in this view represents a series of events that overlap and draw tothe same render target within the same pass. A single click on one of these highlights the corresponding entry in thetree view.
5.6. Render/depth targets 29
Radeon GPU Profiler Documentation, Release 1.12.0
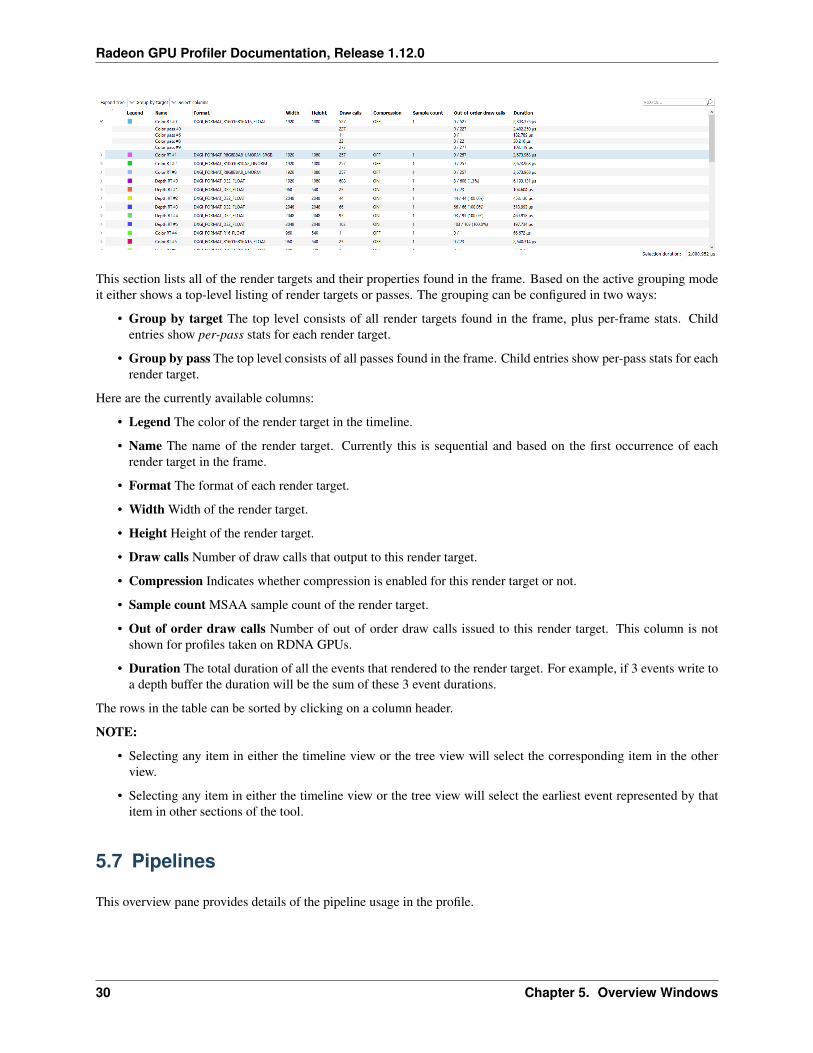
This section lists all of the render targets and their properties found in the frame. Based on the active grouping modeit either shows a top-level listing of render targets or passes. The grouping can be configured in two ways:
• Group by target The top level consists of all render targets found in the frame, plus per-frame stats. Childentries show per-pass stats for each render target.
• Group by pass The top level consists of all passes found in the frame. Child entries show per-pass stats for eachrender target.
Here are the currently available columns:
• Legend The color of the render target in the timeline.
• Name The name of the render target. Currently this is sequential and based on the first occurrence of eachrender target in the frame.
• Format The format of each render target.
• Width Width of the render target.
• Height Height of the render target.
• Draw calls Number of draw calls that output to this render target.
• Compression Indicates whether compression is enabled for this render target or not.
• Sample count MSAA sample count of the render target.
• Out of order draw calls Number of out of order draw calls issued to this render target. This column is notshown for profiles taken on RDNA GPUs.
• Duration The total duration of all the events that rendered to the render target. For example, if 3 events write toa depth buffer the duration will be the sum of these 3 event durations.
The rows in the table can be sorted by clicking on a column header.
NOTE:
• Selecting any item in either the timeline view or the tree view will select the corresponding item in the otherview.
• Selecting any item in either the timeline view or the tree view will select the earliest event represented by thatitem in other sections of the tool.
5.7 Pipelines
This overview pane provides details of the pipeline usage in the profile.
30 Chapter 5. Overview Windows
Radeon GPU Profiler Documentation, Release 1.12.0
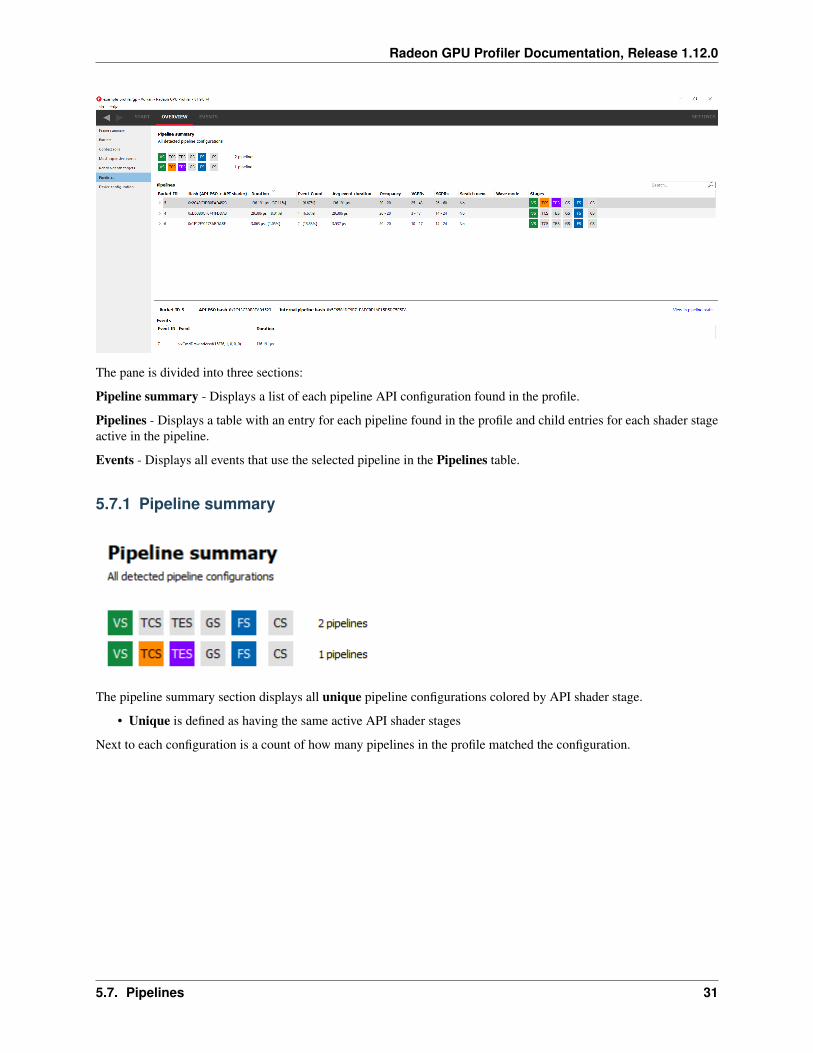
The pane is divided into three sections:
Pipeline summary - Displays a list of each pipeline API configuration found in the profile.
Pipelines - Displays a table with an entry for each pipeline found in the profile and child entries for each shader stageactive in the pipeline.
Events - Displays all events that use the selected pipeline in the Pipelines table.
5.7.1 Pipeline summary
The pipeline summary section displays all unique pipeline configurations colored by API shader stage.
• Unique is defined as having the same active API shader stages
Next to each configuration is a count of how many pipelines in the profile matched the configuration.
5.7. Pipelines 31
Radeon GPU Profiler Documentation, Release 1.12.0
5.7.2 Pipelines
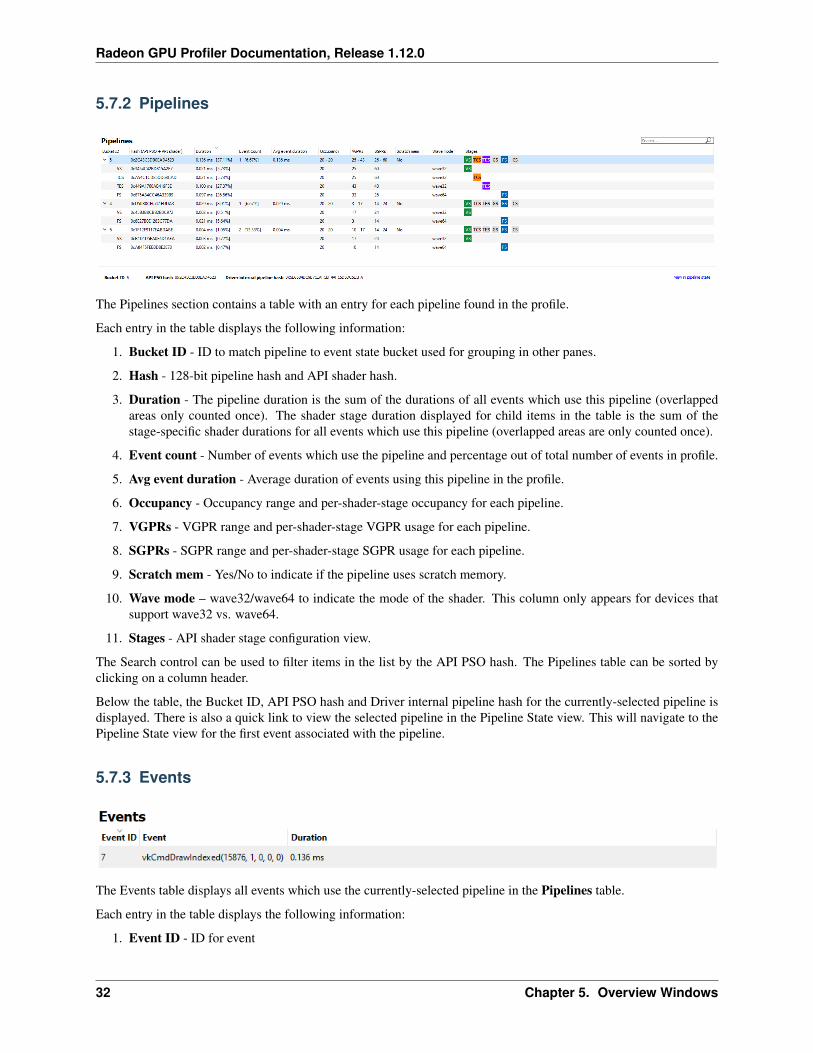
The Pipelines section contains a table with an entry for each pipeline found in the profile.
Each entry in the table displays the following information:
1. Bucket ID - ID to match pipeline to event state bucket used for grouping in other panes.
2. Hash - 128-bit pipeline hash and API shader hash.
3. Duration - The pipeline duration is the sum of the durations of all events which use this pipeline (overlappedareas only counted once). The shader stage duration displayed for child items in the table is the sum of thestage-specific shader durations for all events which use this pipeline (overlapped areas are only counted once).
4. Event count - Number of events which use the pipeline and percentage out of total number of events in profile.
5. Avg event duration - Average duration of events using this pipeline in the profile.
6. Occupancy - Occupancy range and per-shader-stage occupancy for each pipeline.
7. VGPRs - VGPR range and per-shader-stage VGPR usage for each pipeline.
8. SGPRs - SGPR range and per-shader-stage SGPR usage for each pipeline.
9. Scratch mem - Yes/No to indicate if the pipeline uses scratch memory.
10. Wave mode – wave32/wave64 to indicate the mode of the shader. This column only appears for devices thatsupport wave32 vs. wave64.
11. Stages - API shader stage configuration view.
The Search control can be used to filter items in the list by the API PSO hash. The Pipelines table can be sorted byclicking on a column header.
Below the table, the Bucket ID, API PSO hash and Driver internal pipeline hash for the currently-selected pipeline isdisplayed. There is also a quick link to view the selected pipeline in the Pipeline State view. This will navigate to thePipeline State view for the first event associated with the pipeline.
5.7.3 Events
The Events table displays all events which use the currently-selected pipeline in the Pipelines table.
Each entry in the table displays the following information:
1. Event ID - ID for event
32 Chapter 5. Overview Windows
Radeon GPU Profiler Documentation, Release 1.12.0
2. Event - Event text displaying the API or Driver call for event
3. Duration - Time event spent during frame in profile
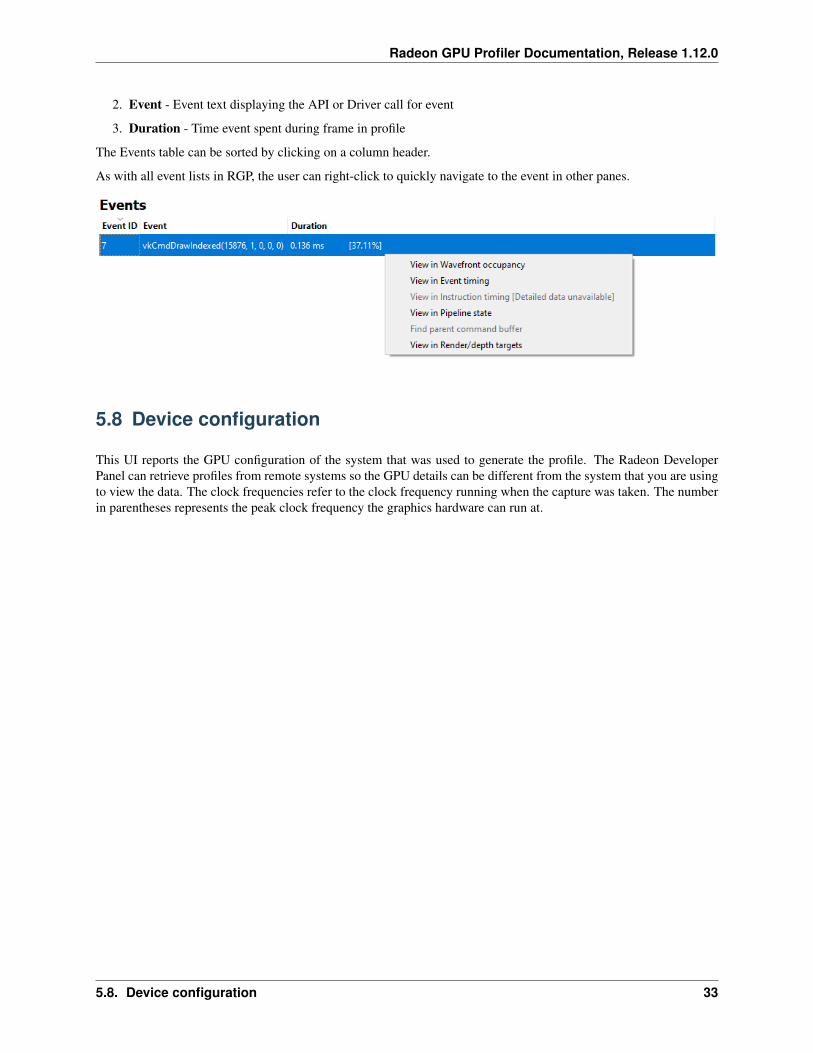
The Events table can be sorted by clicking on a column header.
As with all event lists in RGP, the user can right-click to quickly navigate to the event in other panes.
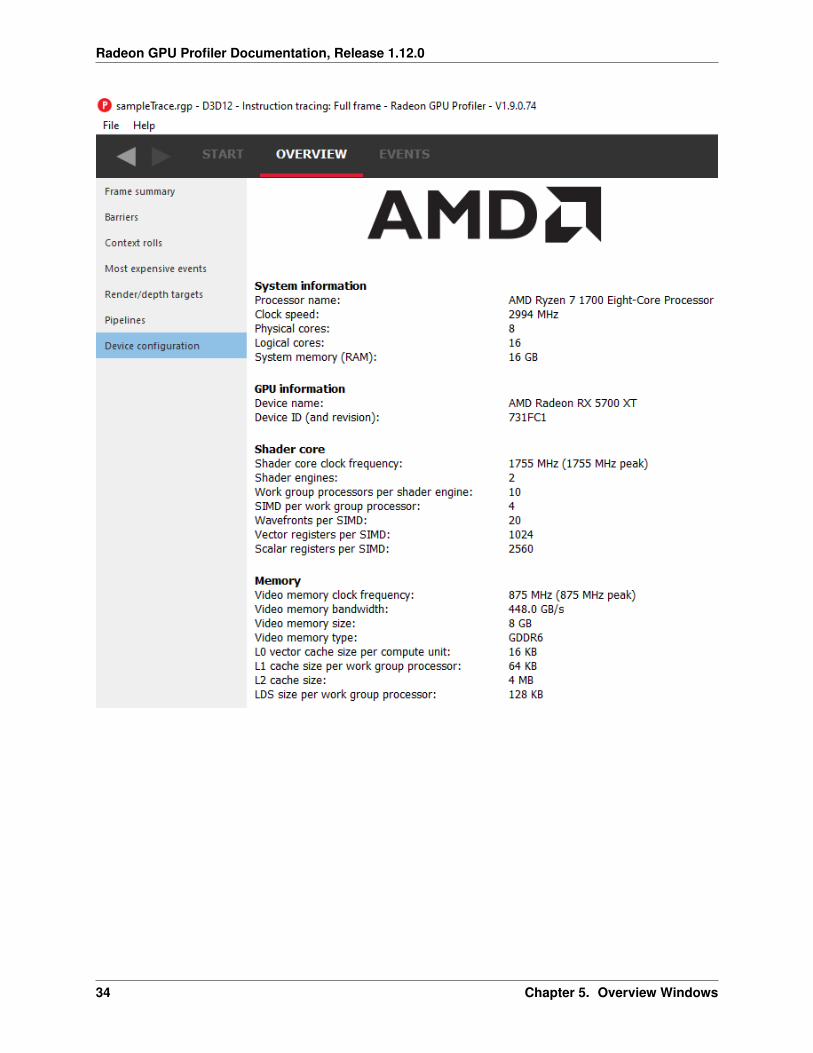
5.8 Device configuration
This UI reports the GPU configuration of the system that was used to generate the profile. The Radeon DeveloperPanel can retrieve profiles from remote systems so the GPU details can be different from the system that you are usingto view the data. The clock frequencies refer to the clock frequency running when the capture was taken. The numberin parentheses represents the peak clock frequency the graphics hardware can run at.
5.8. Device configuration 33
Radeon GPU Profiler Documentation, Release 1.12.0
34 Chapter 5. Overview Windows
CHAPTER 6
Events Windows
This section of RGP is where users will perform most analysis at the event level. An RGP event is simply an API callwithin a command buffer that was issued by either the application or the driver.
The event windows allow searching of the event string. The event string consists of the event index, the API call andparameters. Only events containing the search string will be displayed. This works for the whole event string, not justthe event index. For example, if the search string is ‘8’, event 31 may be displayed if any of its parameters contain ‘8’.
6.1 Wavefront occupancy
This section presents users with an interactive timeline that shows GPU utilization, GPU cache counter data, and allevents in the profile.
35
Radeon GPU Profiler Documentation, Release 1.12.0
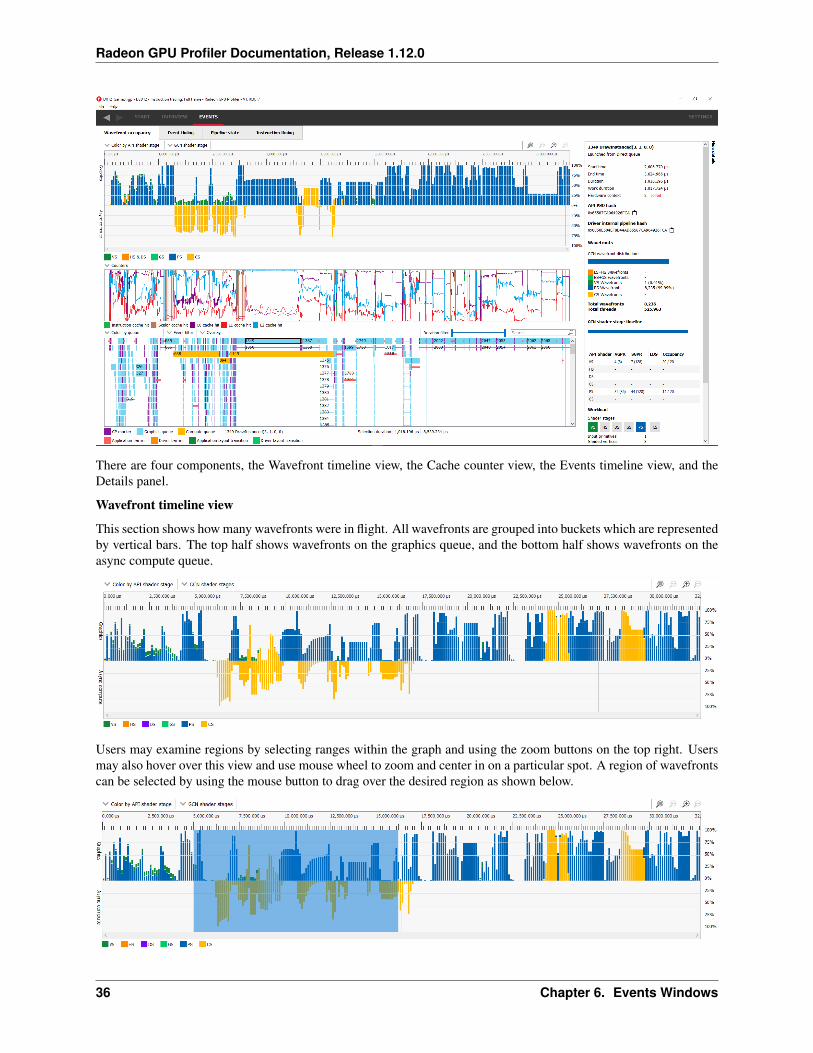
There are four components, the Wavefront timeline view, the Cache counter view, the Events timeline view, and theDetails panel.
Wavefront timeline view
This section shows how many wavefronts were in flight. All wavefronts are grouped into buckets which are representedby vertical bars. The top half shows wavefronts on the graphics queue, and the bottom half shows wavefronts on theasync compute queue.
Users may examine regions by selecting ranges within the graph and using the zoom buttons on the top right. Usersmay also hover over this view and use mouse wheel to zoom and center in on a particular spot. A region of wavefrontscan be selected by using the mouse button to drag over the desired region as shown below.
36 Chapter 6. Events Windows
Radeon GPU Profiler Documentation, Release 1.12.0
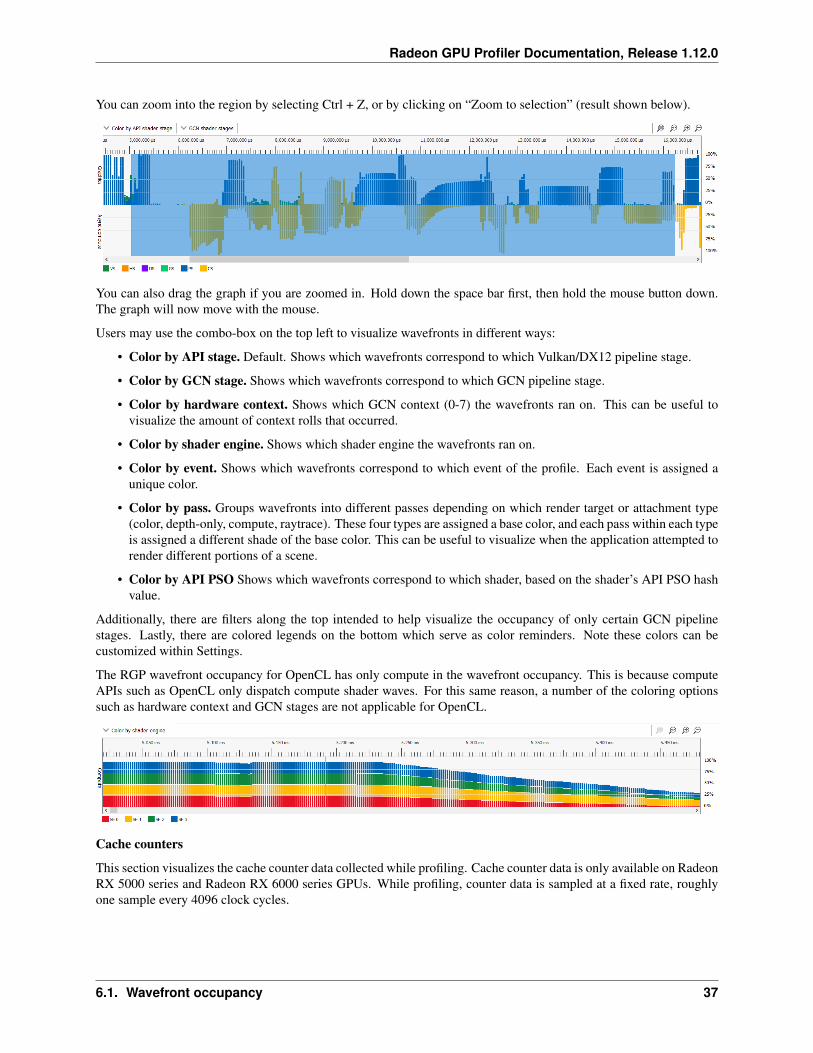
You can zoom into the region by selecting Ctrl + Z, or by clicking on “Zoom to selection” (result shown below).
You can also drag the graph if you are zoomed in. Hold down the space bar first, then hold the mouse button down.The graph will now move with the mouse.
Users may use the combo-box on the top left to visualize wavefronts in different ways:
• Color by API stage. Default. Shows which wavefronts correspond to which Vulkan/DX12 pipeline stage.
• Color by GCN stage. Shows which wavefronts correspond to which GCN pipeline stage.
• Color by hardware context. Shows which GCN context (0-7) the wavefronts ran on. This can be useful tovisualize the amount of context rolls that occurred.
• Color by shader engine. Shows which shader engine the wavefronts ran on.
• Color by event. Shows which wavefronts correspond to which event of the profile. Each event is assigned aunique color.
• Color by pass. Groups wavefronts into different passes depending on which render target or attachment type(color, depth-only, compute, raytrace). These four types are assigned a base color, and each pass within each typeis assigned a different shade of the base color. This can be useful to visualize when the application attempted torender different portions of a scene.
• Color by API PSO Shows which wavefronts correspond to which shader, based on the shader’s API PSO hashvalue.
Additionally, there are filters along the top intended to help visualize the occupancy of only certain GCN pipelinestages. Lastly, there are colored legends on the bottom which serve as color reminders. Note these colors can becustomized within Settings.
The RGP wavefront occupancy for OpenCL has only compute in the wavefront occupancy. This is because computeAPIs such as OpenCL only dispatch compute shader waves. For this same reason, a number of the coloring optionssuch as hardware context and GCN stages are not applicable for OpenCL.
Cache counters
This section visualizes the cache counter data collected while profiling. Cache counter data is only available on RadeonRX 5000 series and Radeon RX 6000 series GPUs. While profiling, counter data is sampled at a fixed rate, roughlyone sample every 4096 clock cycles.
6.1. Wavefront occupancy 37
Radeon GPU Profiler Documentation, Release 1.12.0
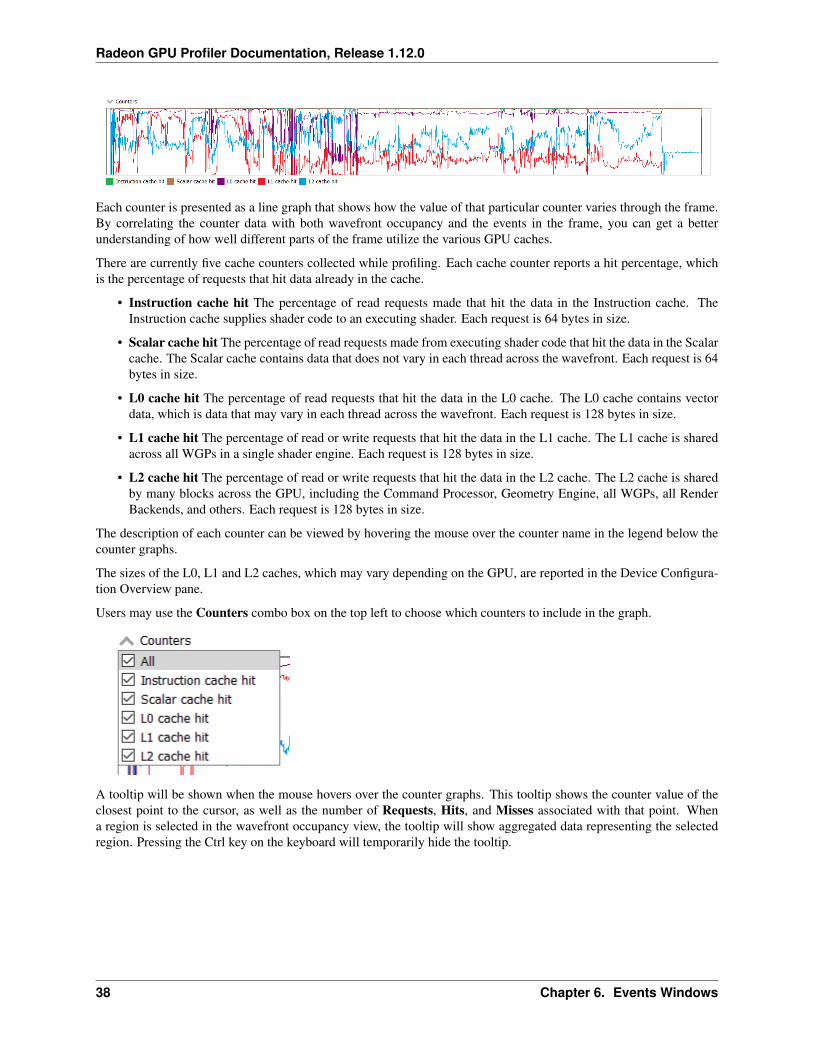
Each counter is presented as a line graph that shows how the value of that particular counter varies through the frame.By correlating the counter data with both wavefront occupancy and the events in the frame, you can get a betterunderstanding of how well different parts of the frame utilize the various GPU caches.
There are currently five cache counters collected while profiling. Each cache counter reports a hit percentage, whichis the percentage of requests that hit data already in the cache.
• Instruction cache hit The percentage of read requests made that hit the data in the Instruction cache. TheInstruction cache supplies shader code to an executing shader. Each request is 64 bytes in size.
• Scalar cache hit The percentage of read requests made from executing shader code that hit the data in the Scalarcache. The Scalar cache contains data that does not vary in each thread across the wavefront. Each request is 64bytes in size.
• L0 cache hit The percentage of read requests that hit the data in the L0 cache. The L0 cache contains vectordata, which is data that may vary in each thread across the wavefront. Each request is 128 bytes in size.
• L1 cache hit The percentage of read or write requests that hit the data in the L1 cache. The L1 cache is sharedacross all WGPs in a single shader engine. Each request is 128 bytes in size.
• L2 cache hit The percentage of read or write requests that hit the data in the L2 cache. The L2 cache is sharedby many blocks across the GPU, including the Command Processor, Geometry Engine, all WGPs, all RenderBackends, and others. Each request is 128 bytes in size.
The description of each counter can be viewed by hovering the mouse over the counter name in the legend below thecounter graphs.
The sizes of the L0, L1 and L2 caches, which may vary depending on the GPU, are reported in the Device Configura-tion Overview pane.
Users may use the Counters combo box on the top left to choose which counters to include in the graph.
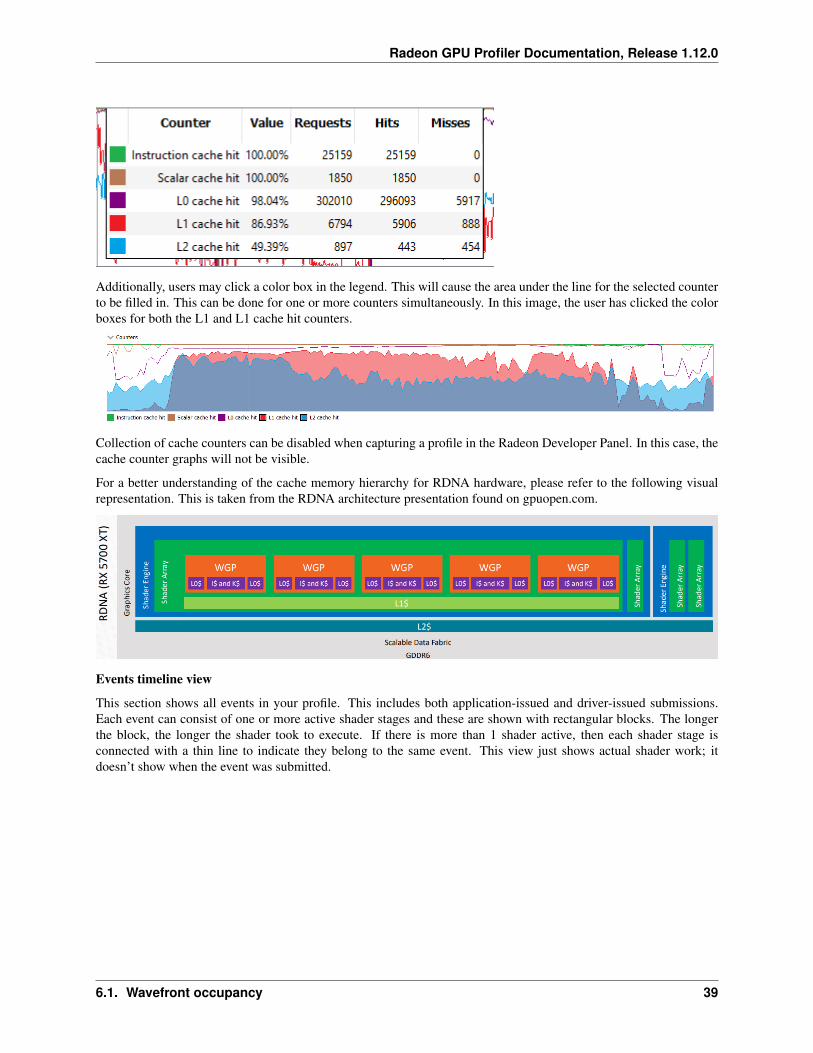
A tooltip will be shown when the mouse hovers over the counter graphs. This tooltip shows the counter value of theclosest point to the cursor, as well as the number of Requests, Hits, and Misses associated with that point. Whena region is selected in the wavefront occupancy view, the tooltip will show aggregated data representing the selectedregion. Pressing the Ctrl key on the keyboard will temporarily hide the tooltip.
38 Chapter 6. Events Windows
Radeon GPU Profiler Documentation, Release 1.12.0
Additionally, users may click a color box in the legend. This will cause the area under the line for the selected counterto be filled in. This can be done for one or more counters simultaneously. In this image, the user has clicked the colorboxes for both the L1 and L1 cache hit counters.
Collection of cache counters can be disabled when capturing a profile in the Radeon Developer Panel. In this case, thecache counter graphs will not be visible.
For a better understanding of the cache memory hierarchy for RDNA hardware, please refer to the following visualrepresentation. This is taken from the RDNA architecture presentation found on gpuopen.com.
Events timeline view
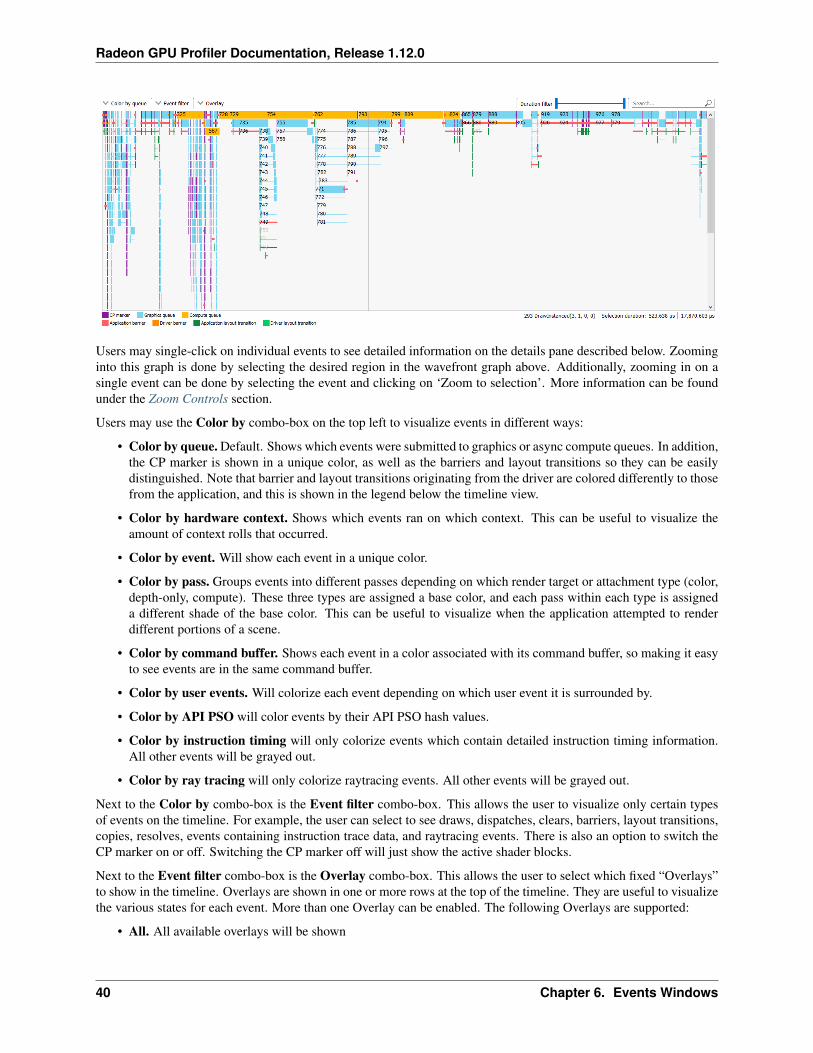
This section shows all events in your profile. This includes both application-issued and driver-issued submissions.Each event can consist of one or more active shader stages and these are shown with rectangular blocks. The longerthe block, the longer the shader took to execute. If there is more than 1 shader active, then each shader stage isconnected with a thin line to indicate they belong to the same event. This view just shows actual shader work; itdoesn’t show when the event was submitted.
6.1. Wavefront occupancy 39
Radeon GPU Profiler Documentation, Release 1.12.0
Users may single-click on individual events to see detailed information on the details pane described below. Zoominginto this graph is done by selecting the desired region in the wavefront graph above. Additionally, zooming in on asingle event can be done by selecting the event and clicking on ‘Zoom to selection’. More information can be foundunder the Zoom Controls section.
Users may use the Color by combo-box on the top left to visualize events in different ways:
• Color by queue. Default. Shows which events were submitted to graphics or async compute queues. In addition,the CP marker is shown in a unique color, as well as the barriers and layout transitions so they can be easilydistinguished. Note that barrier and layout transitions originating from the driver are colored differently to thosefrom the application, and this is shown in the legend below the timeline view.
• Color by hardware context. Shows which events ran on which context. This can be useful to visualize theamount of context rolls that occurred.
• Color by event. Will show each event in a unique color.
• Color by pass. Groups events into different passes depending on which render target or attachment type (color,depth-only, compute). These three types are assigned a base color, and each pass within each type is assigneda different shade of the base color. This can be useful to visualize when the application attempted to renderdifferent portions of a scene.
• Color by command buffer. Shows each event in a color associated with its command buffer, so making it easyto see events are in the same command buffer.
• Color by user events. Will colorize each event depending on which user event it is surrounded by.
• Color by API PSO will color events by their API PSO hash values.
• Color by instruction timing will only colorize events which contain detailed instruction timing information.All other events will be grayed out.
• Color by ray tracing will only colorize raytracing events. All other events will be grayed out.
Next to the Color by combo-box is the Event filter combo-box. This allows the user to visualize only certain typesof events on the timeline. For example, the user can select to see draws, dispatches, clears, barriers, layout transitions,copies, resolves, events containing instruction trace data, and raytracing events. There is also an option to switch theCP marker on or off. Switching the CP marker off will just show the active shader blocks.
Next to the Event filter combo-box is the Overlay combo-box. This allows the user to select which fixed “Overlays”to show in the timeline. Overlays are shown in one or more rows at the top of the timeline. They are useful to visualizethe various states for each event. More than one Overlay can be enabled. The following Overlays are supported:
• All. All available overlays will be shown
40 Chapter 6. Events Windows
Radeon GPU Profiler Documentation, Release 1.12.0
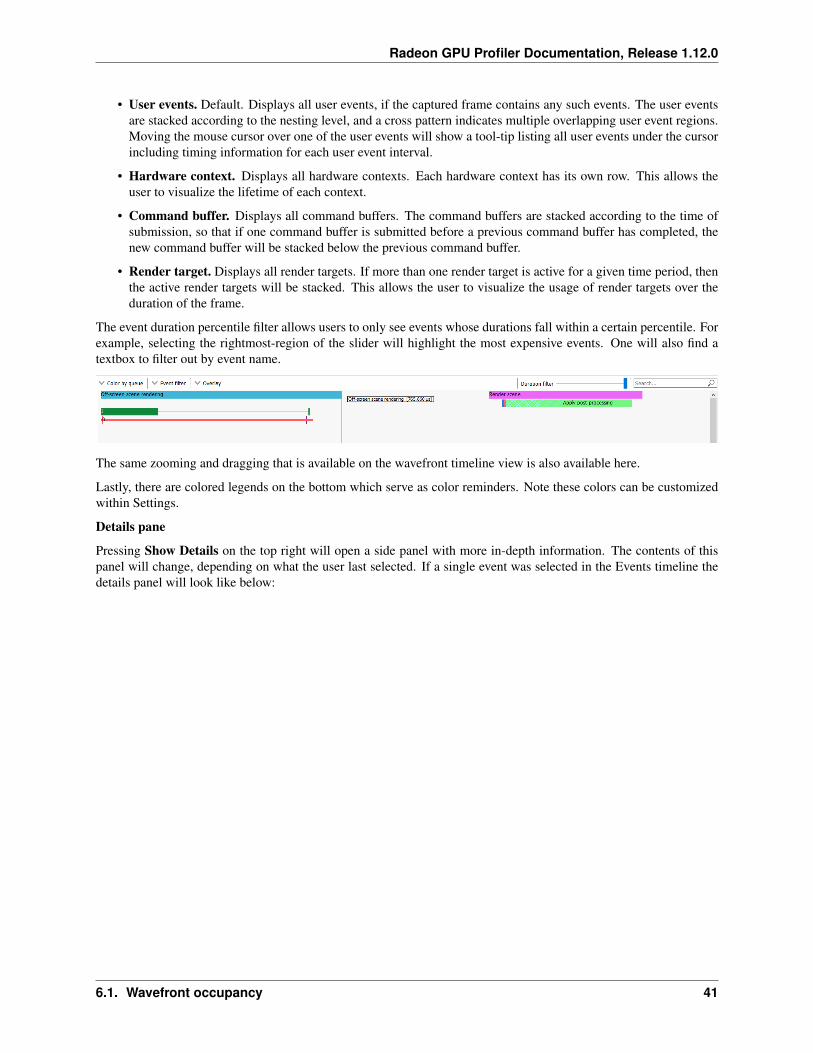
• User events. Default. Displays all user events, if the captured frame contains any such events. The user eventsare stacked according to the nesting level, and a cross pattern indicates multiple overlapping user event regions.Moving the mouse cursor over one of the user events will show a tool-tip listing all user events under the cursorincluding timing information for each user event interval.
• Hardware context. Displays all hardware contexts. Each hardware context has its own row. This allows theuser to visualize the lifetime of each context.
• Command buffer. Displays all command buffers. The command buffers are stacked according to the time ofsubmission, so that if one command buffer is submitted before a previous command buffer has completed, thenew command buffer will be stacked below the previous command buffer.
• Render target. Displays all render targets. If more than one render target is active for a given time period, thenthe active render targets will be stacked. This allows the user to visualize the usage of render targets over theduration of the frame.
The event duration percentile filter allows users to only see events whose durations fall within a certain percentile. Forexample, selecting the rightmost-region of the slider will highlight the most expensive events. One will also find atextbox to filter out by event name.
The same zooming and dragging that is available on the wavefront timeline view is also available here.
Lastly, there are colored legends on the bottom which serve as color reminders. Note these colors can be customizedwithin Settings.
Details pane
Pressing Show Details on the top right will open a side panel with more in-depth information. The contents of thispanel will change, depending on what the user last selected. If a single event was selected in the Events timeline thedetails panel will look like below:
6.1. Wavefront occupancy 41
Radeon GPU Profiler Documentation, Release 1.12.0
42 Chapter 6. Events Windows
Radeon GPU Profiler Documentation, Release 1.12.0
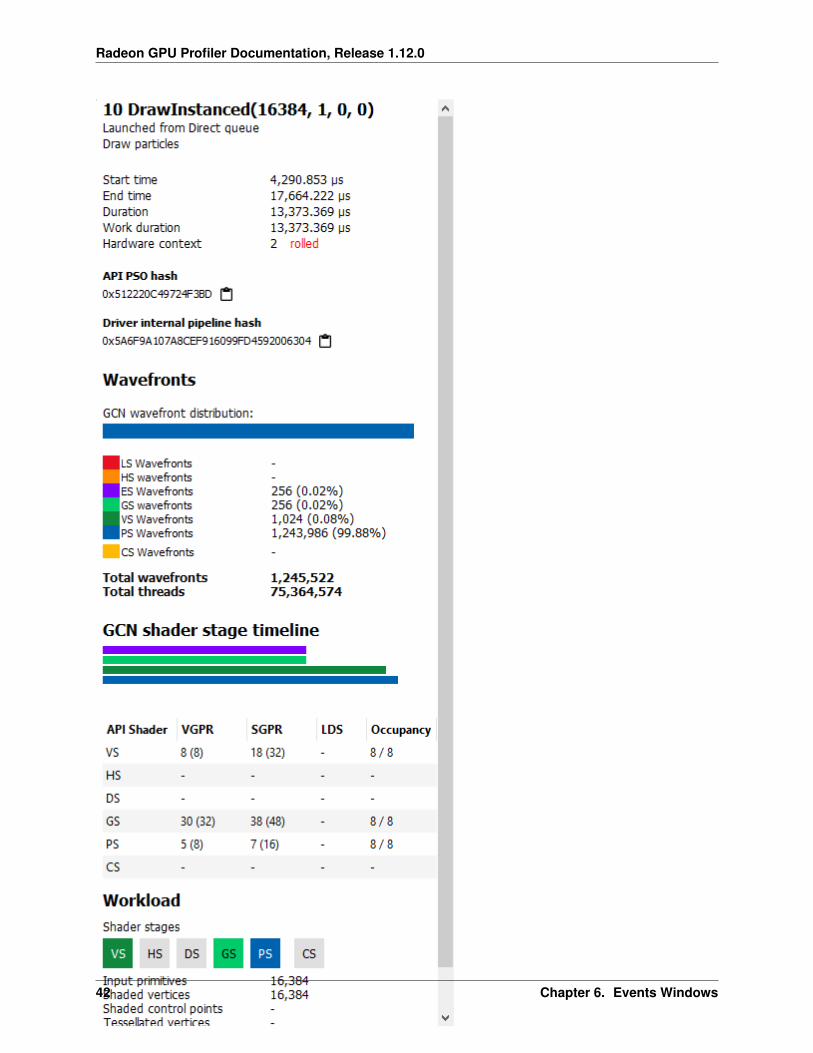
The Details panel for a single event contains the following data:
• The event’s API call name
• The queue it was launched on
• User event hierarchy (if present)
• Start, End, and Duration timings
• Hardware context and if it was rolled
• List of GCN hardware stages and wavefront counts
• Colored bar showing wavefront distribution per GCN hardware stage
• Total wavefront count
• Total threads
• GCN shader timeline graphic showing active stages and duration
• A table showing resource usage for each API shader stage:
– The VGPR and SGPR columns refer to the vector and scalar general purpose registers being used, and thenumber of registers that have been allocated shown in parentheses.
– The LDS column refers to the amount of Local Data Store that each shader stage is using, reported inbytes.
– The Occupancy column refers to the Theoretical wavefront occupancy for the shader. This is reported ‘A/ B’, where A is the number of wavefronts that can be run and ‘B’ is the maximum number of wavefrontssupported by the hardware.
– Tooltips explaining the data are available by hovering the mouse over the table header.
• Block diagram of active pipeline stages
• Primitive, vertex, control point, and pixel counts
The ‘Duration’ shows the time from the start of the first shader to the end of the last shader, including any spacebetween shaders where no actual work is done (denoted by a line connecting the shader ‘blocks’). The ‘Work duration’only shows the time when the shaders are actually doing work. This is the sum of all the shader blocks, ignoring theconnecting lines where no work is being done. If there is overlap between shaders, the overlap time is only accountedfor once. If all shaders are overlapping, then the duration will be the same as the work duration.
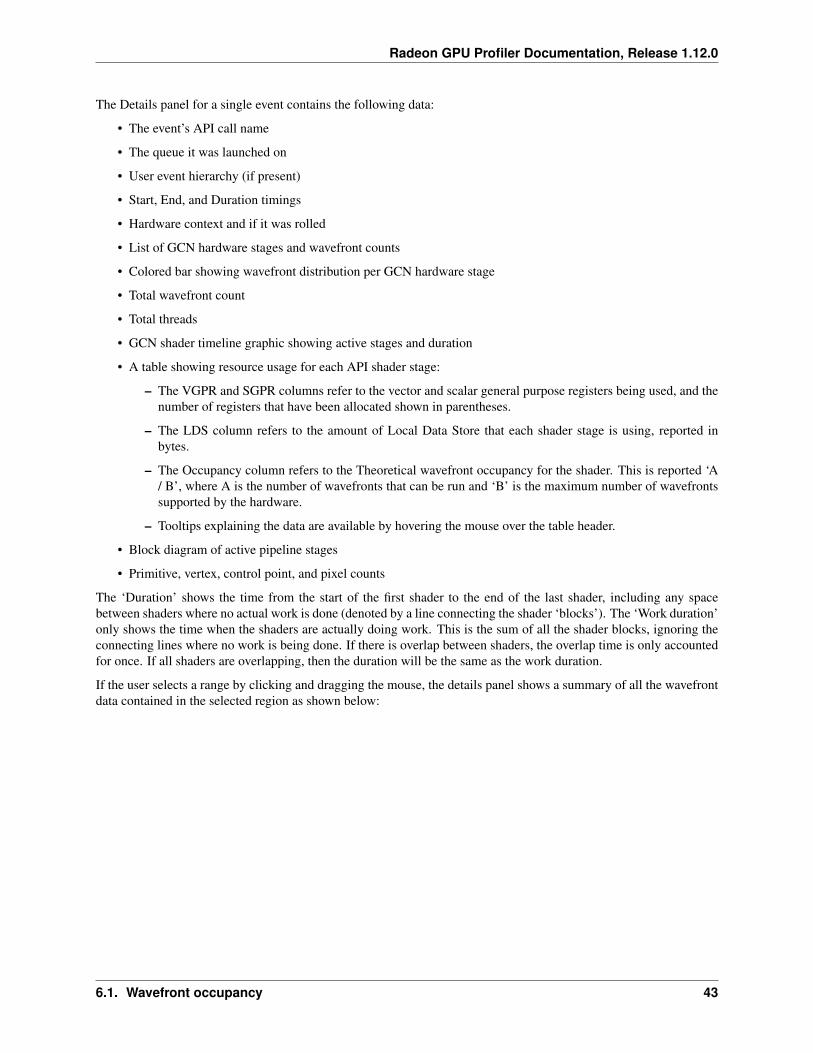
If the user selects a range by clicking and dragging the mouse, the details panel shows a summary of all the wavefrontdata contained in the selected region as shown below:
6.1. Wavefront occupancy 43
Radeon GPU Profiler Documentation, Release 1.12.0
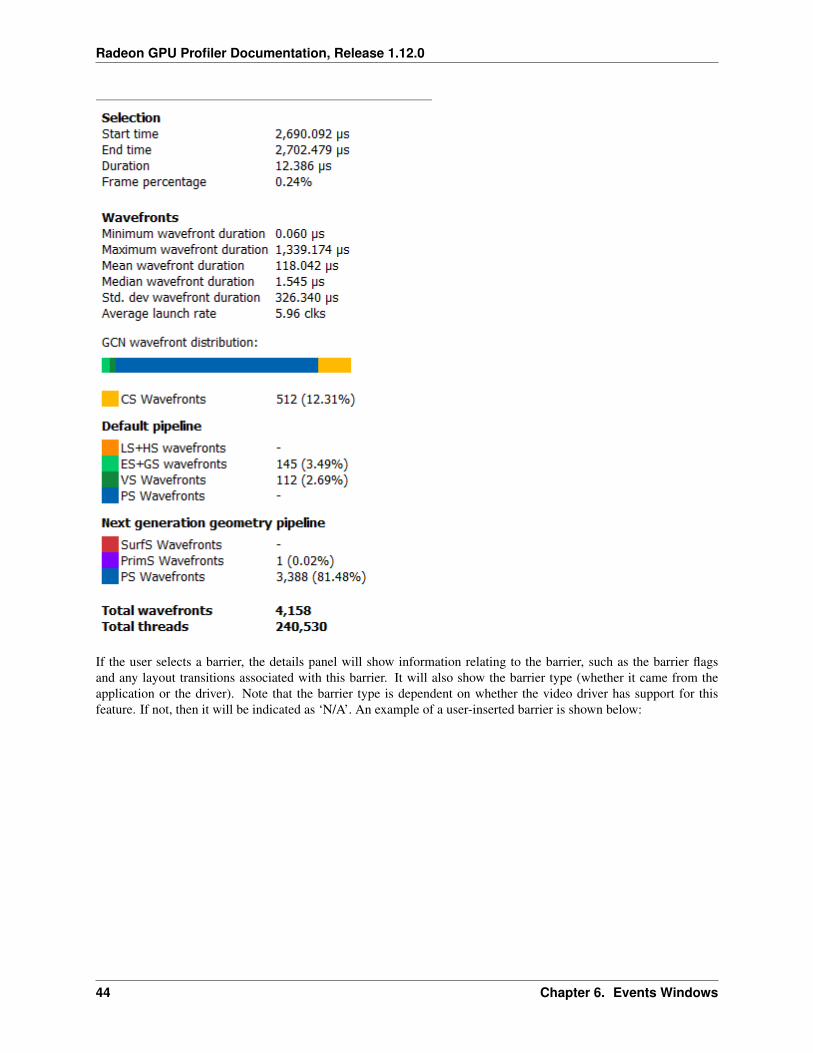
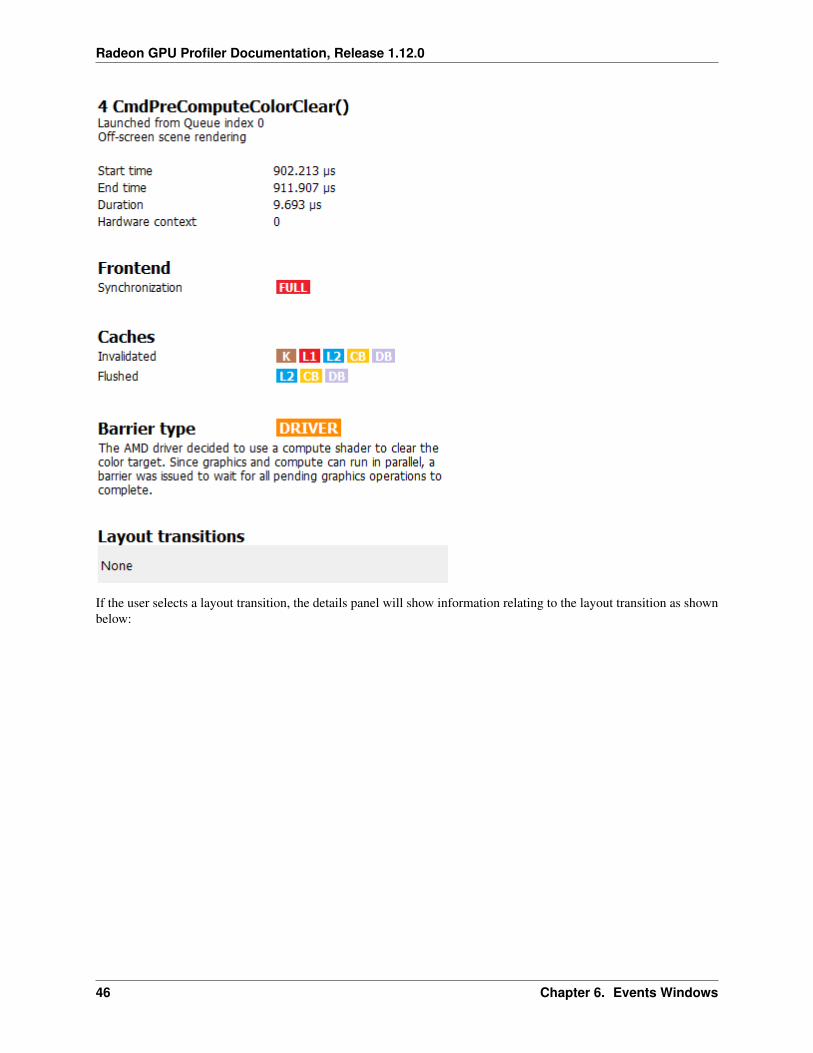
If the user selects a barrier, the details panel will show information relating to the barrier, such as the barrier flagsand any layout transitions associated with this barrier. It will also show the barrier type (whether it came from theapplication or the driver). Note that the barrier type is dependent on whether the video driver has support for thisfeature. If not, then it will be indicated as ‘N/A’. An example of a user-inserted barrier is shown below:
44 Chapter 6. Events Windows
Radeon GPU Profiler Documentation, Release 1.12.0
If the driver needed to insert a barrier, a detailed reason why this barrier was inserted is also displayed, as shownbelow:
6.1. Wavefront occupancy 45
Radeon GPU Profiler Documentation, Release 1.12.0
If the user selects a layout transition, the details panel will show information relating to the layout transition as shownbelow:
46 Chapter 6. Events Windows
Radeon GPU Profiler Documentation, Release 1.12.0
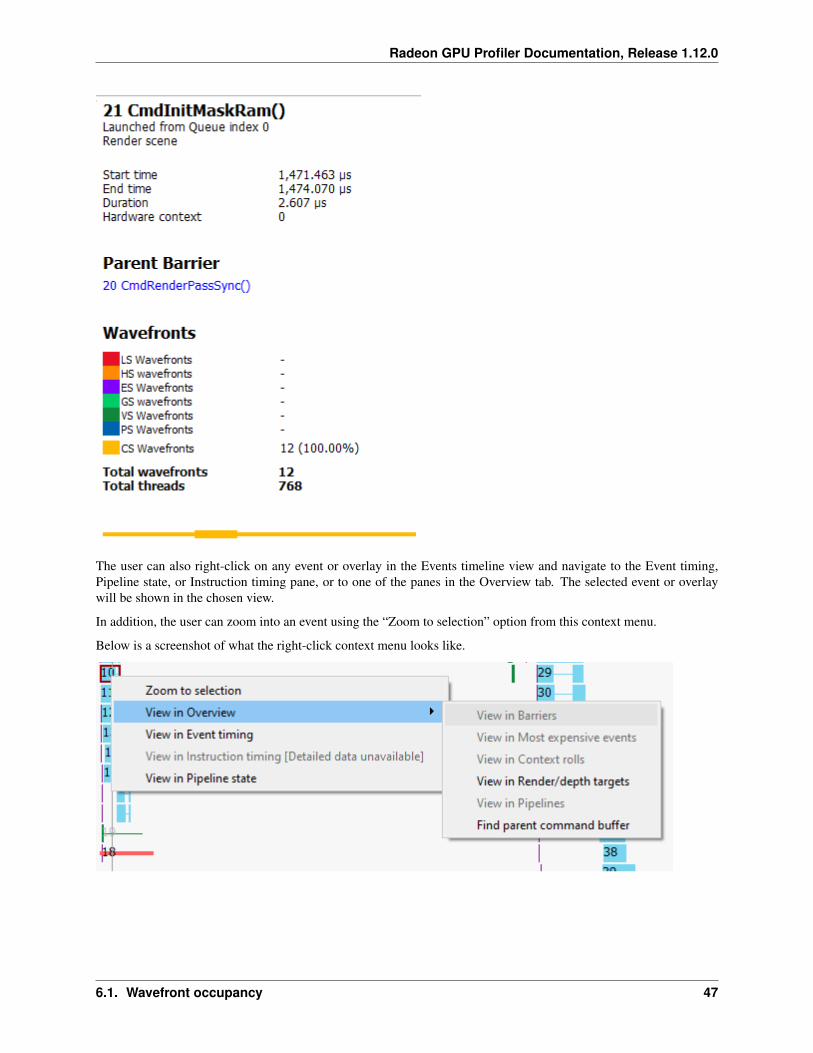
The user can also right-click on any event or overlay in the Events timeline view and navigate to the Event timing,Pipeline state, or Instruction timing pane, or to one of the panes in the Overview tab. The selected event or overlaywill be shown in the chosen view.
In addition, the user can zoom into an event using the “Zoom to selection” option from this context menu.
Below is a screenshot of what the right-click context menu looks like.
6.1. Wavefront occupancy 47
Radeon GPU Profiler Documentation, Release 1.12.0
6.2 Event timing
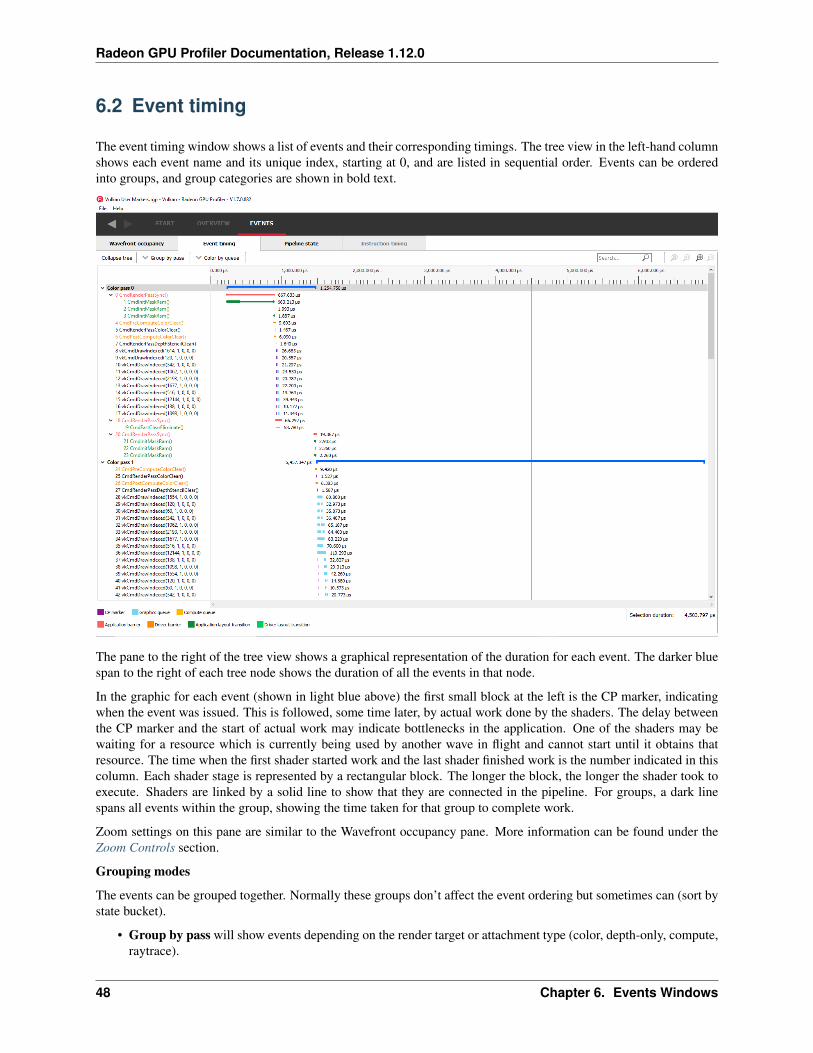
The event timing window shows a list of events and their corresponding timings. The tree view in the left-hand columnshows each event name and its unique index, starting at 0, and are listed in sequential order. Events can be orderedinto groups, and group categories are shown in bold text.
The pane to the right of the tree view shows a graphical representation of the duration for each event. The darker bluespan to the right of each tree node shows the duration of all the events in that node.
In the graphic for each event (shown in light blue above) the first small block at the left is the CP marker, indicatingwhen the event was issued. This is followed, some time later, by actual work done by the shaders. The delay betweenthe CP marker and the start of actual work may indicate bottlenecks in the application. One of the shaders may bewaiting for a resource which is currently being used by another wave in flight and cannot start until it obtains thatresource. The time when the first shader started work and the last shader finished work is the number indicated in thiscolumn. Each shader stage is represented by a rectangular block. The longer the block, the longer the shader took toexecute. Shaders are linked by a solid line to show that they are connected in the pipeline. For groups, a dark linespans all events within the group, showing the time taken for that group to complete work.
Zoom settings on this pane are similar to the Wavefront occupancy pane. More information can be found under theZoom Controls section.
Grouping modes
The events can be grouped together. Normally these groups don’t affect the event ordering but sometimes can (sort bystate bucket).
• Group by pass will show events depending on the render target or attachment type (color, depth-only, compute,raytrace).
48 Chapter 6. Events Windows
Radeon GPU Profiler Documentation, Release 1.12.0
• Group by hardware context will group events by their hardware context, making it easy to see which eventscaused the context to change.
• Group by state bucket (unsorted) will order the events by state bucket but won’t sort the state buckets byduration. Theoretically, all events in a state bucket use the same shaders. The duration of a state bucket isrepresented by the dark blue line corresponding to the state bucket group text.
• Group by state bucket (serialized) will take all the event timings within the group and sum the total time thatthe shaders were busy, ignoring all empty space between events. This has the effect of serializing the shaderwork and doesn’t take into account that some shaders will be executing in parallel. This is used to highlightwhen you have a lot of small shaders whose cumulative work can be extensive. As an example, if you have 2shaders which start at the same time and one takes 2000 clks and another takes 10000 clks, the total durationwould be 12000 clks.
• Group by state bucket (overlapped) takes into account the parallelism of the shader execution so will highlightshaders which take a long time to execute. Using the same example above, since both shaders start together, thetotal duration in this case would be 10000 clks.
• Group by command buffer will group events depending on which command buffer they are on.
• Group by user events will group the events depending on which user event(s) they are surrounded by.
• Group by PSO will group events by their API PSO hash values.
The default grouping mode is by user event if user events are present in the profile. Otherwise the default will be togroup by pass.
Note that grouping by hardware context or command buffer will group events by queue first. Grouping by pass or userevent will chronologically group events irrespective of which queue they originated from. Grouping by state bucketjust shows events in the graphics queue. Grouping by hardware context is shown below:
6.2. Event timing 49
Radeon GPU Profiler Documentation, Release 1.12.0
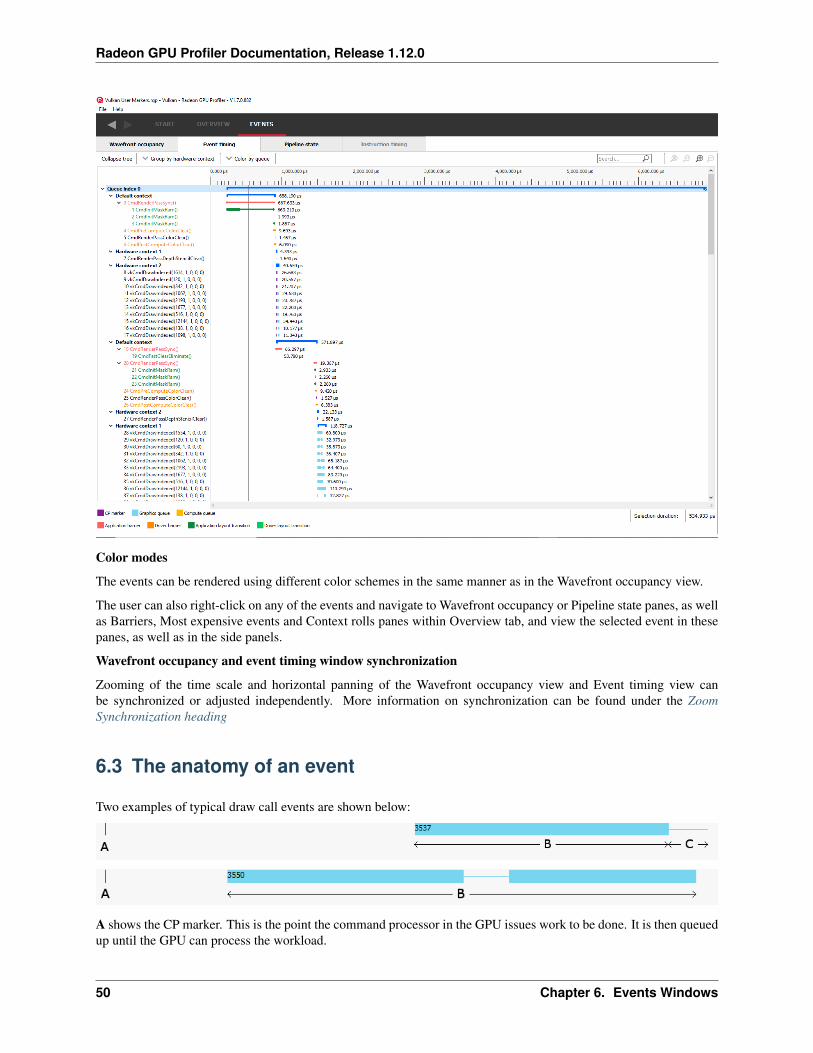
Color modes
The events can be rendered using different color schemes in the same manner as in the Wavefront occupancy view.
The user can also right-click on any of the events and navigate to Wavefront occupancy or Pipeline state panes, as wellas Barriers, Most expensive events and Context rolls panes within Overview tab, and view the selected event in thesepanes, as well as in the side panels.
Wavefront occupancy and event timing window synchronization
Zooming of the time scale and horizontal panning of the Wavefront occupancy view and Event timing view canbe synchronized or adjusted independently. More information on synchronization can be found under the ZoomSynchronization heading
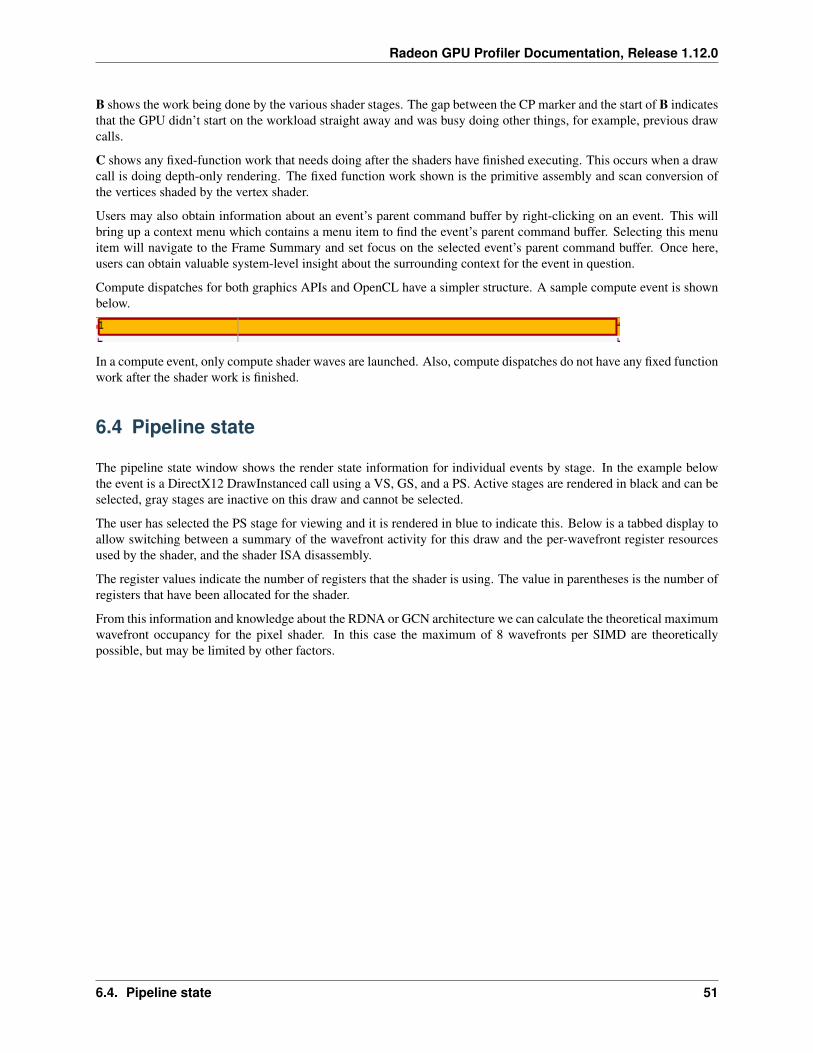
6.3 The anatomy of an event
Two examples of typical draw call events are shown below:
A shows the CP marker. This is the point the command processor in the GPU issues work to be done. It is then queuedup until the GPU can process the workload.
50 Chapter 6. Events Windows
Radeon GPU Profiler Documentation, Release 1.12.0
B shows the work being done by the various shader stages. The gap between the CP marker and the start of B indicatesthat the GPU didn’t start on the workload straight away and was busy doing other things, for example, previous drawcalls.
C shows any fixed-function work that needs doing after the shaders have finished executing. This occurs when a drawcall is doing depth-only rendering. The fixed function work shown is the primitive assembly and scan conversion ofthe vertices shaded by the vertex shader.
Users may also obtain information about an event’s parent command buffer by right-clicking on an event. This willbring up a context menu which contains a menu item to find the event’s parent command buffer. Selecting this menuitem will navigate to the Frame Summary and set focus on the selected event’s parent command buffer. Once here,users can obtain valuable system-level insight about the surrounding context for the event in question.
Compute dispatches for both graphics APIs and OpenCL have a simpler structure. A sample compute event is shownbelow.
In a compute event, only compute shader waves are launched. Also, compute dispatches do not have any fixed functionwork after the shader work is finished.
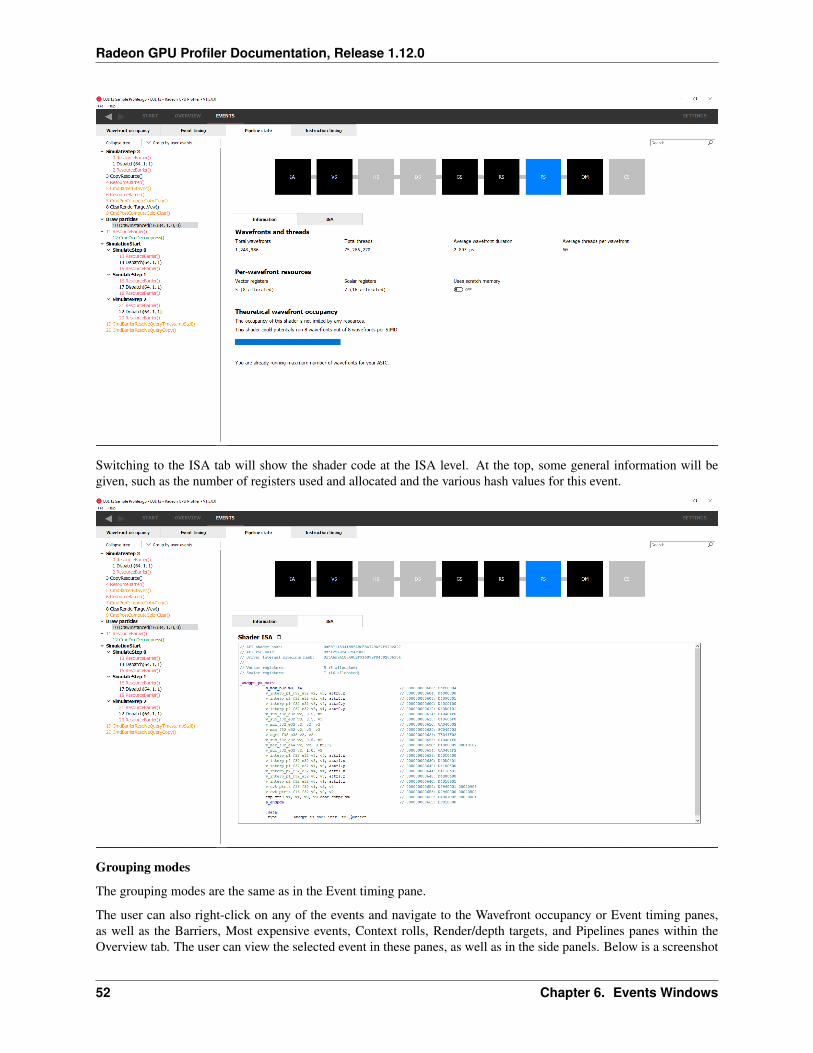
6.4 Pipeline state
The pipeline state window shows the render state information for individual events by stage. In the example belowthe event is a DirectX12 DrawInstanced call using a VS, GS, and a PS. Active stages are rendered in black and can beselected, gray stages are inactive on this draw and cannot be selected.
The user has selected the PS stage for viewing and it is rendered in blue to indicate this. Below is a tabbed display toallow switching between a summary of the wavefront activity for this draw and the per-wavefront register resourcesused by the shader, and the shader ISA disassembly.
The register values indicate the number of registers that the shader is using. The value in parentheses is the number ofregisters that have been allocated for the shader.
From this information and knowledge about the RDNA or GCN architecture we can calculate the theoretical maximumwavefront occupancy for the pixel shader. In this case the maximum of 8 wavefronts per SIMD are theoreticallypossible, but may be limited by other factors.
6.4. Pipeline state 51
Radeon GPU Profiler Documentation, Release 1.12.0
Switching to the ISA tab will show the shader code at the ISA level. At the top, some general information will begiven, such as the number of registers used and allocated and the various hash values for this event.
Grouping modes
The grouping modes are the same as in the Event timing pane.
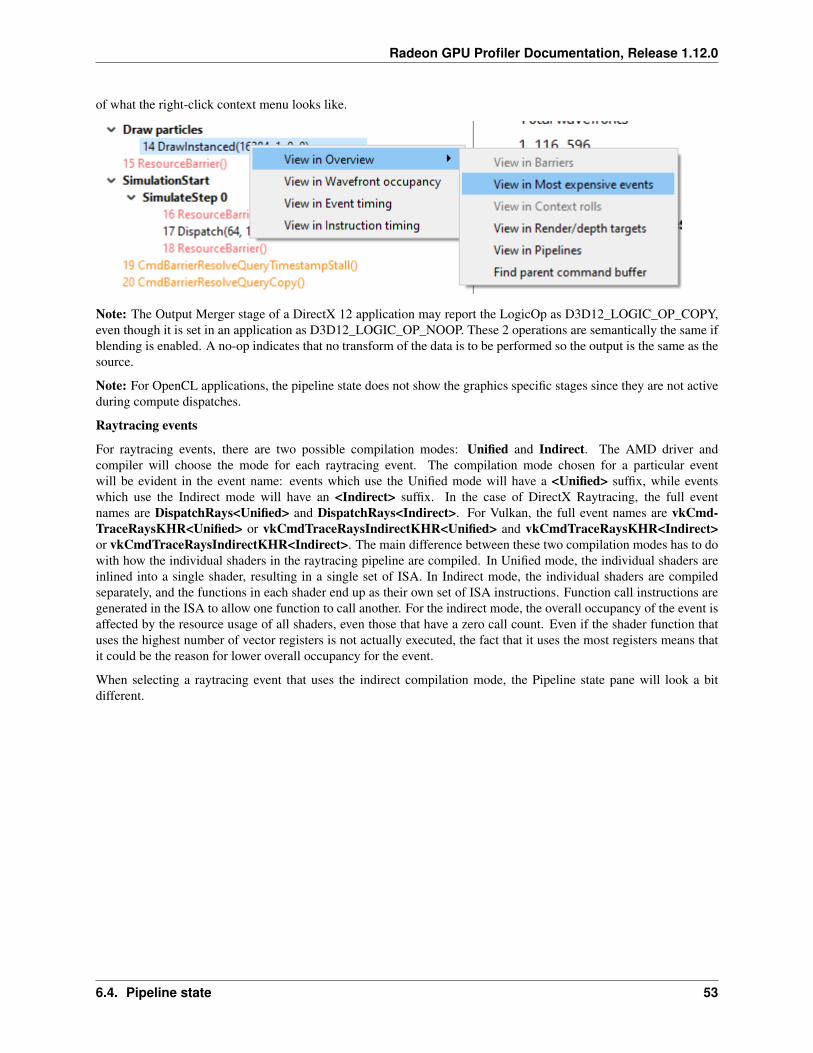
The user can also right-click on any of the events and navigate to the Wavefront occupancy or Event timing panes,as well as the Barriers, Most expensive events, Context rolls, Render/depth targets, and Pipelines panes within theOverview tab. The user can view the selected event in these panes, as well as in the side panels. Below is a screenshot
52 Chapter 6. Events Windows
Radeon GPU Profiler Documentation, Release 1.12.0
of what the right-click context menu looks like.
Note: The Output Merger stage of a DirectX 12 application may report the LogicOp as D3D12_LOGIC_OP_COPY,even though it is set in an application as D3D12_LOGIC_OP_NOOP. These 2 operations are semantically the same ifblending is enabled. A no-op indicates that no transform of the data is to be performed so the output is the same as thesource.
Note: For OpenCL applications, the pipeline state does not show the graphics specific stages since they are not activeduring compute dispatches.
Raytracing events
For raytracing events, there are two possible compilation modes: Unified and Indirect. The AMD driver andcompiler will choose the mode for each raytracing event. The compilation mode chosen for a particular eventwill be evident in the event name: events which use the Unified mode will have a <Unified> suffix, while eventswhich use the Indirect mode will have an <Indirect> suffix. In the case of DirectX Raytracing, the full eventnames are DispatchRays<Unified> and DispatchRays<Indirect>. For Vulkan, the full event names are vkCmd-TraceRaysKHR<Unified> or vkCmdTraceRaysIndirectKHR<Unified> and vkCmdTraceRaysKHR<Indirect>or vkCmdTraceRaysIndirectKHR<Indirect>. The main difference between these two compilation modes has to dowith how the individual shaders in the raytracing pipeline are compiled. In Unified mode, the individual shaders areinlined into a single shader, resulting in a single set of ISA. In Indirect mode, the individual shaders are compiledseparately, and the functions in each shader end up as their own set of ISA instructions. Function call instructions aregenerated in the ISA to allow one function to call another. For the indirect mode, the overall occupancy of the event isaffected by the resource usage of all shaders, even those that have a zero call count. Even if the shader function thatuses the highest number of vector registers is not actually executed, the fact that it uses the most registers means thatit could be the reason for lower overall occupancy for the event.
When selecting a raytracing event that uses the indirect compilation mode, the Pipeline state pane will look a bitdifferent.
6.4. Pipeline state 53
Radeon GPU Profiler Documentation, Release 1.12.0
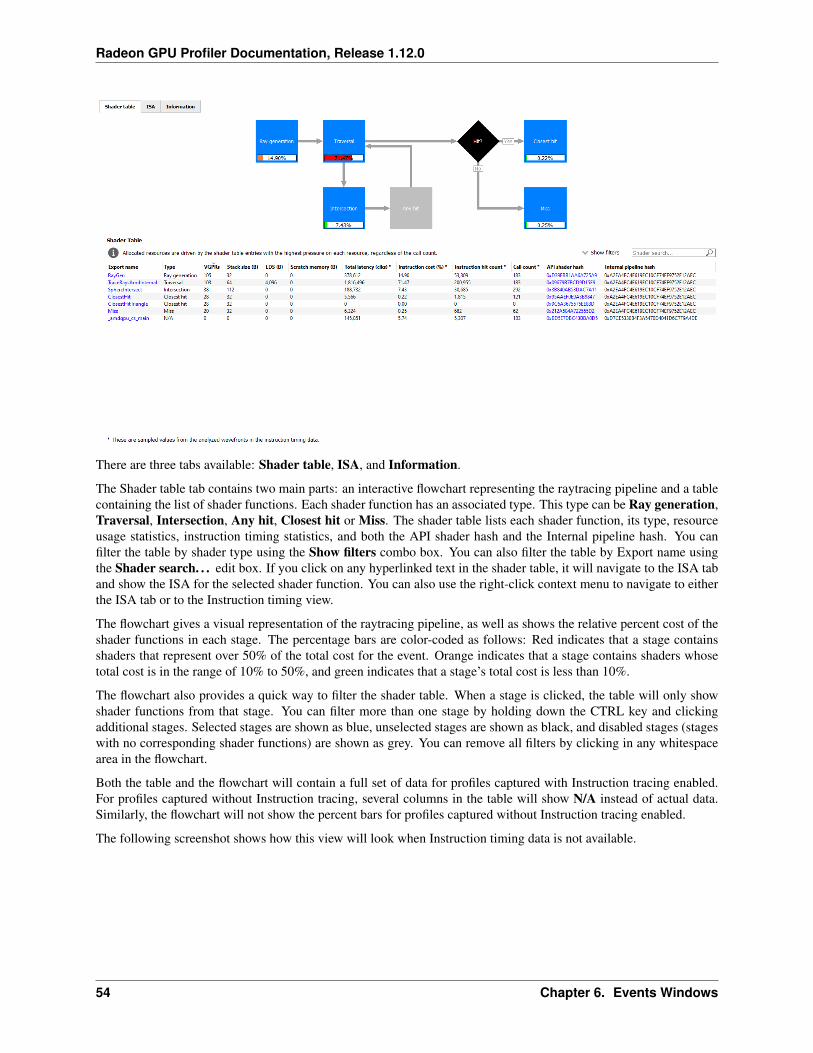
There are three tabs available: Shader table, ISA, and Information.
The Shader table tab contains two main parts: an interactive flowchart representing the raytracing pipeline and a tablecontaining the list of shader functions. Each shader function has an associated type. This type can be Ray generation,Traversal, Intersection, Any hit, Closest hit or Miss. The shader table lists each shader function, its type, resourceusage statistics, instruction timing statistics, and both the API shader hash and the Internal pipeline hash. You canfilter the table by shader type using the Show filters combo box. You can also filter the table by Export name usingthe Shader search. . . edit box. If you click on any hyperlinked text in the shader table, it will navigate to the ISA taband show the ISA for the selected shader function. You can also use the right-click context menu to navigate to eitherthe ISA tab or to the Instruction timing view.
The flowchart gives a visual representation of the raytracing pipeline, as well as shows the relative percent cost of theshader functions in each stage. The percentage bars are color-coded as follows: Red indicates that a stage containsshaders that represent over 50% of the total cost for the event. Orange indicates that a stage contains shaders whosetotal cost is in the range of 10% to 50%, and green indicates that a stage’s total cost is less than 10%.
The flowchart also provides a quick way to filter the shader table. When a stage is clicked, the table will only showshader functions from that stage. You can filter more than one stage by holding down the CTRL key and clickingadditional stages. Selected stages are shown as blue, unselected stages are shown as black, and disabled stages (stageswith no corresponding shader functions) are shown as grey. You can remove all filters by clicking in any whitespacearea in the flowchart.
Both the table and the flowchart will contain a full set of data for profiles captured with Instruction tracing enabled.For profiles captured without Instruction tracing, several columns in the table will show N/A instead of actual data.Similarly, the flowchart will not show the percent bars for profiles captured without Instruction tracing enabled.
The following screenshot shows how this view will look when Instruction timing data is not available.
54 Chapter 6. Events Windows
Radeon GPU Profiler Documentation, Release 1.12.0
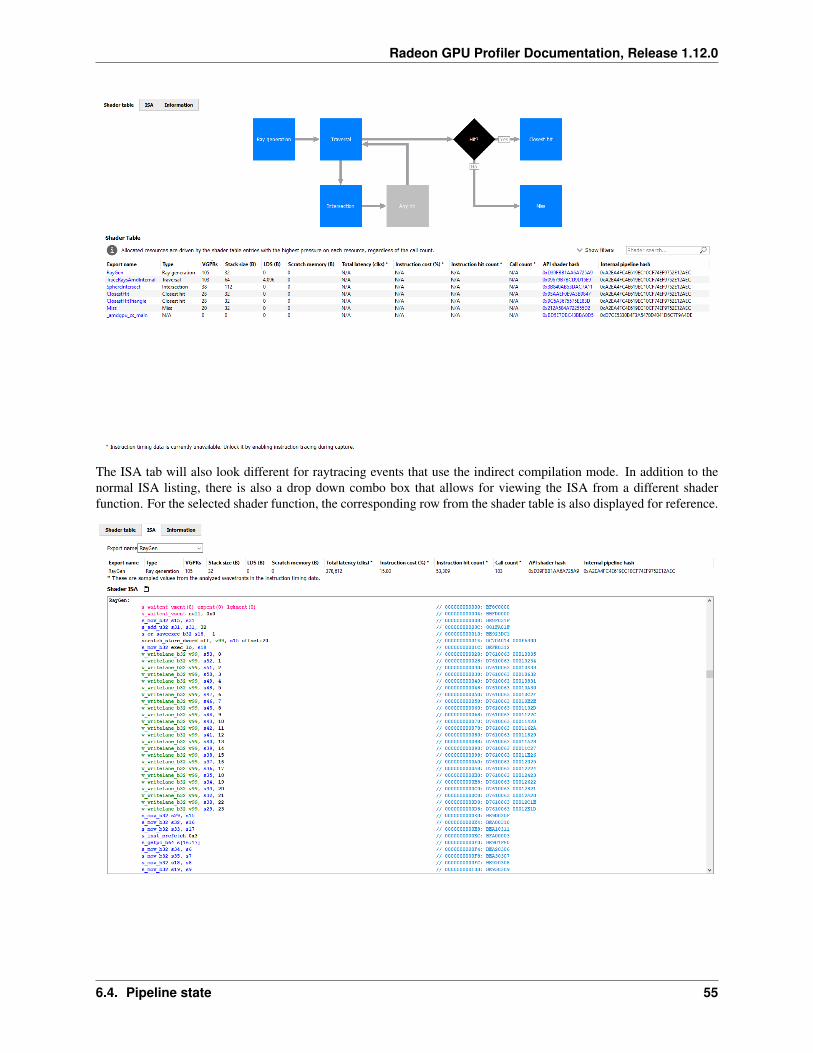
The ISA tab will also look different for raytracing events that use the indirect compilation mode. In addition to thenormal ISA listing, there is also a drop down combo box that allows for viewing the ISA from a different shaderfunction. For the selected shader function, the corresponding row from the shader table is also displayed for reference.
6.4. Pipeline state 55
Radeon GPU Profiler Documentation, Release 1.12.0
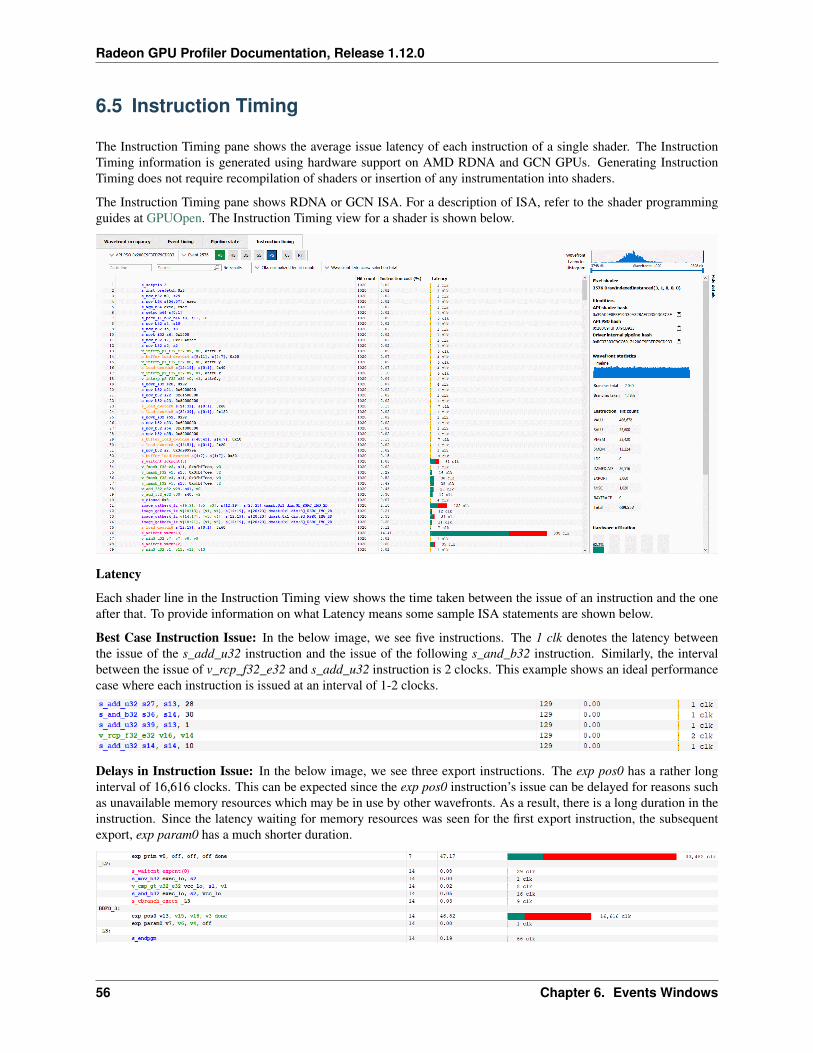
6.5 Instruction Timing
The Instruction Timing pane shows the average issue latency of each instruction of a single shader. The InstructionTiming information is generated using hardware support on AMD RDNA and GCN GPUs. Generating InstructionTiming does not require recompilation of shaders or insertion of any instrumentation into shaders.
The Instruction Timing pane shows RDNA or GCN ISA. For a description of ISA, refer to the shader programmingguides at GPUOpen. The Instruction Timing view for a shader is shown below.
Latency
Each shader line in the Instruction Timing view shows the time taken between the issue of an instruction and the oneafter that. To provide information on what Latency means some sample ISA statements are shown below.
Best Case Instruction Issue: In the below image, we see five instructions. The 1 clk denotes the latency betweenthe issue of the s_add_u32 instruction and the issue of the following s_and_b32 instruction. Similarly, the intervalbetween the issue of v_rcp_f32_e32 and s_add_u32 instruction is 2 clocks. This example shows an ideal performancecase where each instruction is issued at an interval of 1-2 clocks.
Delays in Instruction Issue: In the below image, we see three export instructions. The exp pos0 has a rather longinterval of 16,616 clocks. This can be expected since the exp pos0 instruction’s issue can be delayed for reasons suchas unavailable memory resources which may be in use by other wavefronts. As a result, there is a long duration in theinstruction. Since the latency waiting for memory resources was seen for the first export instruction, the subsequentexport, exp param0 has a much shorter duration.
56 Chapter 6. Events Windows
Radeon GPU Profiler Documentation, Release 1.12.0
Waitcounts and Instruction Issue: In the below image, we see seven instructions. There are two scalar buffer loadsand three scalar ALU instructions, all of which issue with little latency. We then see a s_waitcnt instruction. Thes_waitcnt has a longer issue interval of 2,088 clocks. The short latencies of the previous s_buffer_load_dword instruc-tions may seem counter intuitive since those are memory load instructions. However, this is expected as s_waitcnt isa shader instruction used for synchronization to wait for previous instructions, such as the previous buffer loads, tofinish. The s_waitcnt instruction will issue and then wait (in this case 2,088 clocks) until the next instruction which isthe v_add_f32_e64 can be issued.
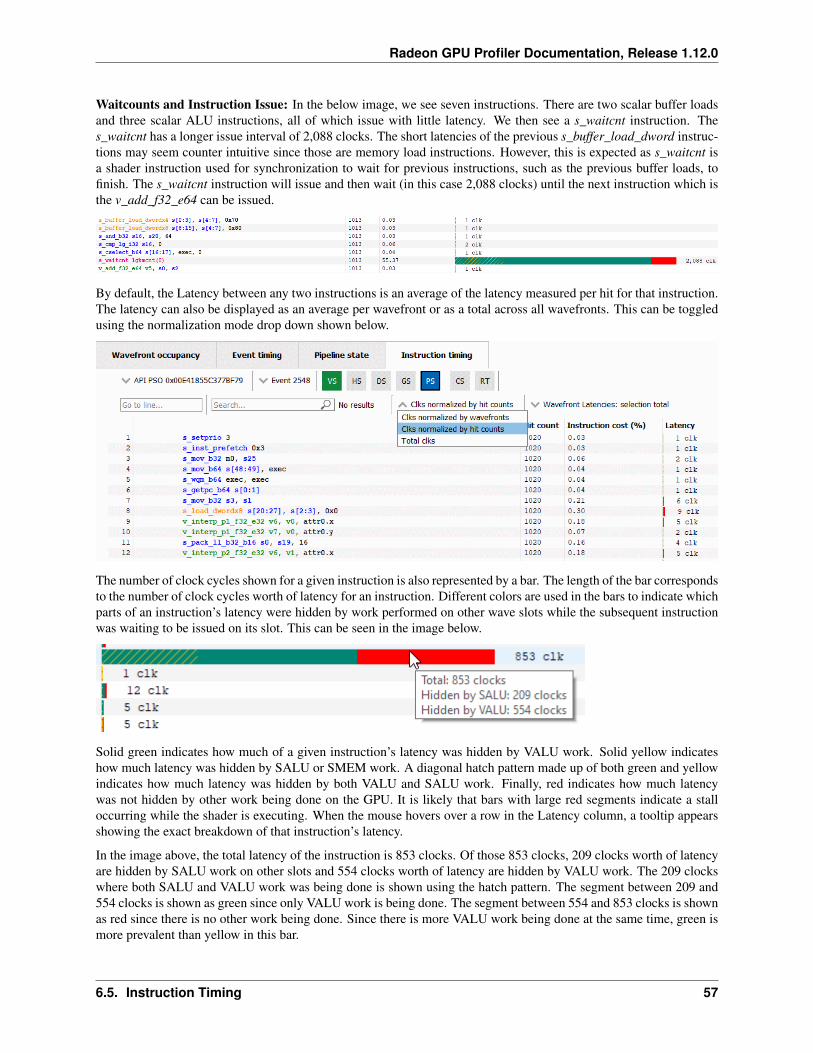
By default, the Latency between any two instructions is an average of the latency measured per hit for that instruction.The latency can also be displayed as an average per wavefront or as a total across all wavefronts. This can be toggledusing the normalization mode drop down shown below.
The number of clock cycles shown for a given instruction is also represented by a bar. The length of the bar correspondsto the number of clock cycles worth of latency for an instruction. Different colors are used in the bars to indicate whichparts of an instruction’s latency were hidden by work performed on other wave slots while the subsequent instructionwas waiting to be issued on its slot. This can be seen in the image below.
Solid green indicates how much of a given instruction’s latency was hidden by VALU work. Solid yellow indicateshow much latency was hidden by SALU or SMEM work. A diagonal hatch pattern made up of both green and yellowindicates how much latency was hidden by both VALU and SALU work. Finally, red indicates how much latencywas not hidden by other work being done on the GPU. It is likely that bars with large red segments indicate a stalloccurring while the shader is executing. When the mouse hovers over a row in the Latency column, a tooltip appearsshowing the exact breakdown of that instruction’s latency.
In the image above, the total latency of the instruction is 853 clocks. Of those 853 clocks, 209 clocks worth of latencyare hidden by SALU work on other slots and 554 clocks worth of latency are hidden by VALU work. The 209 clockswhere both SALU and VALU work was being done is shown using the hatch pattern. The segment between 209 and554 clocks is shown as green since only VALU work is being done. The segment between 554 and 853 clocks is shownas red since there is no other work being done. Since there is more VALU work being done at the same time, green ismore prevalent than yellow in this bar.
6.5. Instruction Timing 57
Radeon GPU Profiler Documentation, Release 1.12.0
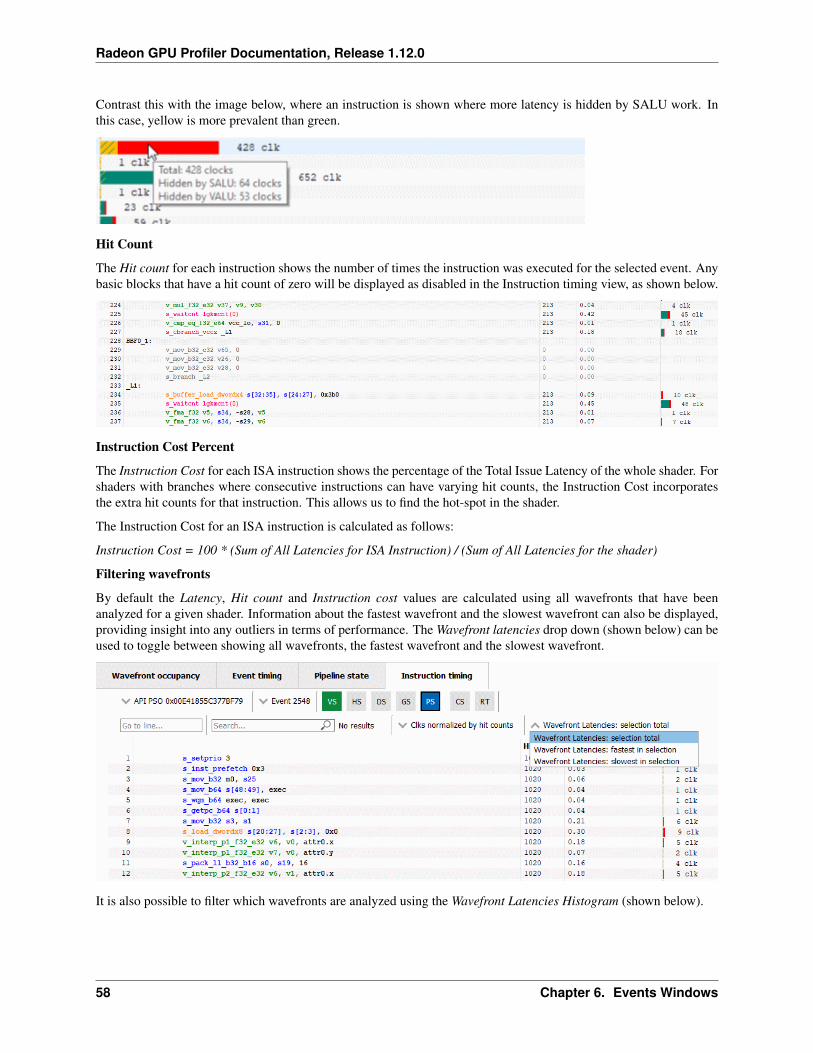
Contrast this with the image below, where an instruction is shown where more latency is hidden by SALU work. Inthis case, yellow is more prevalent than green.
Hit Count
The Hit count for each instruction shows the number of times the instruction was executed for the selected event. Anybasic blocks that have a hit count of zero will be displayed as disabled in the Instruction timing view, as shown below.
Instruction Cost Percent
The Instruction Cost for each ISA instruction shows the percentage of the Total Issue Latency of the whole shader. Forshaders with branches where consecutive instructions can have varying hit counts, the Instruction Cost incorporatesthe extra hit counts for that instruction. This allows us to find the hot-spot in the shader.
The Instruction Cost for an ISA instruction is calculated as follows:
Instruction Cost = 100 * (Sum of All Latencies for ISA Instruction) / (Sum of All Latencies for the shader)
Filtering wavefronts
By default the Latency, Hit count and Instruction cost values are calculated using all wavefronts that have beenanalyzed for a given shader. Information about the fastest wavefront and the slowest wavefront can also be displayed,providing insight into any outliers in terms of performance. The Wavefront latencies drop down (shown below) can beused to toggle between showing all wavefronts, the fastest wavefront and the slowest wavefront.
It is also possible to filter which wavefronts are analyzed using the Wavefront Latencies Histogram (shown below).
58 Chapter 6. Events Windows
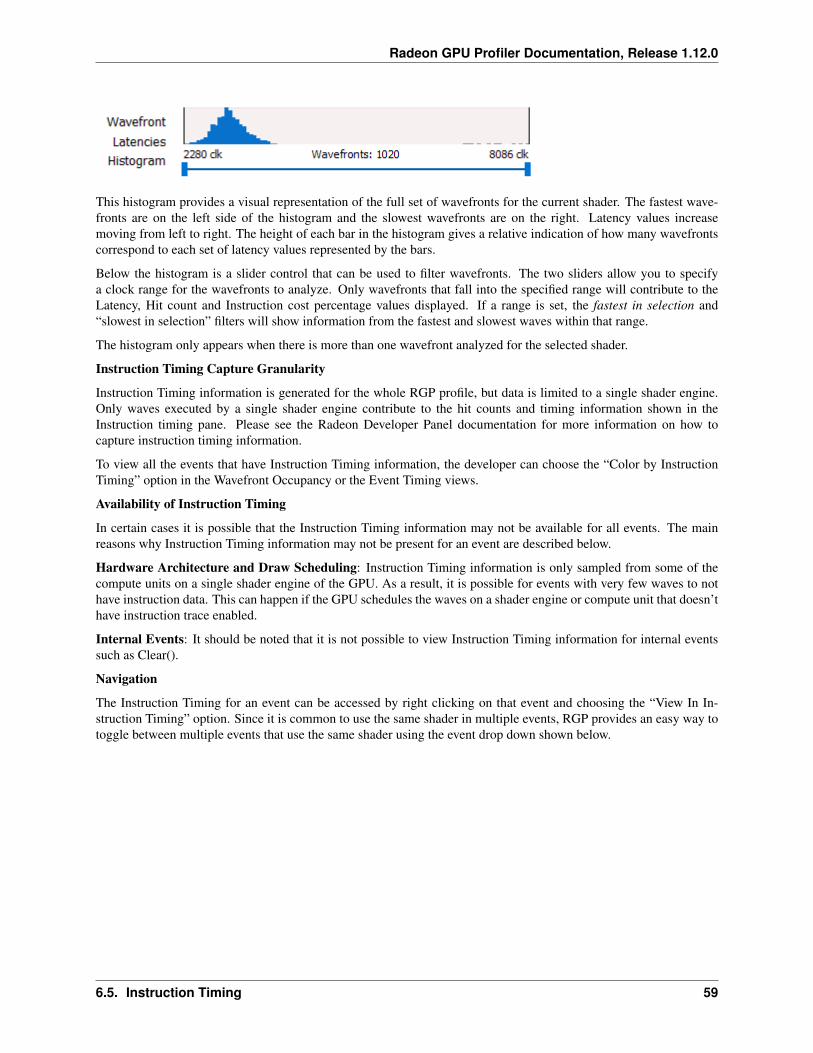
Radeon GPU Profiler Documentation, Release 1.12.0
This histogram provides a visual representation of the full set of wavefronts for the current shader. The fastest wave-fronts are on the left side of the histogram and the slowest wavefronts are on the right. Latency values increasemoving from left to right. The height of each bar in the histogram gives a relative indication of how many wavefrontscorrespond to each set of latency values represented by the bars.
Below the histogram is a slider control that can be used to filter wavefronts. The two sliders allow you to specifya clock range for the wavefronts to analyze. Only wavefronts that fall into the specified range will contribute to theLatency, Hit count and Instruction cost percentage values displayed. If a range is set, the fastest in selection and“slowest in selection” filters will show information from the fastest and slowest waves within that range.
The histogram only appears when there is more than one wavefront analyzed for the selected shader.
Instruction Timing Capture Granularity
Instruction Timing information is generated for the whole RGP profile, but data is limited to a single shader engine.Only waves executed by a single shader engine contribute to the hit counts and timing information shown in theInstruction timing pane. Please see the Radeon Developer Panel documentation for more information on how tocapture instruction timing information.
To view all the events that have Instruction Timing information, the developer can choose the “Color by InstructionTiming” option in the Wavefront Occupancy or the Event Timing views.
Availability of Instruction Timing
In certain cases it is possible that the Instruction Timing information may not be available for all events. The mainreasons why Instruction Timing information may not be present for an event are described below.
Hardware Architecture and Draw Scheduling: Instruction Timing information is only sampled from some of thecompute units on a single shader engine of the GPU. As a result, it is possible for events with very few waves to nothave instruction data. This can happen if the GPU schedules the waves on a shader engine or compute unit that doesn’thave instruction trace enabled.
Internal Events: It should be noted that it is not possible to view Instruction Timing information for internal eventssuch as Clear().
Navigation
The Instruction Timing for an event can be accessed by right clicking on that event and choosing the “View In In-struction Timing” option. Since it is common to use the same shader in multiple events, RGP provides an easy way totoggle between multiple events that use the same shader using the event drop down shown below.
6.5. Instruction Timing 59
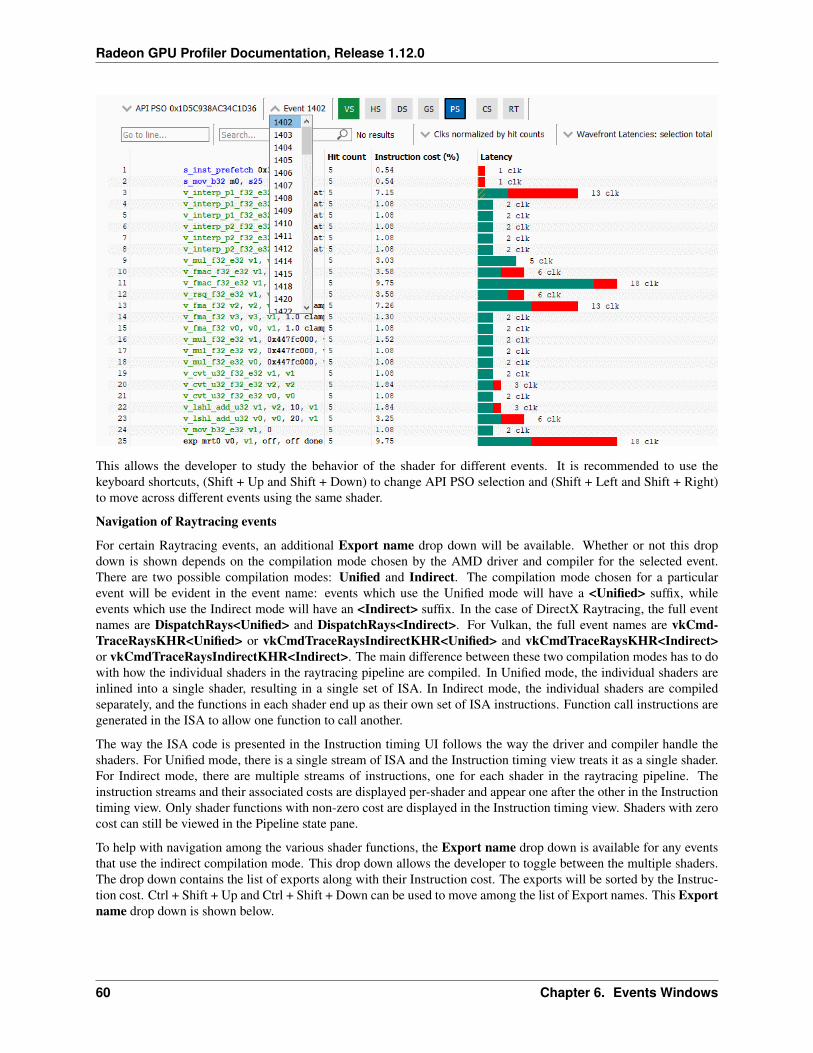
Radeon GPU Profiler Documentation, Release 1.12.0
This allows the developer to study the behavior of the shader for different events. It is recommended to use thekeyboard shortcuts, (Shift + Up and Shift + Down) to change API PSO selection and (Shift + Left and Shift + Right)to move across different events using the same shader.
Navigation of Raytracing events
For certain Raytracing events, an additional Export name drop down will be available. Whether or not this dropdown is shown depends on the compilation mode chosen by the AMD driver and compiler for the selected event.There are two possible compilation modes: Unified and Indirect. The compilation mode chosen for a particularevent will be evident in the event name: events which use the Unified mode will have a <Unified> suffix, whileevents which use the Indirect mode will have an <Indirect> suffix. In the case of DirectX Raytracing, the full eventnames are DispatchRays<Unified> and DispatchRays<Indirect>. For Vulkan, the full event names are vkCmd-TraceRaysKHR<Unified> or vkCmdTraceRaysIndirectKHR<Unified> and vkCmdTraceRaysKHR<Indirect>or vkCmdTraceRaysIndirectKHR<Indirect>. The main difference between these two compilation modes has to dowith how the individual shaders in the raytracing pipeline are compiled. In Unified mode, the individual shaders areinlined into a single shader, resulting in a single set of ISA. In Indirect mode, the individual shaders are compiledseparately, and the functions in each shader end up as their own set of ISA instructions. Function call instructions aregenerated in the ISA to allow one function to call another.
The way the ISA code is presented in the Instruction timing UI follows the way the driver and compiler handle theshaders. For Unified mode, there is a single stream of ISA and the Instruction timing view treats it as a single shader.For Indirect mode, there are multiple streams of instructions, one for each shader in the raytracing pipeline. Theinstruction streams and their associated costs are displayed per-shader and appear one after the other in the Instructiontiming view. Only shader functions with non-zero cost are displayed in the Instruction timing view. Shaders with zerocost can still be viewed in the Pipeline state pane.
To help with navigation among the various shader functions, the Export name drop down is available for any eventsthat use the indirect compilation mode. This drop down allows the developer to toggle between the multiple shaders.The drop down contains the list of exports along with their Instruction cost. The exports will be sorted by the Instruc-tion cost. Ctrl + Shift + Up and Ctrl + Shift + Down can be used to move among the list of Export names. This Exportname drop down is shown below.
60 Chapter 6. Events Windows
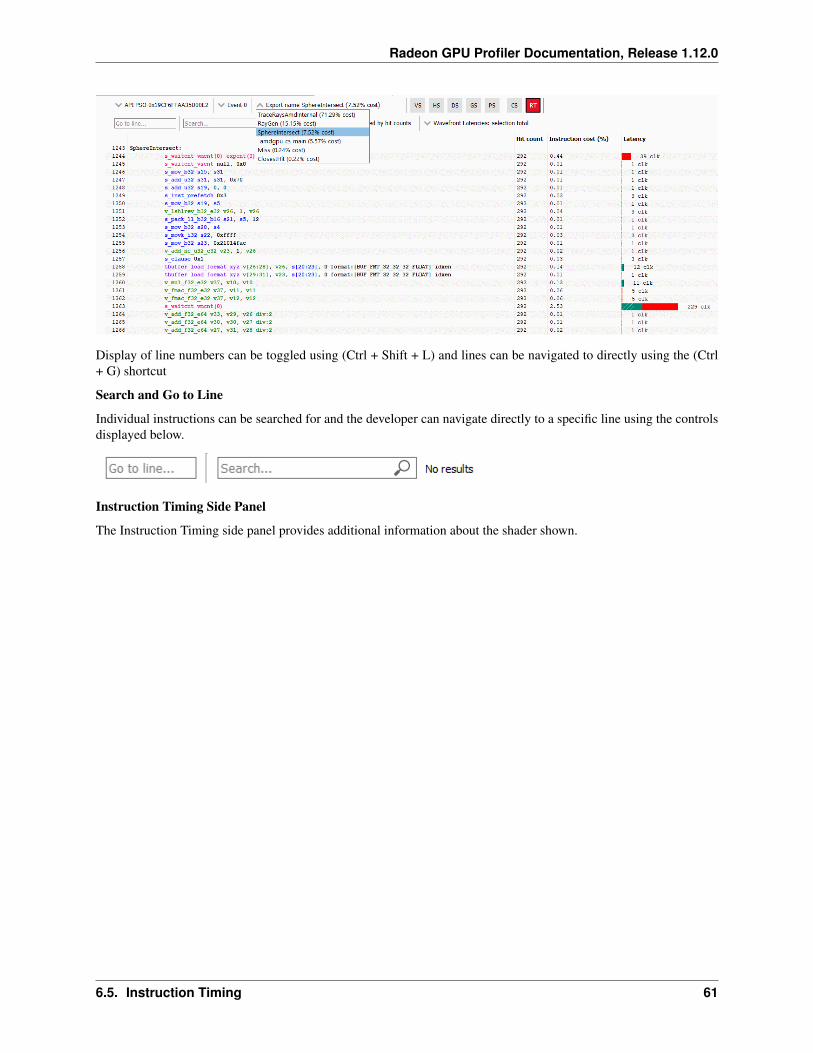
Radeon GPU Profiler Documentation, Release 1.12.0
Display of line numbers can be toggled using (Ctrl + Shift + L) and lines can be navigated to directly using the (Ctrl+ G) shortcut
Search and Go to Line
Individual instructions can be searched for and the developer can navigate directly to a specific line using the controlsdisplayed below.
Instruction Timing Side Panel
The Instruction Timing side panel provides additional information about the shader shown.
6.5. Instruction Timing 61
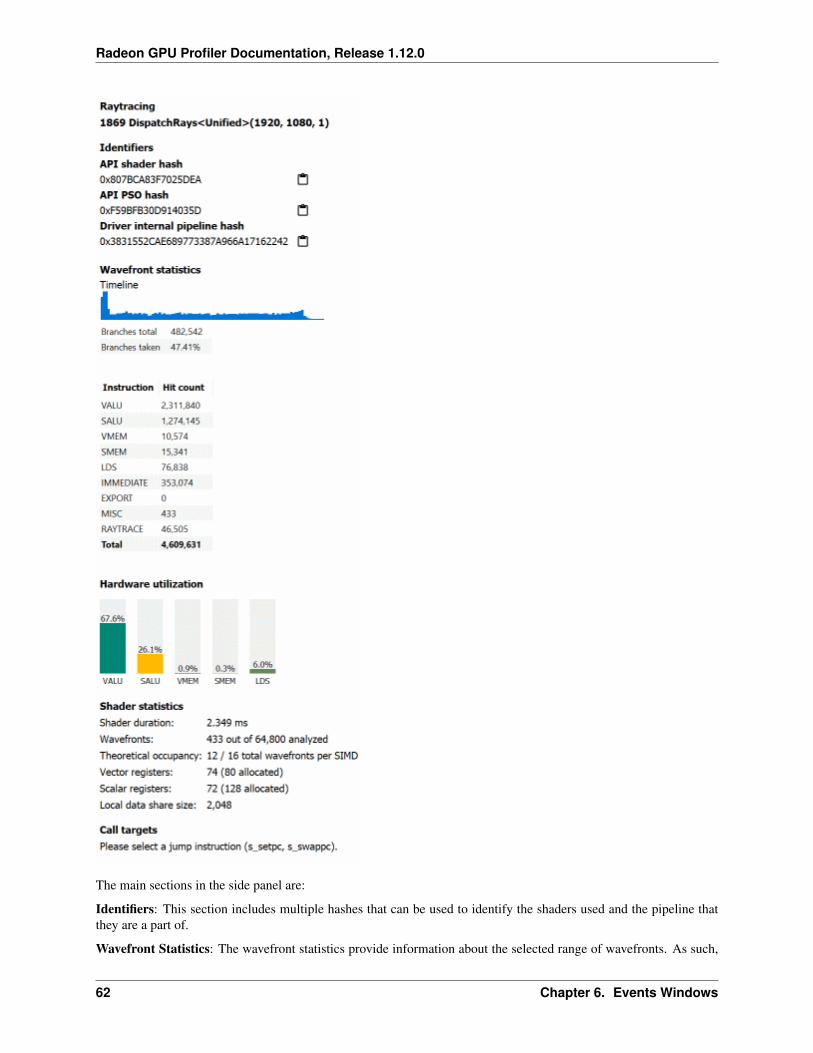
Radeon GPU Profiler Documentation, Release 1.12.0
The main sections in the side panel are:
Identifiers: This section includes multiple hashes that can be used to identify the shaders used and the pipeline thatthey are a part of.
Wavefront Statistics: The wavefront statistics provide information about the selected range of wavefronts. As such,
62 Chapter 6. Events Windows
Radeon GPU Profiler Documentation, Release 1.12.0
the information displayed depends on both the selected mode in the Wavefront latencies drop down as well as therange selected in the Wavefront Latencies Histogram.
The Timeline provides a visual representation of when the selected wavefronts were executed. When the Histogramis used to limit the range of wavefronts, the Timeline is updated such that waves that do not fall within the specifiedrange are displayed as grey. Only waves that fall within the range are displayed as blue. This allows you to seewhere particular waves were executed. For instance, it might be expected that slower waves were executed early onif, for instance, memory caches were not yet warm. Using the Timeline in conjunction with the Histogram can helpdetermine where a bottleneck might be.
The Branches table denotes the number of branch instructions in the shader and the percentage of the total number ofbranches that were taken by the shader.
The Instruction Types table provides information about the dynamic instruction mix of the shader’s execution. Thecolumns denote the different types of instructions supported by RDNA and GCN. The counts denote the number ofinstructions of each category.
Each category’s count denote the instruction count for that shader’s invocation in the event. Different executions ofthe same shader could have different Instruction statistics based on factors such as the number of wavefronts launchedfor the shader and loop parameters. The instruction categories are briefly described below. Please see the ShaderProgramming Guides for more details.
• VALU: Includes vector ALU instructions
• SALU: Includes scalar ALU instructions
• VMEM: Includes vector memory and flat memory instructions
• SMEM: Includes scalar memory instructions
• LDS: Includes Local Data Share instructions
• IMMEDIATE: Includes the immediate instructions such as s_nop and s_waitcnt.
• EXPORT: Includes export instructions
• MISC: Includes other miscellaneous instructions such as s_endpgm
• RAYTRACE: Includes the BVH instructions used during raytracing.
The instruction types table provides a useful summary of the shader’s structure especially for very long shaders.
Hardware Utilization: The Hardware utilization bar charts show the utilization of each functional unit of the GPUon a per-shader basis.
It should be noted that utilization shown is only for the shader being viewed. For example, in the image shown, theVALU utilization of the shader is 67.6%. This means that the Raytracing shader shown used 67.6% of the VALUcapacity of the GPU. Other shaders may be concurrently executing on the GPU. Their usage of the VALU is notconsidered when showing the bar charts.
A functional unit’s utilization is calculated as follows:
Utilization % = 100 * (Hit Count of all instructions executed on the functional unit) / (Duration of analyzed wavefronts)
Shader Statistics: The shader statistics section provides useful information about the shader
• Shader Duration: This denotes the execution duration of the whole shader. It can be correlated with the timingsseen for the same shader in other RGP views such as the Wavefront Occupancy and the Event Timing views.
• Wavefronts: This denotes the total number of wavefronts in the shader and the number of wavefronts analyzedas part of building the Instruction Timing visualizations. It is expected that not all waves in the shader will beanalyzed. This is for the same reasons described above when discussing the availability of Instruction Timing.
• Theoretical Occupancy: From the register information and knowledge about the GPU architecture we can cal-culate the theoretical maximum wavefront occupancy for the shader.
6.5. Instruction Timing 63
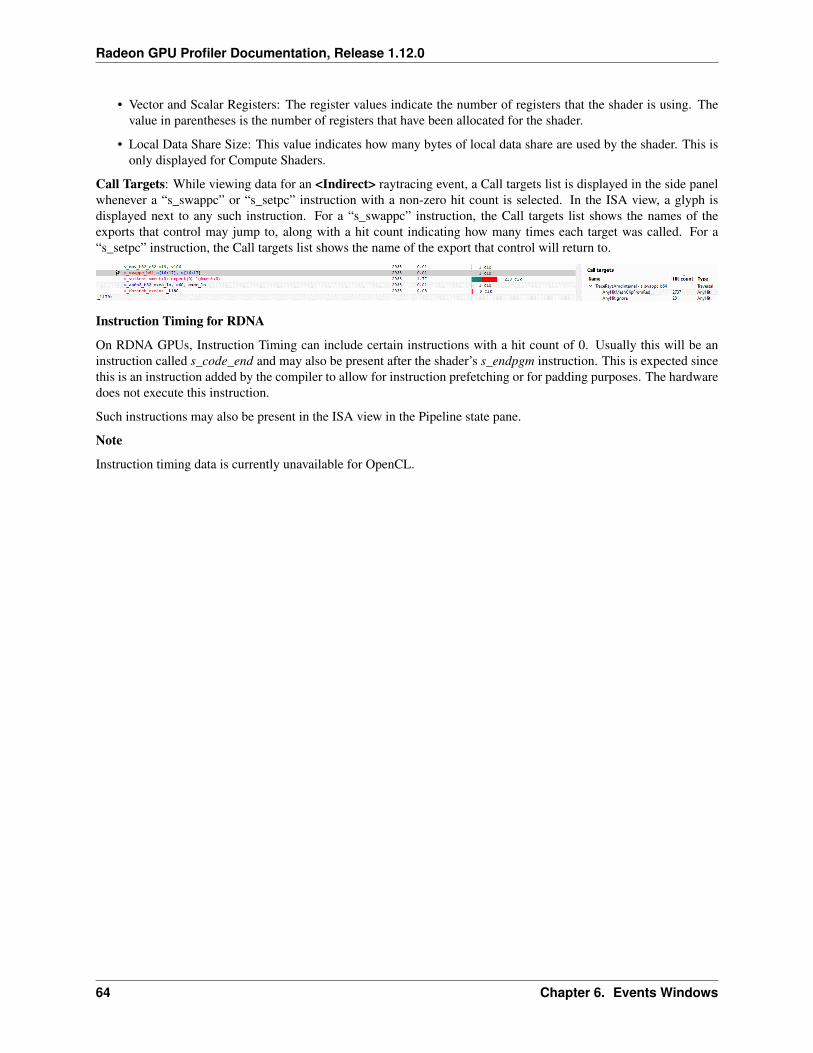
Radeon GPU Profiler Documentation, Release 1.12.0
• Vector and Scalar Registers: The register values indicate the number of registers that the shader is using. Thevalue in parentheses is the number of registers that have been allocated for the shader.
• Local Data Share Size: This value indicates how many bytes of local data share are used by the shader. This isonly displayed for Compute Shaders.
Call Targets: While viewing data for an <Indirect> raytracing event, a Call targets list is displayed in the side panelwhenever a “s_swappc” or “s_setpc” instruction with a non-zero hit count is selected. In the ISA view, a glyph isdisplayed next to any such instruction. For a “s_swappc” instruction, the Call targets list shows the names of theexports that control may jump to, along with a hit count indicating how many times each target was called. For a“s_setpc” instruction, the Call targets list shows the name of the export that control will return to.
Instruction Timing for RDNA
On RDNA GPUs, Instruction Timing can include certain instructions with a hit count of 0. Usually this will be aninstruction called s_code_end and may also be present after the shader’s s_endpgm instruction. This is expected sincethis is an instruction added by the compiler to allow for instruction prefetching or for padding purposes. The hardwaredoes not execute this instruction.
Such instructions may also be present in the ISA view in the Pipeline state pane.
Note
Instruction timing data is currently unavailable for OpenCL.
64 Chapter 6. Events Windows
CHAPTER 7
Zoom Controls
Time based graphs in RGP provide Zoom controls for adjusting the time scale that is viewable on screen. The followingset of zoom icons are displayed above each graph that supports zooming:
7.1 Zoom to selection
When Zoom to selection is clicked, the zoom level is increased to a selected region or selected event. A selectionregion is set by holding down the left mouse button while the mouse is on the graph and dragging the mouse either leftor right. A colored overlay will highlight the selected region on the graph. For graphs that support it, an event maybe selected by clicking on it with the mouse (either the left or right button). Zoom to selection can also be activatedby right clicking on a selection on the graph and choosing the Zoom to selection context menu option. Zooming toa selected event can be accomplished by simply double clicking the event. Pressing the Z shortcut key while holdingdown the CTRL key activates Zoom to selection as well.
7.2 Zoom reset
When Zoom reset is clicked, the zoom level is returned to the original level to reveal the entire time span on the graph.The zoom level can also be reset using the H shortcut key.
7.3 Zoom in
Increases the zoom level incrementally to display a shorter time span on the graph. The zoom level is increased eachtime this icon is clicked until the maximum zoom level is reached. Alternatively, holding down the CTRL key andscrolling the mouse wheel up while the mouse pointer is over the graph will also zoom in for a more detailed view.Zooming in can be activated with the A shortcut key. To zoom in quickly at a 10x rate, press the S shortcut key.
65
Radeon GPU Profiler Documentation, Release 1.12.0
7.4 Zoom out
Decreases the zoom level incrementally to display a longer time span on the graph. The zoom level is decreased eachtime this icon is clicked until the minimum zoom level is reached (i.e. the full available time region). Alternatively,holding down the CTRL key and scrolling the mouse wheel down while the mouse pointer is over the graph will alsozoom out for more detailed view. Zooming out can be activated with the Z shortcut key. To zoom out quickly at a 10xrate, press the X shortcut key.
7.5 Zoom Panning
When zoomed in on a graph region, the view can be shifted left or right by using the horizontal scroll bar. The viewcan also be scrolled by dragging the mouse left or right while holding down the spacebar and the left mouse button.Left and right arrow keys can be used to scroll as well.
7.6 Synchronized Zoom
Normally, adjusting the view of a time based graph (by zooming in and scrolling) doesn’t affect graphs on other panes.This can be useful in some cases when tracking more than one item. However, it is sometimes useful to lock both theevent timing and wavefront occupancy views to the same visible time window. There is an option to control this in the‘General’ tab of the Settings section called Sync event time windows. With this enabled, any zooming and scrollingin one window will be reflected in the other. If adjustments are made in the wavefront occupancy view, the verticalscroll bar in the event timing view will be automatically adjusted so that there are always events shown on screen if anevent isn’t manually selected.
66 Chapter 7. Zoom Controls
CHAPTER 8
User Debug Markers
User markers can help application developers to correlate the data seen in RGP with their application behavior. UserMarkers are presently not supported for OpenCL.
8.1 DirectX12 User Markers
For DirectX12, there are two recommended ways to instrument your application with user markers that can be viewedwithin RGP:
1. using Microsoft® PIX3 event instrumentation, or
2. using the debug marker support in AMD GPU Services (AGS) Library.
8.2 Using PIX3 event instrumentation for DirectX12 user debug mark-ers
If your application has been instrumented with PIX3 user markers, then to view the markers within RGP is a simplematter of recompiling the source code of the application with a slightly modified PIX header file. The steps describedhere require a WinPixEventRuntime version of at least 1.0.200127001.
The PIX3 event instrumentation functions supported by RGP are:
void PIXBeginEvent(ID3D12GraphicsCommandList* commandList, ...)void PIXEndEvent(ID3D12GraphicsCommandList* commandList)void PIXSetMarker(ID3D12GraphicsCommandList* commandList, ...)
The steps to update the PIX header file are:
1. Copy the entire samples\AMDDxExt folder provided in the RGP package to the locationwhere the PIX header files (pix3.h, pix3_win.h) reside (typically at WinPixEventRuntime.[x.x]\Include\WinPixEventRuntime).
67
Radeon GPU Profiler Documentation, Release 1.12.0
2. Add #include "AmdDxExt\AmdPix3.h" to the top of PIXEvents.h:
When using WinPixEventRuntime version 1.0.210209001:
#if defined(USE_PIX) || !defined(PIX_XBOX)#define PIX_CONTEXT_EMIT_CPU_EVENTS#include "AmdDxExt\AmdPix3.h"#endif
When using WinPixEventRuntime version 1.0.200127001:
#include "PIXEventsCommon.h"
#if defined(XBOX) || defined(_XBOX_ONE) || defined(_DURANGO)# define PIX_XBOX#else#include "AmdDxExt\AmdPix3.h"#endif
3. Update the PIXEvents.h file to add an Rgp prefix to the the existing calls to PIXBeginEventOnContextCpu,PIXEndEventOnContextCpu and PIXSetMarkerOnContextCpu:
When using WinPixEventRuntime version 1.0.210209001:
#ifdef PIX_CONTEXT_EMIT_CPU_EVENTS// PIXBeginEventOnContextCpu(context, color, formatString, args...);RgpPIXBeginEventOnContextCpu(context, color, formatString, args...);
#endif
#ifdef PIX_CONTEXT_EMIT_CPU_EVENTS// PIXSetMarkerOnContextCpu(context, color, formatString, args...);RgpPIXSetMarkerOnContextCpu(context, color, formatString, args...);
#endif
#ifdef PIX_CONTEXT_EMIT_CPU_EVENTS// PIXEndEventOnContextCpu(context);RgpPIXEndEventOnContextCpu(context);
#endif
When using WinPixEventRuntime version 1.0.200127001:
#if PIX_XBOXPIXBeginEvent(color, formatString, args...);
#else// PIXBeginEventOnContextCpu(context, color, formatString, args...);RgpPIXBeginEventOnContextCpu(context, color, formatString, args...);
#endif
#if PIX_XBOXPIXEndEvent();
#else// PIXEndEventOnContextCpu(context);RgpPIXEndEventOnContextCpu(context);
#endif
#if PIX_XBOXPIXSetMarker(color, formatString, args...);
(continues on next page)
68 Chapter 8. User Debug Markers
Radeon GPU Profiler Documentation, Release 1.12.0
(continued from previous page)
#else// PIXSetMarkerOnContextCpu(context, color, formatString, args...);RgpPIXSetMarkerOnContextCpu(context, color, formatString, args...);
#endif
4. Recompile the application. Note that the RGP user markers are only enabled when the corresponding PIX eventinstrumentation is also enabled with one of the preprocessor symbols: USE_PIX, DBG, _DEBUG, PROFILE, orPROFILE_BUILD.
The PIX3 event instrumentation within the application continues to be usable for Microsoft PIX tool without additionalside effects or overhead.
To find a more complete description of how to use the PIX event instrumentation, refer to https://blogs.msdn.microsoft.com/pix/winpixeventruntime/.
See many examples of using PIX event instrumentation at https://github.com/Microsoft/DirectX-Graphics-Samples.
8.3 Using AGS for DirectX12 user debug markers
The AMD GPU Services (AGS) library provides software developers with the ability to query AMD GPU softwareand hardware state information that is not normally available through standard operating systems or graphic APIs.AGS includes support for querying graphics driver version info, GPU performance, CrossFire™ (AMD’s multi-GPUrendering technology) configuration info, and Eyefinity (AMD’s multi-display rendering technology) configurationinfo. AGS also exposes the explicit Crossfire API extension, GCN shader extensions, and additional extensions sup-ported in the AMD drivers for DirectX® 11 and DirectX 12. One of the features in AGS is the support for DirectX 12user debug markers.
User markers can be inserted into your application using AGS function calls. The inserted user markers can then beviewed within RGP. The main steps to obtaining user markers are described below.
Articles and blogs about AGS can be found here: https://gpuopen.com/amd-gpu-services-ags-library/
Additional API documentation for AGS can be found at: https://gpuopen-librariesandsdks.github.io/ags/
8.3.1 Download AGS
Download the AGS library from: https://github.com/GPUOpen-LibrariesAndSDKs/AGS_SDK/
The library consists of pre-built Windows libraries, DLLs, sample and documentation. You will need to use files inthe following two dirs.
• Headers: AGS_SDK-master\ags_lib\inc
• Libraries: AGS_SDK-master\ags_lib\lib
8.3.2 Integrate AGS header, libs, and DLL into your project
AGS requires one header (amd_ags.h) to be included in your source code. Add the location of the AGS header tothe Visual Studio project settings and include the header in the relevant code files.
#include “amd_ags.h”
Link your exe against correct AGS library for your project (32 or 64bit, MD or MT static library, debug or release, orDLL).
8.3. Using AGS for DirectX12 user debug markers 69
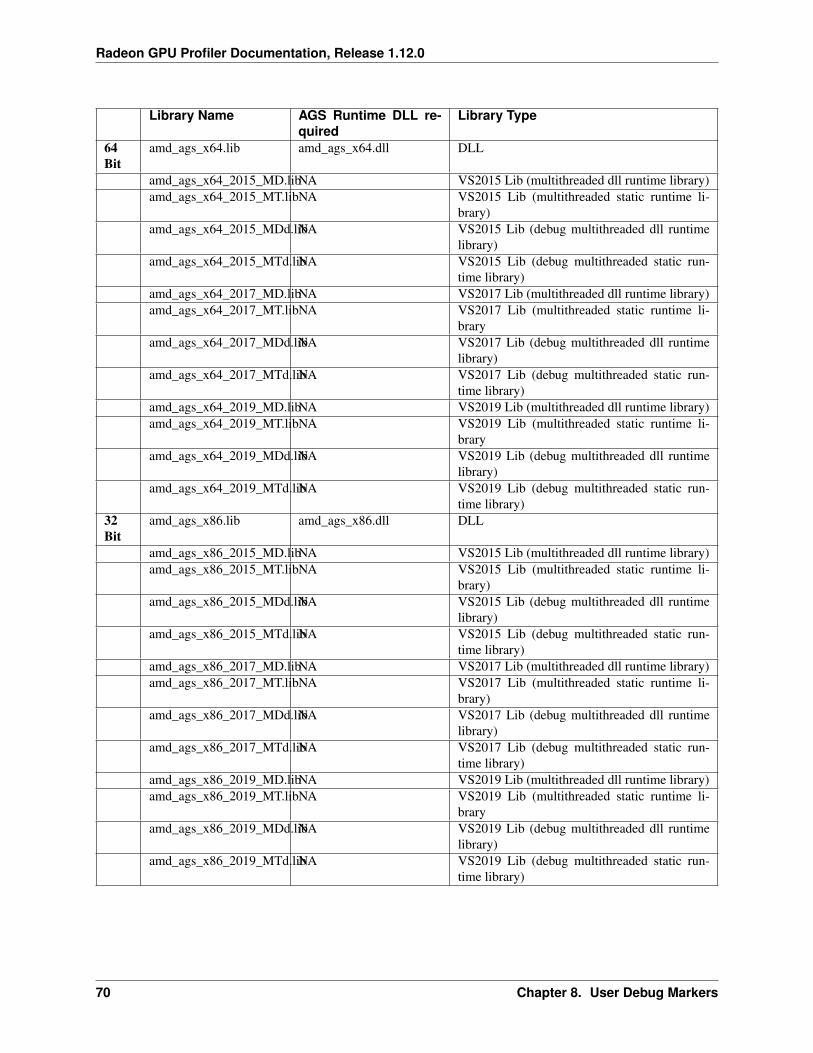
Radeon GPU Profiler Documentation, Release 1.12.0
Library Name AGS Runtime DLL re-quired
Library Type
64Bit
amd_ags_x64.lib amd_ags_x64.dll DLL
amd_ags_x64_2015_MD.libNA VS2015 Lib (multithreaded dll runtime library)amd_ags_x64_2015_MT.libNA VS2015 Lib (multithreaded static runtime li-
brary)amd_ags_x64_2015_MDd.libNA VS2015 Lib (debug multithreaded dll runtime
library)amd_ags_x64_2015_MTd.libNA VS2015 Lib (debug multithreaded static run-
time library)amd_ags_x64_2017_MD.libNA VS2017 Lib (multithreaded dll runtime library)amd_ags_x64_2017_MT.libNA VS2017 Lib (multithreaded static runtime li-
braryamd_ags_x64_2017_MDd.libNA VS2017 Lib (debug multithreaded dll runtime
library)amd_ags_x64_2017_MTd.libNA VS2017 Lib (debug multithreaded static run-
time library)amd_ags_x64_2019_MD.libNA VS2019 Lib (multithreaded dll runtime library)amd_ags_x64_2019_MT.libNA VS2019 Lib (multithreaded static runtime li-
braryamd_ags_x64_2019_MDd.libNA VS2019 Lib (debug multithreaded dll runtime
library)amd_ags_x64_2019_MTd.libNA VS2019 Lib (debug multithreaded static run-
time library)32Bit
amd_ags_x86.lib amd_ags_x86.dll DLL
amd_ags_x86_2015_MD.libNA VS2015 Lib (multithreaded dll runtime library)amd_ags_x86_2015_MT.libNA VS2015 Lib (multithreaded static runtime li-
brary)amd_ags_x86_2015_MDd.libNA VS2015 Lib (debug multithreaded dll runtime
library)amd_ags_x86_2015_MTd.libNA VS2015 Lib (debug multithreaded static run-
time library)amd_ags_x86_2017_MD.libNA VS2017 Lib (multithreaded dll runtime library)amd_ags_x86_2017_MT.libNA VS2017 Lib (multithreaded static runtime li-
brary)amd_ags_x86_2017_MDd.libNA VS2017 Lib (debug multithreaded dll runtime
library)amd_ags_x86_2017_MTd.libNA VS2017 Lib (debug multithreaded static run-
time library)amd_ags_x86_2019_MD.libNA VS2019 Lib (multithreaded dll runtime library)amd_ags_x86_2019_MT.libNA VS2019 Lib (multithreaded static runtime li-
braryamd_ags_x86_2019_MDd.libNA VS2019 Lib (debug multithreaded dll runtime
library)amd_ags_x86_2019_MTd.libNA VS2019 Lib (debug multithreaded static run-
time library)
70 Chapter 8. User Debug Markers
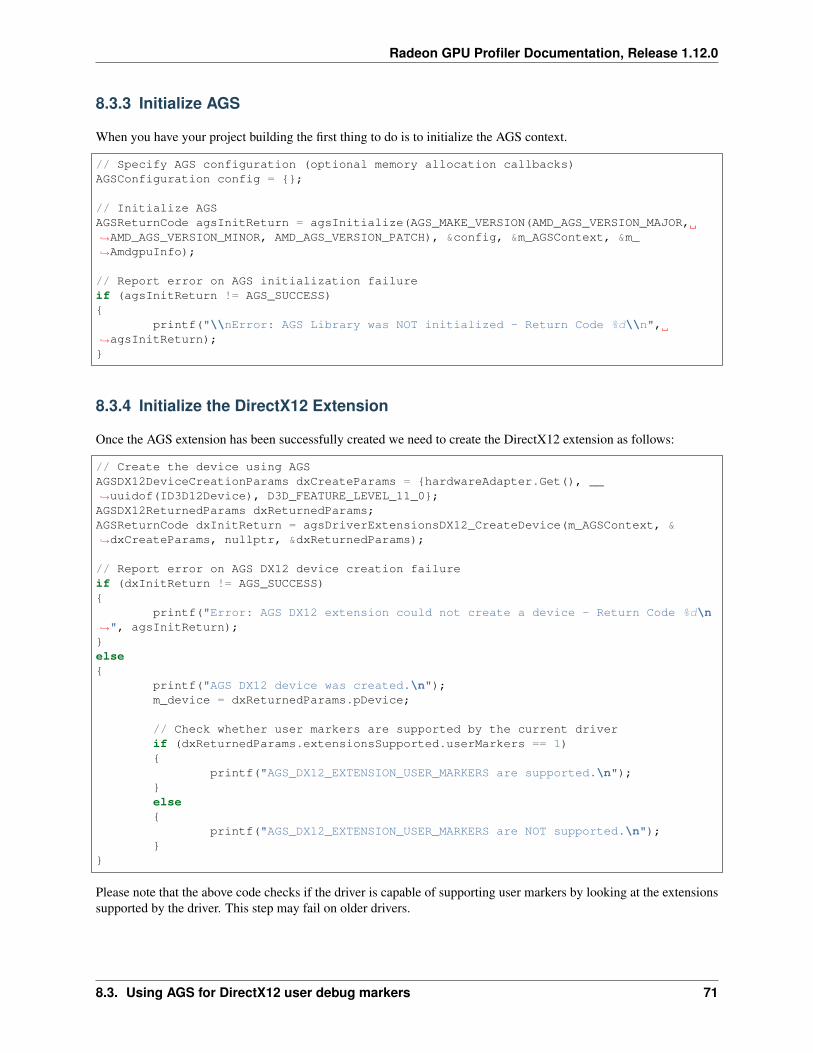
Radeon GPU Profiler Documentation, Release 1.12.0
8.3.3 Initialize AGS
When you have your project building the first thing to do is to initialize the AGS context.
// Specify AGS configuration (optional memory allocation callbacks)AGSConfiguration config = {};
// Initialize AGSAGSReturnCode agsInitReturn = agsInitialize(AGS_MAKE_VERSION(AMD_AGS_VERSION_MAJOR,→˓AMD_AGS_VERSION_MINOR, AMD_AGS_VERSION_PATCH), &config, &m_AGSContext, &m_→˓AmdgpuInfo);
// Report error on AGS initialization failureif (agsInitReturn != AGS_SUCCESS){
printf("\\nError: AGS Library was NOT initialized - Return Code %d\\n",→˓agsInitReturn);}
8.3.4 Initialize the DirectX12 Extension
Once the AGS extension has been successfully created we need to create the DirectX12 extension as follows:
// Create the device using AGSAGSDX12DeviceCreationParams dxCreateParams = {hardwareAdapter.Get(), __→˓uuidof(ID3D12Device), D3D_FEATURE_LEVEL_11_0};AGSDX12ReturnedParams dxReturnedParams;AGSReturnCode dxInitReturn = agsDriverExtensionsDX12_CreateDevice(m_AGSContext, &→˓dxCreateParams, nullptr, &dxReturnedParams);
// Report error on AGS DX12 device creation failureif (dxInitReturn != AGS_SUCCESS){
printf("Error: AGS DX12 extension could not create a device - Return Code %d\n→˓", agsInitReturn);}else{
printf("AGS DX12 device was created.\n");m_device = dxReturnedParams.pDevice;
// Check whether user markers are supported by the current driverif (dxReturnedParams.extensionsSupported.userMarkers == 1){
printf("AGS_DX12_EXTENSION_USER_MARKERS are supported.\n");}else{
printf("AGS_DX12_EXTENSION_USER_MARKERS are NOT supported.\n");}
}
Please note that the above code checks if the driver is capable of supporting user markers by looking at the extensionssupported by the driver. This step may fail on older drivers.
8.3. Using AGS for DirectX12 user debug markers 71
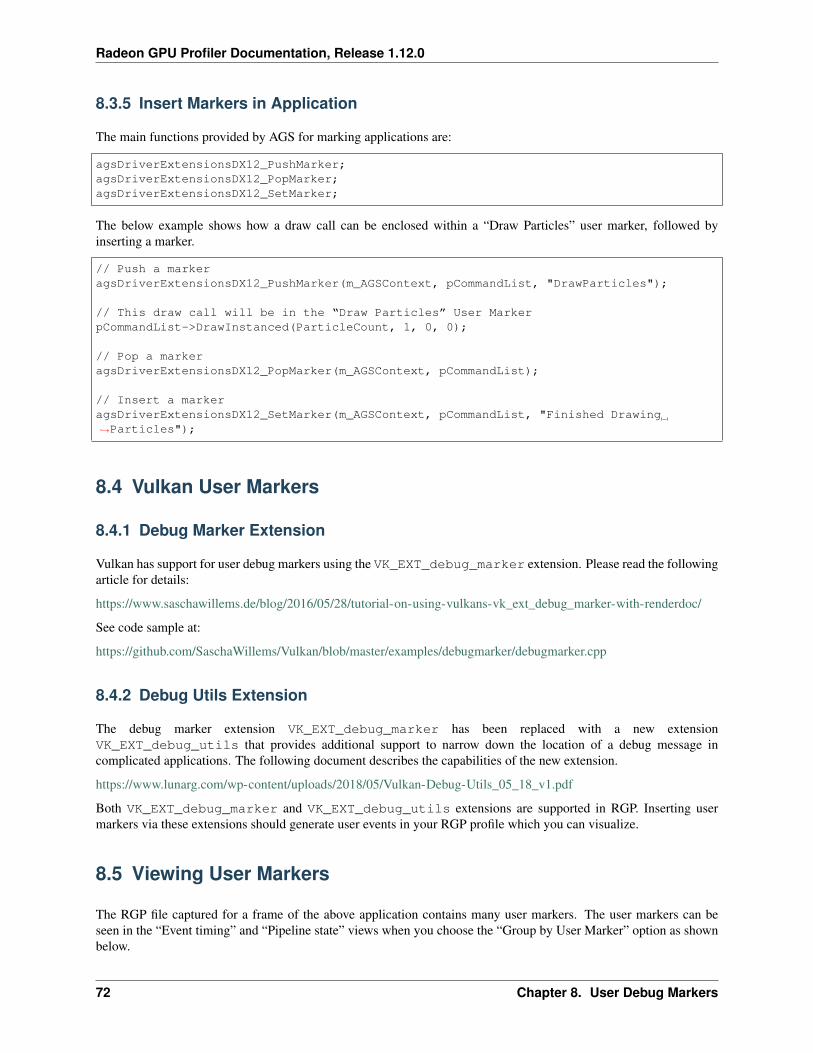
Radeon GPU Profiler Documentation, Release 1.12.0
8.3.5 Insert Markers in Application
The main functions provided by AGS for marking applications are:
agsDriverExtensionsDX12_PushMarker;agsDriverExtensionsDX12_PopMarker;agsDriverExtensionsDX12_SetMarker;
The below example shows how a draw call can be enclosed within a “Draw Particles” user marker, followed byinserting a marker.
// Push a markeragsDriverExtensionsDX12_PushMarker(m_AGSContext, pCommandList, "DrawParticles");
// This draw call will be in the “Draw Particles” User MarkerpCommandList->DrawInstanced(ParticleCount, 1, 0, 0);
// Pop a markeragsDriverExtensionsDX12_PopMarker(m_AGSContext, pCommandList);
// Insert a markeragsDriverExtensionsDX12_SetMarker(m_AGSContext, pCommandList, "Finished Drawing→˓Particles");
8.4 Vulkan User Markers
8.4.1 Debug Marker Extension
Vulkan has support for user debug markers using the VK_EXT_debug_marker extension. Please read the followingarticle for details:
https://www.saschawillems.de/blog/2016/05/28/tutorial-on-using-vulkans-vk_ext_debug_marker-with-renderdoc/
See code sample at:
https://github.com/SaschaWillems/Vulkan/blob/master/examples/debugmarker/debugmarker.cpp
8.4.2 Debug Utils Extension
The debug marker extension VK_EXT_debug_marker has been replaced with a new extensionVK_EXT_debug_utils that provides additional support to narrow down the location of a debug message incomplicated applications. The following document describes the capabilities of the new extension.
https://www.lunarg.com/wp-content/uploads/2018/05/Vulkan-Debug-Utils_05_18_v1.pdf
Both VK_EXT_debug_marker and VK_EXT_debug_utils extensions are supported in RGP. Inserting usermarkers via these extensions should generate user events in your RGP profile which you can visualize.
8.5 Viewing User Markers
The RGP file captured for a frame of the above application contains many user markers. The user markers can beseen in the “Event timing” and “Pipeline state” views when you choose the “Group by User Marker” option as shownbelow.
72 Chapter 8. User Debug Markers
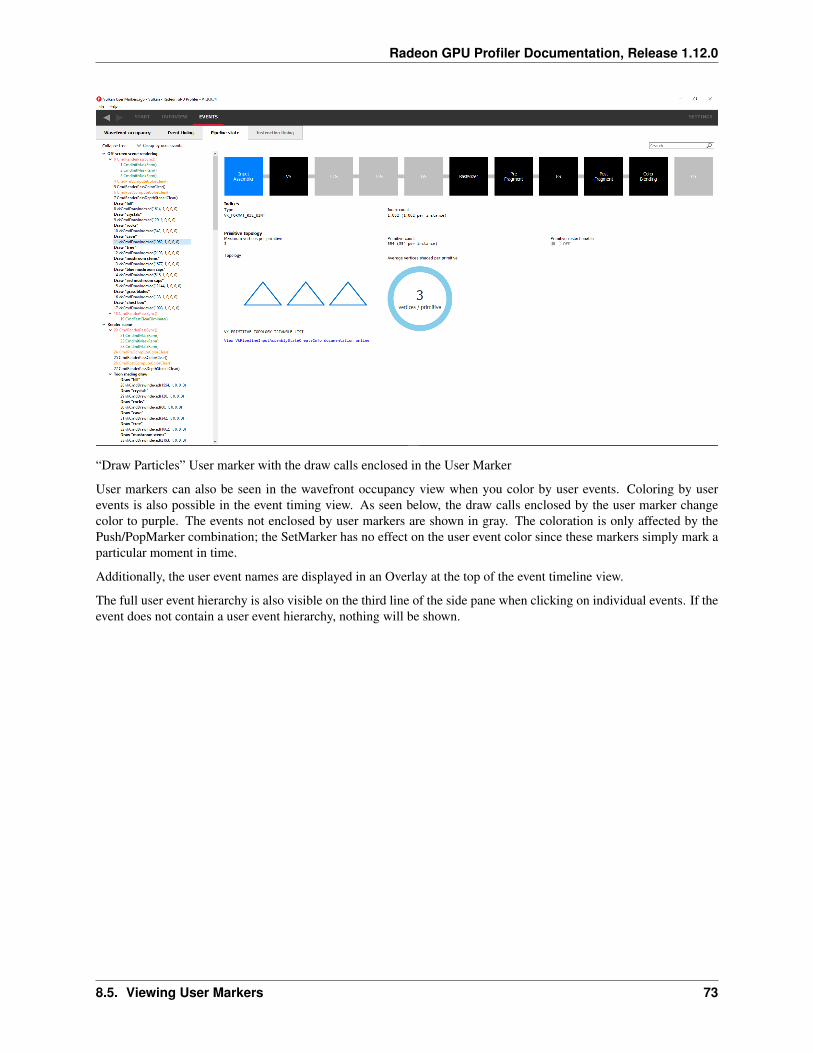
Radeon GPU Profiler Documentation, Release 1.12.0
“Draw Particles” User marker with the draw calls enclosed in the User Marker
User markers can also be seen in the wavefront occupancy view when you color by user events. Coloring by userevents is also possible in the event timing view. As seen below, the draw calls enclosed by the user marker changecolor to purple. The events not enclosed by user markers are shown in gray. The coloration is only affected by thePush/PopMarker combination; the SetMarker has no effect on the user event color since these markers simply mark aparticular moment in time.
Additionally, the user event names are displayed in an Overlay at the top of the event timeline view.
The full user event hierarchy is also visible on the third line of the side pane when clicking on individual events. If theevent does not contain a user event hierarchy, nothing will be shown.
8.5. Viewing User Markers 73
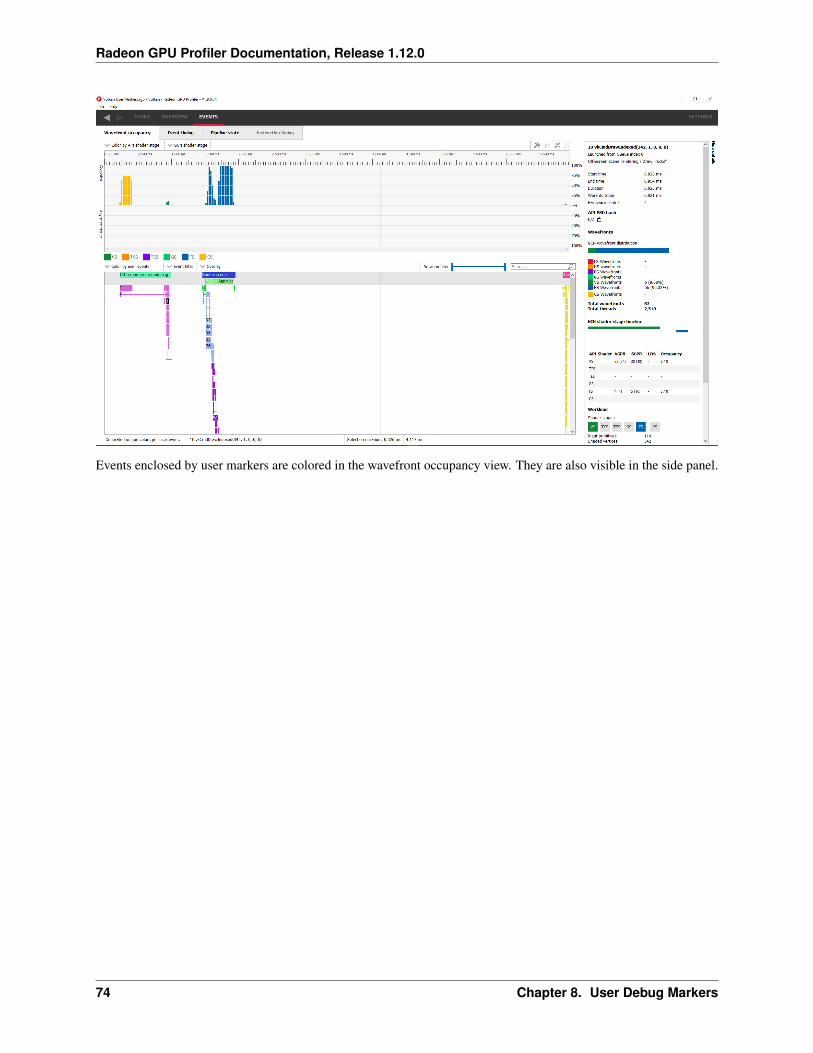
Radeon GPU Profiler Documentation, Release 1.12.0
Events enclosed by user markers are colored in the wavefront occupancy view. They are also visible in the side panel.
74 Chapter 8. User Debug Markers
CHAPTER 9
RenderDoc & Radeon GPU Profiler interop BETA
In addition to the typical use case where RGP profiles are generated using Radeon Developer Panel, profiles can alsobe generated using RenderDoc. When an RGP profile is generated by RenderDoc, events can be correlated across bothtools. This feature is only supported for DirectX12 and Vulkan.
9.1 Intended usage
We encourage users to use both Radeon Developer Panel and RenderDoc to obtain profiling data. The former willproduce the best data for performance analysis, and the latter can be used to pinpoint which elements of a frameconsume the most GPU time. Consider this interop feature as a supplement instead of a replacement for profilegeneration.
9.2 Obtaining a profile from RenderDoc
First, load RenderDoc and capture a frame as usual. Next, create a new profile for that capture as shown below:
75
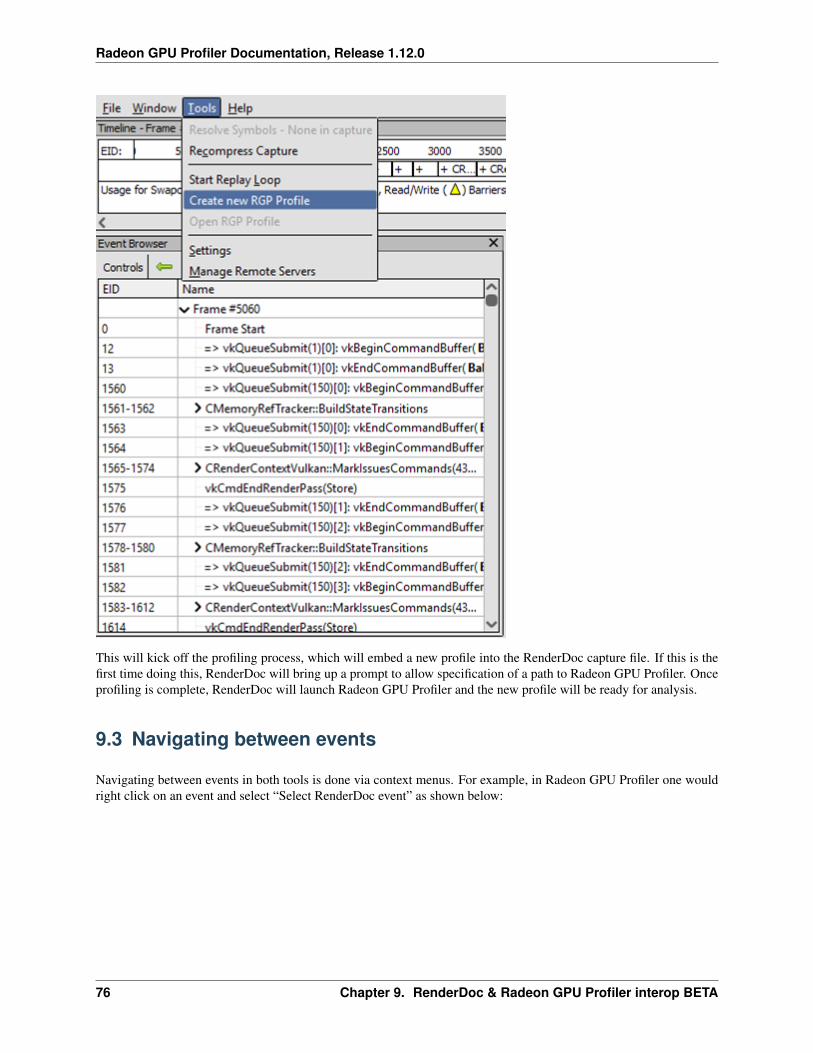
Radeon GPU Profiler Documentation, Release 1.12.0
This will kick off the profiling process, which will embed a new profile into the RenderDoc capture file. If this is thefirst time doing this, RenderDoc will bring up a prompt to allow specification of a path to Radeon GPU Profiler. Onceprofiling is complete, RenderDoc will launch Radeon GPU Profiler and the new profile will be ready for analysis.
9.3 Navigating between events
Navigating between events in both tools is done via context menus. For example, in Radeon GPU Profiler one wouldright click on an event and select “Select RenderDoc event” as shown below:
76 Chapter 9. RenderDoc & Radeon GPU Profiler interop BETA
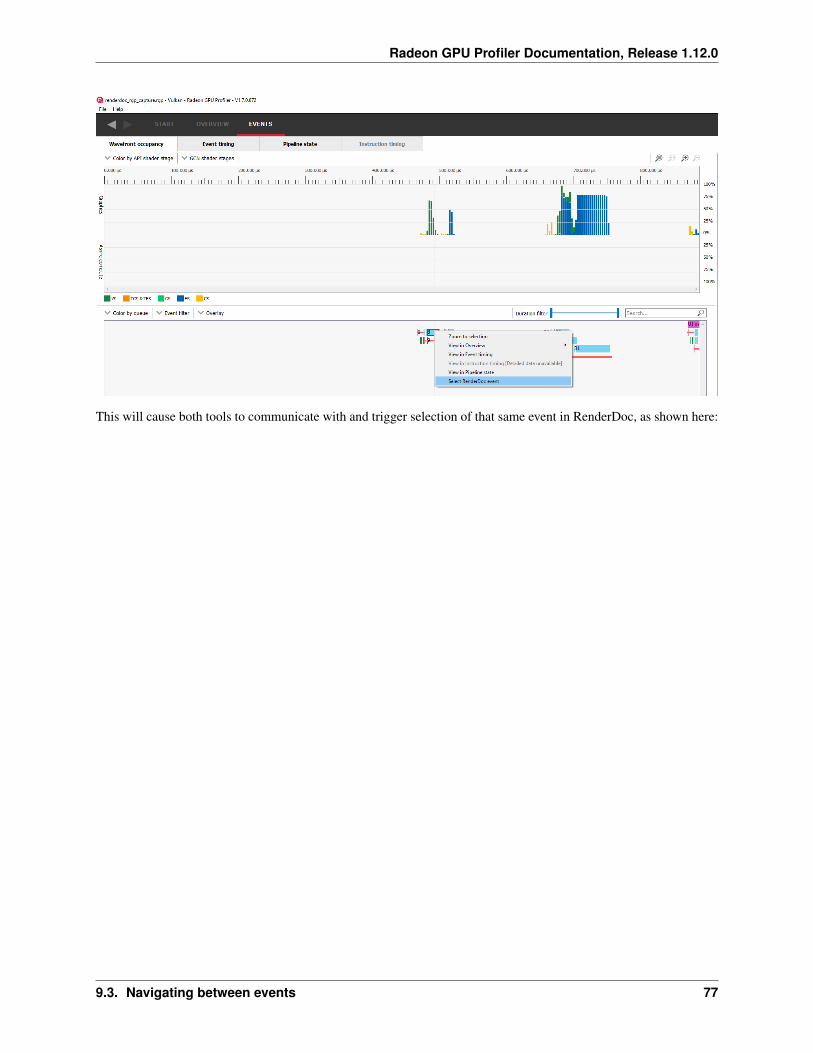
Radeon GPU Profiler Documentation, Release 1.12.0
This will cause both tools to communicate with and trigger selection of that same event in RenderDoc, as shown here:
9.3. Navigating between events 77
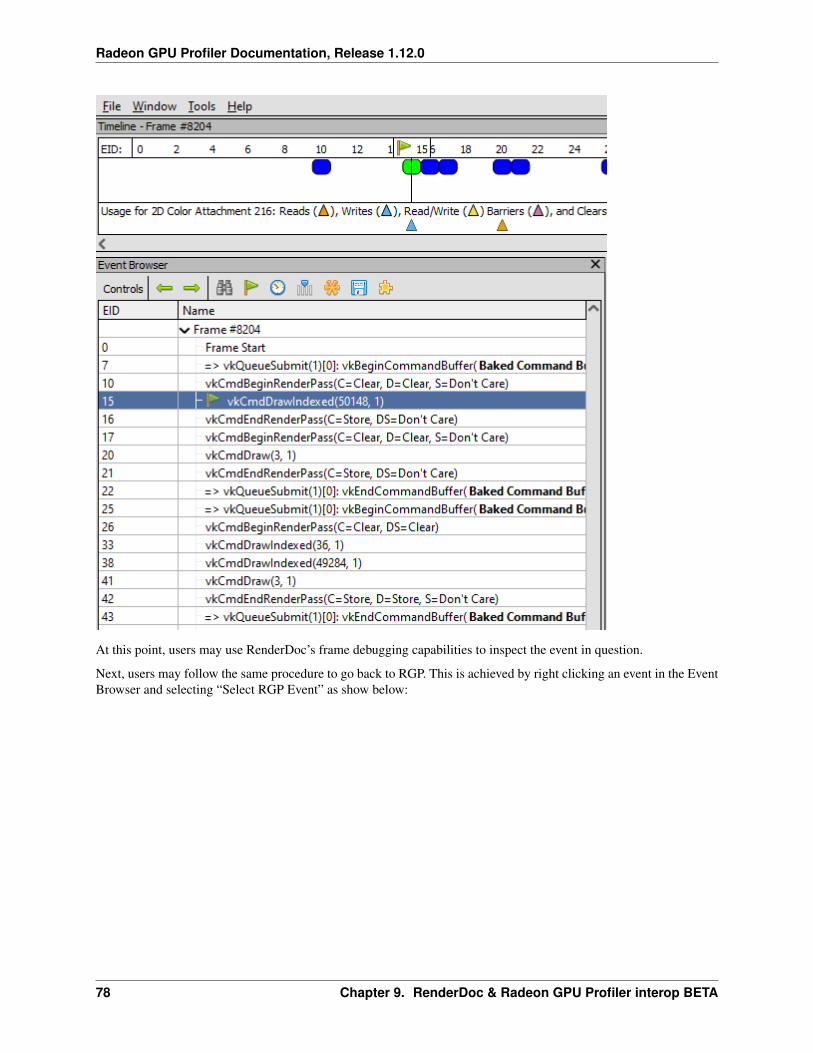
Radeon GPU Profiler Documentation, Release 1.12.0
At this point, users may use RenderDoc’s frame debugging capabilities to inspect the event in question.
Next, users may follow the same procedure to go back to RGP. This is achieved by right clicking an event in the EventBrowser and selecting “Select RGP Event” as show below:
78 Chapter 9. RenderDoc & Radeon GPU Profiler interop BETA
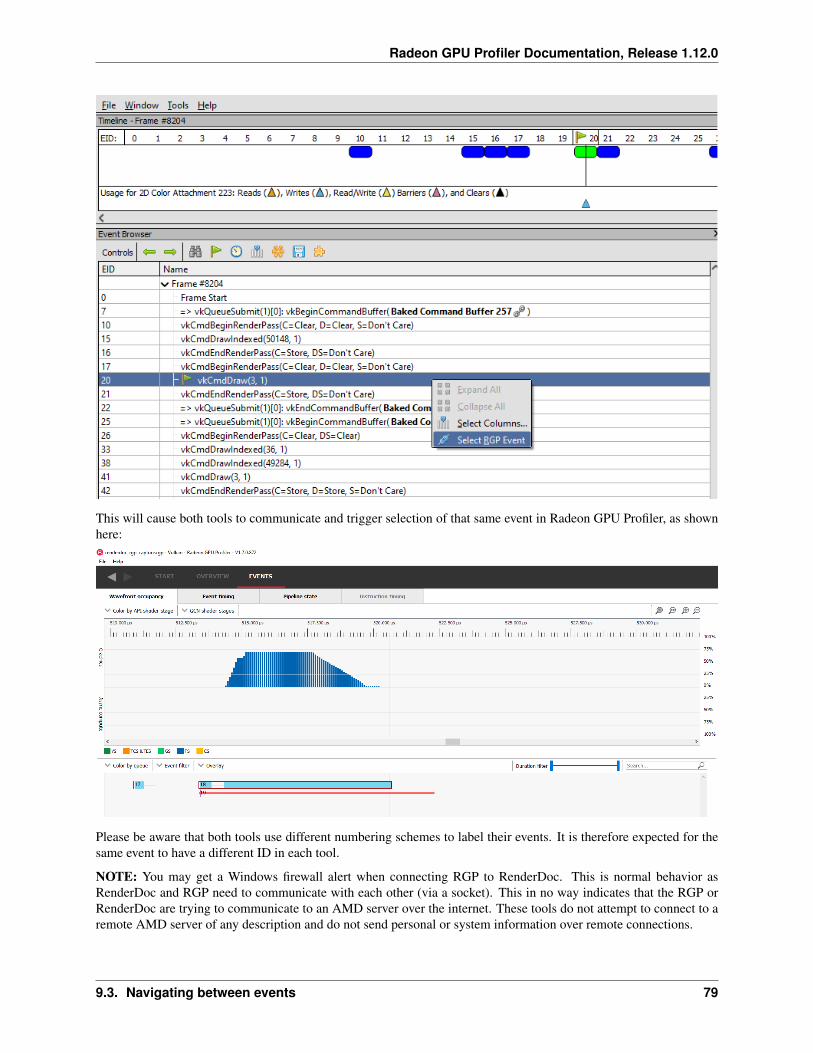
Radeon GPU Profiler Documentation, Release 1.12.0
This will cause both tools to communicate and trigger selection of that same event in Radeon GPU Profiler, as shownhere:
Please be aware that both tools use different numbering schemes to label their events. It is therefore expected for thesame event to have a different ID in each tool.
NOTE: You may get a Windows firewall alert when connecting RGP to RenderDoc. This is normal behavior asRenderDoc and RGP need to communicate with each other (via a socket). This in no way indicates that the RGP orRenderDoc are trying to communicate to an AMD server over the internet. These tools do not attempt to connect to aremote AMD server of any description and do not send personal or system information over remote connections.
9.3. Navigating between events 79
Radeon GPU Profiler Documentation, Release 1.12.0
9.4 Known limitations
• Users may correlate GPU work (draws/dispatches) across both tools. Note that this excludes entry points suchas copies, barriers, clears, and indirect draw/dispatch.
• Since the RenderDoc replayer serializes entry points, generated profiles could appear CPU bound. This canbe seen as gaps in the wavefront occupancy view, which may not be present when obtaining the profile usingRadeon Developer Panel.
• Creating consecutive RGP profiles from the same RenderDoc instance sometimes fails. This occurs if usersobtain multiple RenderDoc captures of the same application prior to triggering a second profile. To work aroundthis, start a fresh instance of RenderDoc with the desired capture to profile.
• In some cases profiles originating from RenderDoc contain no GPU events. To work around this, repeat theprofiling process again via “Tools –> Create new RGP Profile”
• The System Activity view for a RenderDoc profile will likely mismatch that of a native profile. This is due todifferent command buffer submission patterns between the replayer and native application.
• Vulkan-specific: During image creation, RenderDoc sometimes forces additional usage/flags that may have notbeen present as per the native application. This effectively disables hardware tiling optimizations which are bydefault enabled during native app runtime.
• Vulkan-specific: The RenderDoc replayer does not support playback of compute work on the async computequeue. This means that the profile will show all compute work running on the graphics queue.
• Vulkan-specific: In some cases native profiles will contain color/depth clears which may not be present in theRenderDoc profile.
• DX12-specific: The RenderDoc replayer will sometimes inject CopyBufferRegion calls as part of an optimiza-tion to Map/Unmap. These will be visible as tall spikes of compute work in the wavefront occupancy view.
• If an RGP profile opened by RenderDoc is left running and RenderDoc is restarted, the interop connectionbetween the two can’t be re-established. In this case, the “Create new RGP Profile” menu option will remaindisabled after opening a new RenderDoc capture. This is caused by a named pipe having been left open. Toresolve the issue, close RGP, and then restart RenderDoc. On Linux®, a similar situation can occur if theRenderDoc process does not shutdown cleanly. If this occurs, it may be necessary to wait a few minutes forthe connection to be removed before restarting RenderDoc. The following command can be executed from aterminal window to determine if the named pipe is still opened:
– netstat -p | grep “AMD”
9.5 Disclaimer
The information contained herein is for informational purposes only, and is subject to change without notice. Whileevery precaution has been taken in the preparation of this document, it may contain technical inaccuracies, omissionsand typographical errors, and AMD is under no obligation to update or otherwise correct this information. AdvancedMicro Devices, Inc. makes no representations or warranties with respect to the accuracy or completeness of thecontents of this document, and assumes no liability of any kind, including the implied warranties of noninfringement,merchantability or fitness for particular purposes, with respect to the operation or use of AMD hardware, softwareor other products described herein. No license, including implied or arising by estoppel, to any intellectual propertyrights is granted by this document. Terms and limitations applicable to the purchase or use of AMD’s products are asset forth in a signed agreement between the parties or in AMD’s Standard Terms and Conditions of Sale.
AMD, the AMD Arrow logo, Radeon, Ryzen, CrossFire, RDNA and combinations thereof are trademarks of AdvancedMicro Devices, Inc. Other product names used in this publication are for identification purposes only and may betrademarks of their respective companies.
80 Chapter 9. RenderDoc & Radeon GPU Profiler interop BETA
Radeon GPU Profiler Documentation, Release 1.12.0
DirectX is a registered trademark of Microsoft Corporation in the US and other jurisdictions.
Vulkan and the Vulkan logo are registered trademarks of the Khronos Group Inc.
OpenCL is a trademark of Apple Inc. used by permission by Khronos Group, Inc.
Microsoft is a registered trademark of Microsoft Corporation in the US and other jurisdictions.
Windows is a registered trademark of Microsoft Corporation in the US and other jurisdictions.
© 2016-2022 Advanced Micro Devices, Inc. All rights reserved.
9.5. Disclaimer 81