RADC-TR-80-109, Vol II (of two)
71
RADC-TR-80-109, Vol II (of two) Final Technical Report April 1980 SOFTWARE QUALITY MEASUREMENT MANUAL General Electric Company James A. McCall Mike T. Matsumoto LAPPROVED FOR PUBLIC RELEASE; DISTRIBUTION UNLIMITED DTIC ELECT JUL 22 U80 B ROME AIR DEVELOPMENT CENTER US ARMY INSTITUTE FOR RESEARCH IN cX, AIR FORCE SYSTEMS COMMAND MANAGEMENT INFORMATION AND COMPUTER SCIENCES C GRIFFISS AIR FORCE BASE NY 13441 ATLANTA GA 30332 CL3 0791f
Transcript of RADC-TR-80-109, Vol II (of two)
RADC-TR-80-109, Vol II (of two)Final Technical ReportApril 1980
SOFTWARE QUALITY MEASUREMENTMANUALGeneral Electric Company
James A. McCallMike T. Matsumoto
LAPPROVED FOR PUBLIC RELEASE; DISTRIBUTION UNLIMITED
DTICELECTJUL 2 2 U80
B
ROME AIR DEVELOPMENT CENTER US ARMY INSTITUTE FOR RESEARCH INcX, AIR FORCE SYSTEMS COMMAND MANAGEMENT INFORMATION AND COMPUTER SCIENCESC GRIFFISS AIR FORCE BASE NY 13441 ATLANTA GA 30332
CL3
0791f
lhiz rc=p c has been rt .iewcd by the RADC Public Affairs Office (PA)
I rcleasabie to the National Technical information Service (NTIS). At NTIr% il be relea.sable to the general public, including foreign nations.
!ZADC-TA'-80-109, Volume I! (of two) has been reviewed and is approved
.ur publication.
A P £P)OVED: ~ ~
JOSEPH P. CAVANOProject Engineer
APPROVED: -; 4 601mv-0
WENDALL C. BAUMAN, Colonel, USAF
Chief, Information Sciences Division
FOR TIHE Co&1ANDR:
JOHN P.1USActing Chief, Plens Office
If your address has changed or if you wish to be removed from the RADC-ailing list, or if the addressee is no longer employed by your orgauizltun't
please notify RADC (ISIS), Griffiss AFB NY 13441. 1is will assist US inmaintaining a current mailing list.
Do not return this copy. Retain or destroy.
MISSION
Rome Air Deveiqnnent Cente'rPRAVC ptan,6 and execwtea tucatch, devetomeutt, te4~t and.6eter-ed cquiL6Ztcn ptog~am in AUPPOA~t oj Co~mand, ContAutComuninkaoion and Integnc~e (031) acet.ZvitieA. TechnicAtLa:'%.d enqineeAing 6Luppo't within a,,az o6 .tech-uta competenc~ei4 ovide, .to ESV Atogumx OJS.ce,6 (PO.6) and othev ESVetement,. 7he p~incipa2 tehnZco ,ZoZn axeaA w~e.ommnaL~Ctione,, etachmagnetic guidan~ce and cont~oZ, 6uW%-veit&tance o6 gtro and and aeAo6pace objec-t6 iLnteW.gefle datacottection and handting, in~o~mo.tion 6y,64',m .technotogq,4 Zno.6phA-ic~ r.upagatian, sotid ate .6cences, mi.c~comzueph~i4and etect'onia 4eZiabiCty, ma.ntnabkitq and
cmpoatbLtyt.
UNCLASSIFIEDSECUNI SSUkFICATIOM OF THIS PAGE (Whe. e n ise
READ U45TRUCIOIIS)9REPORT DOCtJMENTA7TION PAGE BEFORE COMPLTiG FORM
- 2. GOVT ACCESSION NO'.RECIPINT'S CATALOG NUM1111R
_aULIY EAURMEN MNUSu..0: OECASIPIAONWNrAD
James .M~l
I.GQSUPPLEMJNTRYC OTES DRSS1.PRGA EEET.PRj
450CS Proinie E nn:vanel E. Hockin (AF8iRMIC)448431
Qualityp MetriSofte M easurement Cne II)----
~~ predOfict Is.fwr uaiyhvdetecting merca wihidniydeiince4ndouetainos4 IORce MG coe prdict i feen mCotricsw ich meue the T logic (of ths design
DO ,~ 173 EITIN O I NV65IS OSOLTE NCLASSIFIEDSSCRmT CLSSPIATO O&P NIS PAGE 455WiX6imi e
-- /74 Ow L :C

UNCLASSIFIED
86CUPAY CLASOUICATBON OF T141S PA664Uha Due =eml
A Software Quality Measurement Manuel vas produced which containedProcedures and guidelines for assisting software system developers insetting quality goals, applying metrics and making quality assessments.
UNCLASSIFIEDSaCuRgTY CL AMSPICAtinON OP P~ AGgUMha DOWamE
-4,
TABLE OF CONTENTS
LIST OF ILLUSTRATIONS . . ........... .
LIST OF TABLES . . . . . . . . . *...... . .
Section
1.0 INTRODUCTION . . . . . . . . . . . . . . . . . . . . . . . .. . 11.1 Purpose....... . . . . ....... . . . . . . . 11.2 Scope ... ........................... 21.3 Quality Measurement in Perspective ......... . . . . 2
1.4 Manual Organization ... .................... 61.5 Recommended Use of Manual . . .......... . . . . . 6
2.0 PROCEDURES FOR INDENTIFYING SOFTWARE QUALITY REQUIREENTS . . . 92.1 Idtroduction .......... . . . . .......... 9
2.2 Procedures For Identifying Important Quality Factors . . . 112.2.1 Procedures ...... ..................... 112.2.2 An Example of Factors Specification ........ 18
2.3 Procedures for Identifying Critical Software Attributes . . 20
2.3.1 Procedures . . . ............... 20
2.3.2 Example of Identifying Software Criteria . . . . . . 242.4 Procedures for Establishing Quantifiable Goals . . .... 25
2.4.1 Procedures . . . . . . .......... .. . 252.4.2 Example of Metrics . ........... . . . 31
2.5 Evaluation of Development Plan .............. 33
3.0 PROCEDURES FOR APPLYING MEASUREMENTS .............. 34
3.1 When to Apply Measurements ....... . . . ... . 34
3.2 Sources of Quality Information ..... . . . . . . . 353.3 Application of the Measurements ..... . . . . . . . 36
3.4 Techniques for Applying Measurements ...... . . . . .51
J 4.0 PROCEDURES FOR ASSESSING THE QUALITY OF THE SOFTWARE PRODUCT . . 52
4.1 Introduction . ........ . . . . . . . . . . . . . . 52
4.2 Inspector's Assessment . . . . . . . . . . . . . . . . .. 52
TABLE OF CONTENTS (Continued)
Section Pg4.3 Sensitivity Analysis ........ ... .... .52
4.4 Use of Noimlization Function to Assess Quality 6 44.5 Reporting Assessment Results . . . . . . . . . . . . . . . 61
EFERENCES . . . . . . . . . . . . . . . . . . . . . . . . . . . . . . . 63
ACCESION for
K~S While SectiMDOC Buff SeCtUe (3C3UNANNOUNCED0JUSII ICATION-
By
Difs-t.- AVAIL awi a
'4 1
I o p o." OWI.
LIST OF ILLUSTRATIONS
FigureNumber Page2.1-1 Framework. .. ... ..... .... .... ..... ... 102.2-1 Cost vs Benefit Tradeoff .. .. ... .... .... ..... 143.1-1 Timing of Metrics Application .. .. ..... .... .... 343.2-1 Typical Minium Set of Document & Source Code .. .. ..... 353.3-1 Application of the Metric Worksheets. .. .. .... ..... 374.4-1 Normalization Function for Flexibility During Design .. .. .. 594.4-2 Determination of Level of Confidence .. .. ... ... .... 60
LIST OF TABLES
TableNumb~er Page1.3-1 How Software Metrics Complement Quality Assurance......51 .5-1 Index of Three Approaches to Specifying and Assessing
Software Quality. .. .. .... ..... .... .... ...2.21 Software Quality Requirements Survey Form. .. ... ..... 122.2-2 System Characteristics and Related Quality Factors .. .. ... 132.2-3 The Impact of Not Specifying or Measuring Software
aQuality Factors. .. .... .... .... ..... .... 152.2-4 Realtlonships Between Software Quality Factors. .. .. .... 162.2-5 Typical Factor Tradeoffs .. .. ... ..... .... .... 172.3-1 Software Criteria and Related Quality Factors .. ... .... 232.3-2 Criteria Definitions for Software Quality. .. .... .... 242.4-1 Quality Factor Ratings. .. .. .... ..... .... ... 272.4-2 Quality Metrics Related to Factors .. .. ... ..... ... 29j4.4-1 Normalization Functions. .. .... .... .... ..... 57

SECTION 1
INTRODUCTION
1.1 PURPOSE
There has been an increased awareness in recent years of the critical
problems that have been encountered in the development of large scale.
software systems. These problems not only include the cost and schedule
overruns typical of development efforts, and the poor performance of the
systems once they are delivered, but also include the high cost of main-
taining the systems, the lack of portability, and the high sensitivity to
changes in requirements.
The government and 0OD in particular, as customers of many large scale
software system developments, have sponsored many research efforts aimed
at attacking these problems. For example, the efforts related to the
development of a standard DOD programming language, software development
techniques, and development tools and aids all provide partial silution to
the above problems by encouraging a more disciplined approach to the devel-
opment of software and therefore a mre controlled development process.
A related research thrust which has been recently funded by DOD is the
area of software metrics. The research in this area has resulted in the
development and evaluation of a number of metrics which measure various
.attributes of software and relate to different aspects of software quality.
The potential of the software metric concepts can be realized by their
inclusion in software quality assurance programs. Their impact on a
quality assurance program is to provide a more disciplined, engineering
approach to quality assurance and to provide a mechanism for taking a
life cycle viewpoint of software quality; The benefits derived from their
application are realized in life cycle cost reduction.
The purpose of this manual is to present a complete set of Procedures andguidelines for introducing and utilizing current software quality measure-
ment techniques in a quality assurance program associated with large scale
Iw 1fku

software system developments, These procedures and guidelines will identify:
1. How to identify and specify software quality requirements (Setting
Quality Goals).
2. How and when to apply software metrics (Applying Metrics), and
3. How to interpret the information obtained from the application of
the metrics (Making a Quality Assessment).
1.2 SCOPE
This manual is based on the results of research conducted in support of
the United States Air Force Electronic Systems Division (ESD), Rome Air
Development Center (RADC), and the United States Army Computer Systems
Command's Army Institute for Research in Management Information and Computer
Science (USACSC/AIRMICS). While aspects of the technology of software
metrics require further research, those portions which can currently
provide benefit to a software quality assurance program are emphasized
in this manual. Guidelines and procedures for using the software
metrics are described. The guidelines and procedures are presented insuch a way as to facilitate their application using this manual in a
software development. All of the procedures are described as manual
processes. however, where automated software tool s could be used tocompliment or enhance the process, the tools are identified.
1.3 QUALITY MEASUREMENT IN PERSPECTIVE
The evolution during the past decade of modern programming practices,
structured, disciplined development techniques and methodologies, and
requirements for more structured, effective documentation, has increased
the feasibility of effective measurement of software quality.
*However, before the potential of measurement techniques could be realized
a framework or model of software quality had to be constructed. An
2
AdRm

established model, which at one level provides a user or management
oriented view of quality, is described in Section 2 of this manual in
the perspective of how it can be used to establish software quality
requirements for a specific application.
The actual measurement of software quality is accomplished by applying
software metrics (or measurements) to the documentation and source code
produced during a software development. These measurementslare part of
the established model of software quality and through that model canbe related to various user-oriented aspects of software quality.
The metrics can be classified according to three categories:
* anomaly-detecting
* predictive
9 acceptance
Anomaly-detecting metrics identify deficiencies in documentation or sourcecode. These deficiencies usually are corrected to improve the quality of
the software product. Standards enforcement is a form of anomaly-detecting
metrics.
Predictive metrics are measurements of the logic of the design and imple-
mentation. These measurements are concerned with form, strucure, density,
complexity type attributes. They provide an indication of the quality that
will be achieved in the end product, based on the nature of the application,
and design and implementation strategies.
Acceptance metrics are measurements that are applied to the end product
to assess the final compliance with requirements. Tests are a form of
J. acceptance-type measurements.
The measurements described and used in this manual are either anomaly-detect-
ing or predictive metrics. They are applied during the development phases
3
to assist in identification of quality problems early so that corrective
actions can be taken early when they are more effective and economical.
The measurement concepts complement current Quality Assurance and testing
practices. They are not a replacement for any current techniques utilized
in normal quality assurance programs. For example, a major objective of
quality assurance is to assure conformance with user/customer requirements.
The software quality metric concepts described in this manual provide a
methodology for the user/customer to specify life-cycle-oriented quality
requirements, usually not considered, and a mechanism for measuring if those
requirements have been attained. A function usually performed by quality
assurance personnel is a review/audit of software products produced during
a software development. The software metrics add formalitv and quantifica-
tion to these document and code reviews. The metric concepts also provide
a vehicle for early involvement in the development since there are metrics
which apply to the documents produced early in the development.
Testing is usually oriented toward correctness, reliability, and perfor-
mance (efficiency). The metrics assist in the evaluation of other qualities
like maintainability, portability, and flexibility.
A summarization of how the software metric concepts complement Quality
Assurance activities is provided in Table 1.3-1 based on the quality
assurance program requirements identified in MIL-S-52779.
4
.:i.

Table 1.3-1 How Software Metrics Complement Quality Assurance
QUALITY ASSURANCE IMPACT OF SOFTWARE QUALITYPROGRAM REQUIREMENTS METRIC CONCEPTS
* Assure Conformance with Adds software quality
Requirements requirements
* Identify Software Anomaly-detecting
Deficiencies metrics
* Provide Configuration No impact
Management
* Conduct Test Assists in evaluation of
other qualities
* Provide Library Controls No impact
e Review Computer Program Predictive metrics
Design
o Assure Software Documentation Metrics assist in evaluation of
Requirement Conformance documentation as well as code
e Conduct Reviews and Audits Procedures for applying metrics
(in form of worksheets) formalizes
inspection process
Provide Tools/Techniques/ This manual describes methodology
Methodology for Quality of using metrics
Assurance
* Provide Subcontractor Control No impact
All of these concepts will be further explained and illustrated in the sub-
sequent sections of this manual.
i5
1"A$
• " " *.

1.4 MANUAL ORGANIZATION
The manual has been organized as a handbook for use in a quality assurance
program. The first section provides introductory information and how the
manual is to be used.
The second section defines the software quality model and describes a
methodology for using this model to establish software quality requirements
or goals for a software development,
The third section describes procedures for measuring the quality of the
software. These procedures cover what to measure, when to measure, and
how to measure.
The fourth section describes procedures for utilizing the information
provided by the measurements to make assessments of the quality of the
software and recommends what information to present to various personnel
involved in the development.
1.5 RECOMMENDED USE OF MANUAL
The software quality metric concepts can be applied at several levels.
In an acquisition manager/contractor environment, there are three approaches
for using the metric concepts. They are:
1. The acquisition manager's staff can apply metrics to the delivered
software procucts.
2. The development manager's staff can apply metrics to software
products and report them to the acquisition manager during
reviews.
3. An independent Quality Assurance contractor can apply metrics to
delivered software products and report them to the acquisition
manager.
6
OF.

Within the software development project organization, there are two
approaches for using the metric concepts. They are:
1. The quality assurance personnel will apply the metrics as an
independent assessment of the quality of the software being produced.
2. The development personnel can apply the metrics during walkthroughs
and reviews.
This manual is oriented toward those personnel who will be applying the
concepts (either quality assurance or development personnel) and recomnends
three approaches to both establishing the quality requirements (Section 2)
and making a quality assessment (Section 4). The three approaches (an
index is provided in Table 1.5-1) in each area are presented in order of
increasing formality of the relationship between quality requirements
and the metrics, that is in order of increasing quantification. The order
of presentation also relates to an increasing requirement for experience
with the concepts by the personnel applying the concepts. Thus, the
approaches can be used as a phased implementation plan for the metric
concepts. It is recommended that the concepts be incrementally phased Into
the quality assurance organization's operation.
This manual should be utilized by the personnel applying the metric con-
cepts. Additional information and definitions can be found in:
"Factors in Software Quality", 3 vols, RADC-TR-77-369, Nov 1977.icCA77]
"Software Quality Metrics Enhancements-Final Report", Vol I of this document
These references should be redu oy the personnel applying the metrics to
familiarize them with the underlying concepts. They should also be referred
"* 1 to periodically for definitions and explanation purposes.
Vi
- 4,, 'r"
-
| , . . , . . ., .,.,.

I m gig I
Table 1.5-1 Index of Three Approaches to Specifying and AssessingSoftware Quality
APPROACH SPECIFYING APPLYING ASSESSING THE QUALITY OF(LEVEL OF SOFTWARE QUALITY. MEASUREMENTS THE PRODUCTFORMALITY)
1 Procedures for Procedures for theidentifying important Inspector's assessmentSuslity factors PROCEDURES (Paragraph 4.2)Paragraph 2.2)
FOR
2 Procedures for APPLYING Procedures for performingidentifying critical TESensitivity analysissoftware attributes (Paragraph 4.3)(Paragraph 2.3) METRIC____ __________
WORKSHEETS3 Procedures for Procedures for use of
identifying quantifiable (SECTION 3) normalization functiongoals (Paragraph 4.4)(Paragraph 2.4)
8
A"
SECTION 2
PROCEDURES FORINDENTIFYING SOF'TARE QUALITY REQUIREMENTS
2.1 INTRODUCTIONThe primary purpose of applying Software Quality Metrics in a QualityAssurance Program is to improve the quality of the software product.Rather than simply measuring, the concepts are based on achieving apositive influence on the product, to improve its development.
This section addresses the problem of identifying software quality require-ments or goals. These requirements are in addition to the functional,performance, cost, and schedule requirements normally specified for asoftware development. The fact that the goals established are related tothe quality of the end product should, in itself, provide some positiveinfluence. Past research has shown that goal-directed system development
is effective. [WEIN72]
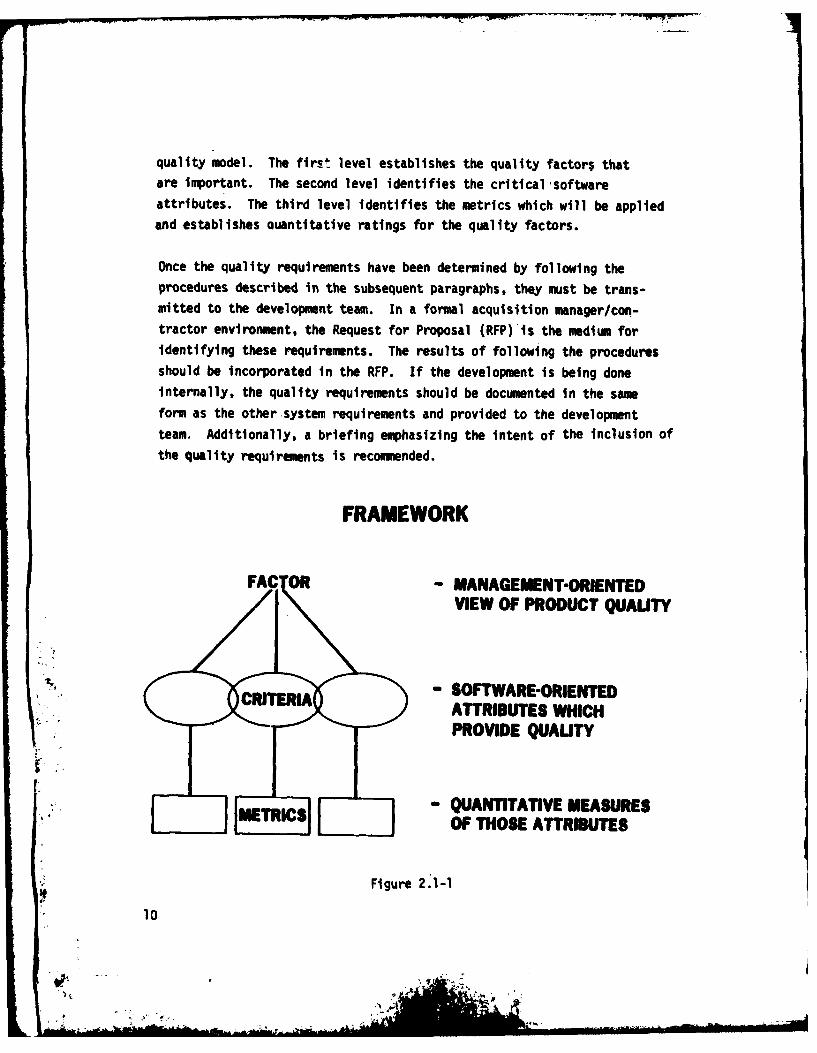
The vehicle for establishing the requirements is the hierarchical model of
software quality defined in [CAVA78]. This model, shown in Figure 2.1-1,
has at its highest level a set of software quality factors which are
user/mnagement-oriented terms and represent the characteristics which, , comprise software quality. At the next level for each quality factor. is
ja set of criteria which are the attributes if present, that provide thecharacteristics represented by the quality factors. The criteria, then,are software-related terms. At the lowest level of the model are themetrics which are quantitative measures of the software attributes defined
by the criteria.
The procedures for establishing the quality requirements for a particularsoftware system utilize this model and will be described as a three levelapproach, the levels corresponding to the hierachical levels of the software
9
. i
quality model. The first level establishes the quality factors thatare important. The second level identifies the critical softwareattributes. The third level identifies the metrics which will be appliedand establishes ouantitative ratings for the quality factors.
Once the quality requirements have been determined by following theprocedures described in the subsequent paragraphs, they must be trans-mitted to the development team. In a formal acquisition manager/con-tractor environment, the Request for Proposal (RFP) is the medium foridentifying these requirements. The results of following the proceduresshould be incorporated in the RFP. If the development is being doneinternally, the quality requirements should be documented in the sameform as the other system requirements and provided to the development
team. Additionally, a briefing emphasizing the intent of the inclusion of
the quality requirements is recommended.
FRAMEWORK
FAC - MANAGEMENT-ORIENTEDVIEW OF PRODUCT QUAUTY
CIE- SOFTWARE-ORIENTEDATTRIBUTES WHICHPROVIDE QUAUTY
- UANTITATIVE MEASURESOF THOSE ATTRIBUTES
Figure 2.1-1
10
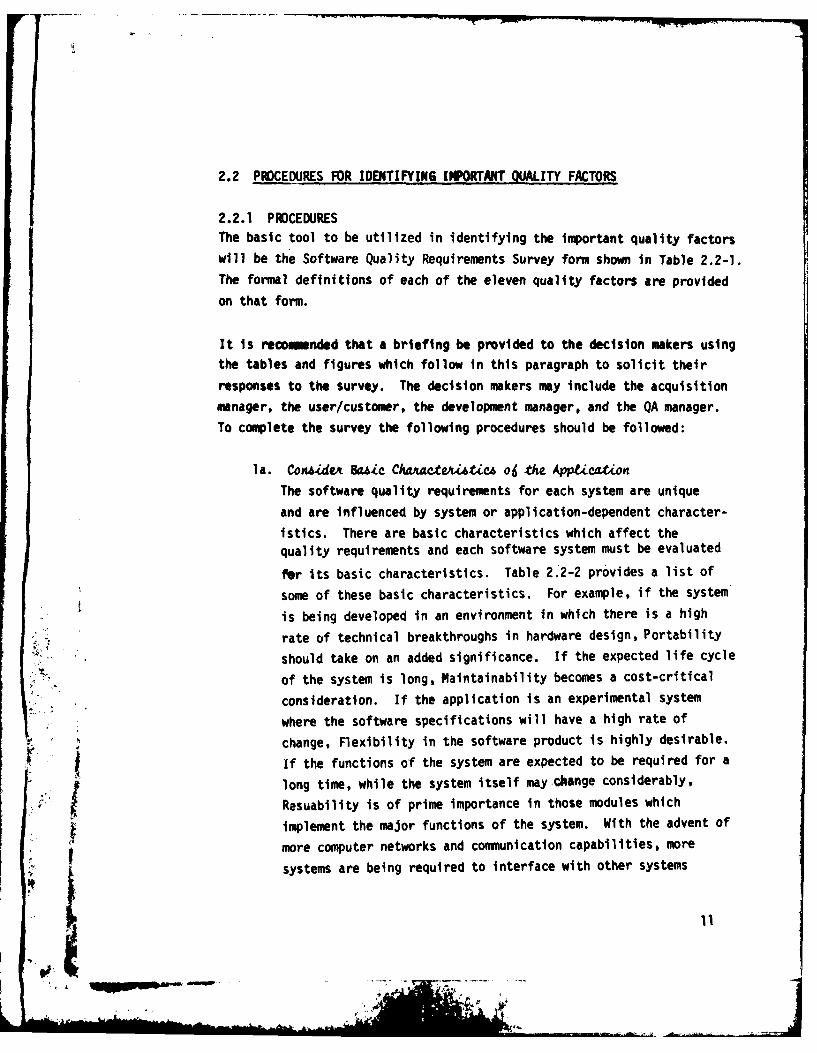
2.2 PROCEDURES FOR IDENTIFYING IMPORTANT QUALITY FACTORS
2.2.1 PROCEDURESThe basic tool to be utilized in identifying the important quality factors
will be the Software Quality Requirements Survey form shown in Table 2.2-1.
The formal definitions of each of the eleven quality factors are provided
on that form.
It is recommended that a briefing be provided to the decision makers using
the tables and figures which follow in this paragraph to solicit their
responses to the survey. The decision makers may include the acquisition
manager, the user/customer, the development manager, and the QA manager.
To complete the survey the following procedures should be followed:
]a. ConlideA &6ic Chaweo tcA o6 the Apptication
The software quality requirements for each system are unique
and are influenced by system or application-dependent character-
istics. There are basic characteristics which affect the
quality requirements and each software system must be evaluated
ftr its basic characteristics. Table 2.2-2 provides a list of
some of these basic characteristics. For example, if the system
is being developed in an environment in which there is a high
rate of technical breakthroughs in hardware design, Portability
should take on an added significance. If the expected life cycle
of the system is long, Maintainability becomes a cost-critical
consideration. If the application is an experimental system
where the software specifications will have a high rate of
change, Flexibility in the software product is highly desirable.
If the functions of the system are expected to be required for a
flong time, while the system itself may change considerably,
Resuability is of prime importance in those modules which
implement the major functions of the system. With the advent of
more computer networks and communication capabilities, more
systems are being required to interface with other systems
11
• , ,C,

Table 2.2-1 Software Quality Requirements Survey Formi
1. The 11 quality factors listed below have been isolated from the cur-rent 'literature. They are not meant to be exhaustive, but to reflectwhat is currently thought to be important. Please indicate whetheryou consider each factor to be Very Important (VI), Important (I),Somewhat Important (SI), or Not Important (NI) as design goals in thesystem you are currently working on.
KV=1 FACID5 DEFINITIOSI
________CORRECTNESS Extant to whichi a program satisfies itsspecifications and fulfills the user'smission Objectives.
_____ RELIABILITY Extent to which a po ogm can be expectedto perforin its intended function withrequired precision.
_____EFFICIENCY The asount of comuting resources and cederequired by a pro"ro to perform a function.
________INTEGRITY Extent to wich access to software or databy unauthorized persons can be controlled.
_____USASILITY Effort required to learn, operate, prepareinput, and interpret output of a pregiom.
______ INTAINAIILITY Effort required to locate and fix an errorin in Operational pregre.
- TESTABILITY Effort required to test a pregro to insureit perfove its intended function.
_______ PLIUILITY Effort required to modify an operationalprgren.
PORTABILITY Effort required to trensfer a progrom freeon hardware configuration and/r softaresystem eniroet to amether.
_______REUSABIITY Extant to which a progra can be wed in otherapplications - related to the packaging andscope of the functions that piogram erf.
______IN7!ROPERAILMT Effort required to chpia on syse withanother.
2. What type(s) of application are you currently involved in?
3. Are you currently in:
__________1. Development phase___________2. Operations/Maintenance phase
4. Please indicate the title which most closely describes your position:__________1. Program Manager___________2. Technical Consultant___________3. Systems Analyst___________4. Other (please specify)_ ______
12
IL
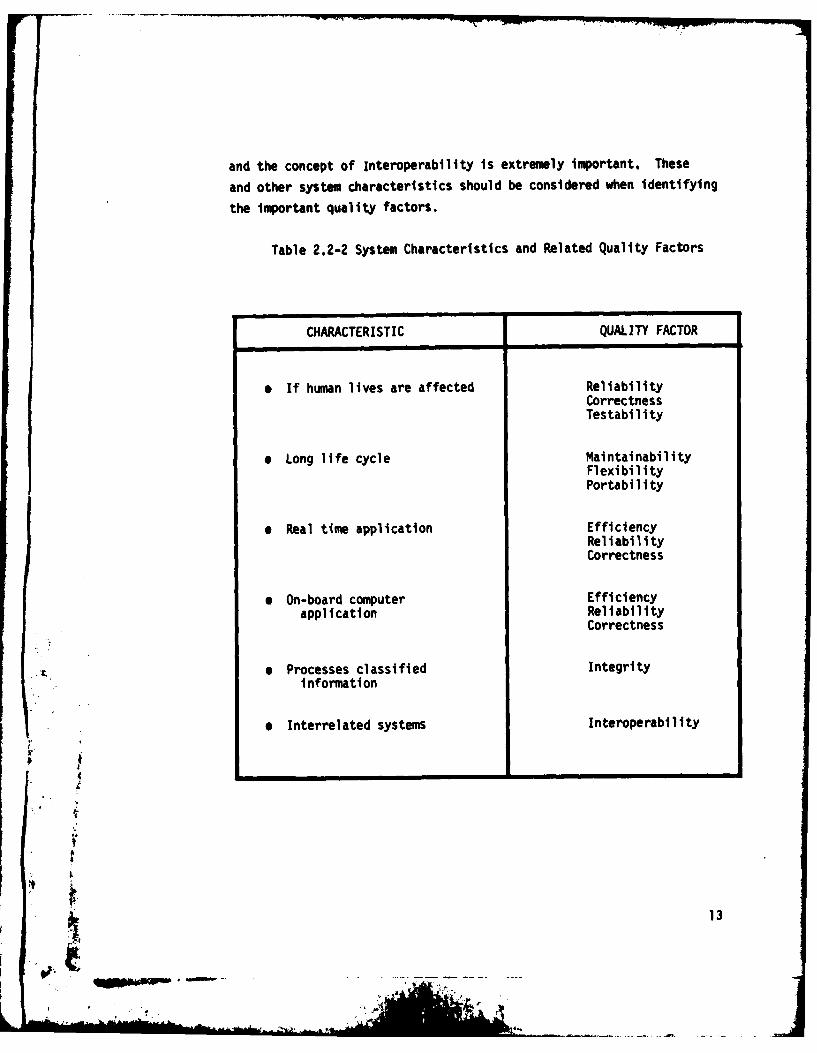
and the concept of Interoperability is extremely important. These
and other system characteristics should be considered when identifying
the important quality factors.
Table 2.2-2 System Characteristics and Related Quality Factors
CHARACTERISTIC QUALITY FACTOR
• If human lives are affected ReliabilityCorrectnessTestability
e Long life cycle MaintainabilityFlexibilityPortability
* Real time application EfficiencyReliabilityCorrectness
* On-board computer Efficiencyapplication Reliability
Correctness
e Processes classified Integrityinformation
e Interrelated systems Interoperability
1 E
.* C. ...
,;
I.v
;""
J , a";
13

lb. CoraideA L.Le Cycte lmptieation6
The eleven quality factors identified on the survey can be
grouped according to three life cycle activities associatedwith a delivered software product. These three activities are
product operation, product revision, and product transition.
The relationship of the quality factors to these activities
is shown in Table 2.2-3. This table also illustrates where
quality indications can be achieved through measurement and
where the impact is felt if poor quality is realized. The
size of this impact determines the cost savings-that can be
exDected if a higher quality system is achieved through the
application of the metrics. This cost savings is somewhat
offset by the cost to apply the metrics and the cost to
develop the higher quality software product as illustrated
in Figure 2.2-1.
___________________LIFE
COST TO DEVELOP CYCLEHIGH QUALITY SOFTWARE SAVINGS AS
OST TO A RESULT OF
EASURE QUALITY QUAITYA
Figure 2.2-1
Cost vs Benefit Tradeoff
This cost to implement versus life cycle cost reduction relation-
ship exists for each quality factor. The benefit versus cost-to-
provide ratio for each factor is rated as high, medium, or low inbthe right hand column of Table 2.2-3. This relationship and the
life cycle implications of the quality factors should be considered
when selecting the important factors for a specific system.
14
"As

I- :I -- = E E =Z
LuLO -C -"= =b
w UI-- .9= =i j -i A
0 0
a 0
0 4-P
44.
CD 0.0% LO E
0 LUJ
0 C
m- !;C >.
0 .
in
~ - a a - a - a
.~ (A,to
9- CDo a,
tn
CD I4- -I
u z IVgo' 4.)
U (n1
aaE -J
LU >.
a, w L)0 cc
In c o c o CaJ L)UJ W
1U Liz?-
a ... '.4

I c. PeA6o~rJ Dtawdbo&~ Among the Tentativwe U.6.t o6 Quatit4 FdoAAs a result of steps la and ib, a tentative list of quality
factors should be produced. The next step is to consider the
interrelationships among the factors selected. Table 2.2-4 and
2.2-5 can be used as a quide for determing the relationshipS
between the quality factors. Some factors are synergistic while
others conflict. The impact of conflicting factors is that.the cost to implement will increase. This will lower the
benefit to cost ratio described in the preceeding paragraph.
Table 2.2-4 Relationships Between Software Quality Factors
FACTORS .
EFFICIENCY
INTEGRITY
USABILITY 0 10 0_ _ _t% -- /~PAINTAINABILITY 0 10 .* 0 ~:
TESTABILITY 000 00kFLEXIBILITY o000 oc 0/ 04 0PORTABILITY 00REUSABILITY - - - - - - - -' 6
INTEROPERABILMT
LEGENIf a high degre of quality is presenit for factor,what degree of quality Is expected for the other:
0 - Hi gh *Low
Blank e No relationship or application depedent
16

Table 2.2-5 Typical Factor Tradeoffs
INTEGRITY The additional code and processing required toVS control the access of the software or data
EFFICIENCY usually lengthens run time and require additionalstorage.
USABILITY The additional code and processing required to easeVS an operator's tasks or provide more usable output
EFFICIENCY usually lenghten run time and require additionalstorage.
MAINTAINABILITY Optimized code, incorporating intricate codingVS techniques and direct code, always proves
EFFICIENCY problems to the maintainer. Using modularity,instrumentation,and well commented high level code toincrease the maintainability of-a system usuallyincreases the overhead resulting in less efficientoperation.
TESTABILITY The above discussion applies to testing.VS
EFFICIENCY
PORTABILITY The use of direct code or optimized system softwareVS or utilities decreases the portability of the
EFFICIENCY system.
FLEXIBILITY The generality required for a flexible systemVS increases overhead and decreases the efficiency
EFFICIENCY of the system.
REUSABILITY The above discussion applies to reusability.VS
EFFICIENCY
INTEROPERABILITY Agin the added overhead for conversion fromVS standard data representations, and the use of
EFFICIENCY interface routines decreases the operatingefficiency of the system.
FLEXIBILITY Flexibility requires very general and flexibleVS data structures. This increases the data security
INTEGRITY problem.
REUSABILITY As in the above discussion, the generality requiredVS by reusable software provides severe protection
INTEGRITY problems.
INTEROPERABILITY Coupled systems allow for more avenues of access andVS different users who can access the system. The
INTEGRITY potential for accidental access of sensitive data isincreased as well as the opportunities for deliberateaccess. Often, coupled systems share data or soft-ware which compounds the security problems as well.
REUSABILITY The generality required by reusable software makesVS providing error tolerance and accuracy for all
RELIABILITY cases more difficult. 17__ _ _ _ _ _ _ _ _ _ _ _ _ __ _ _ _ _ _ _ _ _ _ _ _ _ __ _ _ _ _ _ _ _ _ _ _ _ 1
I d. Ident£jy M{o,t Impo ,tant Qua tY FactoAA
Based on la through lc, a list of quality factors considered tobe important for the particular system should be compiled. Thelist should be organized in order of importance. A single
decision maker may choose the factors or the choice may be made
by averaging several survey responses. The definitions of thefactors chosen should be included with this list.
le. Provide Explanation jor Choice
The rationale for the decisions made during steps la through Ic
should be documented.
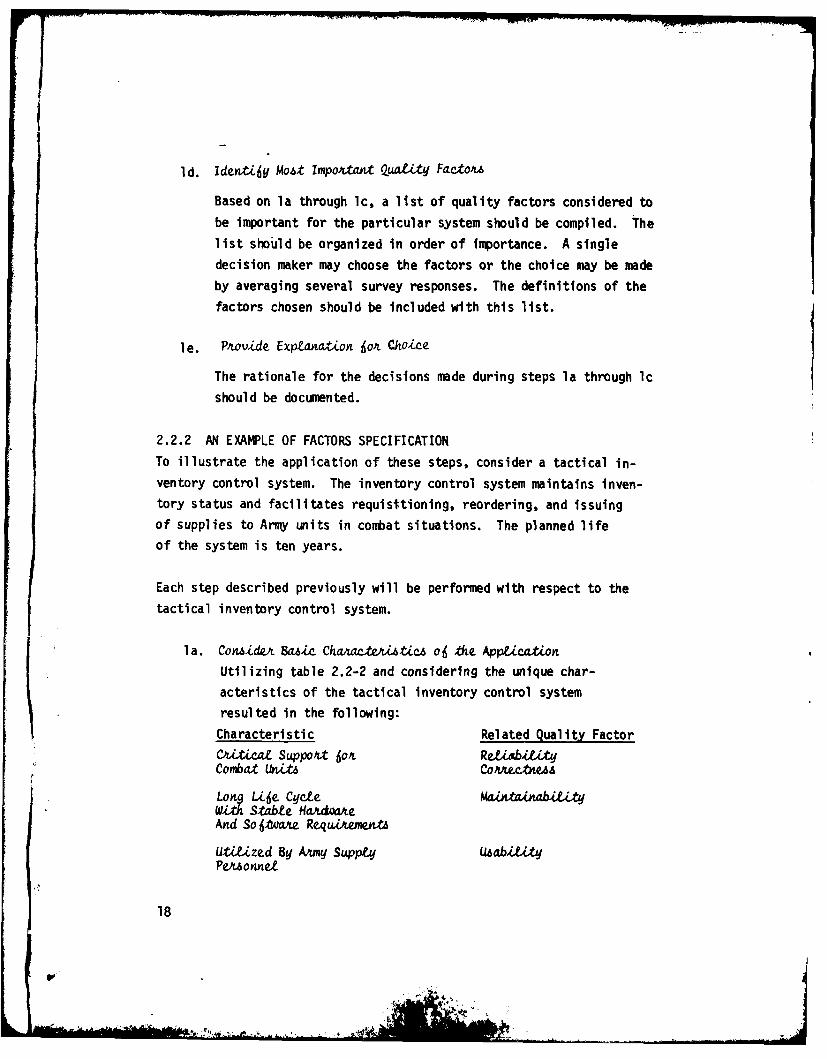
2.2.2 AN EXAMPLE OF FACTORS SPECIFICATION
To illustrate the application of these steps, consider a tactical in-ventory control system. The inventory control system maintains inven-tory status and facilitates requisitioning, reordering, and issuing
of supplies to Army units in combat situations. The planned life
of the system is ten years.
Each step described previously will be performed with respect to the
tactical inventory control system.
la. Con,6idV Bahic. Chazac&tt.6t oj the Appticat on
Utilizing table 2.2-2 and considering the unique char-acteristics of the tactical inventory control system
resulted in the following:Characteristic Related Quality Factor
C'zetat Suppot 6or R.,1AityCombat Ln.ZU CoA ctne.a
Long Li~e Cycte Maata.nabiZityWLth Stable HaArwAeAnd So6tvawe RequiAvwAU
UttLzed By AVmy Suppy UWb =bUtPeAuonnet
18
VA
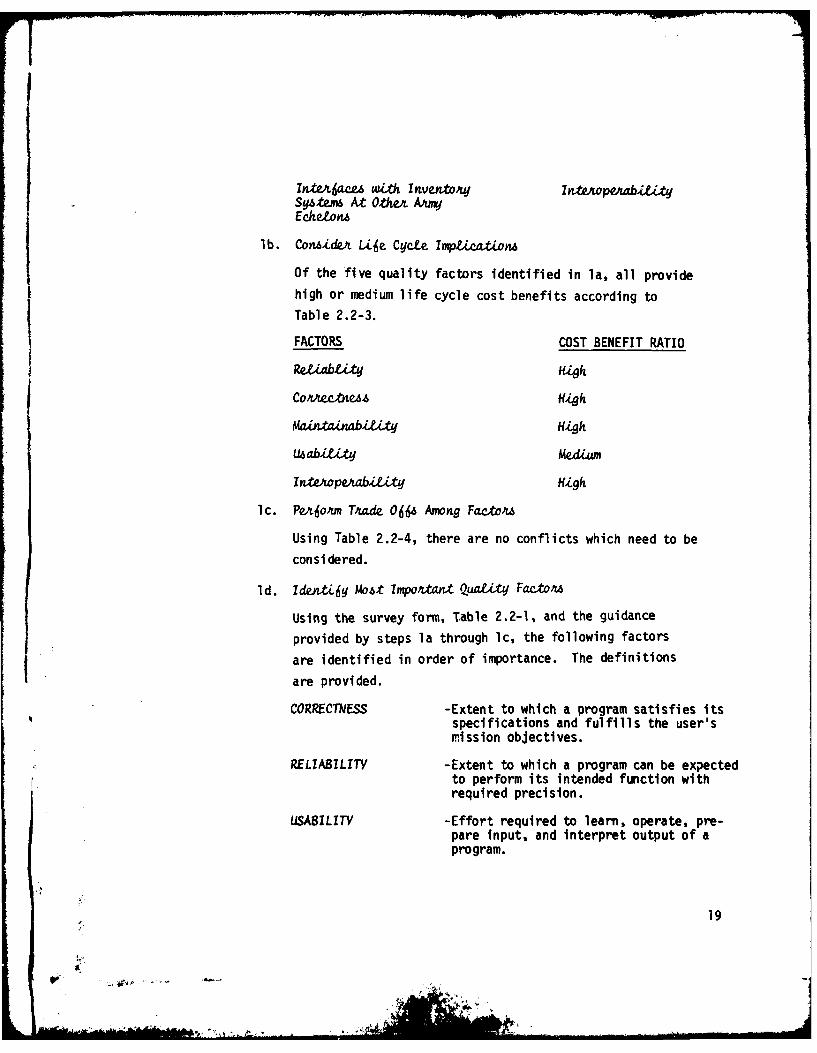
InAt4C6a. with Invento Ji IvntepeAabititySyAtzm At Othe AimEchetona
lb. Con6ideJ LZje Cycte Inrpticatona
Of the five quality factors identified in la, all provide
high or medium life cycle cost benefits according to
Table 2.2-3.
FACTORS COST BENEFIT RATIO
CoiecbteAi High
MaintaiauZb t H.gk
UWab.LLity Mediam
InvtopeAabitLity Hg
lc. Perform Tad4e 066 Among Fadto.
Using Table 2.2-4, there are no conflicts which need to be
considered.
ld. Iden-tqdy M ,6t Impoxan.t Qua t FactoL
Using the survey form, Table 2.2-1, and the guidance
provided by steps la through lc, the following factors
are identified in order of importance. The definitions
are provided.
CORRECTNESS -Extent to which a program satisfies itsspecifications and fulfills the user'sm ission objectives.
RELIABILITY -Extent to which a program can be expectedto perform its intended function withrequired precision.
USABILITV -Effort required to learn, operate, pre-pare input, and interpret output of aprogram.
19
",' V.. ,
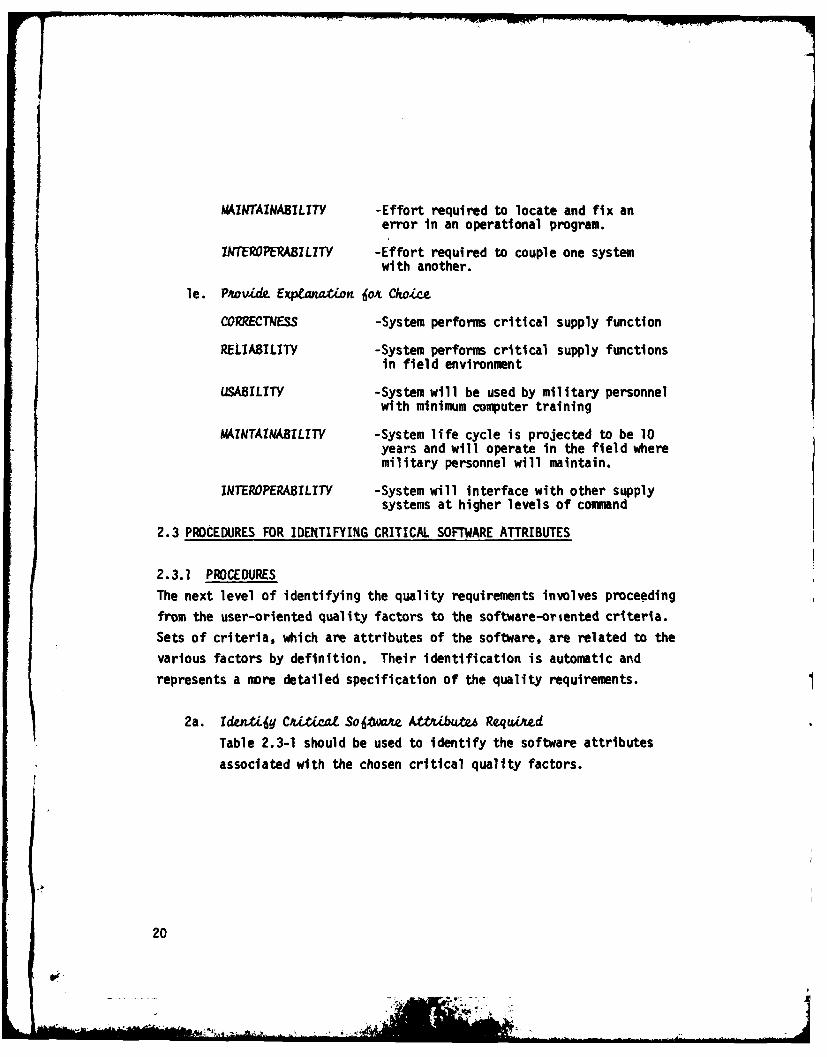
MAINTAINABILITY -Effort required to locate and fix anerror in an operational program.
INTEROPERABILZTY -Effort required to couple one systemwith another.
le. Povide Eptnation 6o,% Cko'ce,
CORRECTNESS -System perform critical supply function
RELIABILITY -System performs critical supply functionsin field environment
USABILITY -System will be used by military personnelwith minimum computer training
MAINTAINABILITY -System life cycle is projected to be 10years and will operate in the field wheremilitary personnel will maintain.
INTEROPERABILITY -System will interface with other supplysystems at higher levels of command
2.3 PROCEDURES FOR IDENTIFYING CRITICAL SOFTWARE ATTRIBUTES
2.3.1 PROCEDURESThe next level of identifying the quality requirements involves proceeding
from the user-oriented quality factors to the software-oriented criteria.Sets of criteria, which are attributes of the software, are related to thevarious factors by definition. Their identification is automatic andrepresents a more detailed specification of the quality requirements.
2a. Identy d CL&Wi So4.a. A tti ibutt Reqaufbd
Table 2.3-1 should be used to identify the software attributes
associated with the chosen critical quality factors.
20
V
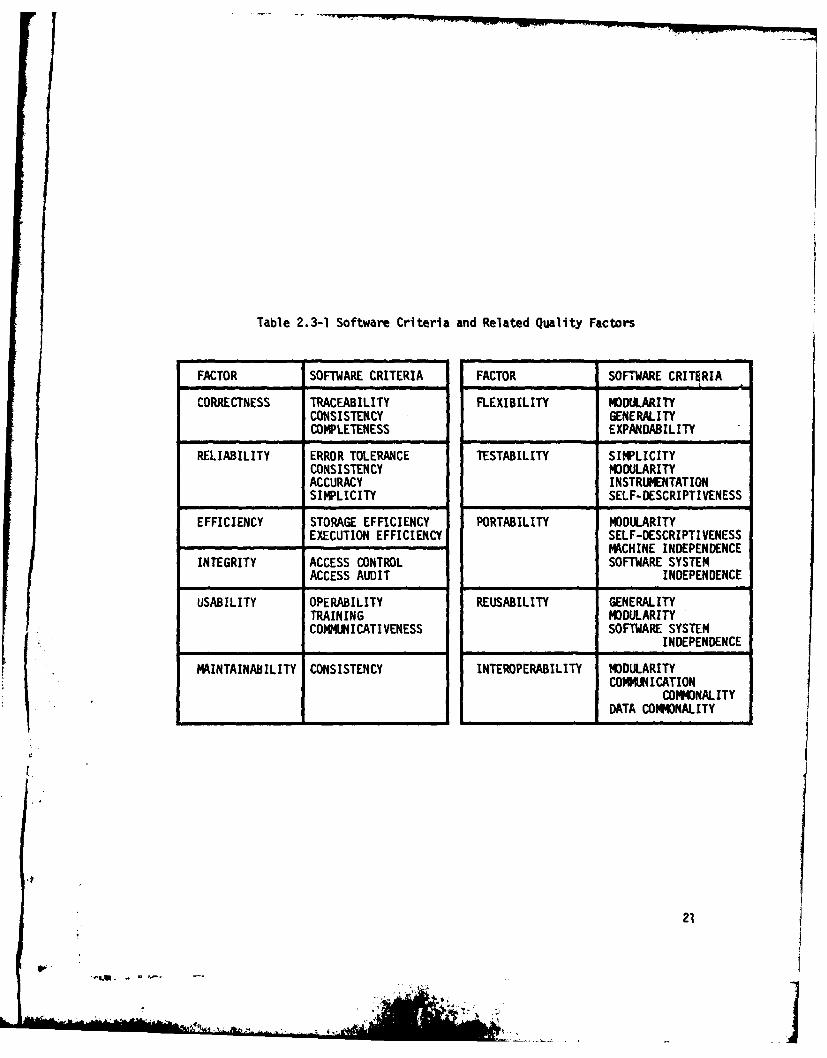
Table 2.3-1 Software Criteria and Related Quality Factors
FACTOR SOFTWARE CRITERIA FACTOR SOFTWARE CRITURIA
CORRECTNESS TRACEABILITY FLEXIBILITY MODULARITYCONSISTENCY GENERAL ITYCOMPLETENESS EXPANDABILITY
RELIABILITY ERROR TOLERANCE TESTABILITY SIMPLICITYCONSISTENCY MOcDULARITYACCURACY INSTRUENTATIONSIMPLICITY SELF-DESCRIPTIVENESS
EFFICIENCY STORAGE EFFICIENCY PORTABILITY MO)DULARITYEXECUTION EFFICIENCY SELF-DESCRIPTIVENESS
MACHINE INDEPENDENCEINTEGRITY ACCESS CONTROL SOFTWARE SYSTEM
ACCESS AUDIT INDEPENDENCE
USABILITY OPERABILITY REUSABILITY GENERALITYTRAINING MO)DULARITYCOMMUNICATIVENESS SOFTWARE SYSTEM
INDEPENDENCE
MAINTAINABILITY CONSISTENCY INTEROPERABILITY MODULARITYCOMMUNICATION
21

2b. ftovid& Vef~iAitionThe definitions in Table 2.3-2 should also be provided as partof the specification.
Table 2.3-2 Criteria Definitions for Software Quality
Factors
CRITERION DEFINITION
TRACEA81LITY Those attributes of the software that providea thread from the requrements to the imple-mentation With respect to the specific
_____________ development and operational environment.
C0O4PLETENESS Those attributes of the software thatprovide full implementation of the functions
_____________ required.
CONSISTENCY Those attributes of the software thatprovide uniform design and implemntationtechniques and notation.
ACCURACY Those attributes of the software thatprovide the required precision in calcula-tions and outputs.
ERROR TOLERAN4CE Those attributes of the software thatprovide continuity of operation undernonnominal conditions.
SIMPLICITY Those attributes of the software thatprovide implementation of functions in themust understandable manner. (Usuallyavoidance of practices which increase
_____________ complexity.)
MODULARITY Those attributes of the software thatprovide a structure of highly independentModules.
GENERALITY Those attributes of the software thatprovide breadth to the functions performed.
EXPANDABILITY Those attributes of the software thatprovide for expansion of data storage
_____________ requirements or computational functions.
INSTRUMENTATION Those attributes of the software thatprovide for the measurement of usage or
_____________ identification of errors.
SELF- Those attributes of the software thatDESCRIPTIVENESS provide explanation of the implementation
of a function.
22

71
Table 2.3-2 Criteria Definitions for Software Quality Factors(Continued)
CRITERION DEFINITION
EXECUTION Those attributes of the software thatEFFICIENCY provide for minimm processing time.
STORAGE Those attributes of thie software thatEFFICIENCY provide for minimm storage requlrmowts
during operation.
ACCESS CONTROL. Those attributes of the software thatprovide for control of the access ofsoftware and data.
ACCESS AUDIT Those attributes of the software thatprovide for an audit of the access ofsoftware and data.
1PE1A1IL:TY Those attributes of the software thatdetermine operation and procedures con-cened with the operation of the software.,
TRAINING Those attributes of the software thatprovide transition from current operationor initial familiarization.
COWeNICATIrVENESS rioso attributes of the software thatprovide useful inputs and outputs wnichcan be assimilated.
SOFTWgARE SYSTEM4 Those attributes of the software thatINOEPENDENCTE determine its dependency on the software
enviroment (operating systems, utilities,input/output routines, etc.)
10CHINEThose attributes of the software thatINDEPENDENCE determine its dependency on the hardware
system.
it.COMMUNICATIONS Those attributes of the software that..OMMNALI7Y provide the use of standard protocols
and interface routines.
DATA COMMNALITY Those attributes of the software thatprovide the use of standard data repre-sentations.
* ,CONCINESS Those attributes of the software thatprovide for implementation of a functionwith a minimum amount of code.
* 1 23
Ls

2.3.2 EXAMPLE OF IDENTIFYING SOFTWARE CRITERIAContinuing with the example of paragraph 2.2.2, the software criteriafor the identified quality factors would be chosen.
2a. IckittLy Cx~tenL Sof4A7AL AfttibuteA
Using the relationships provided in Table 2.3-1, the followingcriteria would be identified.
CRITERIA RELATED FACTOR
TRACEABILITV
CONSISTENCY .. CORRECTNESSCOMPLETENESS_______
ERROR TOLERANCEACCURACY_________ RELIABILITY
CONCISENESS
MOUART MINTAINABILITYSELF-VESCRIPTIVENESS
TRAINING USABIL ITY
COMMUNICATIONS COMMONALITY INTEROPERABILITYDATA COMMONALITY.
2b. P'wvide Ve~initin,6
The definitions for each of these criteria would be providedalso.
24

2.4 PROCEDURES FOR ESTABLISHING QUANTIFIABLE G)ALS
2.4.1 PROCEDURES
The last level, which is the most detailed and quantified, requii~s precisestatements of the level of quality that will be acceptable for the software
product.
Currently, the underlying mathematical relationships which allow measurementat this level of precision do not exist for all of the quality factors. Themechanism for making the precise statement for any quality factor is a rating
of the factor. The underlying basis for the ratings is the effort or cost
required to perform a function such as to correct or modify the design or
program. For example, rating for maintainability might be that the average
time to fix a problem should be five man-days or that 90% of the problem
fixes should take less than six man-days. This rating would be specifiedas a quality requirement. To comply with this specification, the software
would have to exhibit characteristics which, when present, given an indication
that the software will perform to this rating. These characteristics are
measured by metrics which are inserted into a mathematical relationship to
obtain the predicted rating.
In order to choose ratings such as the two mentioned above, data must be
available which allows the decision maker to know what is a "good rating" orperhaps what is the Industry average. Currently there is generally a lack
of good historical data to establish these expected levels of operations andmaintenance performance for software. There are significant efforts under-
way to compile historical data and derive the associated performance statis-
tics [DUVA76). Individual software development organizations and System
* iProgram Offices should attempt to compile historical data for their particular
environment. Any environment-unique data available should be used as acheck against the data provided as guidelines in this manual. The data
utilized in this section is based on experiences applying the metrics to
several large command and control software systems and other experiences
reported in the literature.
25
L .

3a. Spec.jy Rating Jot Ewih QuaLt4 Far.*o
After identification of the critical quality factors, specific perform-
ance levels or ratings required for each factor should be specified.
Table 2.4.1 should be used as a guideline for identifying the ratings.
for the particular factors. Note that mathematical relationships have
not been established for some of the factors. In those cases, it is
advisable not to levy requirements for meeting a specific quality
rating but instead specify the relative importance of the quality
factor as a development goal. Not that the reliability ratings are
provided in terms familiar to traditional hardware reliability. Just
as in hardware reliability there are significant differences between
ratings of .9 and .99.
3b. Ideznt6y Spec 6i- Metx'a to be Apptied
The next step or an alternative to 3a is to identify the specific metrics
which will be applied to the various software products produced during
the development. The Metric Worksheets described it Section 3 can be
used for this purpose or Table 2.4-2 can be used to Identify the metrics
and reference can be made to RADC-TR-79- [MCCA79J where definitions of
the metrics are provided.
3c. S pezi45tlon 06 Meu,& Tkhultotd VdaueA
In lieu of specifying quality ratings or in addition to the ratings,
specific minitmum values for particular metrics may be specified. This
technique is equivalent to establishing a standard which is to be adhered
to. Violations to the value established are to be reported. Typical
values can be derived by applying the metrics to software products
developed in a particular environment or by looking at the scores re-
* ported in [MCCA77] and [MCCA79]. When establishing these threshold
values based on past project data, projects which have been considered
sucessful, i.e., have demonstrated good characteristics during their
life cycle should be chosen. For example, a system which has been
relatively cost-effective to maintain over its operational history
should be chosen to apply the metrics related to maintainability aid
establish threshold values.
26
/ .Ag. ,A
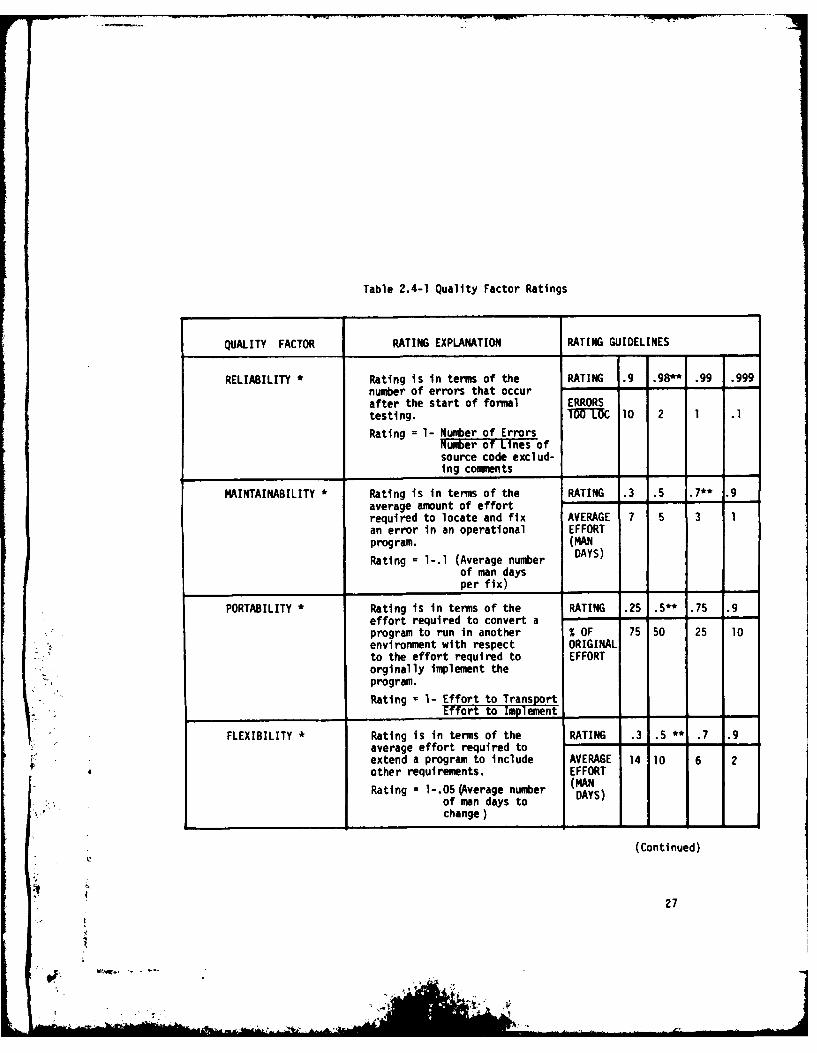
Table 2.4-1 Quality Factor Ratings
QUALITY FACTOR RATING EXPLANATION RATING GUIDELINES
RELIABILITY * Rating is in terms of the RATING .9 .98** .99 .999number of errors that occurafter the start of formal ERRORStesting. TM-LC 10 2 1 .1
Rating = 1- Number of ErrorsNumber of Lines ofsource code exclud-ing comments
MAINTAINABILITY * Rating is in terms of the RATING .3 .5 .7** .9average amount of effortrequired to locate and fix AVERAGE 7 5 3 1an error in an operational EFFORTprogram. (MAN
Rating = 1-.1 (Average number DAYS)
of man daysper fix)
PORTABILITY * Rating is in terms of the RATING .25 .5.* .75 .9effort required to convert aprogram to run in another % OF 75 50 25 10environment with respect ORIGINALto the effort required to EFFORTorginally implement theprogram.
Rating 1- Effort to Trans rtEffotto Implement
FLEXIBILITY * Rating is in terms of the RATING .3 .5 ** .7 .9average effort required toextend a program to include AVERAGE 14 10 6 2other requirements. EFFORT
Rating -1-.05 (Average number (MANof man days to DAYS)
change)
(Continued)
27
. .. .- m . - i. '
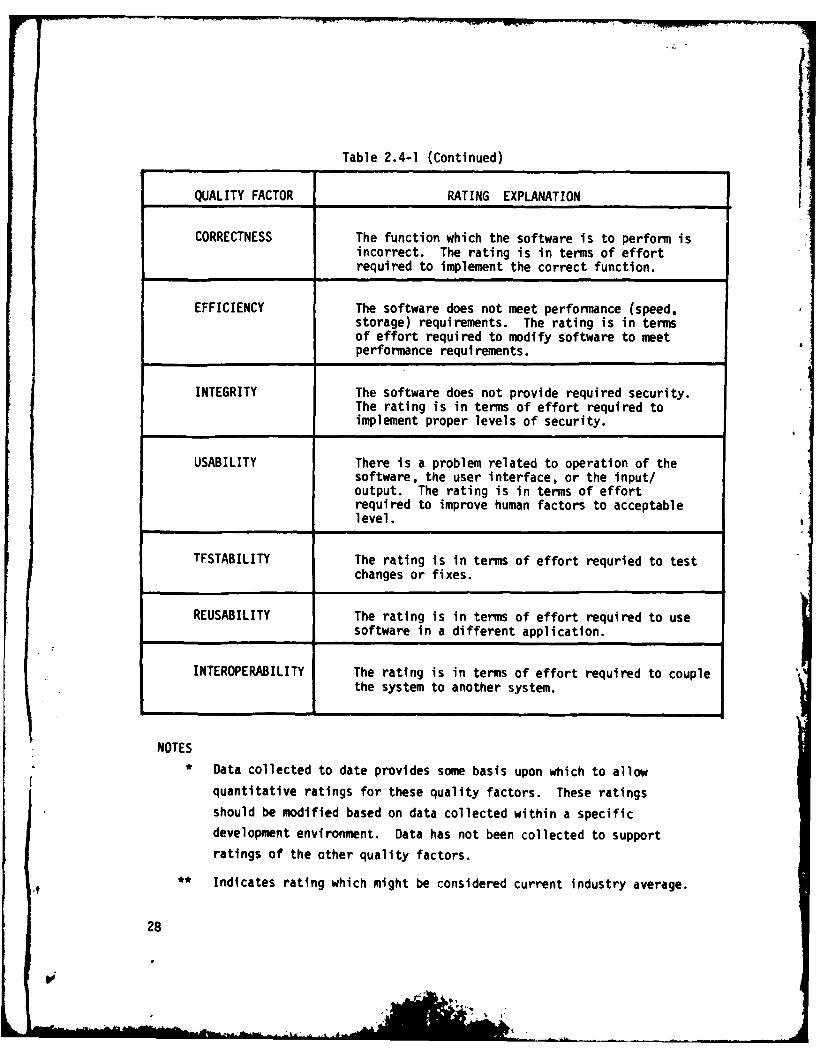
Table 2.4-1 (Continued)
QUALITY FACTOR RATING EXPLANATION
CORRECTNESS The function which the software is to perform isincorrect. The rating is in terms of effortrequired to implement the correct function.
EFFICIENCY The software does not meet performance (speed,storage) requirements. The rating is in termsof effort required to modify software to meetperformance requirements.
INTEGRITY The software does not provide required security.The rating is in terms of effort required toimplement proper levels of security.
USABILITY There is a problem related to operation of thesoftware, the user interface, or the input/output. The rating is in terms of effortrequired to improve human factors to acceptablelevel.
TFSTABILITY The rating is in terms of effort requried to test
changes or fixes.
REUSABILITY The rating is in terms of effort required to usesoftware in a different application.
INTEROPERABILITY The rating is in terms of effort required to couplethe system to another system.
NOTES
* Data collected to date provides some basis upon which to allow
quantitative ratings for these quality factors. These ratingsshould be modified based on data collected within a specificdevelopment environment. Data has not been collected to supportratings of the other quality factors.
** Indicates rating which might be considered current industry average.
28
V
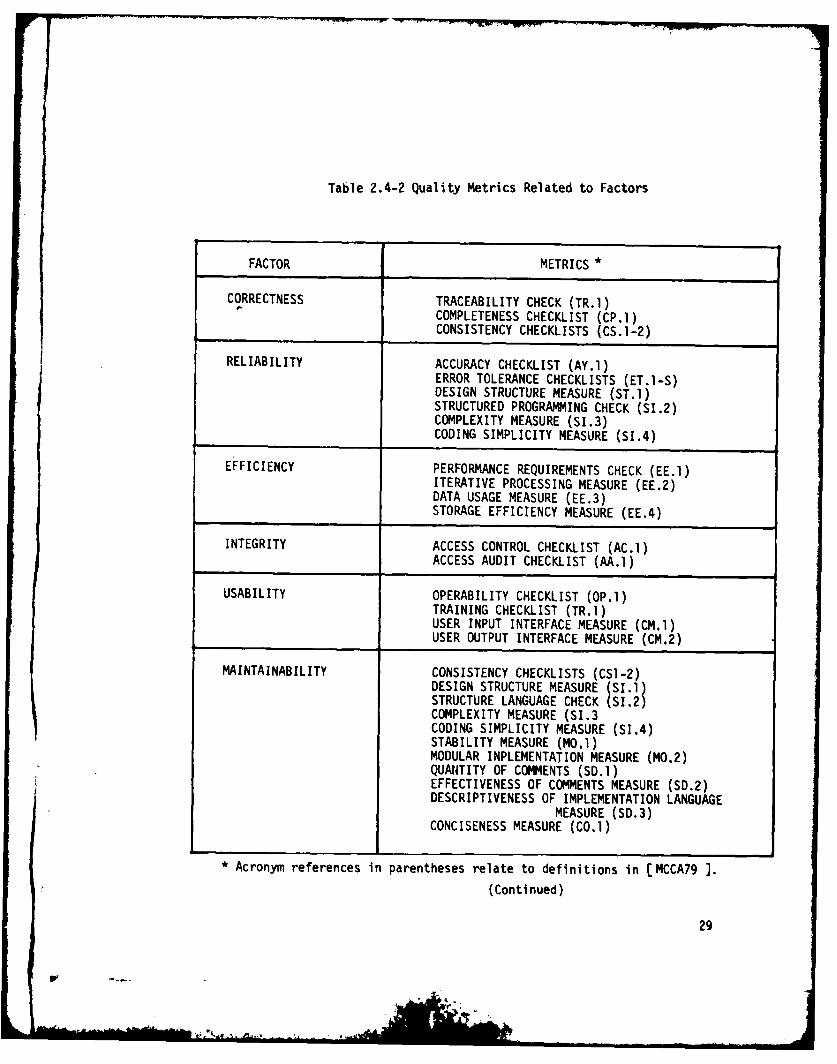
Table 2.4-2 Quality Metrics Related to Factors
FACTOR METRICS *
CORRECTNESS TRACEABILITY CHECK (TR.l)COMPLETENESS CHECKLIST (CP.l)CONSISTENCY CHECKLISTS (CS.1-2)
RELIABILITY ACCURACY CHECKLIST (AY.1)ERROR TOLERANCE CHECKLISTS (ET.I-S)DESIGN STRUCTURE MEASURE (ST.l)STRUCTURED PROGRAMMING CHECK (SI.2)COMPLEXITY MEASURE (SI.3)CODING SIMPLICITY MEASURE (SI.4)
EFFICIENCY PERFORMANCE REQUIREMENTS CHECK (EE.l)ITERATIVE PROCESSING MEASURE (EE.2)DATA USAGE MEASURE (EE.3)STORAGE EFFICIENCY MEASURE (EE.4)
INTEGRITY ACCESS CONTROL CHECKLIST (AC.1)ACCESS AUDIT CHECKLIST (AA.l)
USABILITY OPERABILITY CHECKLIST (OP.I)TRAINING CHECKLIST (TR.1)USER INPUT INTERFACE MEASURE (CM.l)USER OUTPUT INTERFACE MEASURE (CM.2)
MAINTAINABILITY CONSISTENCY CHECKLISTS (CSI-2)DESIGN STRUCTURE MEASURE (SI.1)STRUCTURE LANGUAGE CHECK (SI.2)COMPLEXITY MEASURE (SI.3CODING SIMPLICITY MEASURE (SI.4)STABILITY MEASURE (MO.l)MODULAR INPLEMENTATION MEASURE (MO.2)QUANTITY OF COMMENTS (SD.1)EFFECTIVENESS OF COMMENTS MEASURE (SD.2)DESCRIPTIVENESS OF IMPLEMENTATION LANGUAGE
MEASURE (SD.3)CONCISENESS MEASURE (CO.I)
• Acronym references in parentheses relate to definitions in [MCCA79 ).
(Continued)
29

Table 2.4-2 Quality Metrics Related to Factors (Continued)
FACTOR METRICS *
FLEXIBILITY MODULAR IMPLEMENTATION MEASURE (MO.2)INTERFACE MEASURE (GE.l)GENERALITY CHECKLIST (GE.2)DATA STORAGE EXPANSION MEASURE (EX.l)EXTENSIBILITY MEASURE (EX.l)QUANTITY OF COMMENTS (SD.1)EFFECTIVENESS OF COMMENTS MEASURE (SD.2)DESCRIPTIVENESS OF IMPLEMENTATION LANGUAGE
MEASURE (SD.3)
DESIGN STRUCTURE MEASURE (SI.1)TESTABILITY STRUCTURED PROGRAMMING CHECK (SI.2)
COMPLEXITY MEASURE (SI.3)CODING SIMPLICITY MEASURE (SI.4)STABILITY MEASURE (MO.1)MODULAR IMPLEMENTATION MEASURE (MO.2)TEST CHECKLISTS (IN.1-3)QUANTITY OF COMMENTS (SD.1)EFFECTIVENESS OF COMMENTS MEASURE (SD.2)DESCRIPTIVENESS OF IMPLEMENTATION LANGUAGE
MEASURE (SD.3)
PORTABILITY MODULAR IMPLEMENTATION MEASURE (MO.2)QUANTITY OF COMMENTS (SD.l)EFFECTIVENESS OF COMMENTS MEASURE (SD.2)DESCRIPTIVENESS OF IMPLEMENTATION LANGUAGE
MEASURE (SD.3)SOFTWARE SYSTEM INDEPENDENCE MEASURE (SS.1)MACHINE INDEPENDENCE MEASURE (MI.l)
REUSEABILITY MODULAR IMPLEMENTATION MEASURE (MO.2)INTERFACE MEASURE (GE.1)GENERALITY CHECKLIST (GE.2)QUANTITY OF COMMENTS (SD,1)EFFECTIVENESS OF COMM ENTS MEASURE (SD.2)DESCRIPTIVENESS OF IMPLEMENTATION LANGUAGE
MEASURE (SD.3)SOFTWARE SYSTEM INDEPENDENCE MEASURE (SS.1)MACHINE INDEPENDENCE MEASURE (MI1.)
INTEROPERABILITY MODULAR IMPLEMENTATION MEASURE (MO.2)COMMUNICATIONS COMMONALITY CHECKLIST (CC.l)DATA COMMONALITY CHECKLIST (DC.I)
30
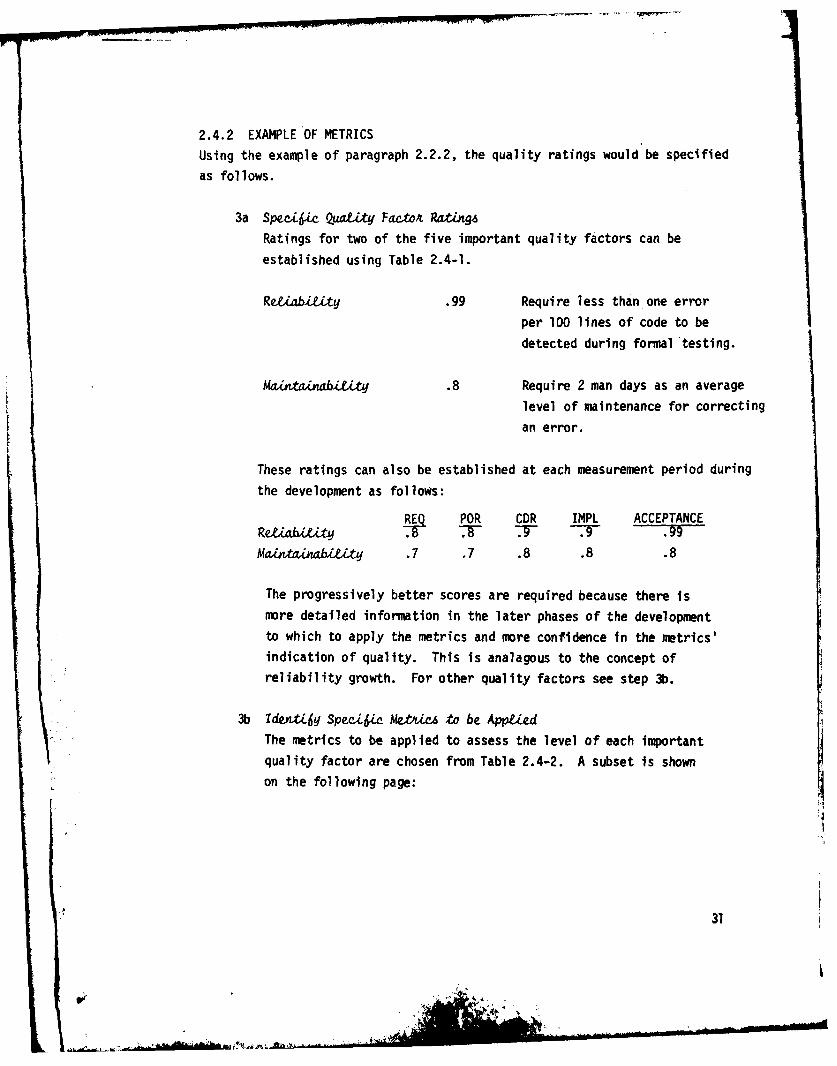
2.4.2 EXAMPLE OF METRICS
Using the example of paragraph 2.2.2, the quality ratings would be specified
as follows.
3a Speci4c QuaU ty Facto4 Rating.6
Ratings for two of the five important quality factors can be
established using Table 2.4-1.
Re.Z1abity .99 Require less than one error
per 100 lines of code to be
detected during formal testing.
mvJ:v& ty .8 Require 2 man days as an average
level of maintenance for correcting
an error.
These ratings can also be established at each measurement period during
the development as follows:
E POR CDR IMPL ACCEPTANCERetoai.Uy YT x- -.r 7 .99
Mani b Y .7 .7 .8 .8 .8
The progressively better scores are required because there is
more detailed information in the later phases of the development
to which to apply the metrics and more confidence in the metrics'
indication of quality. This is analagous to the concept of
reliability growth. For other quality factors see step 3b.
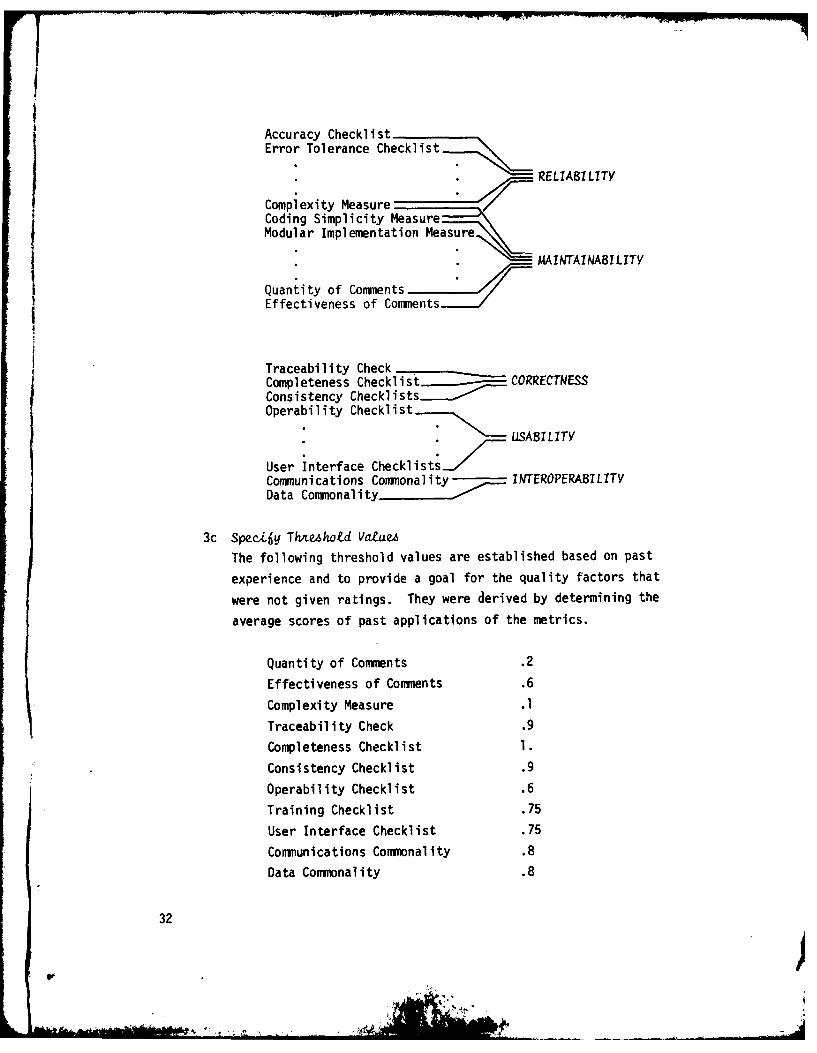
3b ,denti6y Speai.c MeftitA to be AppiedThe metrics to be applied to assess the level of each important
quality factor are chosen from Table 2.4-2. A subset is shown
on the following page:
31
:' 31
.1Accuracy Checkli stError Tolerance Checklist
* RELIABILITY
Complexity MeasureCoding Simplicity MeasureModular Implementation Measure
MAINTAINABILITY
Quantity of CommientsEffectiveness of Commenmts
Traceability CheckCompleteness Checklist CORRECTNESSConsistency ChecklistsOperability Checklist -- I
User interface ChecklistsA ICommunications Commonal ity INTEROPERABILITVData Commonality I R
3c Speci~y ThAtehold Vatue
The following threshold values are established based on past
experience and to provide a goal for the quality factors that
were not given ratings. They were derived by determining the
average scores of past applications of the metrics.
Quantity of Comments .2
Effectiveness of Comments .6
Complexity Measure .1
Traceability Check .9
Completeness Checklist 1.
Consistency Checklist .9
Operability Checklist .6
Training Checklist .75
User Interface Checklist .75
Communications Commonality .8
Data Commonality .8
32
• ,. . ii

2.5 EVALUATION OF DEVELOPMENT PLAN
In an acquisition environment the initial benefits of utilizing the quality
metrics concepts are realized in the source selection process. The acquisi-
tion office should include the quality goals established as software requirements
in the Request for Proposal. The software attributes should be also identi-
fied as required characteristics in the software and the metrics as the
vehicles for assessing their existence. The bidders should be required to
describe how they plan to provide those characteristics in the software.
This discussion should be provided in the portion of the proposal that
describes their development plan.
The description of the bidderk approach for including the required attributes
in the software not only forces acknowledgement of these additional require-
ments but also provides additional information with which to evaluate the
bidders during source selection.
33
V
*/.. . . . ....... ... J II,

SECTION 3
PROCEDURES FOR APPLYING MEASUREMENTS
3.1 WHEN TO APPLY MEASUREMENTS
The software quality metrics are oriented toward the availability of
information about the software system as it progresses in its development.
In the early phases of the development, the metrics are applied to the
documentation produced to describe the concepts of the system and its
design. In the later phases the metrics are oriented not only to documen-
tation but also to the source code that is available.
Thus, the application of the metrics logically follows the phased devel--
opment of software. The first application of the metric is at the end
of the requirements analysis. The next application is during design.
If the design phase has been decomposed into a preliminary design phase
and a detailed design phase, the metrics should be applied at the end
of each of those phases. During implementation, i.e. coding the metrics
oriented toward the source code should be applied periodically to assess
the quality growth exhibited as the code evolves. The timing of the
application of the metrics is shown in Figure 3.1-1. The application of
the metrics can be done during or just proir to formal customer reviews
(as shown in Figure 3.1-1) or during equivalent activities conducted by
the development personnel.
REQUIREMENTSPROGRAMM4ING TSRNAIESS DESIGN AND TES T
ANLSSCHECKOUT INTEGRATION]
REQUIREMENT --,REVIEW PERIODIC
APPLICATIONDURINGCODINGANDTES TING
PRELIMINARYDESIGNREV I EW
CRITICALDESIGNREVIEW
VALIDATIONANDACCEPTANCETESTREVIEW
ACCEPTANCE
Fiqure 3.1-1 Timinq of Metrics Application
. -.

3.2 SOURCES OF QUALITY INFORMATION
A typical minimum set of documents and source code are shown in Figure 3.2-1.
These documents plus the source code are the sources of the quality infor-
mation derived from the application of the metrics.
REQUIREMENTS PROGRAMMING TESTANALYSIS DESIGN AND ANDCHECKOUT INTEGRATIONI
REQUIREMENTSSPEC
PRELIMINARYDESIGNSPECUSER'S MANUAL(DRAFT)
DETAILEDDESIGNSPECTEST PLAN RCE CODEANDPROCEDURES DETAILED
DESIGNSPECUPDATED
TESTRESULTS
USER'S MANUAL(FINAL)
Figure 3.2-1
35
'7
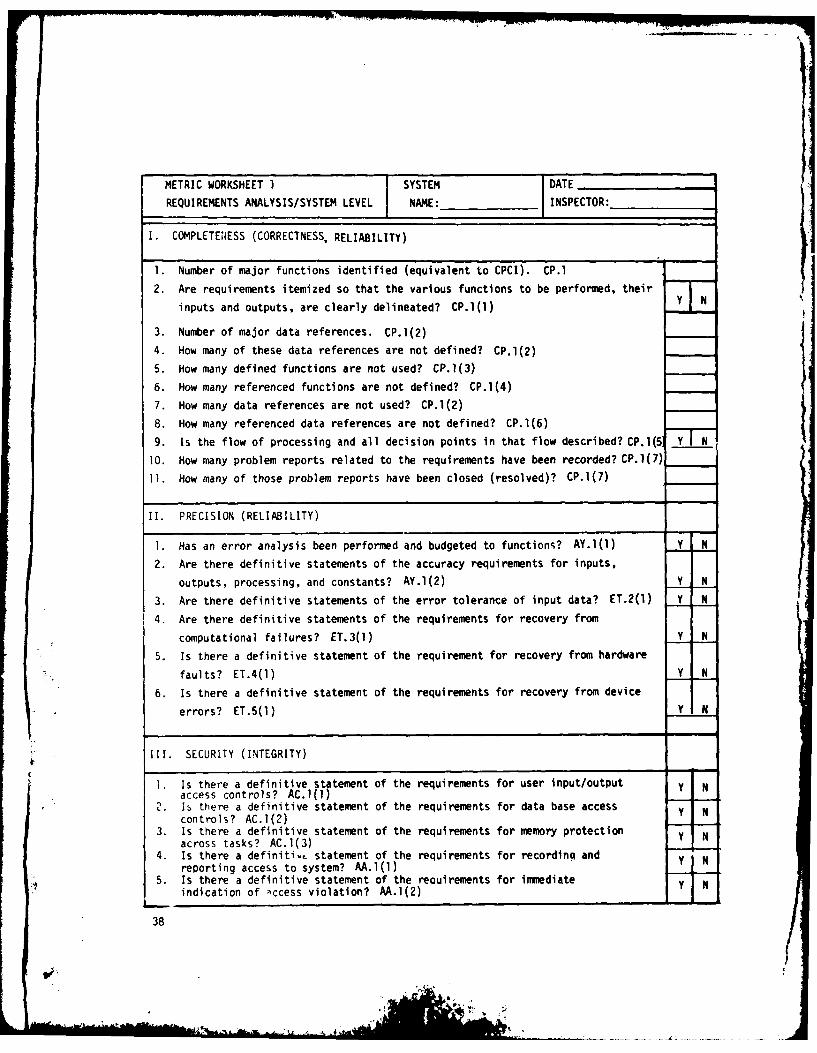
3.3 APPLICATION OF THE MEASUREMENTS
The vehicle for applying the software metrics are the metric worksheets
contained in this section of the manual. The procedure is to take the
available documentation/source code, apply the appropriate worksheet
(as shown in Figure 3.3-1), and translate the measurements to metric
scores.
The worksheets are organized as follows. In the header portion of the work-
sheet is the worksheet identification which (1) identifies the phase
during which the worksheet is initially used and the level (system
or module) to which the worksheet applies, (2) provides identification of
the system and the module to which the worksheet has been applied, and (3)
provides identification of the date and the inspector who took the measure-
ments. The remaining portion of each worksheet contains the measurements to
be taken and questions to be answered. These measurements and questions are
organized by quality factors identified in parentheses. Each logical
group of measurements and questions have a group identifier and are
bordered. When applying the measurements, only those in the groups that
relate to the quality factors chosen as quality goals should be applied.
Metric Worksheet # 1 and # 2a contain system level metrics and are applied
at the system or major subsystem (CPCI) level to the System Requirements
Specification, the Preliminary Design Specification, the User's Manual, and
the Test documentation.
Metric Worksheets # 2b and #3 contain module level metrics and are applied
to each module's design (Detailed Design Specification) and implementation
(source code).
.efinitions and interpretations of the individual measurements contained
in the worksheets are found in Appendix B of the first volume. Next to
each measurement element on the worksheets is an index into the metric
table in Appendix B.
36
4.*

As shown in Figure 3.3-1, the worksheets may be applied several times duringthe development. For example, Metric Worksheet #2b which is appliedfor each module to the detailed design document during design is alsoapplied to the detailed design document after it has been updated toreflect the actual implementation. The worksheet does not have to be
totally reapplied. The successive applications of any worksheet shouldrequire considerably less effort than the original application. The
successive applications should involve simply updates to reflect theupdates made to the system since the previous application of the worksheet.
DEVELOP1ENT PHASES
REQUIREMENTS DESIGN IMPLEMIENTATION ANDANALYSIS INTEGRATION
REQUIREMENTSSPEC
METRICWORKSHEET PRELIMINARY# 1 DESIGNSPEC
USER'S MANUAL(DRAFT) DETAiLED
DESIGNMETRIC SPECWORKSHEET (BUILD TO)# 2a SOURCE
TEST CODEPLAN DETAILEDAND DESIGNPROCEDURES SPEC TEST
(BUILT TO) RESULTSUSER'S MANUAL(FINAL
METRICWORKSIKEEI
#2bIIErTIC METRIC WOKSEETWORKSMEET # 3#2aUPDATE METRIC WORKSE METRIC WORKSHEET
92b 26UPDATE UPDATE
Figure 3.3-1 Application of the Metric Worksheets
37
....................
METRIC WORKSHEET 1 SYSTEM DATE
REQUIREMENTS ANALYSIS/SYSTEM LEVEL NAME: INSPECTOR:
I. COMPLETENESS (CORRECTNESS, RELIABILITY)
1. Number of major functions identified (equivalent to CPCI). CP.l
2. Are requirements itemized so that the various functions to be performed, their
inputs and outputs, are clearly delineated? CP.l(l) Y N
3. Number of major data references. CP.l(2)
4. How many of these data references are not defined? CP.l(2)
5. How many defined functions are not used? CP.1(3)
6. How many referenced functions are not defined? CP.l(4)
7. How many data references are not used? CP.l(2)
8. How many referenced data references are not defined? CP.l(6) :;Y
9. Is the flow of processing and all decision points in that flow described? CP.l(5 Y
10. How many problem reports related to the requirements have been recorded? CP.l(7)
11. How many of those problem reports have been closed (resolved)? CP.l(7)
II. PRECISION (RELIABILITY)
1. Has an error analysis been performed and budgeted to functions? AY.l(1) Y N
2. Are there definitive statements of the accuracy requirements for inputs,
outputs, processing, and constants? AY.l(2) Y N
3. Are there definitive statements of the error tolerance of input data? ET.2(l) Y N
4. Are there definitive statements of the requirements for recovery from
computational failures? ET.3(l) Y N
5. Is there a definitive statement of the requirement for recovery from hardware
faults? ET.4(l) Y N
6. Is there a definitive statement of the requirements for recovery from device
errors? ET.5(l) Y N
11. SECURITY (INTEGRITY)
1. Is there a definitive statement of the requirements for user input/output Y Naccess controls? AC.l(l)
2. Is there a definitive statement of the requirements for data base access Y Ncontrols? AC.l(2)
3. Is there a definitive statement of the requirements for memory protection Y Nacross tasks? AC.1(3)
4. Is there a definiti., statement of the requirements for recordinq and Y Nreporting access to system? AA.l(1)
5. Is there a definitive statement of the reauirements for immediate Y Nindication of iccess violation? AA.1(2)
38
-2AM
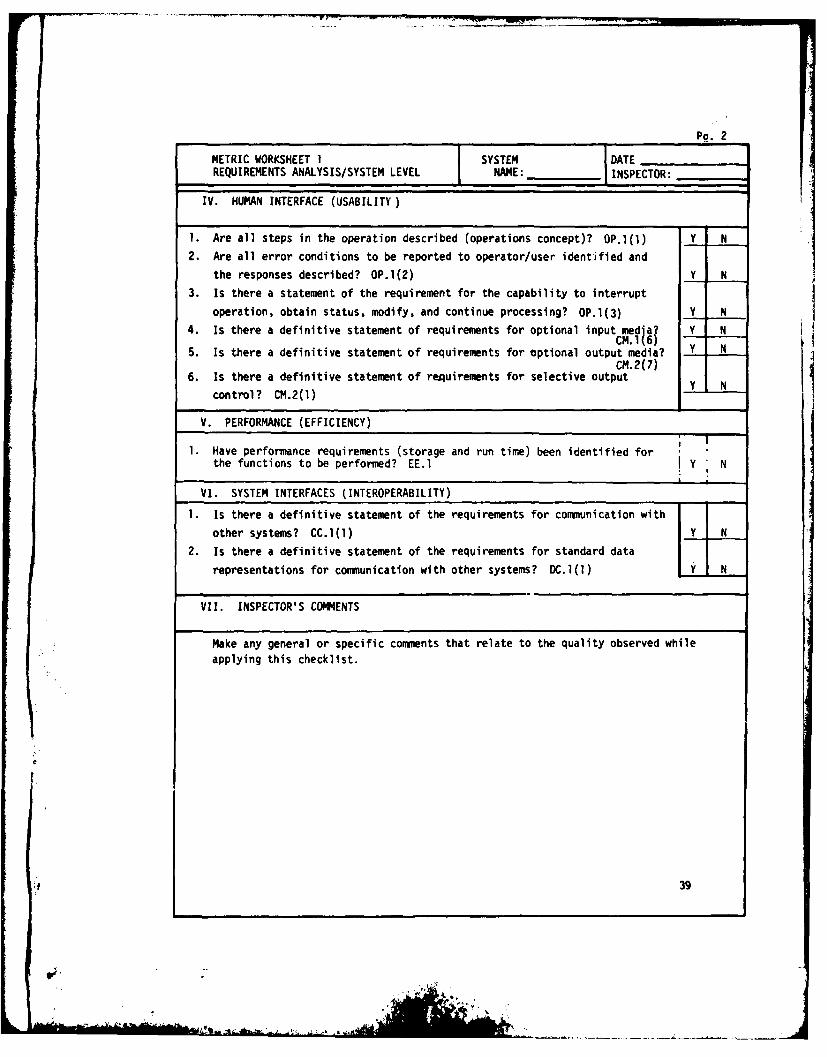
Pa. 2
METRIC WORKSHEET 1 SYSTEM DATEREQUIREMENTS ANALYSIS/SYSTEM LEVEL NAME: _INSPECTOR:
IV. HUMAN INTERFACE (USABILITY
1. Are all steps in the operation described (operations concept)? OP.l(l) N
2. Are all error conditions to be reported to operator/user identified and
the responses described? OP.l(2) Y N
3. Is there a statement of the requirement for the capability to interrupt
operation, obtain status, modify, and continue processing? OP.l(3) Y N
4. Is there a definitive statement of requirements for optional input media7 Y NCM.I16)
5. Is there a definitive statement of requirements for optional output media? Y NCM.2(7)
6. Is there a definitive statement of requirements for selective output 4.control? CM.2(1)
V. PERFORMANCE (EFFICIENCY)
1. Have performance requirements (storage and run time) been identified forthe functions to be performed? EE.. Y N
VI. SYSTEM INTERFACES (INTEROPERABILITY)
1. Is there a definitive statement of the requirements for communication with
other systems? CC.l(1) Y N
2. Is there a definitive statement of the requirements for standard data
representations for communication with other systems? DC.l(l) Y N
VII. INSPECTOR'S COMMENTS
Make any general or specific comments that relate to the quality observed while
applying this checklist.
39
' , .- ', 4 .- ,

METRIC WORKSHEET 2a SYSTEM DATE;
DESIGN/SYSTEM LEVEL NAME: INSPECTOR:
I. COMPLETENESS (CORRECTNESS, RELIABILITY)
1. Is there a matrix relating itemized requirements to modules which implement Y N
those requirements? TR.I
2. How many major functions (CPCIS) are identified? CP.I
3. How many functions identified are not defined? CP.I(2)
'4. How many defined functions are not used? CP.l(3)
5. How many interfaces between functions are not defined? CP.l(6)
6. Number of total problem reports recorded? CP.1(7)
7. Number of those reports that have not been closed (resolved?) CP.1(7)
8. Profile of problem reports: (number of following types) a. Computationalb. Logic
II. PRECISION (RELIABILITY) c. Input/outputd. Data handling
1. Have math library routines to be used been e. OS/System Supportf. Configurationchecked for sufficiency with regards to Y N g. Routine/Routine
requirements? AY.(3) I interfaceaccuracy h. Routine/System
2. Is concurrent processing centrally Interface
controlled? ET.l(l) Y N i. Tape Processingj. User interface
3. How many error conditions are reported k. data base interface
by the system? ET.I(2) Y N 1. user requestedchanges
4. How many of those errors are automatically m. Preset datafixed or bypassed and processing continues? n. Global variable
ET 1(2) definition5. How many, require operator interventionpr
ET 1(2) p. Recurrent errors6. Are provisions for recovery from hardware Y N q. Documentation
faults provided? ET.4(2) r. Requirement
7. Are provisions for recovery from device compliance
errors provided? ET.5(2) Y N s. Operatort. Questions
,-....u..HardwareIII STRUCTURE (RELIABILITY, MAINTAINABILITY,TESABILITY,
PORTABILITY, REUSABILITY, INTEROPERABILITY)
I. Is a hierarchy of system, identifying all modules in the system provided? Y N2. Number of Modules SI.I(2) SIM.I()
3. Are there any duplicate functions? SI.l(2) Y N
4. Based on hierarchy or a call/called matrix, how many modules are called by
more than one other module? GE.l
5. Are the constants used in the system defined once? GE.2(5) Y
40
60 .. .

Pg. 2
METRIC WORKSHEET 2a SYSTEM DATE;
DESIGNZSYSTEM LEVEL NAME INSPECTOR:
IV. OPTIMIZATION (EFFICIENCY)
1. Are storage requirements allocated to design? SE.1(1) Y N
2. Are virtual storage facilities used? SE.l(2) Y N
3. Is dynamic memory management used? SE.l(5) Y N
4. Is a performance optimizing compiler used? SE.1(7) Y N
5. Is global data defined once? CS.2(3) Y N
6. Have Data Base or files been organized for efficient processing? EE.3(5) Y N
7. Is data packing used? EE.2(5) Y N
8. Number of overlays EE.2(4)
9. Overlay efficiency - memory allocation EE.2(4)
max overlay size
min overlay size
V. SECURITY (INTEGRITY)
1. Are user Input/Output access controls provided? AC.1(1) Y N
2. Are Data Base access controls provided? AC.l(2) Y N
3. Is memory protection across tasks provided? AC.l(3) Y N
4. Are there provisions for recording and reporting errors? AC.2(1,2) Y N
VI. SYSTEM INTERFACES (INTEROPERABILITY)
1. How many other systems will this system interface with? CC.I(l)
2. Have protoc 1 standards been established? CC.l(2) Y N
3. Are they being complied with? CC.1(2) Y N
4. Number of modules used for input and output to other systems? CC.1(3,4) Y N
5. Has a standard data representation been established or translation
standards between representations been established? DC.1(1) Y N
6. Are they being complied with? DC.1(2)
7. Number of modules used to perform translations? (C.1(3)
VII. HUMAN INTERFACE (USABILITY)
1 . Are all steps in operation described including alternative flows? 0P.I(I)1 Y I N
2. Number of operator actions? OP.1(4)
41
Aim 46I
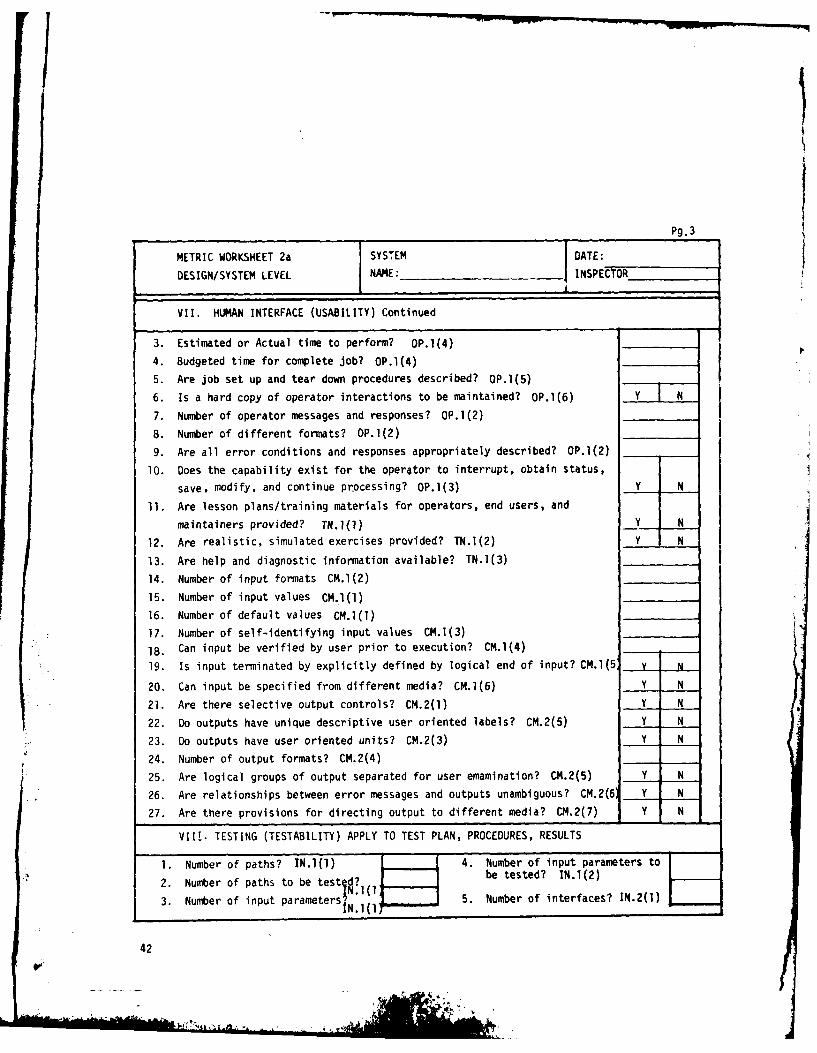
IPg. 3
SMETRIC WORKSHEET 2a SYSTEM DATE:__DESIGN/SYSTEM LEVEL NAME: ._INSPECTOR
VII. HUMAN INTERFACE (USABILITY) Continued
3. Estimated or Actual time to perform? OP.l(4)4. Budgeted time for complete job? OP.l(4)
5. Are job set up and tear down procedures described? OP.l(5)
6. Is a hard copy of operator interactions to be maintained? OP.l(6) Y N
7. Number of operator messages and responses? OP.1(2)
8. Number of different formats? OP.l(2)
9. Are all error conditions and responses appropriately described? OP.l(2)
10. Does the capability exist for the operator to interrupt, obtain status,
save, modify, and continue processing? OP.l(3) Y N
11. Are lesson plans/training materials for operators, end users, and
maintainers provided? TN.l(l) Y N
12. Are realistic, simulated exercises provided? TN.I(2) Y N
13. Are help and diagnostic information available? TN.1(3)
14. Number of input formats CM.I(2)
15. Number of input values CM.I(1)
16. Number of default values CM.l(l)
17. Number of self-identifying input values CM.I(3)
18. Can input be verified by user prior to execution? CM.1(4)
19. Is input terminated by explicitly defined by logical end of input? CM.1(5 y N
20. Can input be specified from different media? CM.l(6) Y N
21. Are there selective output controls? CM.2(1) Y N
22. Do outputs have unique descriptive user oriented labels? CM.2(5) Y N
23. Do outputs have user oriented units? CM.2(3) Y N
24. Number of output formats? CM.2(4)
25. Are logical groups of output separated for user emamination? CM.2(5) Y N
26. Are relationships between error messages and outputs unambiguous? CM.2(6 Y N27. Are there provisions for directing output to different media? CM.2(7) Y_ N
VIII. TESTING (TESTABILITY) APPLY TO TEST PLAN, PROCEDURES, RESULTS
1. Number of paths? IN.l(1) 4. Number of input parameters to
2. Number of paths to be tested? be tested? IN.1(2)
3. Number of input parametersN.1(l 5. Number of interfaces? IN.2(1)
42
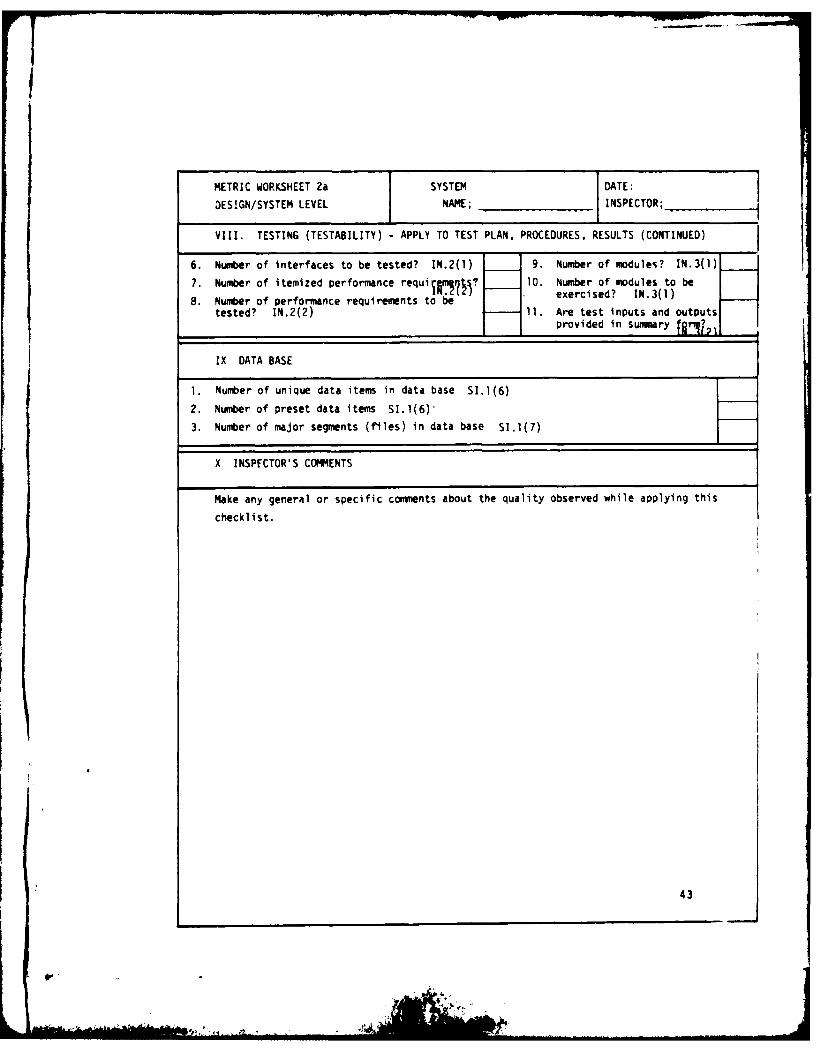
METRIC WORKSHEET 2a SYSTEM DATE:
DESIGN/SYSTEM LEVEL NAME; __________INSPECTOR;
VIII. TESTING (TESTABILITY) -APPLY TO TEST PLAN, PROCEDURES, RESULTS (CONTINUED)
6. Number of interfaces to be tested? IN.2(l) 9. Number of modules? IN.3(l)
7. Number of itemized performance requim~ 10. Number of modules to be
8. Number of performance requirements to be eecsd N3ltested? N22 11. Are test inputs and outputs
provided in summairy
X INSPFCTOR'S COMMENTS
Make any general or specific conmments about the quality observed while applying this
checklist.
43
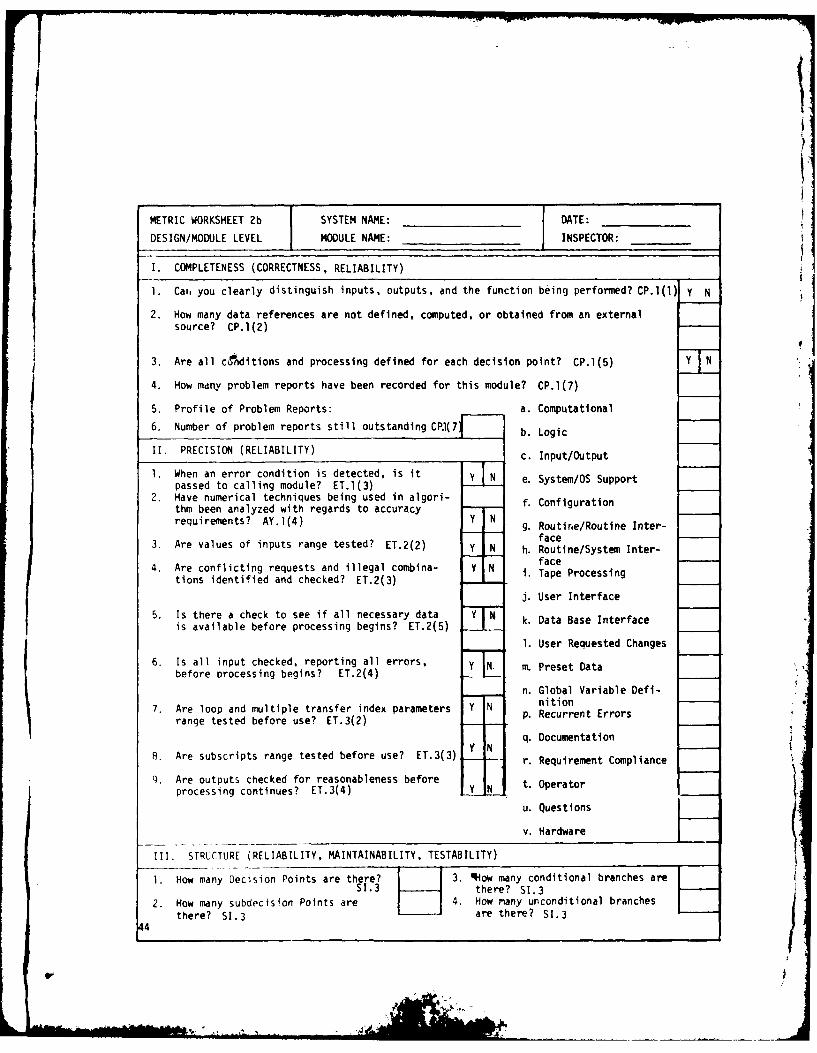
METRIC WORKSHEET 2b SYSTEM NAME: DATE:DESIGN/MODULE LEVEL MODULE NAME: INSPECTOR:
I. COMPLETENESS (CORRECTNESS, RELIABILITY)
1. Car, you clearly distinguish inputs, outputs, and the function being performed? CP.l(l) Y N
2. How many data references are not defined, computed, or obtained from an externalsource? CP.l(2) *-
3. Are all cTnditions and processing defined for each decision point? CP.I(5) N
4. How many problem reports have been recorded for this module? CP.l(7)
5. Profile of Problem Reports: a. Computational
6. Number of problem reports still outstanding CPl(7 b. Logic
II. PRECISION (RELIABILITY) c. Input/Output
1. When an error condition is detected, is it V N e. System/OS Supportpassed to calling module? ET.I(3) eSyemOSupr
2. Have numerical techniques being used in algori- f. Configurationthm been analyzed with regards to accuracy --
requirements? AY.1(4) Y g. Routine/Routine Inter-
face3. Are values of inputs range tested? ET.2(2) Y N h. Routine/System Inter-4. Are conflicting requests and illegal combina- Y N i face
tions identified and checked? ET.2(3) . . Tape Processing
j. User Interface
5. Is there a check to see if all necessary data V N k. Data Base Interfaceis available before processing begins? ET.2(5)
1. User Requested Changes
6. Is all input checked, reporting all errors, y N Pbefore processing begins? ET.2(4) F Preset Data
- - n. Global Variable Defi-
7. Are loop and multiple transfer index parameters Y N nitionp. Recurrent Errors
range tested before use? ET.3(2) .
q. Documentation
8. Are subscripts range tested before use? ET.3(3) Y N;r. Requirement Compliance
9. Are outputs checked for reasonableness before
processing continues? ET.3(4) y N t Operator
u. Questions
v. Hardware
Ill. STRUCTURE (RELIABILITY, MAINTAINABILITY, TESTABILITY)1. How many Decision Points are there? 3. RHow many conditional branches are
SI.3 there? SI.3
2. How many subdecision Points are 4. How many unconditional branchesthere? SI.3 are there? SI.3
44

METRIC WORKSHEET 2B SYSTEM NAME:
DESIGN/MODULE LEVEL MODULE NAME:I g
III. STRUCTURE (RELIABILITY, MAINTAINABILITY, TESTABILITY) (CONTINUED)
5. Is the module dependent on the 7. Are any limitations of the proces-
source of the input or the N sing performed by the module YINdestination of the output? SI.1(3) [ identified? EX.2(l)
6. Is the module dependent on know- i 8. Number of entrances into mdu]sledge of prior processing? SI.1(3) Y N uI. 5)
IV. REFERENCES (MAINTAINABILITY, FLEXIBILITY, TESTABILITY, PORTABILITY, REUSABILITY,INTEROPERABILITY)
1. Number of references to system 8. Is temporary storage shared withlibrary routines, utilities or other other modules? MO.2(7)system provided facilities SS.l(1) 9. Does the module mix input, out-
2. Number of input/output actions put and processing functions inMI.1(2) same module? GE.2(l)
3. Number of calling sequence parametersMO.2(3) 10. Number of machine dependent
4. How many calling sequence parameters functions performed? GE.2(2)are control variables MO.2(3)
11. Is processing data volume limited? N5. Is input passed as calling sequence GE.2(3)
parameters MO.2(4) N 12. Is processing data value limite? Y NY GE.2 (4)
6. Is output passed back to calling 13. Is a common, standard subset ofmodule? MO.2(5) Y N programming language to be used? Y N
SS.l(2)7. Is control returned to calling Y N 14. Is the programming language
module MO.2(6) available in other machines? Y NMI.I(l)
V. EXPANDABILITY (FLEXIBILITY)
1. Is logical processing independent of storage specification? EX.l(l) Y N
2. Are accuracy, convergence, or timing attributes parametric? EX.2(l) Y N
3. Is module table driven? EX.2(2) Y N
VI. OPTIMIZATION (EFFICIENCY)
1. Are specific performance requirements (storage and routine) allocated to thismodule? EE.l ILLY NJ
45
M 6
METRIC WORKSHEET 2b SYSTEM NAME:
DESIGN/MODULE LEVEL MODULE NAME: Pg. 3
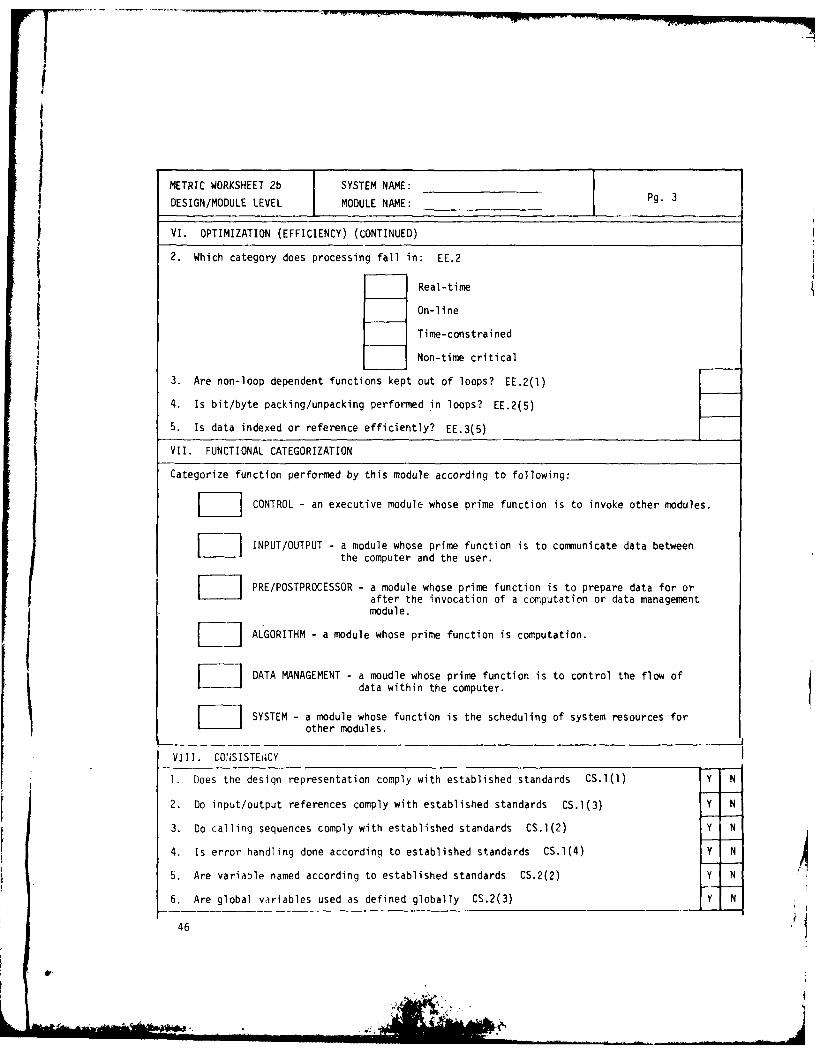
VI. OPTIMIZATION (EFFICIENCY) (CONTINUED)
2. Which category does processing fall in: EE.2
~ Real-time
On-line
Time-constrained
Non-time critical
3. Are non-loop dependent functions kept out of loops? EE.2(l)
4. Is bit/byte packing/unpacking performed in loops? EE.2(5)
5. Is data indexed or reference efficiently? EE.3(5)
VII. FUNCTIONAL CATEGORIZATION
Categorize function performed by this module according to following:
WCONTROL - an executive module whose prime function is to invoke other modules.
INPUT/OUTPUT - a module whose prime function is to communicate data betweenthe computer and the user.
F PRE/POSTPROCESSOR - a module whose prime function is to prepare data for orafter the invocation of a computation or data management
module.
W ALGORITHM - a module whose prime function is computation.
Z ] DATA MANAGEMENT - a moudle whose prime function is to control the flow ofdata within the computer.
[ SYSTEM - a module whose function is the scheduling of system resources forother modules.
VIII. CONSISTENCY
1. Does the design representation comply with established standards CS.1(1) Y N
2. Do input/output references comply with established standards CS.l(3) Y N
3. Do calling sequences comply with established standards CS.I(2) Y N
4. Is error handling done according to established standards CS.l(4) Y N
5. Are variable named according to established standards CS.2(2) Y N
6. Are global variables used as defined globally CS.2(3) Y N
46-pI
- .,.,'

METRIC WORKSHEET 2b SYSTEM NAME: Pa._______4_
'.ESIGN/MODULE LEVEL MODULE NAME:P.4
IX. INSPECTOR'S COMMENTS
Make any specific or general commnents about the quality observed while applying this
'1 checklist?
47

METRIC WORKSHEET 3 SYSTEM NAME: DATE:
SOURCE CODE/MODULE LEVEL MODULE NAME: INSPECTOR;
I. STRUCTURE (RELIABILITY, MAINTAINABILITY, TESTABILITY)
1. Number of lines of code M0.2(2) 11. Nuner of sub-decision pointsSI.3
2. Number of lines excluding comments 12. Number of conditional branchesSI.4(2) (computed go to) SI.4(8)
3. Number of machine level language 13. Number of unconditional branchesstatements SD.3(1) (GOTO, ESCAPE) SI.4(9)
4. Number of declarative statements 14. Number of loops (WHILE, DO)SI.4 SI.4(3)
5. Number of data manipulation state- 15. Number of loops with jumps out ofments SI.4 loop SI.4(3)
6. Number of statement labels 5 .4(6) 16. Number of loop indicies that are(Do not count format statements) modified SI.4(4)
7. Number of entrances into module 17. Number of constructs that performSI.I(5) module modification (SWITCH,
8. Number of exits from module ALTER) SI.4(5)SI,1(5) 18. Number of negative or complicated
9. Maximum nesting level SI.4(7) compound boolean expressionsSI. (2)
10. Number of decision points 19. Is a structured language use Y N10. umbe of ecison pintsSI.2(IF, WHILE, REPEAT, DO, CASE) SI.3 20. Is flow top to bottom (are there Y N
any backward branching GOTOs)sI. 4 (_----
II. CONCISENESS (MAINTAINABILITY) - SEE SUPPLEMENT
1. Number of operators CO.l 3. Number of Operands CO.1
2. Number of unique operators CO.l 4. Number of unique operands CO.1
III. SELF-DESCRIPTIVENESS (MAINTAINABILITY, FLEXIBILITY, TESTABILITY, PORTABILITY, REUSPBILITY)
1. Number of lines of comments SD.l 7. Are non-standard HOL statements
2. Number of non-blank lines of comments commented? SD.2(5)
SD.13. Are there prologue comments provided 8. How many declared variables are
containing information about the not described by comments?function, author, version number, -S.2(6)date, inputs, outputs, assumptions V Nand limitations? 9. Are variable names (mnemonics)
4. Is there a comment which indicates descriptive of the physical orwhat itemized requirement is functional property theysatisfied by this module? SD.2(l) represent? SD.3(2)
10. Do the comments do more than5. How many decision points and trans- repeat the operation? SD.2(7)
fers of control are not commented? Y NSD. 2( 3)
11. Is the code logically blocked and6. Is all machine language code com- indented? SD.3(3)
mented? SD.2(4) Y N
12. Number of lines with more thanI statement. SD.3(4)
13. Number of continuation line48 SO.3t4)
&11i Mit

METRIC WORKSHEET 3 SYSTEM NAME:
SOURCE CODE YMODULE LEVEL MODULE NAME: Pg. 2
IV. INPUT/OUTPUT (RELIABILITY, FLEXIBILITY, PORTABILITY)
1. Number of input statements MI.l(2) 4. Are inputs range-tested (forinputs via calling sequences,
2. Number of output statements MI.l(2) global data, and input
statements) ET.2(2)3. Is amount of input that can be 5. Are possible conflicts or illegal
handled parametric? GE.2(3) combinations in inputs checked?ET.2(3) N
6. Is there a check to determine ifall data is available prior to
processing? ET.2(5)Y _N
V. REFERENCES (RELIABILITY, MAINTAINABILITY. TESTABILITY. FLEXVILITY. PORTABILITY, REUSABILITY)
1. Number of calls to other modules 6. How many parameters passed to orMO.2(l.) from other modules are not defined
2. Number of references to system in this module? M0.2(3)library routines, utilities, orother system provided functions 7 Is
SS.1(1) 7. Is input data pacsed as parameter?3. Number of calling sequence parameters MD.2(4)
M0.2(3)4. How many elements in calling 8 Ip
sequences are not parameters? li . moul e back toM0.2(3)calnmoue M.()_J_
5. How many of the calling parameters(input) are control variables? . Icontrol returned to calling YN
D module? M0.2(6)
VI. DATA (CORRECTNESS, RELIABILITY, MAINTAINABILITY, TESTABILITY)
1. Number of local variables SI.4(lO) 4. How many global variables are notused consistently with respect to
2. Number of global variables SI.4(lO) units or type? CS.2(4)
3. Number of global variables renamed 5. How many variables are used for
SE.I(3) more than one purpose? CS.2(3)
VII. ERROR HANDLING - (RELIABILITY) VIII. (EFFICIENCY)
1. How many loop and multiple transfer 1. Number of mix mode expressions?index parameters are not range EE.3(3)tested before use? ET.3(2) 2. How many variables are initialized
when declared? EE.3(2)2. Are subscript values range tested 3. How many loops have non-loop
before use? ET.3(3) dependent statements in them?EE.20)
Y N 4. How many loops have bit/byte3. When an error condition occurs, is it packing/unpacking? EE.2(5)
passed to the calling module? ET.I(3) Y NSE.(6)
4. Are the results of a computation 5. How many compound expressionschecked before outputting or before defined more than once? EE.2(3)processing continues? ET.3(4) Y N 49
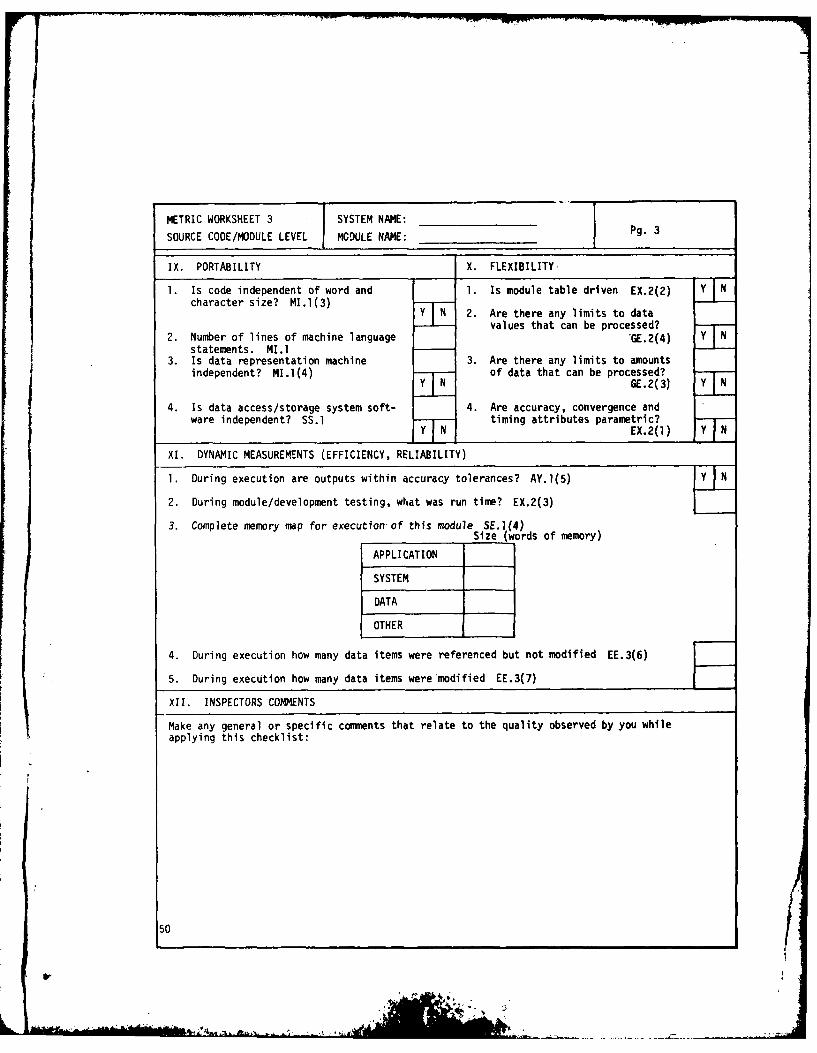
METRIC WORKSHEET 3 SYSTEM NAME:
SOURCE COE/MODULE LEVEL MGDULE NAME: Pg. 3
IX. PORTABILITY X. FLEXIBILITY.
1. Is code independent of word and 1 . Is module table driven EX.2(2) Y N
character size? MI.l(3) V- N 2. Are there any limits to data
Ivalues that can be processed?2. Number of lines of machine language "GE.2(4)
statements. MI.]3. Is data representation machine 3. Are there any limits to amounts
independent? MI.1(4) of data that can be processed?indeendnt? I.14) Yl NGE.2(3) Y H N
4. Is data access/storage system soft- 4. Are accuracy, convergence andware independent? SS.1 - timing attributes parametric? N
XI. DYNAMIC MEASUREMENTS (EFFICIENCY, RELIABILITY)
1. During execution are outputs within accuracy tolerances? AY.1(5) Y
2. During module/development testing, what was run time? EX.2(3)
3. Complete memory map for execution of this module SE.1.(4)Size (words of memory)
APPLICATION
SYSTEM
DATA
OTHER
4. During execution how many data items were referenced but not modified EE.3(6)
5. During execution how many data items were modified EE.3(7)
XII. INSPECTORS COMMENTS
Make any general or specific comments that relate to the quality observed by you whileapplying this checklist:
50
3.4 TECHNIQUES FOR APPLYING MEASUREMENTS
Section 1.5 identified organizational approaches for utilizing the quality
metric concepts during a software development. These approaches included
both acquisition environments and internal development environments. The
purpose of this section is to describe, at a lower level, how the metrics
would be applied in either case.
The first technique for applying the metrics is by formal inspection. The
formal inspection is performed by personnel of an organization independent
of the development organization.(the acquisition office, an independent quality
assurance group, or an independent contractor). The metric worksheets are
applied to delivered products at scheduled times and the results are formally
reported.
The second technique is to utilize the worksheets during structured design
and code walkthroughs held by the development team. A specific participant
of the walkthrough can be designated for applying the worksheets and report-
ing any deficiencies during the walkthrough or a representative of the
quality assurance organization can participate in the walkthrough with the
purpose of taking the measurements of the design or code.
The last technique is for the development team to utilize the worksheets as
guidelines, self-evaluations or in a peer review mode to enhance the qualtiy
of the products they produce.
51

_ 7
SECTION 4
PROCEDURES FOR ASSESSING THE QUALITY OF THE SOFTWARE PRODUCT
4.1 INTRODUCTION
The benefits of applying the software quality metrics are realized when the
information gained from their application is analyzed, The analyses that can
be done based on the metric data are described in the subsequent paragraphs.
There are three levels at which analyses can be performed. These levels are
related to the level of detail to which the quality assurance organization
wishes to go in order to arrive at a quality assessment.
4.2 INSPECTOR'S ASSESSMENT
The first level at which an assessment can be made relies on the discipline
and consistency introduced by the application of the worksheets. An inspec-
tor, using the worksheets, asks the same questions and takes the same counts for
each module's source code or design document,etc. that is reviewed. Based on
this consistent evaluation, a subjective comparison of products can be made.
la. Vocmeu.t Zspecto4'4 A6e6,6ment
The last section in each worksheet is a space for the inspec-
tor to make comments on the quality observed while applying the
worksheet. Comments should indicate an overall assessment as well
as point out particular problem areas such as lack of comments,
inefficiencies in implementation, or overly complex control flow.
lb. Compite se. 6ment6 So-% SyAtem Reuiew
By compiling all of the inspector's assessments on the various
documents and source code available at any time during the develop-
ment, deficiencies can be identified.
4.3 SENSITIVITY ANALYSISThe second level of detail utilizes experience gained through the applicationof metrics and the accumulation of historical information to take advantage
of the quantitative nature of the metrics. The values of the measurements
are used as indicators for evaluation of the progress toward a high quality
product.
52
'Ii.

At appropriate times during a large-scale development, the application of
the worksheets allows calculation of the metrics. The correspondence of the
worksheets to the metrics is shown in Appendix B of [MCCA79]. The results ofthese calculations is a matrix of measurements. The metrics that have been
established to date are at two levels-system level and module level. Theapproach to be described is applicable to both levels and will be describedin relationship to the module level metric.
A n by k matrix of measurements results from the application of the metrics to
the existing products of the development (e.g., at design, the products might
include review material, design specifications, test plans, etc.) where there
are k modules and n module level measurements applicable at this particular time.
r n l . . . mlkl
= m2l
Lmnl •mnkj
This matrix represents a profile of all of the modules in the system with
respect to a number of characteristics measured by the metrics. The analyses
that can be performed are described in the following steps:
2a. AMaeh Vajiation o Mea6uAement6
Each row in the above matrix represents how each module in the
system scored with respect to a particular metric. By summing allthe values and calculating the average and standard deviation for
that metric, each individual module's score can then be compared
with the average and standard deviation. Those modules that
score less than one standard deviation from the average should be
identified for further examination. These calculations are
illustrated below:
k
for metric i; Average Score = Ai = I M ij /k
J-- k 2Standard Deviation = 1 = a (M -A )2 /k
Report Module j if Mij < AI - i
53
M,"

2b. A.6eAA Low Sy6.tem Scou.A
In examining a particular measure across all modules, consistentlylow scores may exist. It may be that a design or implementationtechnique used widely by the development team was the cause. This
situation identifies the need for a new standard or stricter
enforcement of existing standards to improve the overall develop-ment effort.
2c. A6eA.6 Sco4 e Aggait T1ARhoZt&
As experience is gained with the metrics and data is accumulated,threshold values or industry acceptable limits may be established.
The scores, for each module for a particular metric should be com-
pared with the established threshold. A simple example is thepercent of comments per line of source code. Certainly code
which exhibits only one or two percent measurements for thismetric would be identified for corrective action. It may be
that ten percent Is a minimum acceptable level. Another example
is the complexity measure. A specific value of the complexity
measure greater than some chosen value should be identified forcorrective action
Report Module j if Mij <Ti (or >T for complexitymeasures)
Where Ti = threshold value
specified for metric i.
4.4 USE OF NORMALIZATION FUNCTION TO ASSESS QUALITY
The last level of assessing Quality is using the normalization functions to
predict the quality in guantitative terms. The normalization functions
are utilized in the following manner.
For a particular time there is an associated matrix of coefficients which
represent the results of linear multivariate regression analyses against
empirical data (past software developments). These coefficients, when
multiplied by the measurement matrix results in an evaluation (prediction)
54
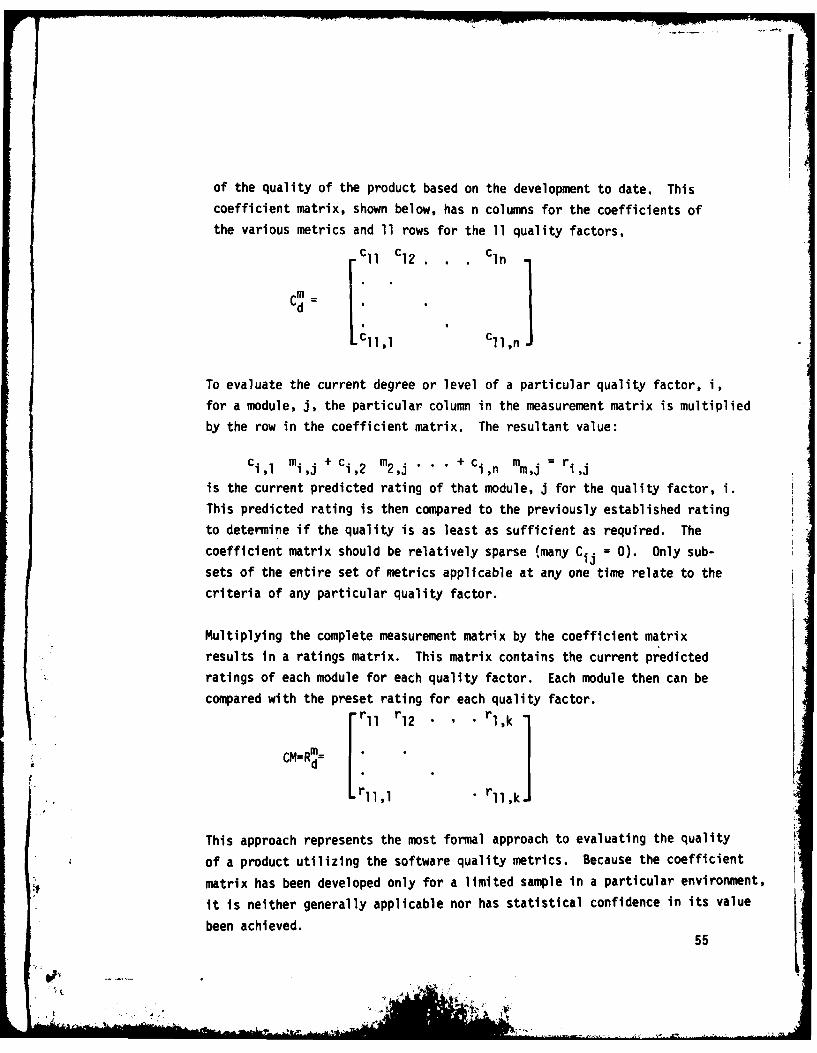
of the quality of the product based on the development to date. This
coefficient matrix, shown below, has n columns for the coefficients of
the various metrics and 11 rows for the 11 quality factors.
c11 c12 . . . cln
d = . .
To evaluate the current degree or level of a particular quality factor, i,
for a module, j, the particular column in the measurement matrix is multiplied
by the row in the coefficient matrix. The resultant value:
Cill m ij + ci,2 m2,j Ci,n mm,j 2 ri,j
is the current predicted rating of that module, j for the quality factor, i.
This predicted rating is then compared to the previously established rating
to determine if the quality is as least as sufficient as required. The
coefficient matrix should be relatively sparse (many Cij = 0). Only sub-
sets of the entire set of metrics applicable at any one time relate to the
criteria of any particular quality factor.
Multiplying the complete measurement matrix by the coefficient matrix
results in a ratings matrix. This matrix contains the current predicted
ratings of each module for each quality factor. Each module then can be
compared with the preset rating for each quality factor.r11 r12 r
CMR_
-r lll r 11,kJ
This approach represents the most formal approach to evaluating the quality
of a product utilizing the software quality metrics. Because the coefficient
matrix has been developed only for a limited sample in a particular environment,
it is neither generally applicable nor has statistical confidence in its value
been achieved.55
k.;- ,., . ... ... . ... . V :
' : " :, :" ':':I!!
! II '" . ....... ..... . . .. .. . : - . .. .j
To use the normalization functions that currently exist the following steps
should be performed.
3a. Appty Noma&zatovn Function
Table 4.4-1 contains the normalization functions that currently
exist. If any of the quality factors identified in that table
have been specified as a requirement of the development, then the
metrics identified in the table should be substituted into the
equation and the predicted rating calculated. Normalization
functions which include several metrics can be used if available,
otherwise functions for individual metrics should be used. This
predicted rating should be compared with the specified rating.
To illustrate the procedure the normalization function that has
been developed for the factor Flexibility will be used. The
normalization function, applicable during the design phase,
relates measures of modular implementation to the flexibility of
the software. The predicted rating of flexibility is in terms
of the average time to implement a change in specifications. The
normalization function is shown in Figure 4.4-1. The measurements
associated with the modular implementation metric are taken from
design documents. The measurements involve identifying if input,
output and processing functions are mixed in the same module, if
application and machine-dependent functions are mixed in the same
module and if processing is data volume limited. As an example,
assume the measurements were applied during the design phase and a
value of 0.65 was measured. Inserting this value in the normalization
function results in a predicted rating for flexibility of .33 as
identified by point A in Figure 4.4-l. If the Acquisition Manager
had specified a rating of 0.2 which is identified by point B, he
has an indication that the software development is progressing well
with respect to this desired quality.
An organization using this manual is encouraged to establish these
1functions in its specific environment by following the procedures
described in [MCCA77] and [tCCA79].
56
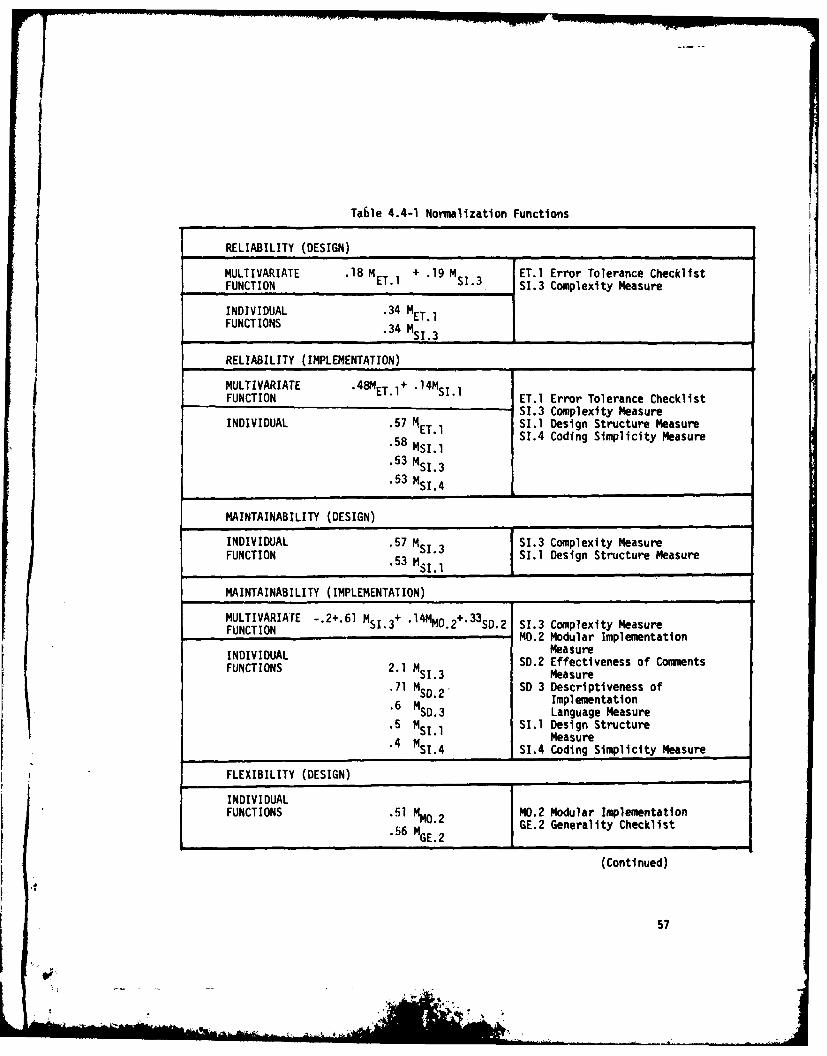
Table 4.4-1 Normalization Functions
RELIABILITY_(DESIGN) __________________
MULTI VARIATE .18 M ET1+ .19 M SI3 ET.1 Error Tolerance ChecklistFUNCTION ETlS13 I.3 Complexity Measure
INDIVIDUAL .34 M ET.1FUNCTIONS .34 M SI3 JRELIABILITY (IMPLEMENTATION)
MULTIVARIATE .48MET.1+ .14M 5i1 E. ro oeac hclsFUNCTION E. ro oeac hcls
S1.3 Complexity MeasureINDIVIDUAL .57 N 51. S.1 Design Structure Measure
.58 TS.l SI.4 Coding Simplicity Measure.58 M SI.l.53 MS.
MAINTAINABILITY (DESIGN)
INDIVIDUAL .57 M SI3 SI.3 Complexity MeasureFUNCTION .53 MS1.1 IS1.1 Design Structure MeasureMAINTAINABILITY (IMPLEMENTATION) _________________
MULTIVARIArE -.2+.61 M5 SI.+ 1'MMO.2+ 33 SD .2 S1.3 Complexity MeasureFUNCTION NO.2 Modular Implementation
INDIVDUALMeasureIUNIIDUAL1 SD.2 Effectiveness of Comments
FUNCION 2. SM5 3 Measure.71 MS."SD 3 Descriptiveness of.6 M Implementation. NSD. 3 Language Measure
.5 Ms. S1.1 Design Structure
.4 m S1.1I. MeasureSI.4SI.4Coding Simplicity Measure
FLEXIBILITY (DESIGN) __________________
INDIVIDUALFUNCTIONS .51 NMO.2 MO.2 Modular Implementation
.56 MGE.2 GE.2 Generality Checklist
(Continued)
57
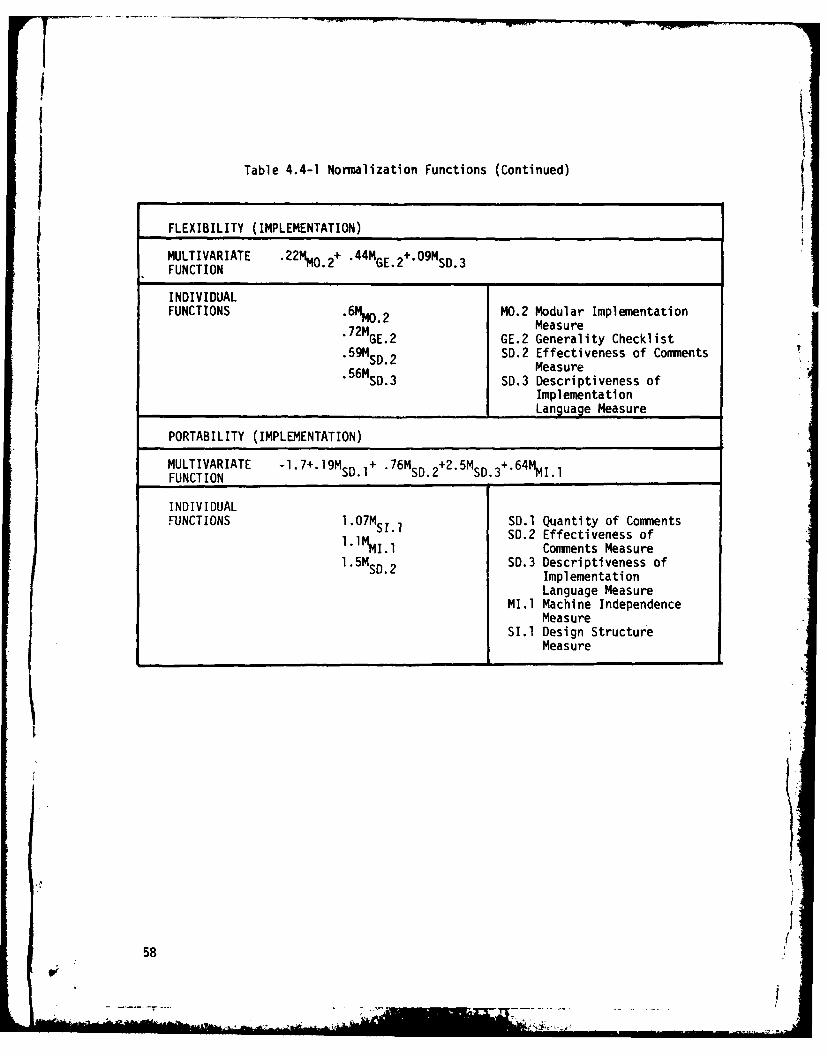
Table 4.4-1 Normalization Functions (Continued)
FLEXIBILITY (IMPLEMENTATION)
MULTIVARIATE .22MMO.2+ .44M GE2+.09MSD.3
FUNCTION
INDIVIDUALFUNCTIONS .MO2MO.2 Modular Implementationf. 2 GE.2 GE.2 Generality Checklist
.5MSD.2 SD.2 Effectiveness of Comments.56MSD Measure
SD.3 SD.3 Descriptiveness ofImplementationLanguage Measure
MULTIVARIATE -1.7+.19M SD.1+ .7MSD.2 + .5MS. .4M.
FUNCIONS1.0M S11 0.1 Quantity of Commients1.1 SD.2 Effectiveness of
lMrI. Commients Measure1.5M SD.2 S0.3 Descriptiveness of
ImplementationLanguage Measure
141.1 Machine IndependenceMeasure
S1.1 Design StructureMeasure
58
owa
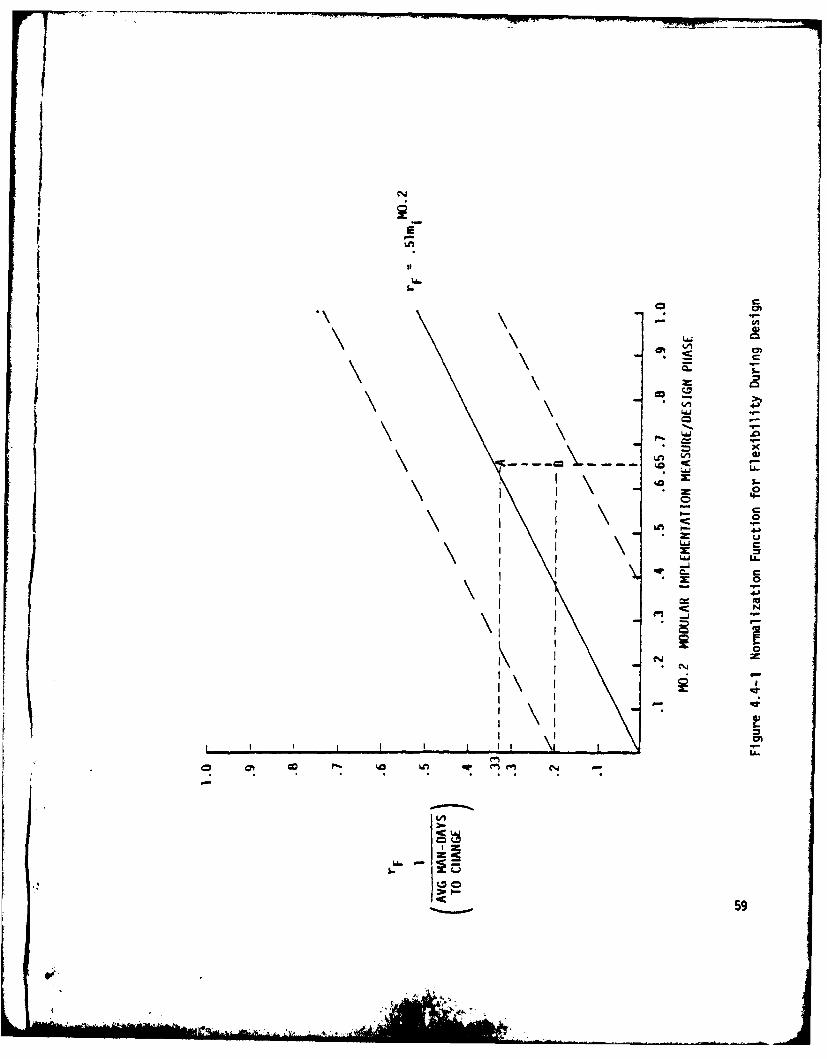
ILNc
UUON'
II i
66x
I I-
59
z L

3b. CatcuLate Confidence in Quatity Ase6,ment
Using statistical techniques a level of confidence can be
calculated. The calculation is based on the standard error of
estimate for the normalization function (given in Table 3.3.3-2,
Vol. I) and can be derived from a normal curve table found in most
statistics texts. An example of the devivation process is shown
in Figure 4.4-2 for the situation described above. Here it is
shown that the Acquisition Manager has an 86 percent level of
confidence that the flexibility of the system will be better than
the specified rating.
MEAN = .33
(SPECIFIED -RATING) .2
MEAN - .33 (PREDICTED RATING,STANDARD DEVIATION x .12 (STANDARD ERROR OF EST1MATE)
LEVEL OF CONFIDENCE z Pr {X ~2-2 .86 (SHADED AREA)
Figure 4.4-2 Determination of Level of Confidence
60
*.A't

4,5 REPORTING ASSESSMENT RESULTS
Each of the preceeding steps described in this section are easily automated.
If the metrics are applied automatically then the metric data is available in
machine readable form. If the worksheets are applied manually, then the
data can be entered into a file, used to calculate the metric, and formatted
Into the measurement matrix format. The automation of the analyses involvesimple matrix manipulations'. The results of the analyses should be reportedat various levels of detail. The formats of the reports'are left to the
discretion of the quality assurance organization. The content of the
reports to the different managers is recommended in the following paragraphs.
l a. Repo'it .to the Aquiit-o Madnage'L/Veve~opmnt ManageA
The report content to the Acquisition Manager and the Develop-
ment manager sould provide summary information about the progressof the development toward the quality goals identified at the be
beginning of the project.
For example if ratings were specified for several quality factors,
the current predicted ratings should be reported.
PREDICTED RATINGQUALITY GOALS BASED ON DESIGN DECUMENT
RELIABILITY .9 .8
MAINTAINABILITY .8 .95
If specific ratings were not identified but the important qualities
were identified, a report might describe the percentage of modules
that currently are Judged to be below the average quality (as a
result of the sensitivity analysis) or that are below a specified
threshold value jas a result of the threshold analysis). These
statistics provide a progress status to the manager. Further
progress status Is indicated by reporting the quality growthof tfe systm or of Individual modules. The quality growth is
VIct4 L by r*portinq the &core% achieved during the various
w4 O © 0 t. 96-iwatte ytc the ratings should progresslvely
61
score higher than those received during requirements. This progress
is based on the identification of problems in the early phases
which can then be corrected.
lb. Repo't6 to Qualty A6wu~nce Ma=ne
In addition to the summary quality progress reports described
in la, the quality assurance manager and his staff will want
detailed metric reports. These reports will provide all of
the results of the Analyses described in 4.2, 4.3, and 4.4, and
perhaps provide the measurement matrix itself for examinations.
In addition to the detailed reports, the quality assurance manager
should be provided with reports on the status of the application of
the metrics themselves by the quality assurance staff. These
status reports will provide information on total number of modules
and the number which inspectors have analyzed.
lc. Repo't6 to the Devetopment Team
The development team should be provided detailed information on
an exception basis. This information is derived from the
analyses. Examples of the information would be quality problems
that have been identified. which characteristics or measurements
of the software products are poor, and which modules have been
identified as requiring rework. These exception reports should
contain the details of why the assessment revealed them as
potential problems. It is based onthis information that corrective
actions will be taken.
9.r
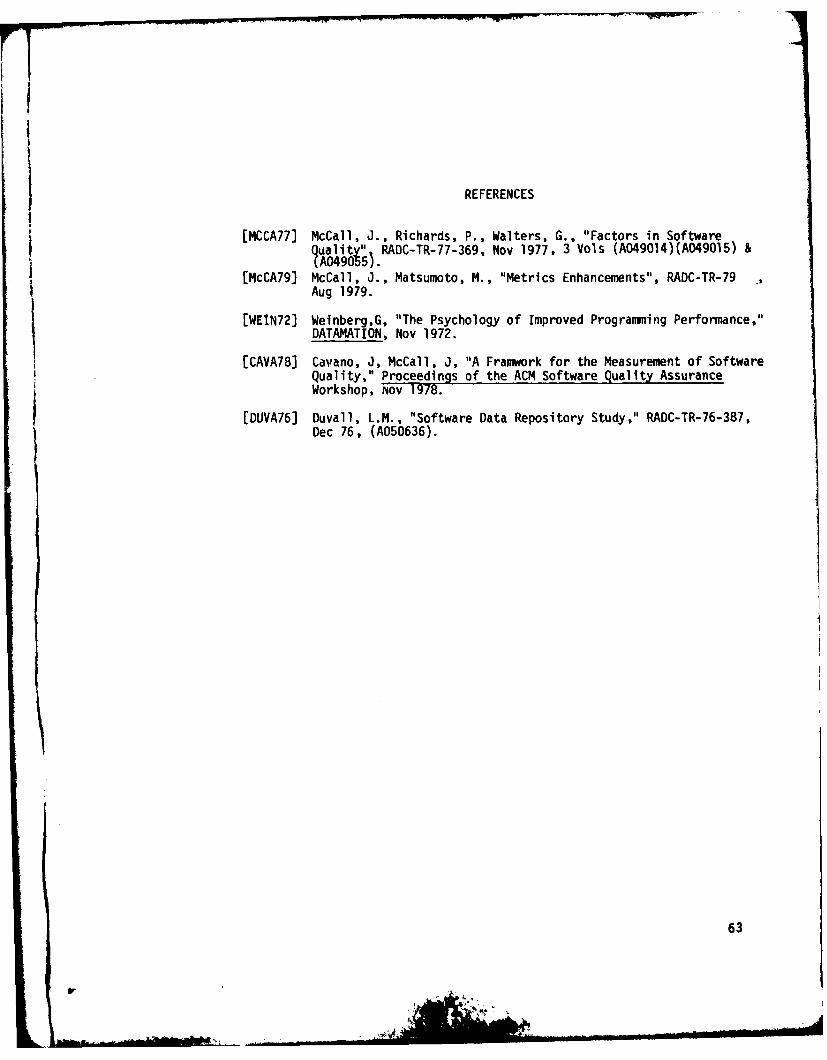
REFERENCES
[MCCA77) McCall, J., Richards, P., Walters, G. "Factors in Softwarecualit "RADC-TR-77-369, Nov 1977, 3 Vols (A049014)(A049015) &A04900 5 -
[tMcCA79) McCall, J., Matsumoto, M., "Metrics Enhancements", RADC-TR-79 *
Aug 1979.
[WE1N72) Weinberg,G, "The Psychology of Improved Programmning Performance,"DATAM'ATION, Nov 1972.
[CAVA78) Cai'ano, J, McCall, J, "A Framwork for the Measurement of SoftwareQuality " Proceedings of the ACM Software Quality AssuranceWorkshop, NOV 1978.i [DUVA76] Duvall, L.M., "Software Data Repository Study," RADC-TR-76-.387,Dec 76, (A050636).
63
Aw L1111