RADAR SYSTEMS
82
IV B.Tech I Sem ECE RADAR SYSTEMS
-
Upload
ankitjain160 -
Category
Documents
-
view
949 -
download
15
Transcript of RADAR SYSTEMS
IV B.Tech I Sem ECE
RADAR SYSTEMS
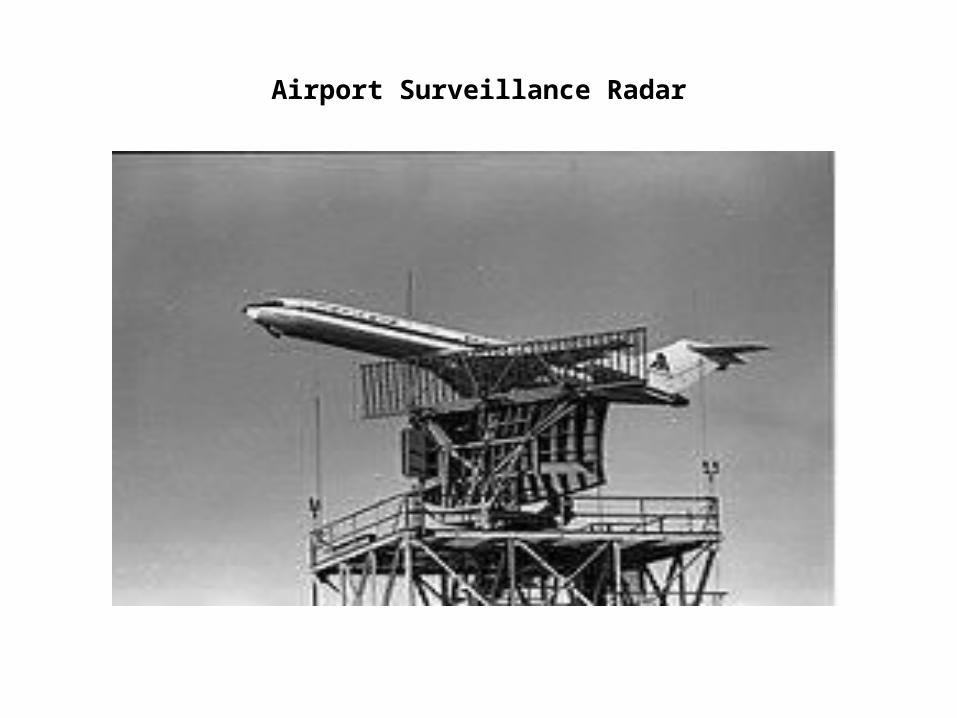
Airport Surveillance Radar
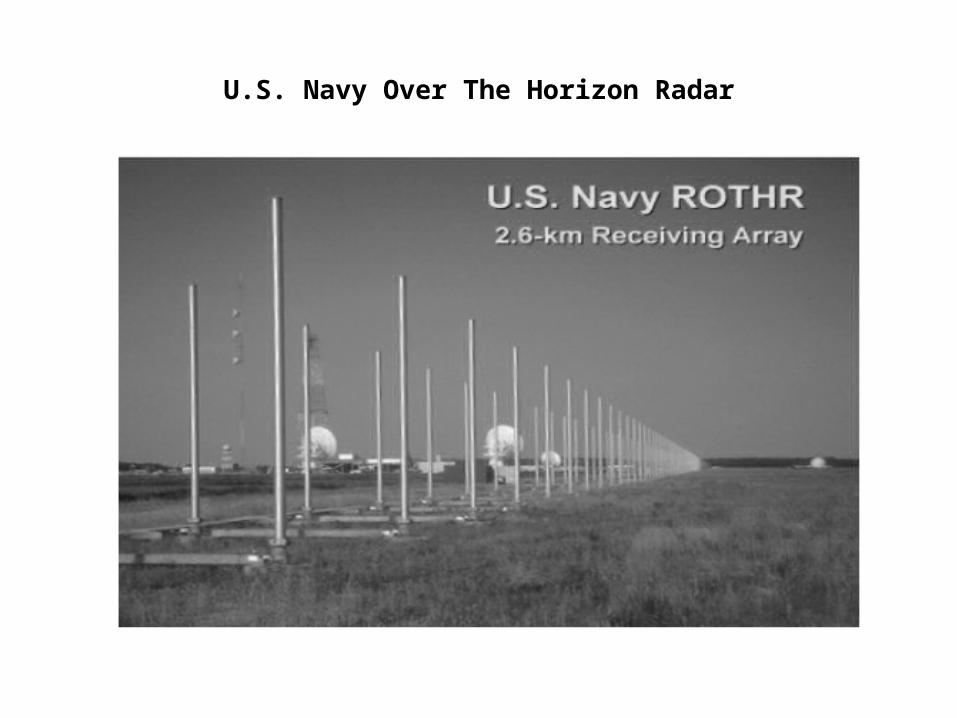
U.S. Navy Over The Horizon Radar

U.S. Air Force AWACS

Radar frequencies and the electromagnetic spectrum

Standard radar-frequency letter-band nomenclature

Basic Principle of Radar
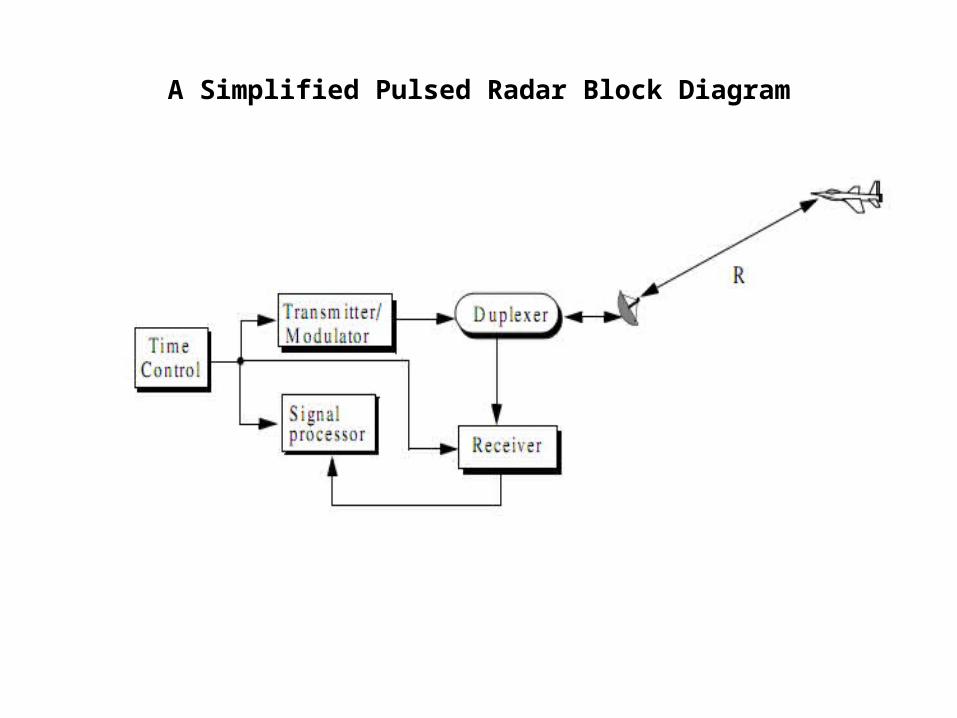
A Simplified Pulsed Radar Block Diagram

Fig. a) Train of transmitted and received pulses Fig. b) Illustrating range ambiguity
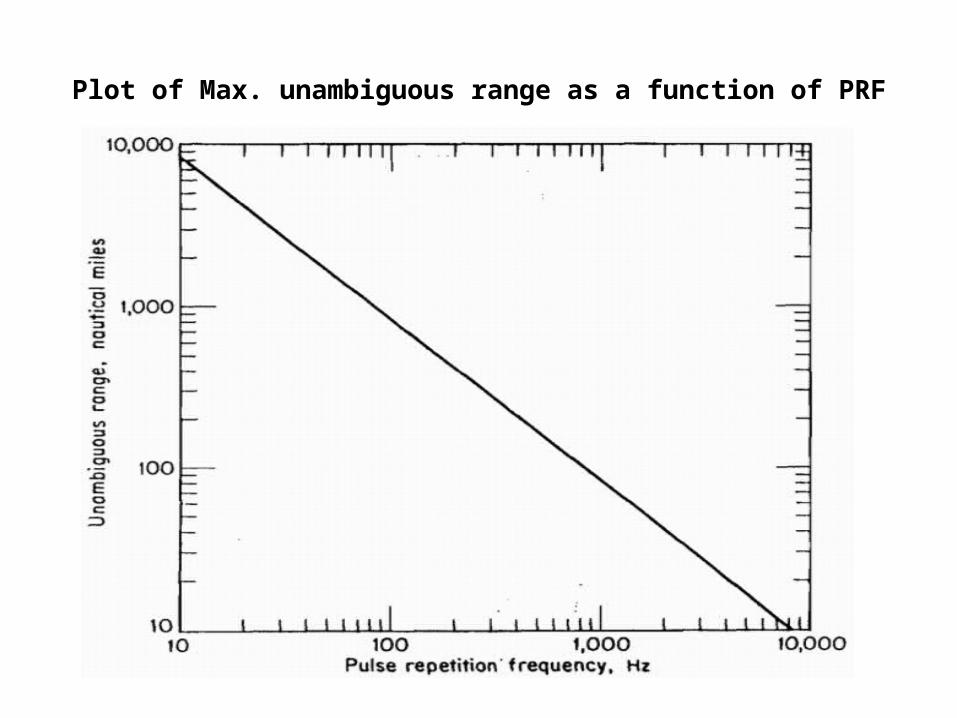
Plot of Max. unambiguous range as a function of PRF
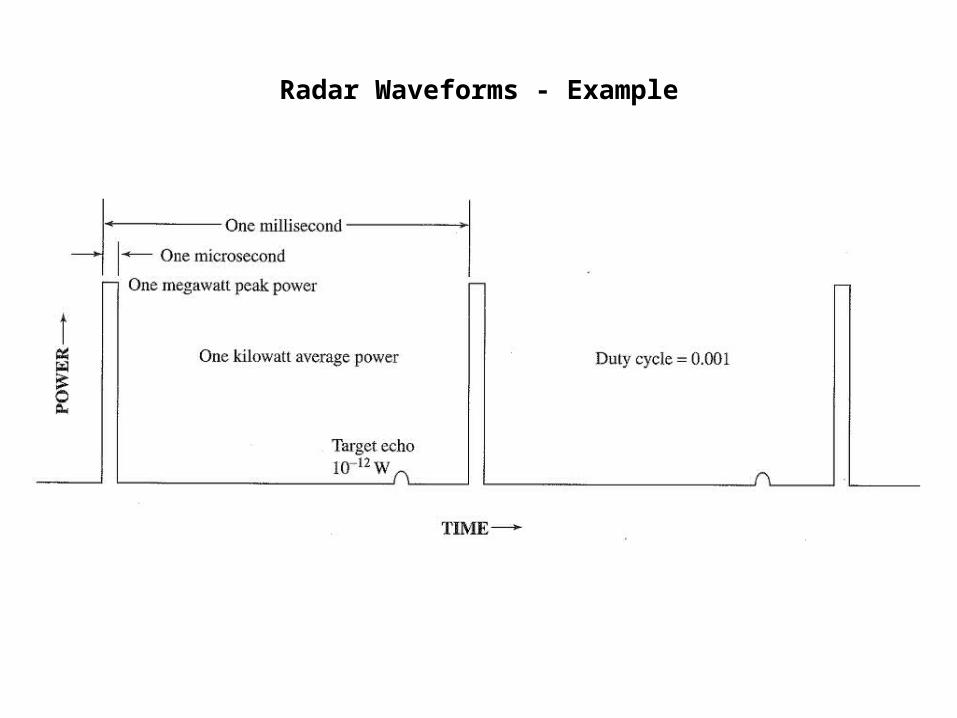
Radar Waveforms - Example
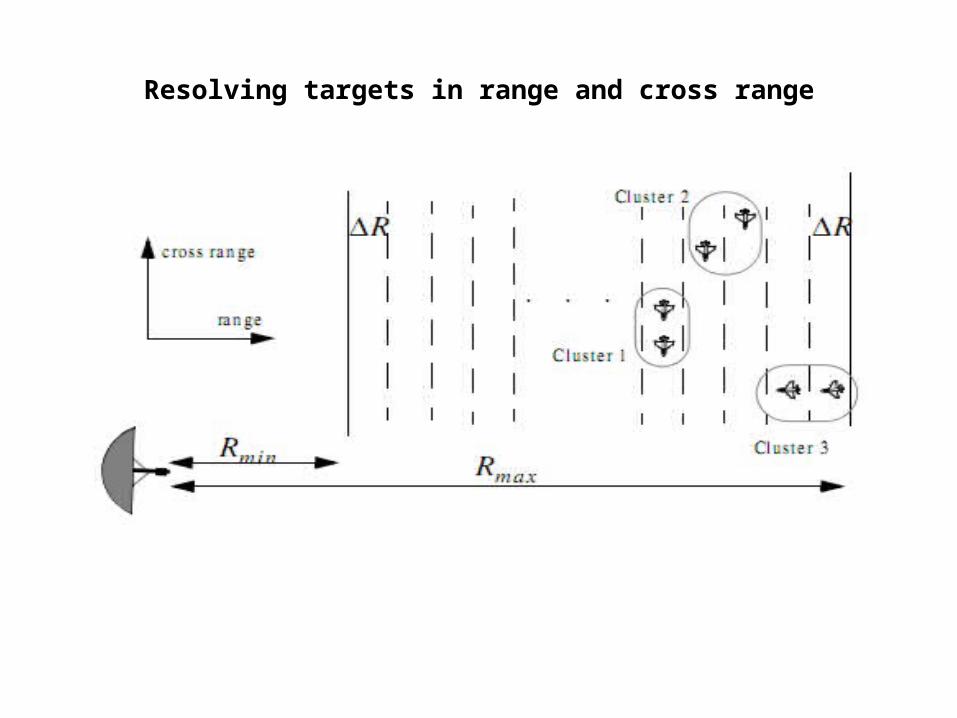
Resolving targets in range and cross range

Fig. a) Two unresolved targets Fig. b) Two resolved targets
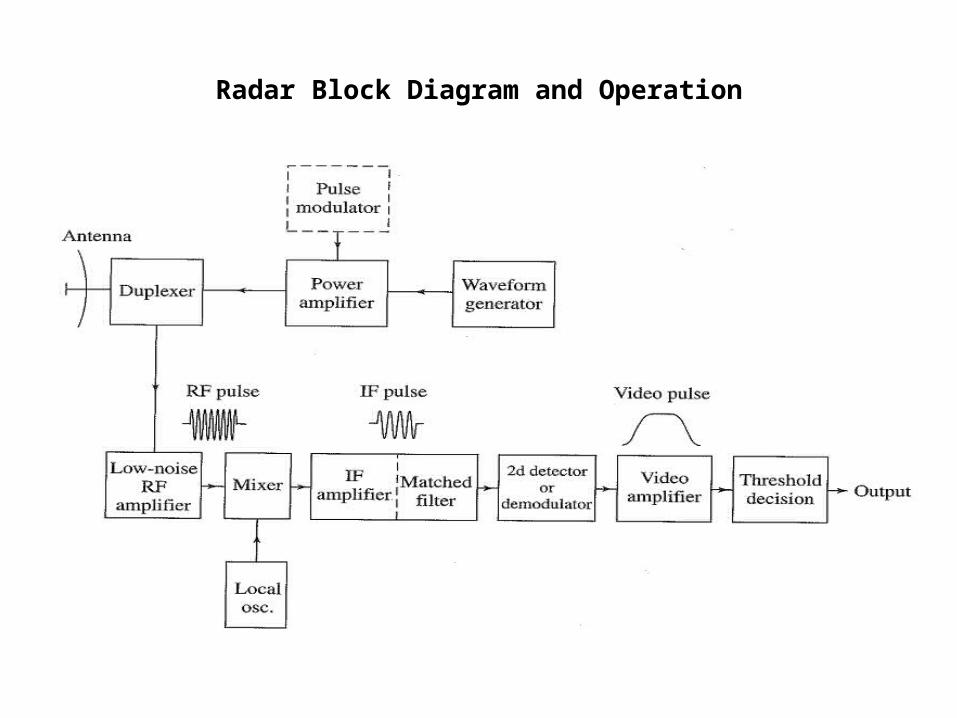
Radar Block Diagram and Operation

Fig. a) PPI presentation displaying range Vs angle (intensity modulation)Fig. b) A-Scope presentation displaying amplitude Vs range (deflection modulation)
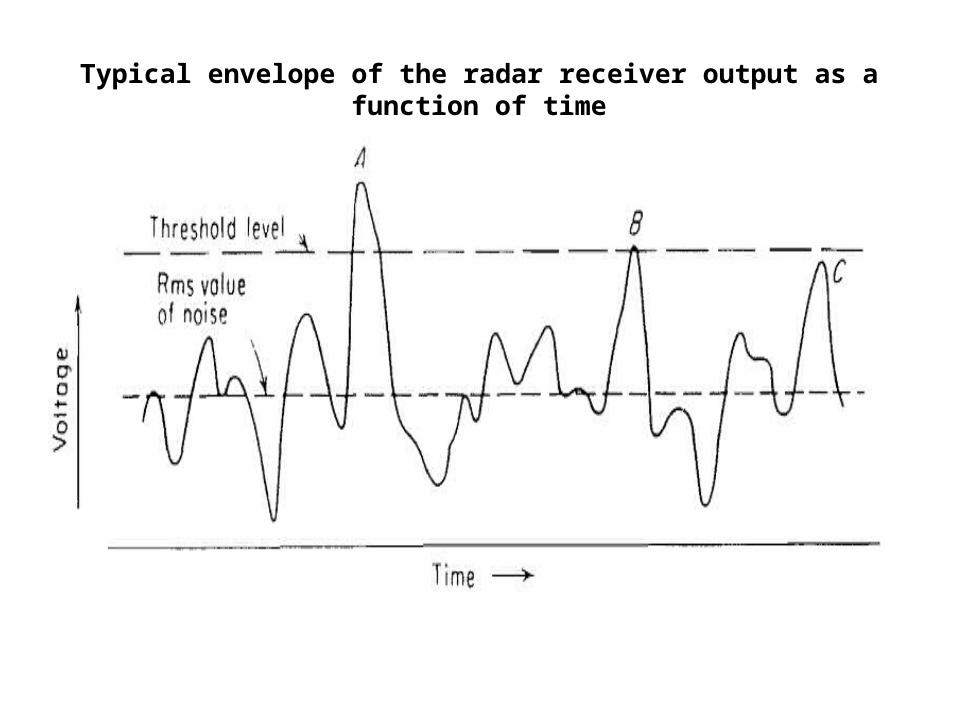
Typical envelope of the radar receiver output as a function of time

Examples of Probability Density Functions: a) Uniform b) Gaussian c) Rayleigh (Voltage) d) Rayleigh (Power)
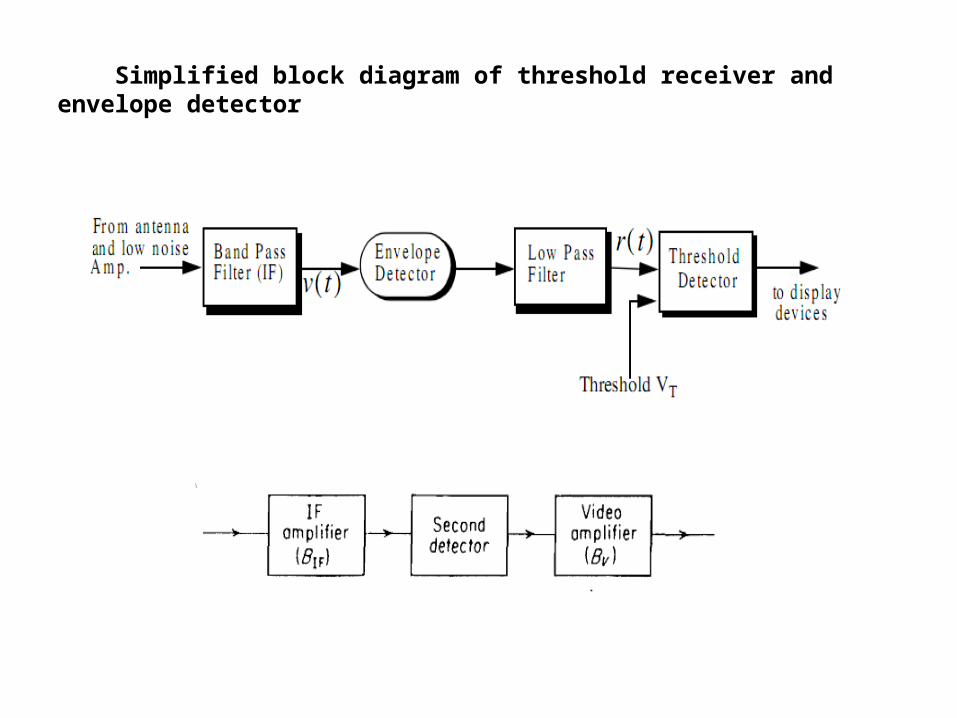
Simplified block diagram of threshold receiver and envelope detector
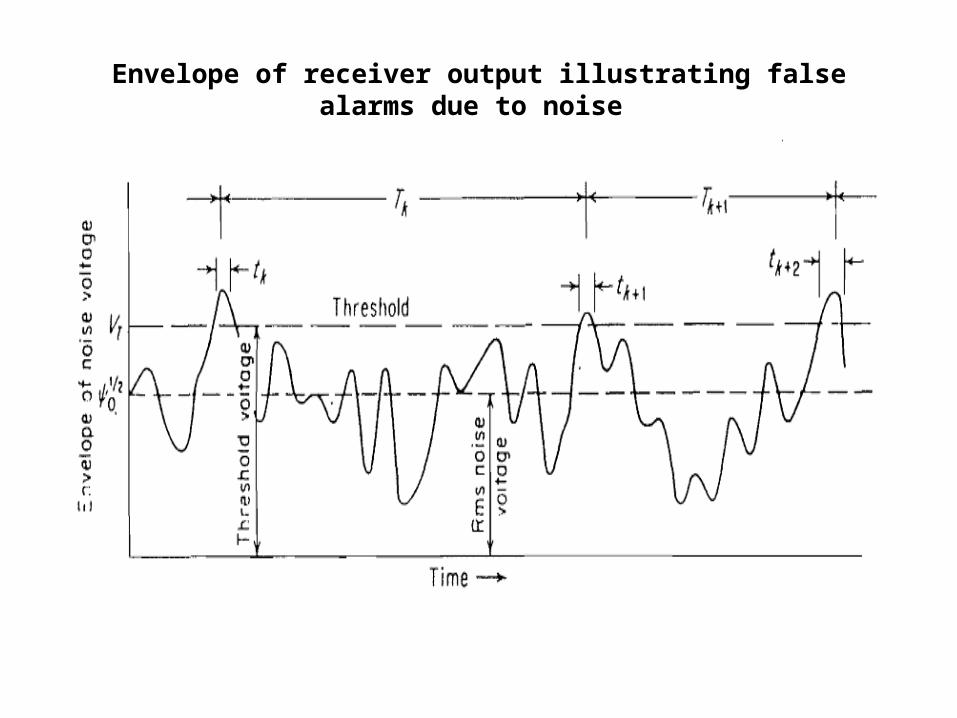
Envelope of receiver output illustrating false alarms due to noise
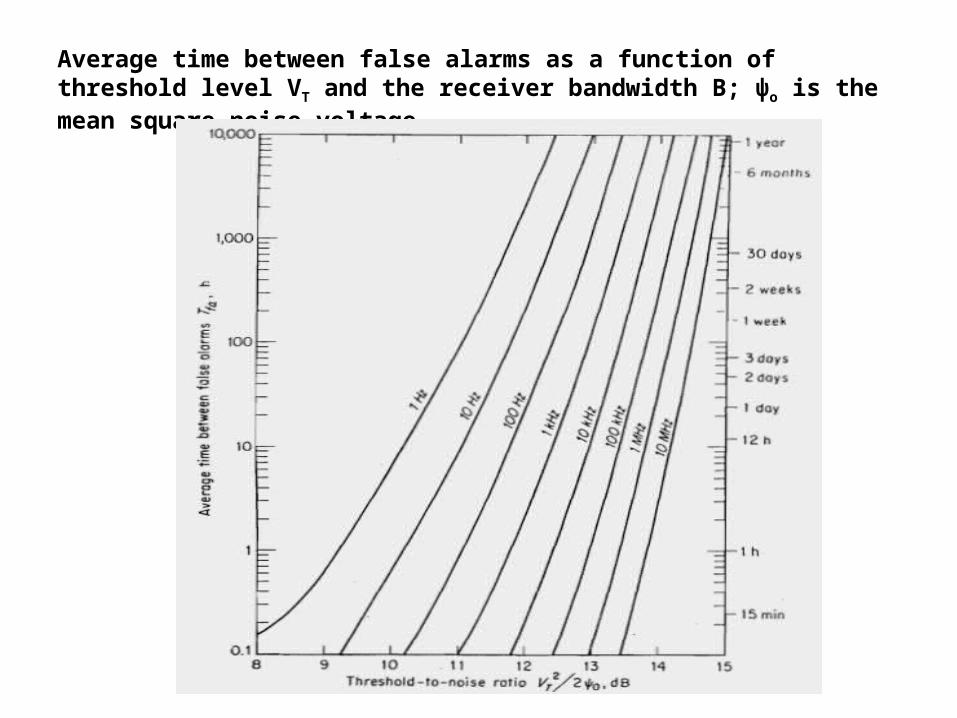
Average time between false alarms as a function of threshold level VT and the receiver bandwidth B; ψo is the mean square noise voltage
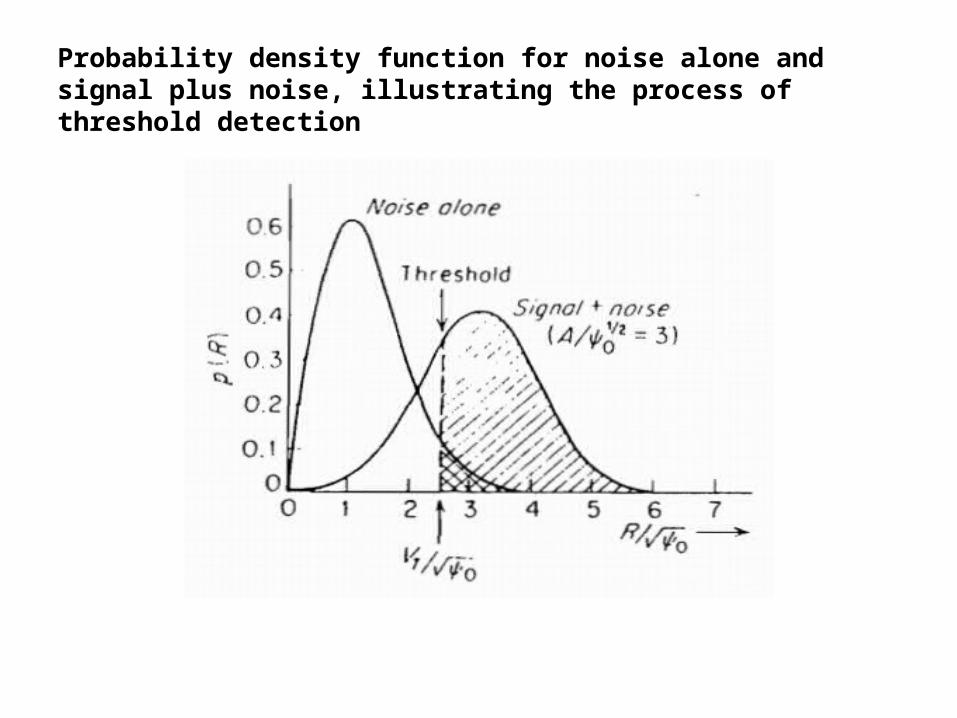
Probability density function for noise alone and signal plus noise, illustrating the process of threshold detection
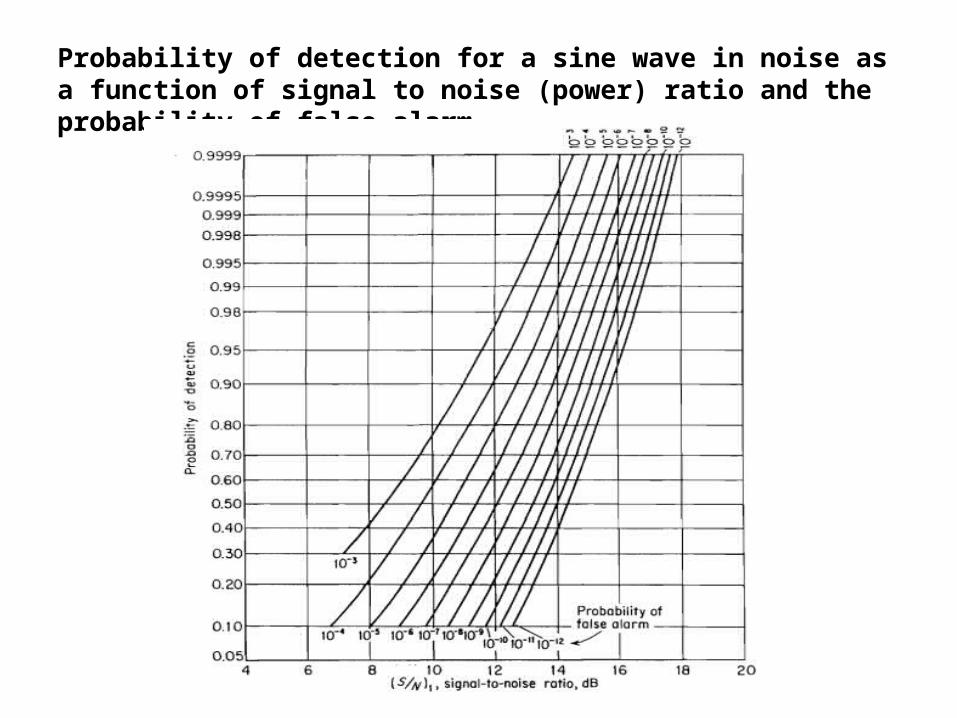
Probability of detection for a sine wave in noise as a function of signal to noise (power) ratio and the probability of false alarm
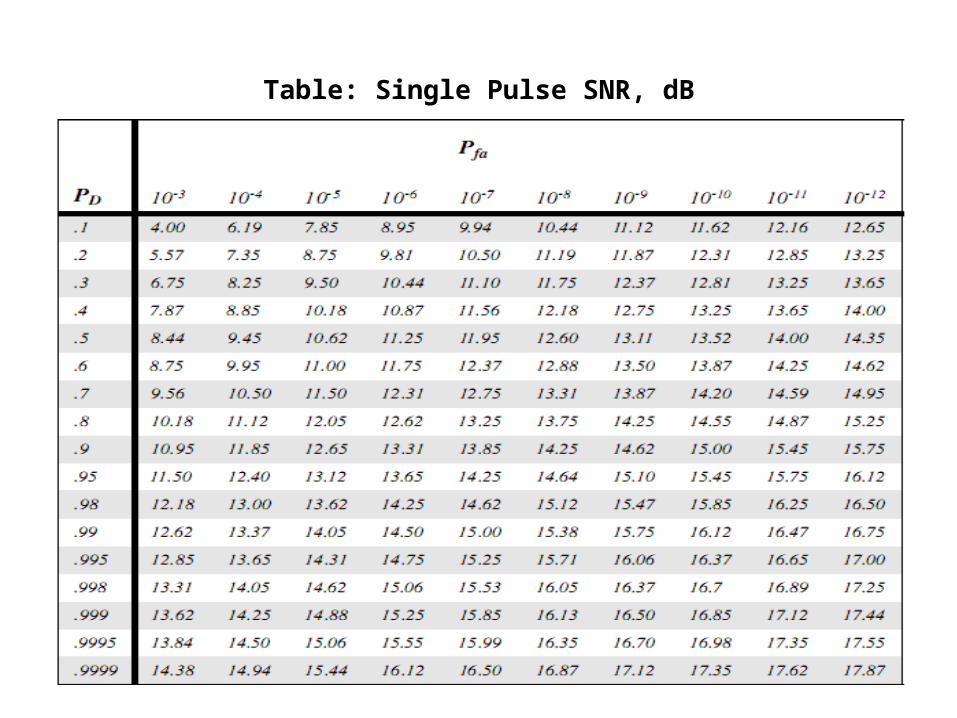
Table: Single Pulse SNR, dB
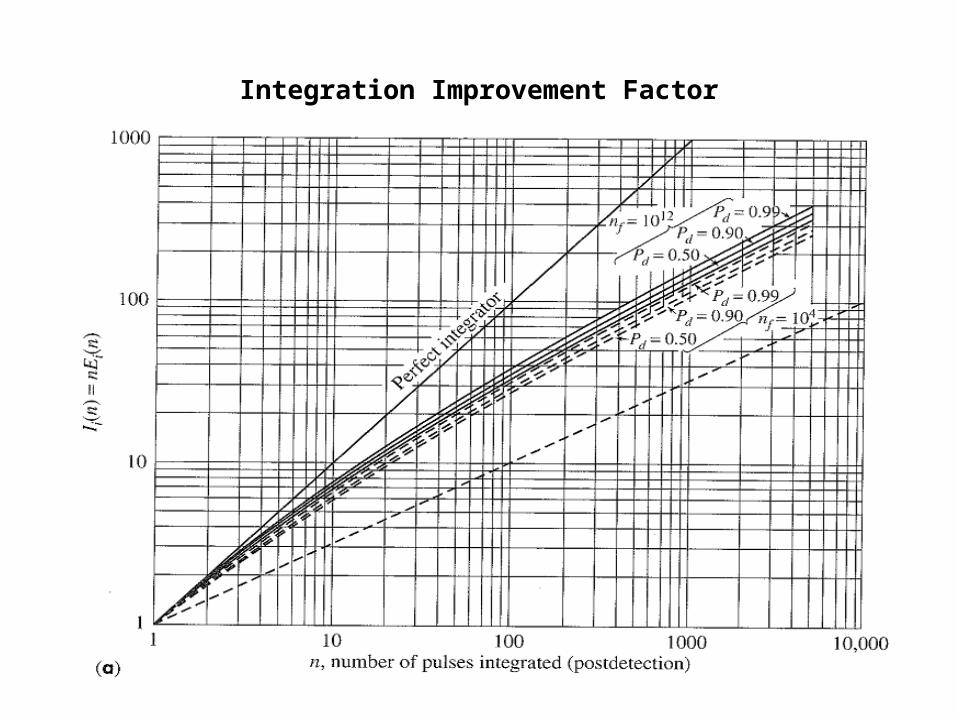
Integration Improvement Factor

Integration Loss as a function of ‘n’

Radar Cross Section of the sphere. a = radius; λ = wavelength
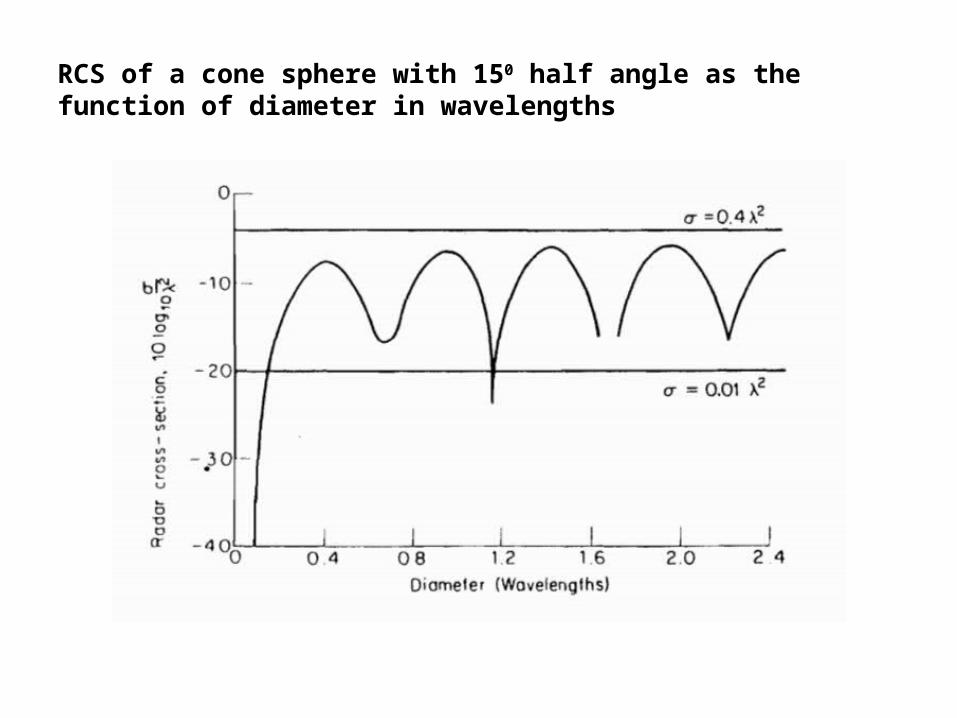
RCS of a cone sphere with 150 half angle as the function of diameter in wavelengths
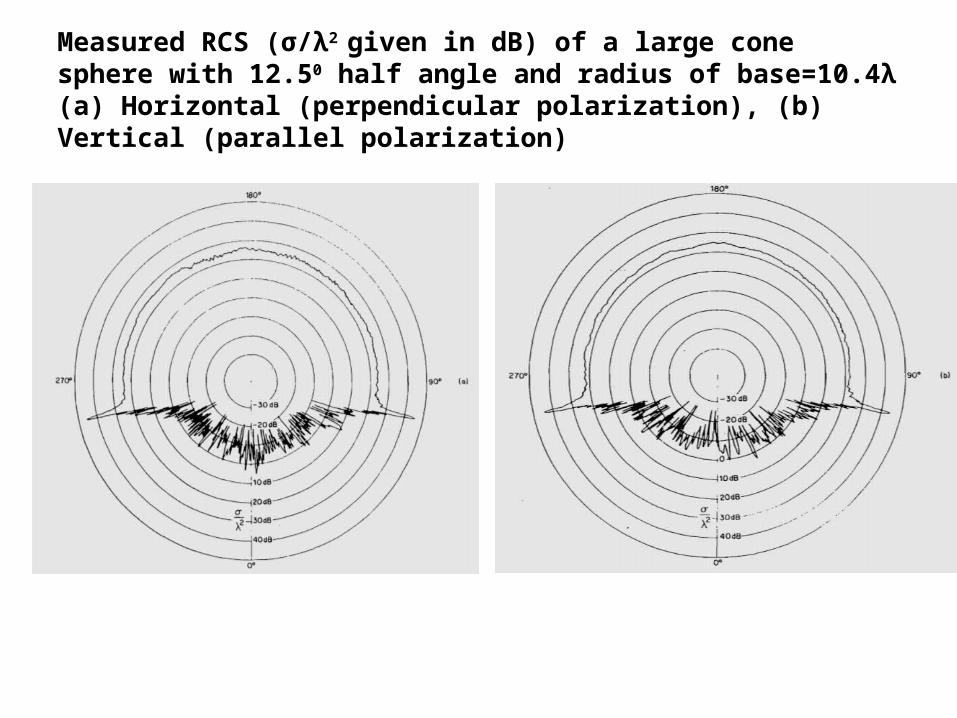
Measured RCS (σ/λ2 given in dB) of a large cone sphere with 12.50 half angle and radius of base=10.4λ (a) Horizontal (perpendicular polarization), (b) Vertical (parallel polarization)
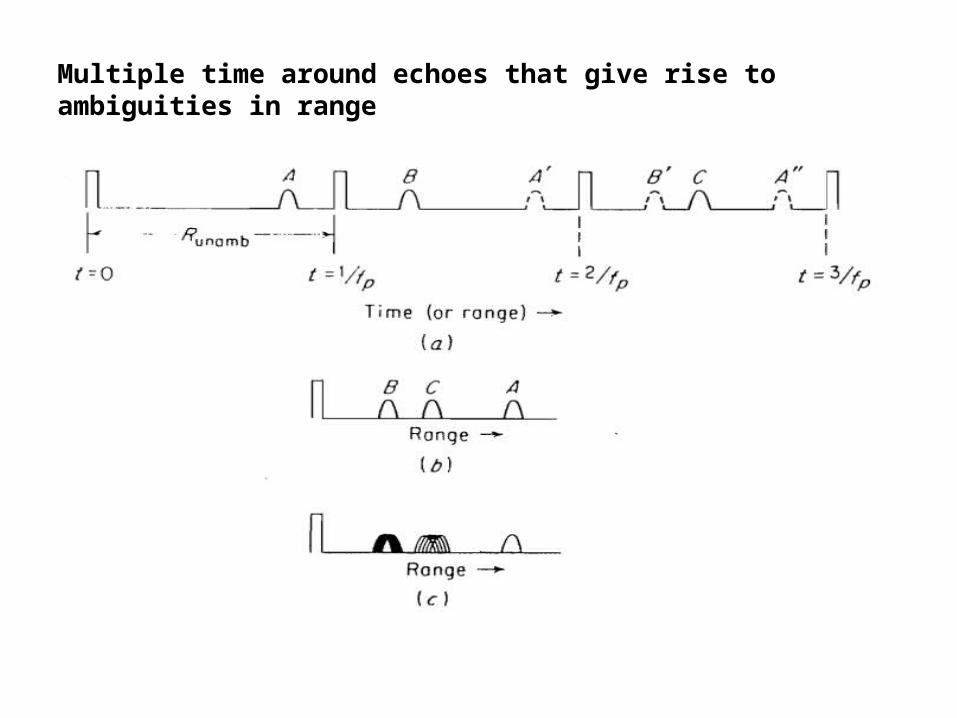
Multiple time around echoes that give rise to ambiguities in range
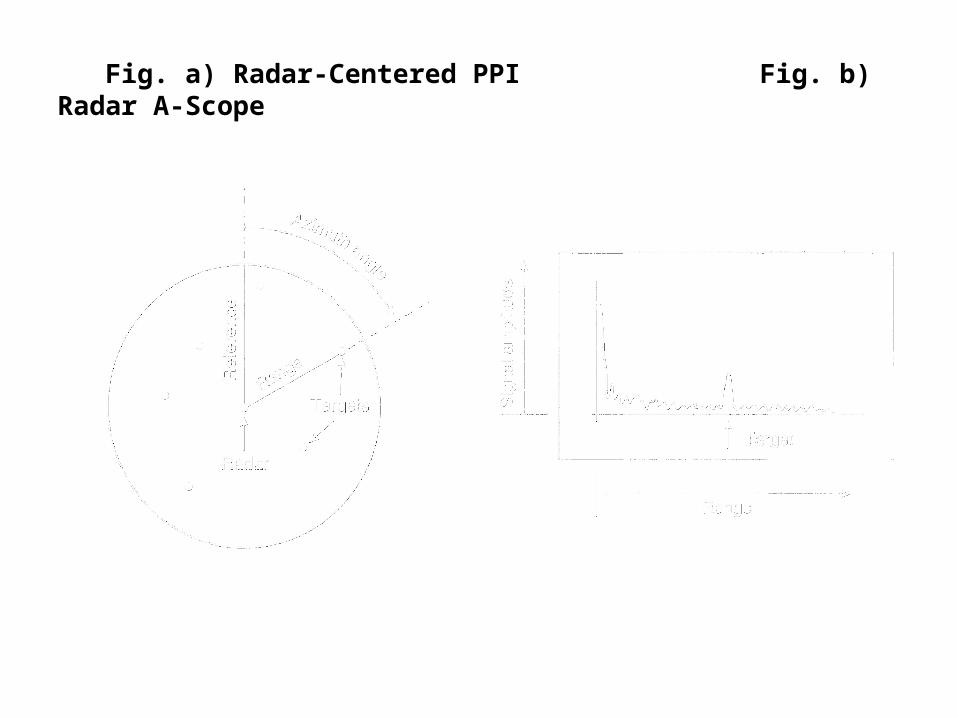
Fig. a) Radar-Centered PPI Fig. b) Radar A-Scope
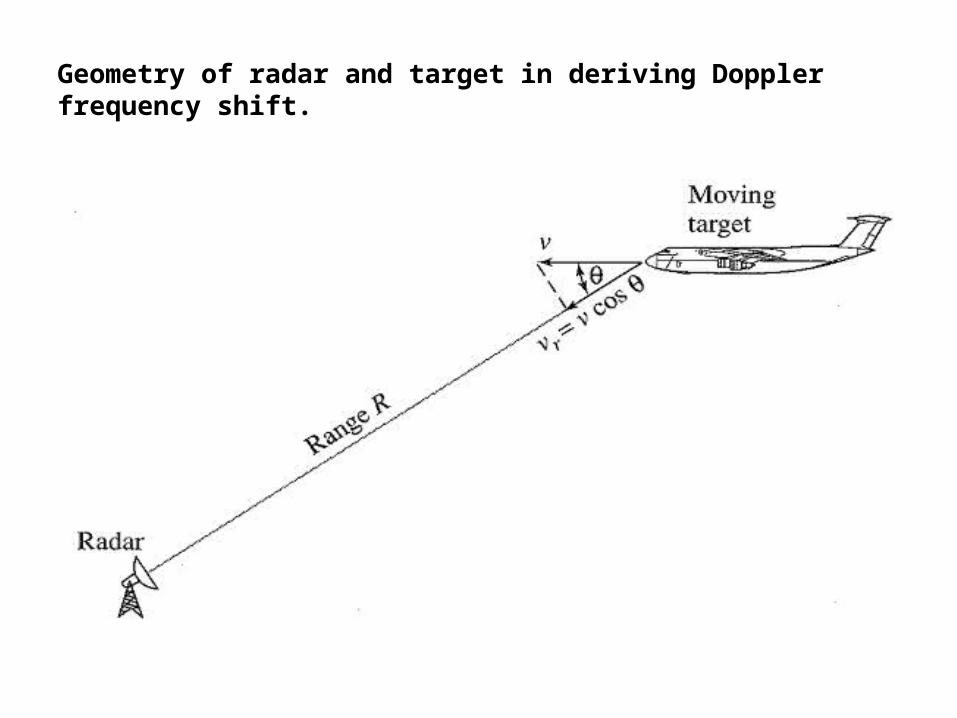
Geometry of radar and target in deriving Doppler frequency shift.

Target 1 generates zero Doppler; Target 2 generates maximum Doppler; Target 3 is in between
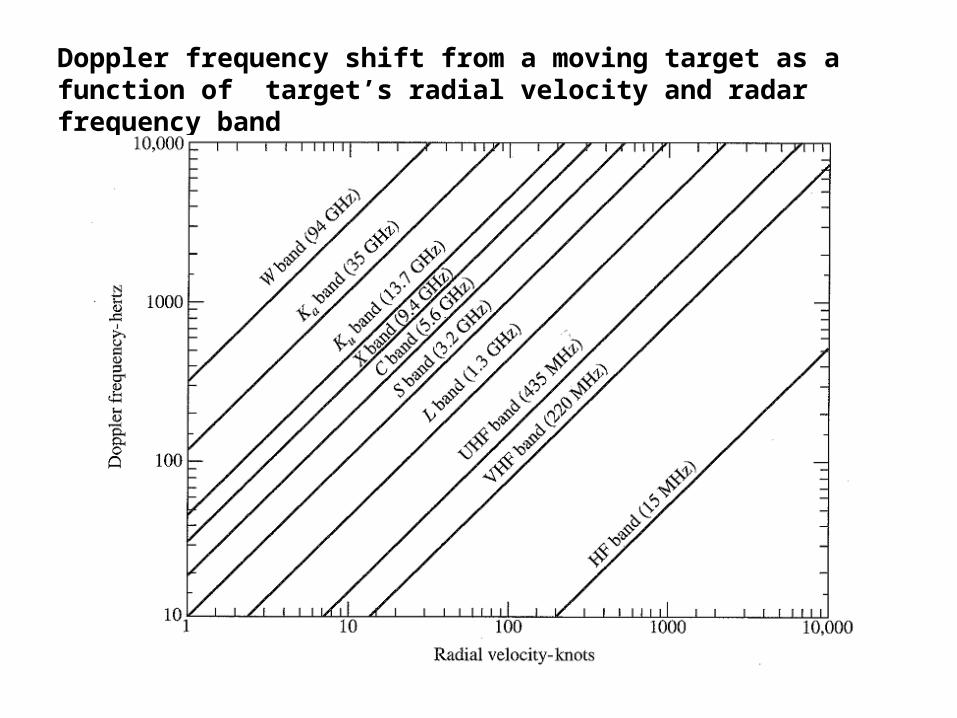
Doppler frequency shift from a moving target as a function of target’s radial velocity and radar frequency band
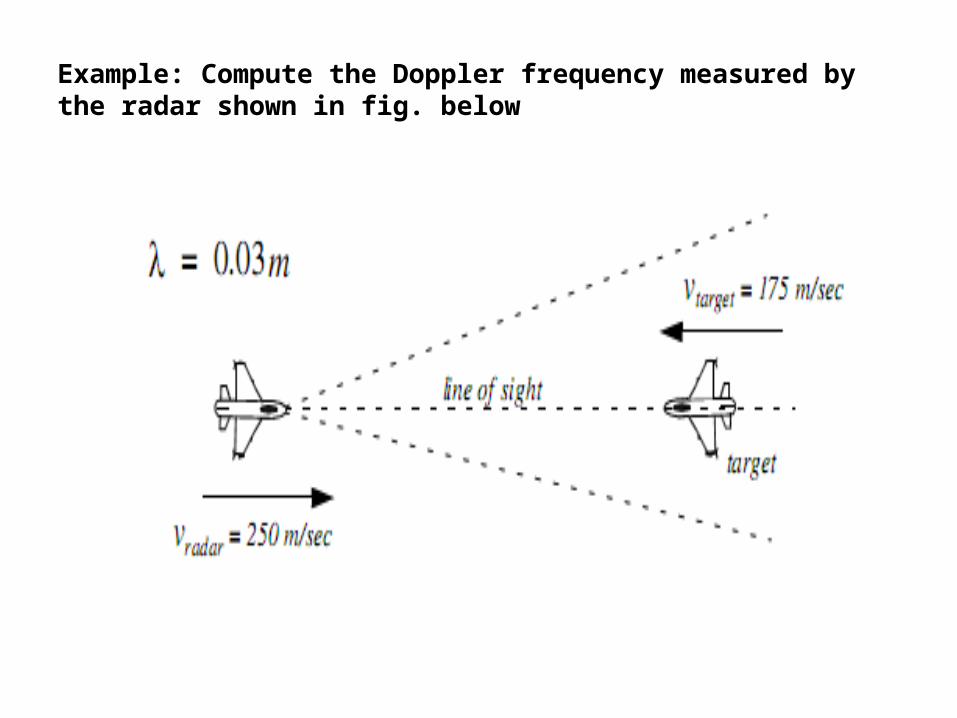
Example: Compute the Doppler frequency measured by the radar shown in fig. below

Fig. a) Simple CW radar block diagram Fig. b) Response characteristic of beat frequency amplifier
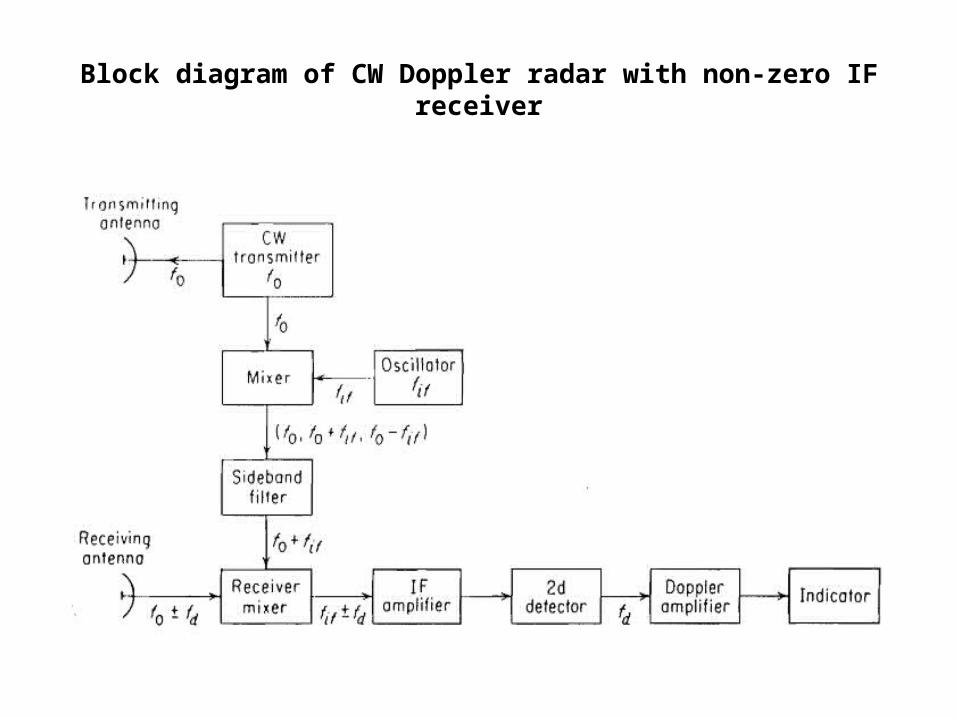
Block diagram of CW Doppler radar with non-zero IF receiver

Frequency spectrum of CW oscillation of (a) infinite duration and (b) finite duration
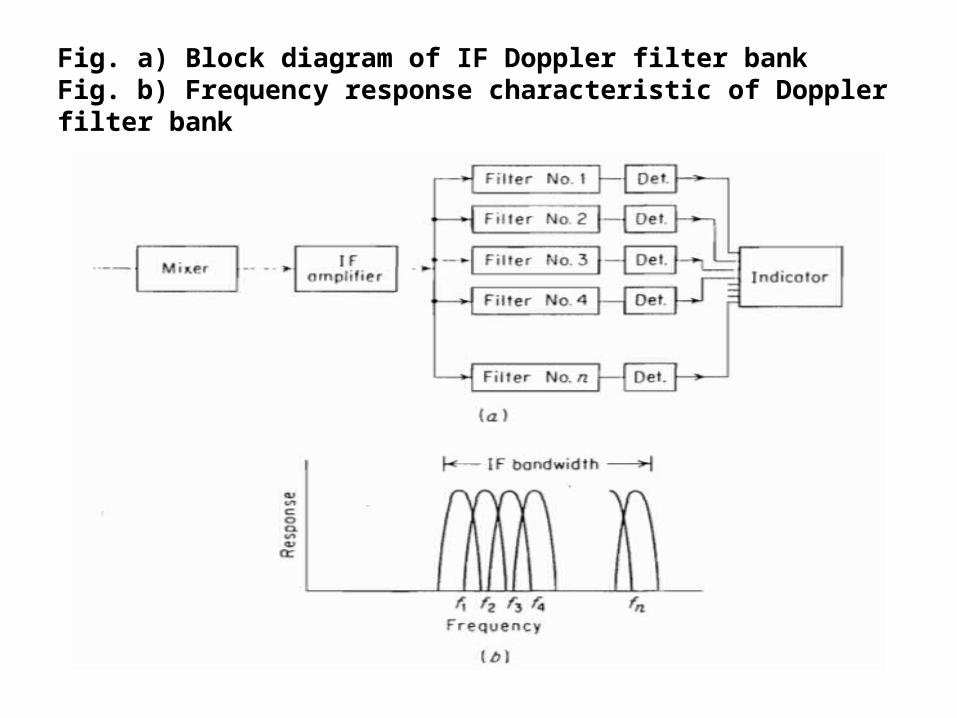
Fig. a) Block diagram of IF Doppler filter bankFig. b) Frequency response characteristic of Doppler filter bank
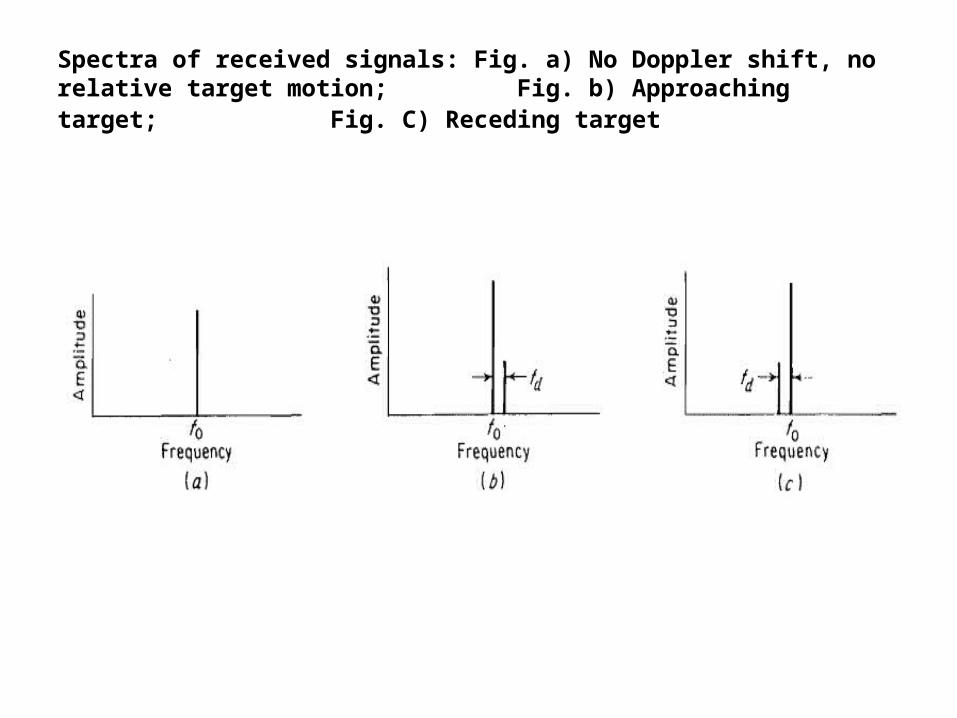
Spectra of received signals: Fig. a) No Doppler shift, no relative target motion; Fig. b) Approaching target; Fig. C) Receding target
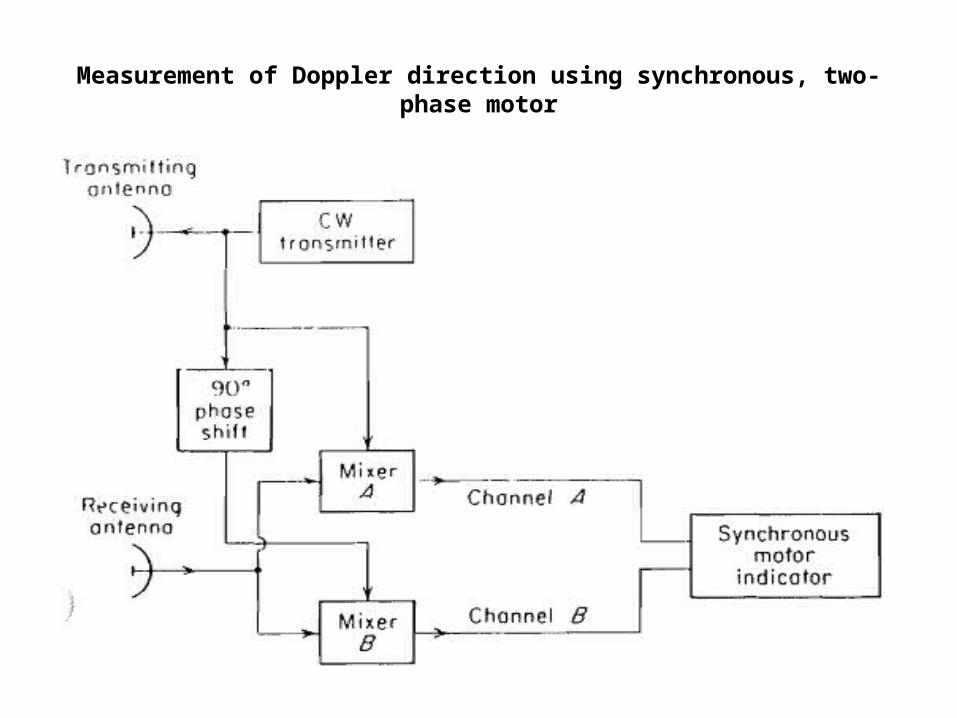
Measurement of Doppler direction using synchronous, two-phase motor
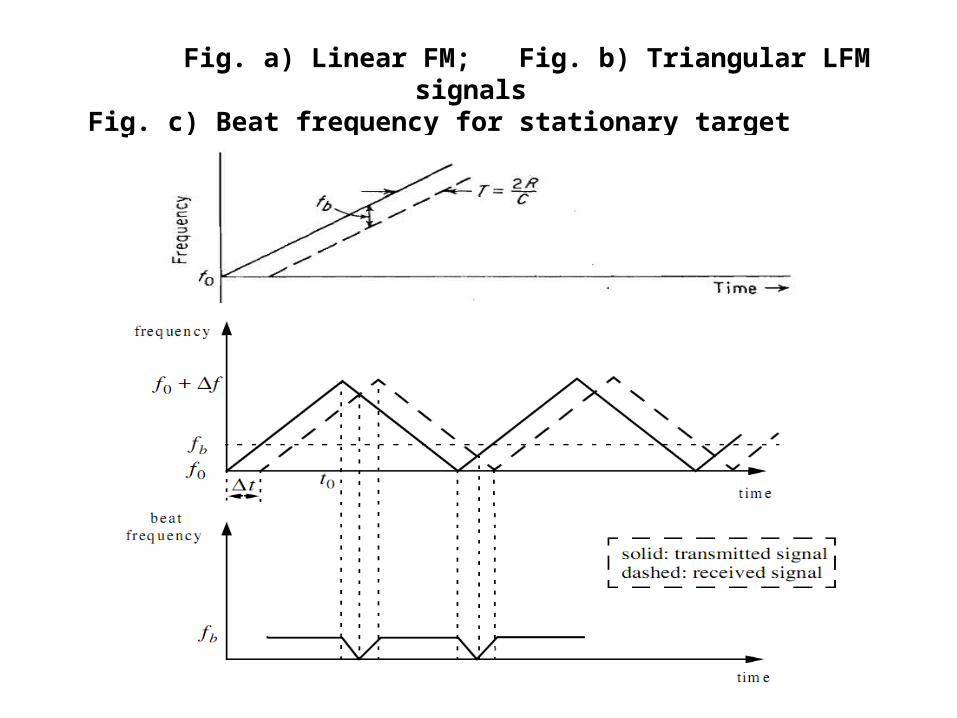
Fig. a) Linear FM; Fig. b) Triangular LFM signals Fig. c) Beat frequency for stationary target

Block diagram of FM-CW radar

Transmitted and received LFM signals and beat frequency, for moving targets
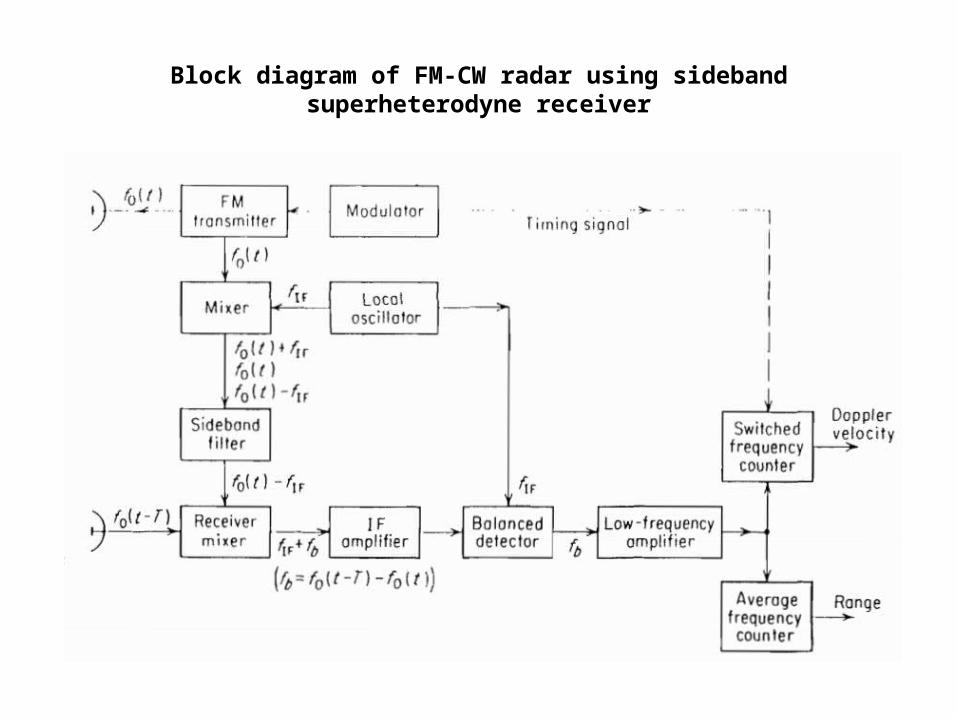
Block diagram of FM-CW radar using sideband superheterodyne receiver
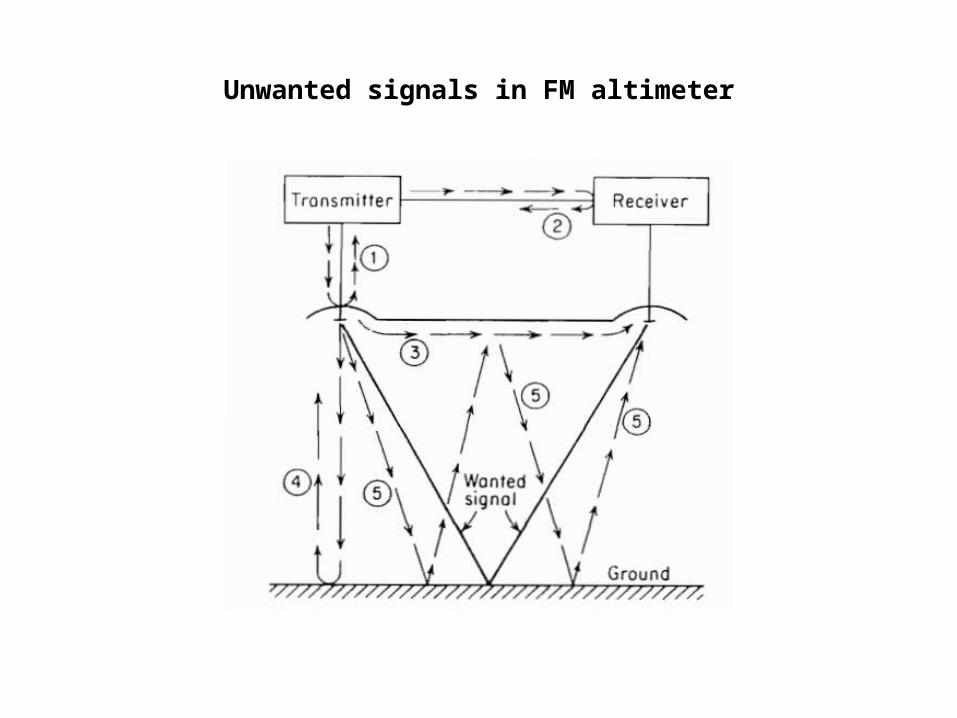
Unwanted signals in FM altimeter
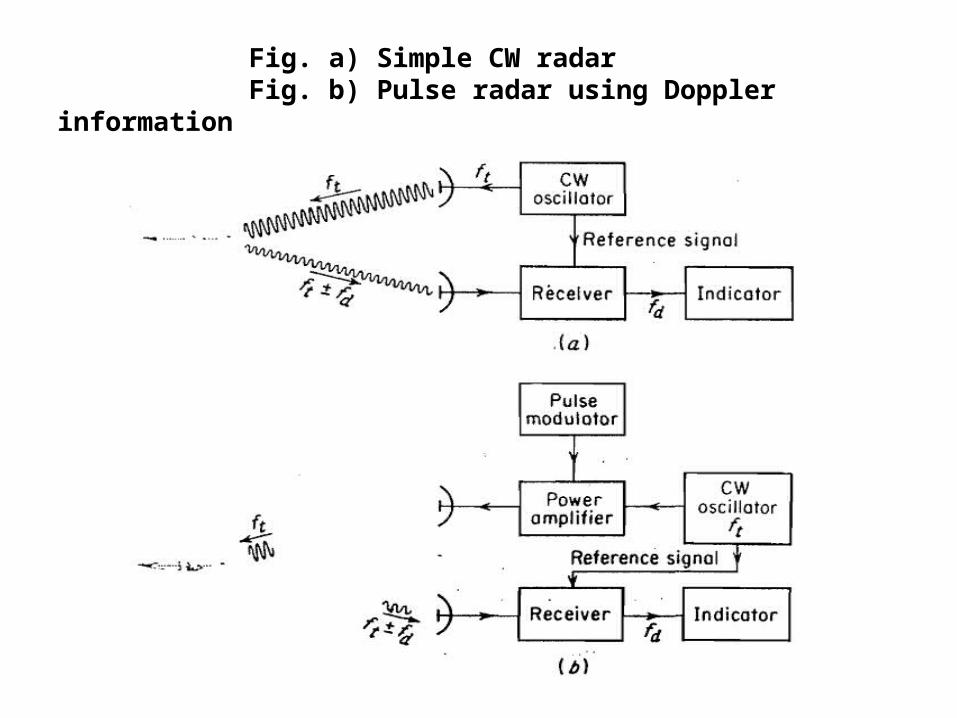
Fig. a) Simple CW radarFig. b) Pulse radar using Doppler information

Fig. a) RF echo pulse trainFig. b) Video pulse train after the phase detector for fd > 1/τFig. c) Video pulse train for fd < 1/τ
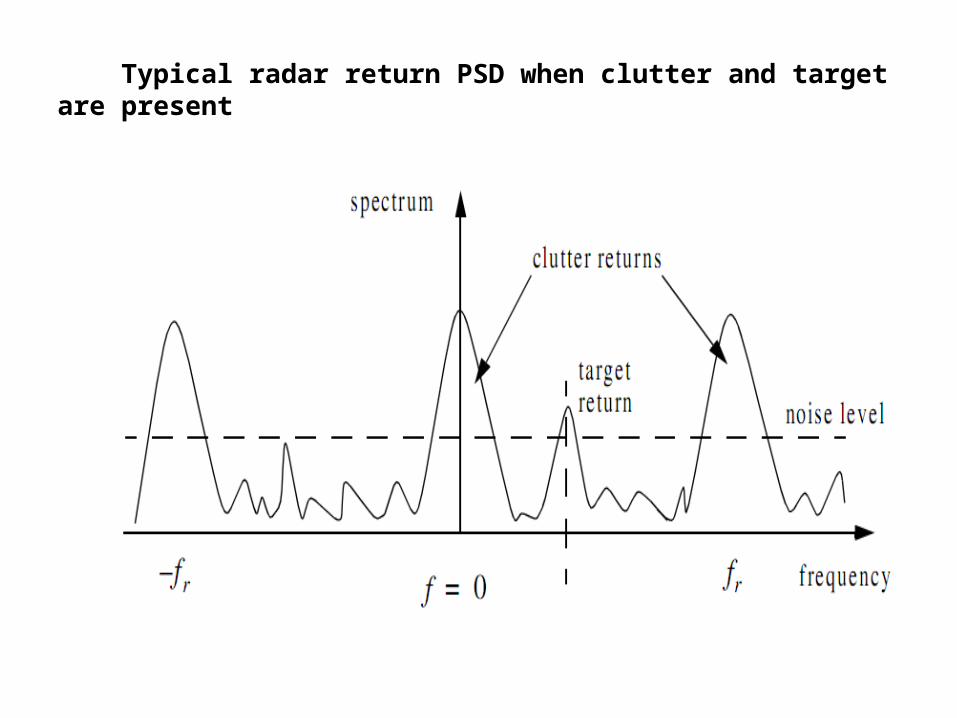
Typical radar return PSD when clutter and target are present
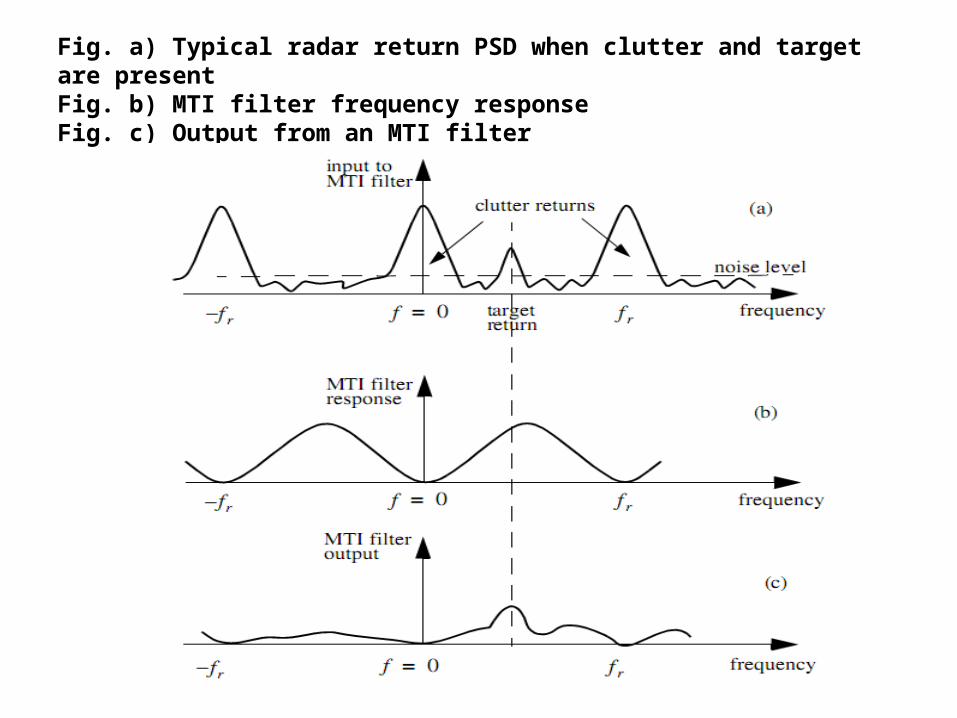
Fig. a) Typical radar return PSD when clutter and target are presentFig. b) MTI filter frequency responseFig. c) Output from an MTI filter
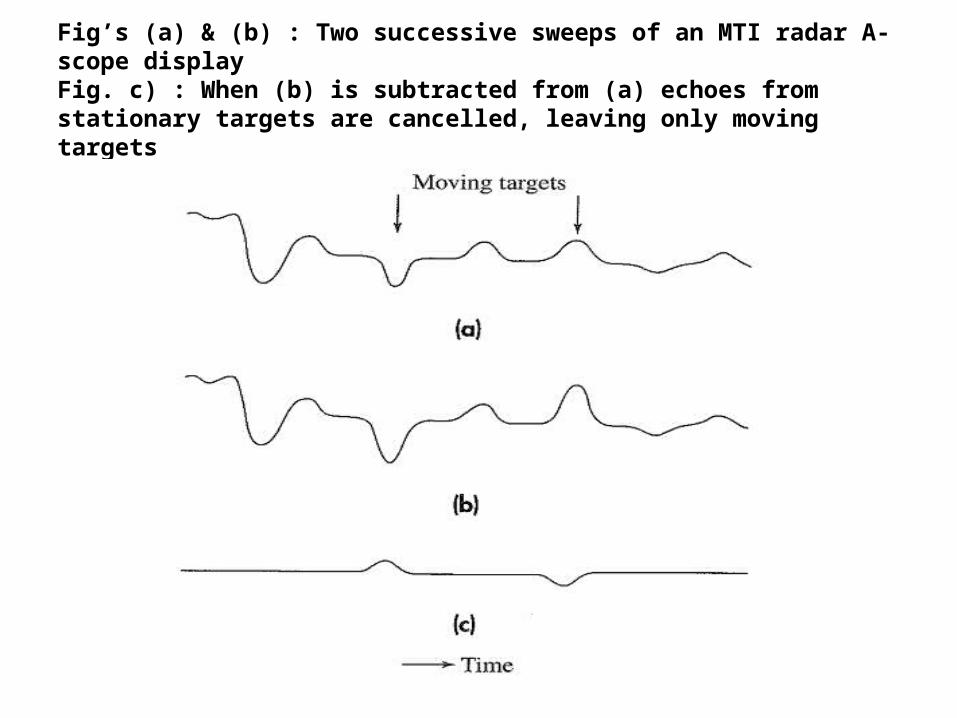
Fig’s (a) & (b) : Two successive sweeps of an MTI radar A-scope displayFig. c) : When (b) is subtracted from (a) echoes from stationary targets are cancelled, leaving only moving targets
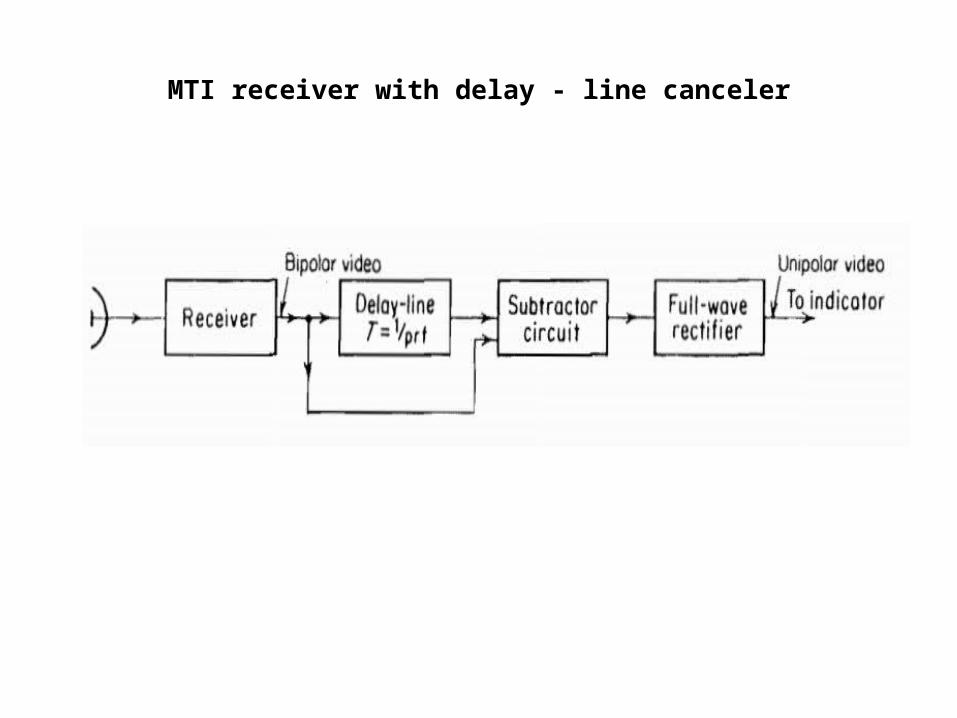
MTI receiver with delay - line canceler
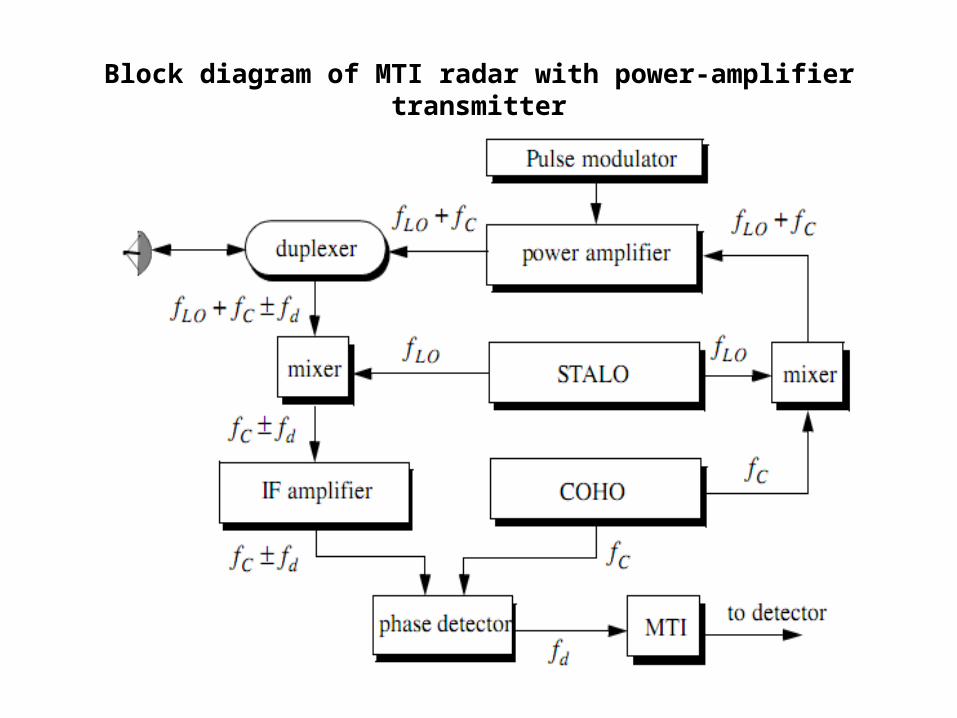
Block diagram of MTI radar with power-amplifier transmitter
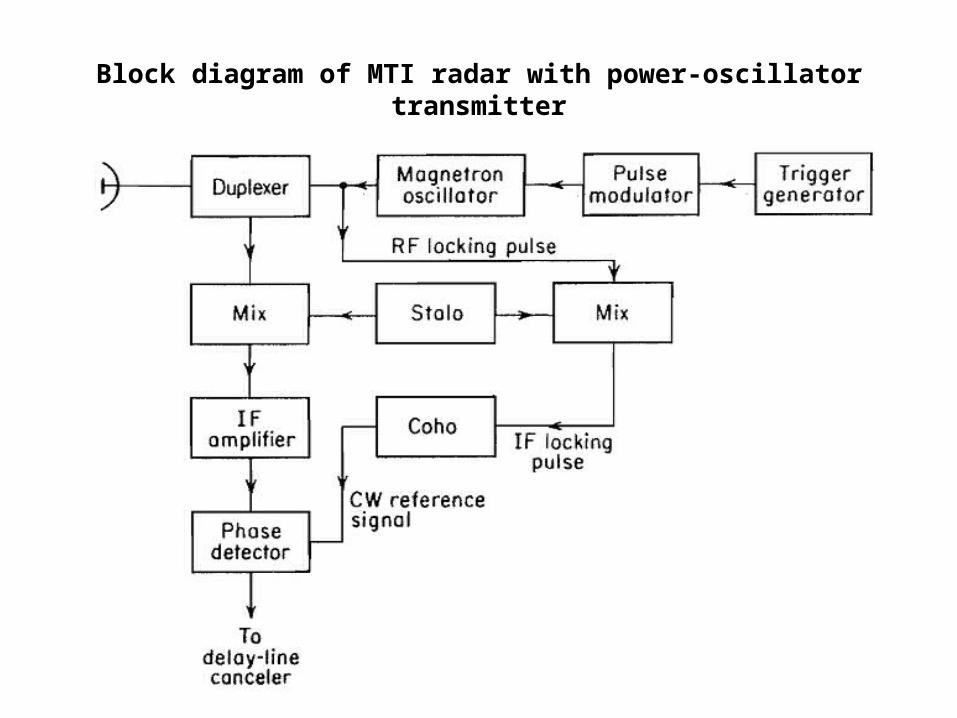
Block diagram of MTI radar with power-oscillator transmitter
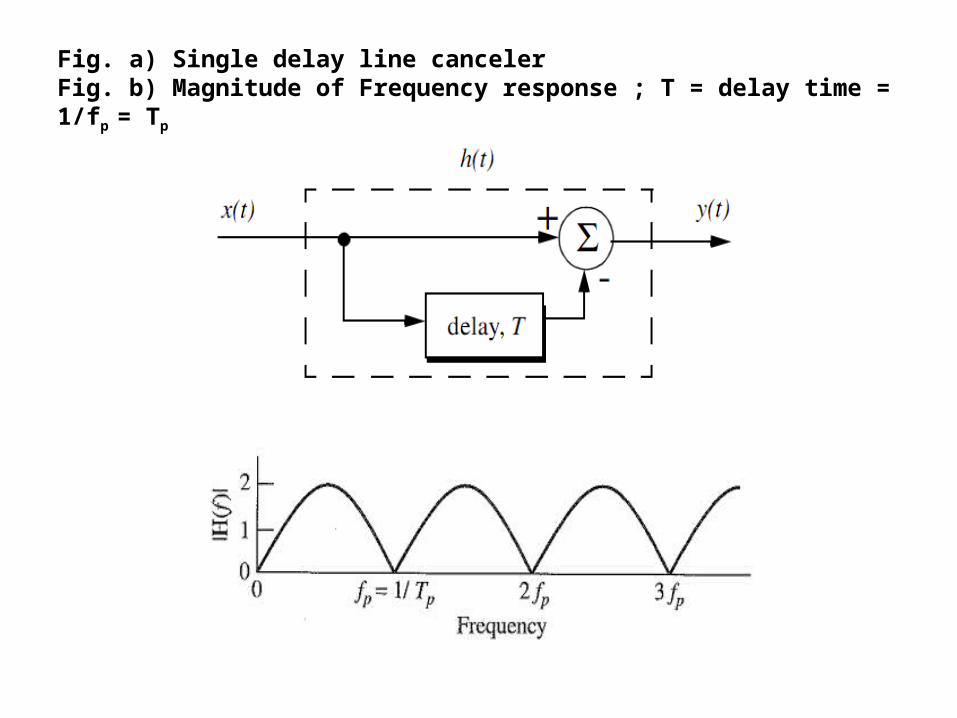
Fig. a) Single delay line canceler Fig. b) Magnitude of Frequency response ; T = delay time = 1/fp = Tp
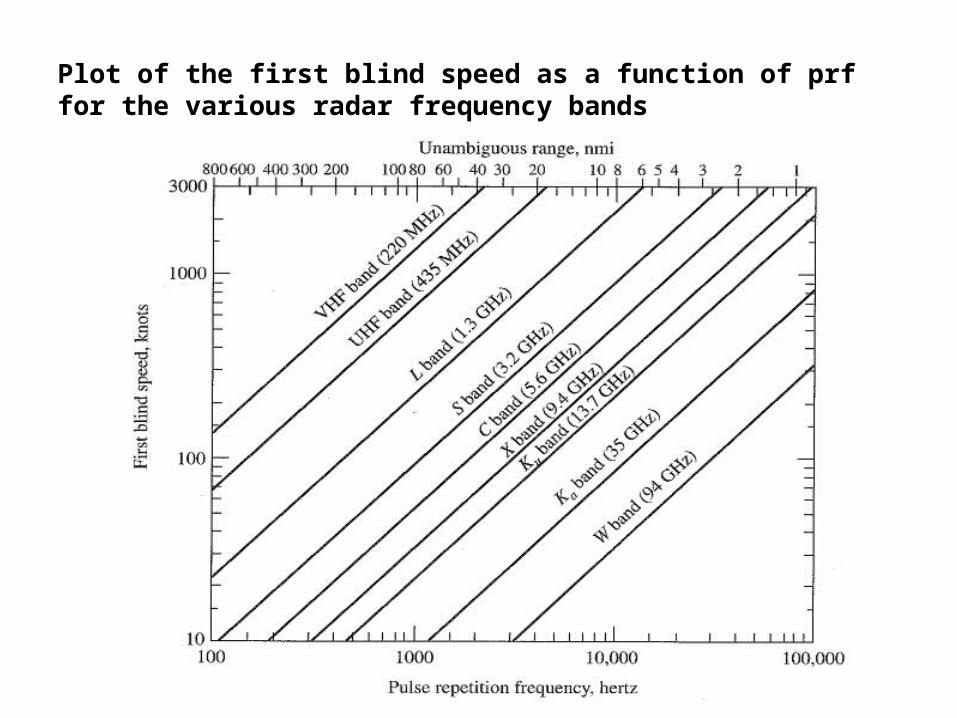
Plot of the first blind speed as a function of prf for the various radar frequency bands

Configuration for a double delay line canceler
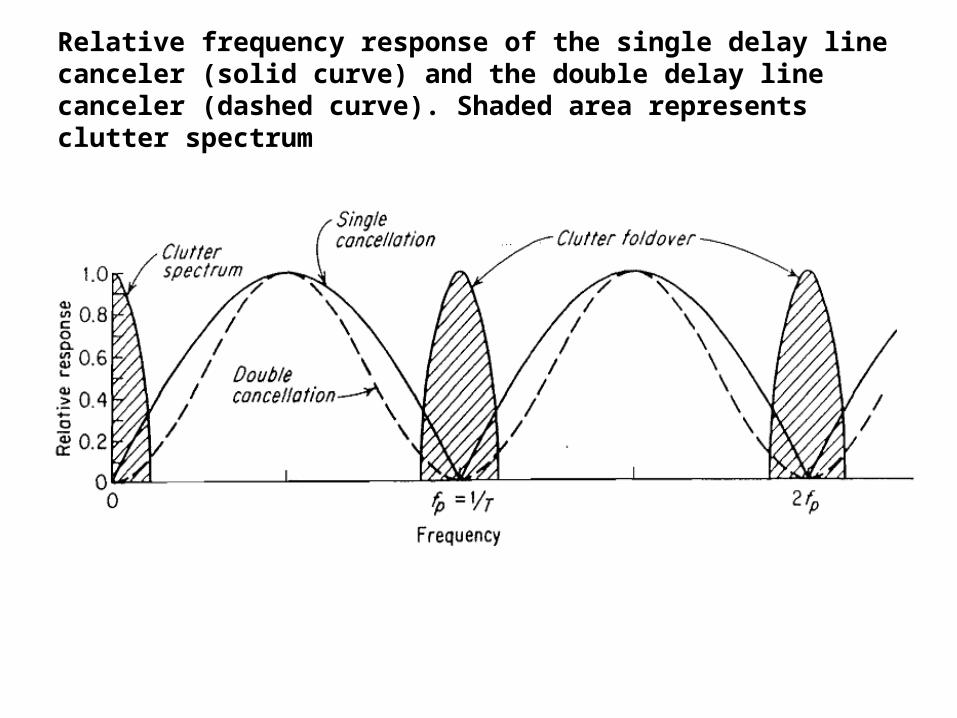
Relative frequency response of the single delay line canceler (solid curve) and the double delay line canceler (dashed curve). Shaded area represents clutter spectrum
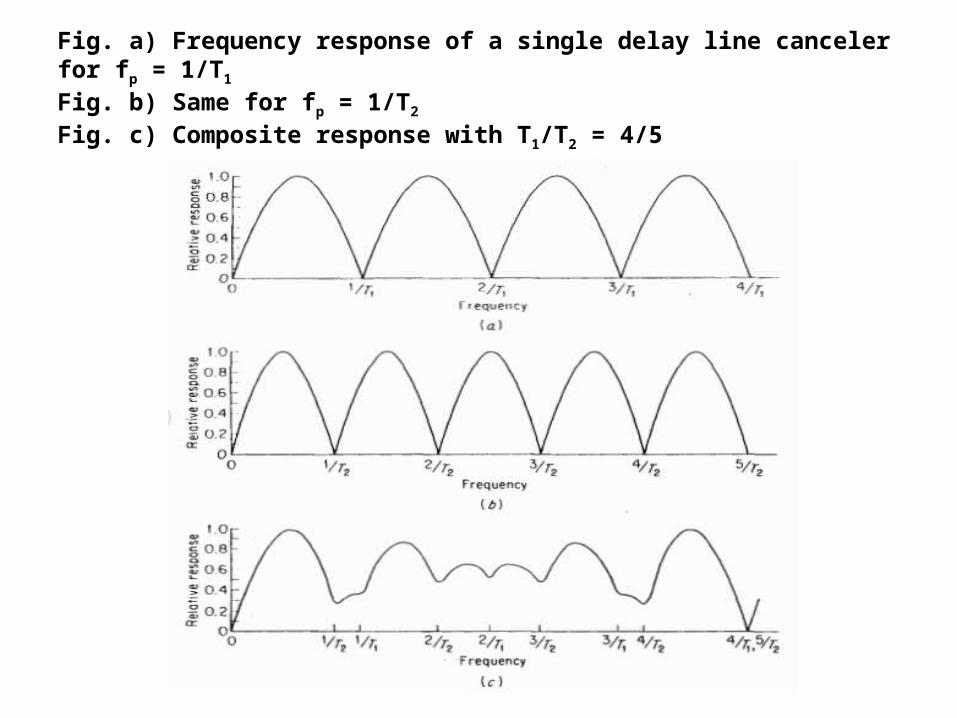
Fig. a) Frequency response of a single delay line canceler for fp = 1/T1
Fig. b) Same for fp = 1/T2
Fig. c) Composite response with T1/T2 = 4/5

Fig. a) Staggered pulse train with four different pulse periodsFig. b) Frequency response of a five-pulse (four-period) stagger
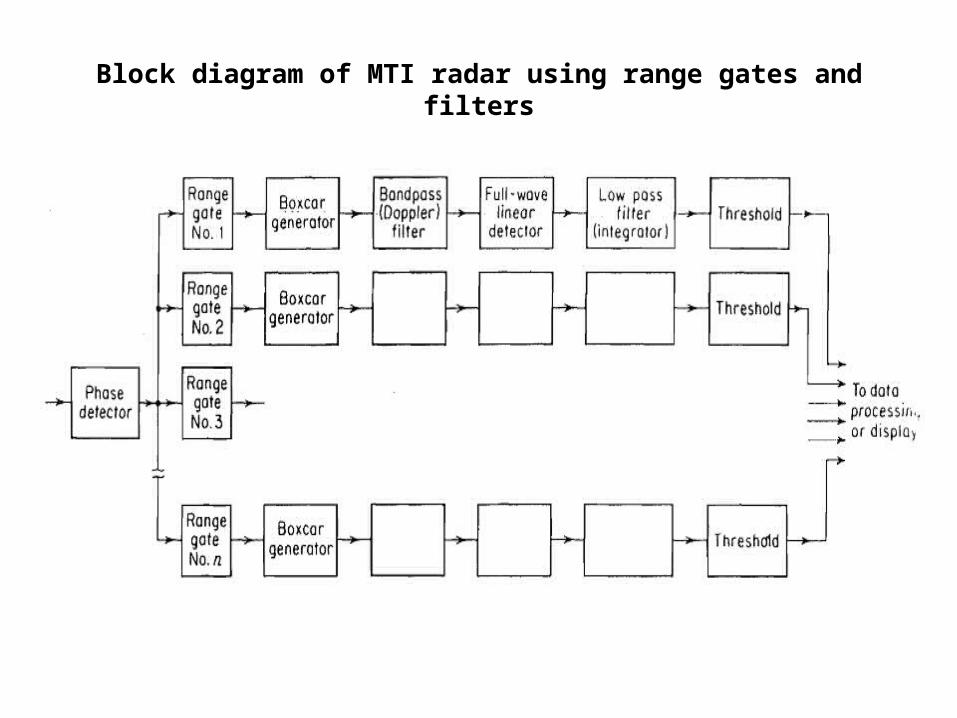
Block diagram of MTI radar using range gates and filters
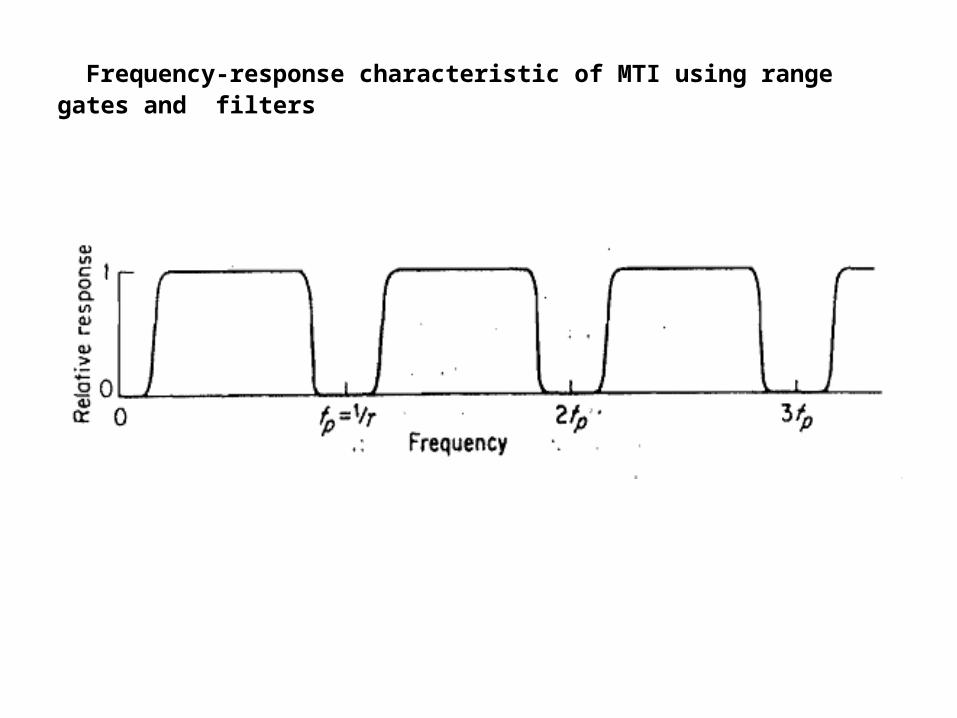
Frequency-response characteristic of MTI using range gates and filters
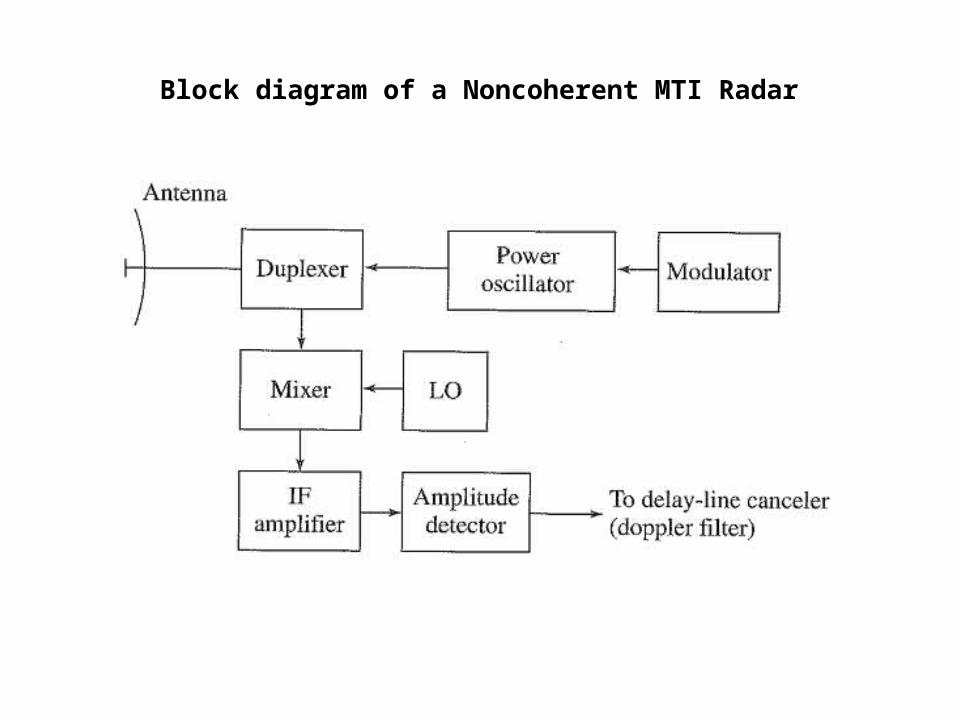
Block diagram of a Noncoherent MTI Radar
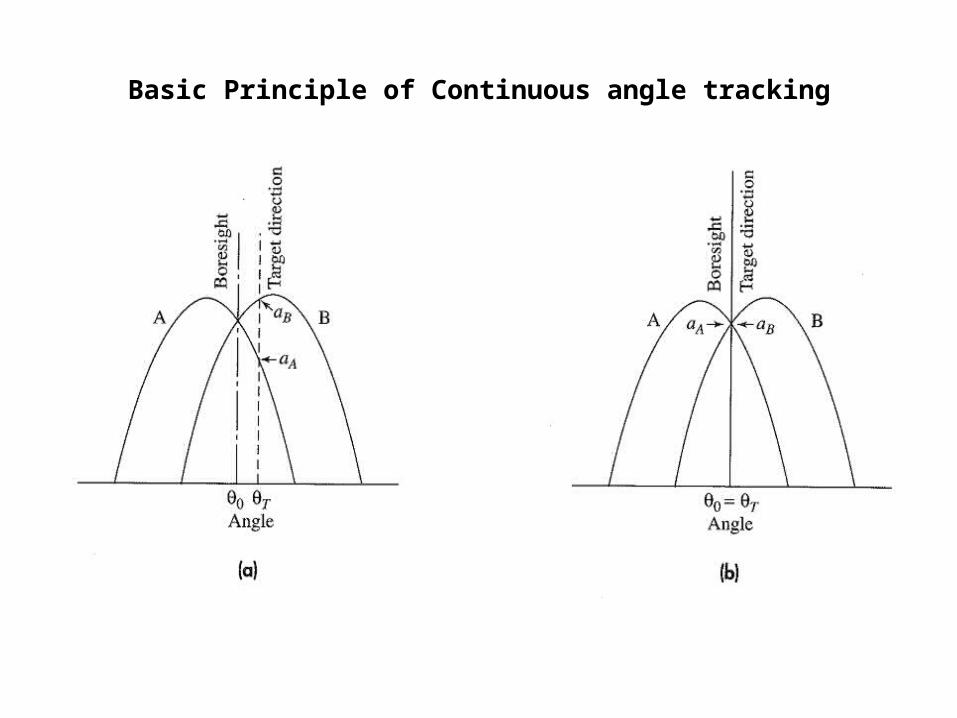
Basic Principle of Continuous angle tracking
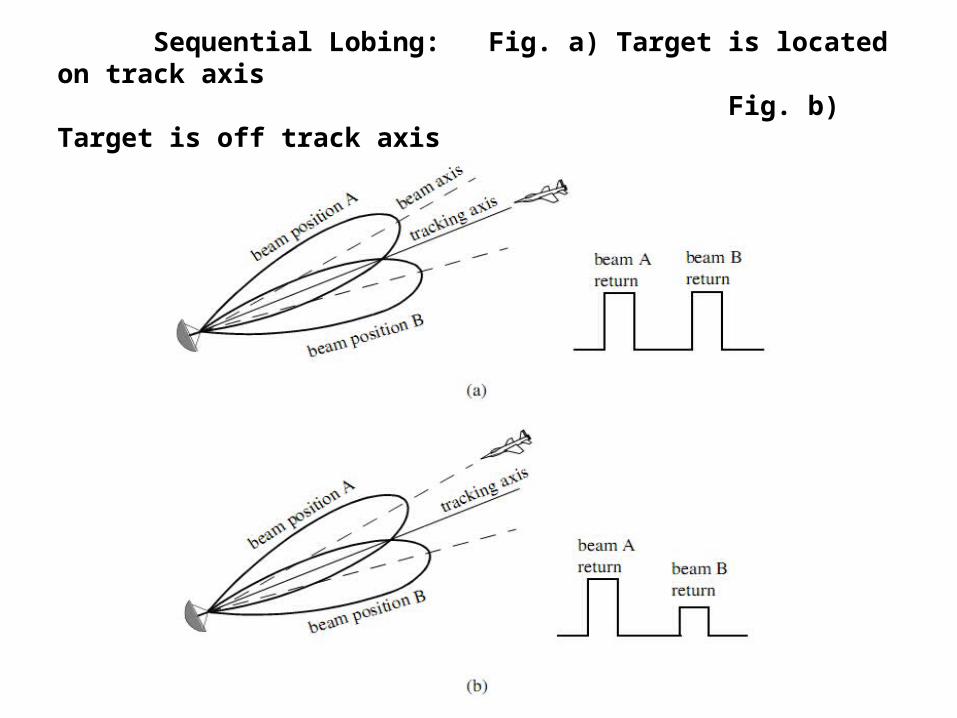
Sequential Lobing: Fig. a) Target is located on track axis Fig. b) Target is off track axis
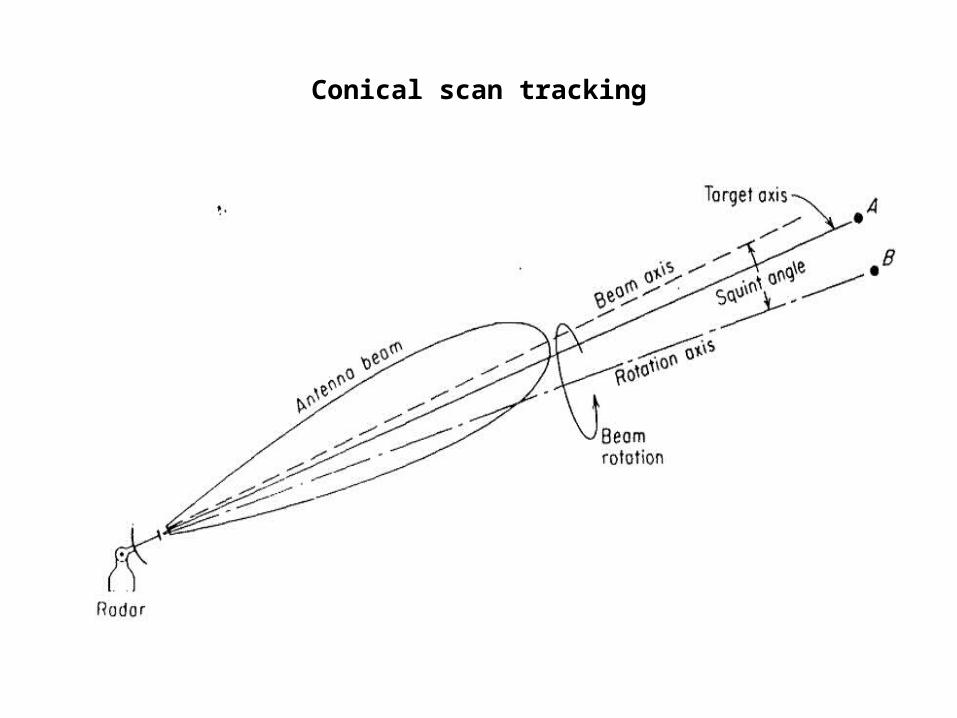
Conical scan tracking
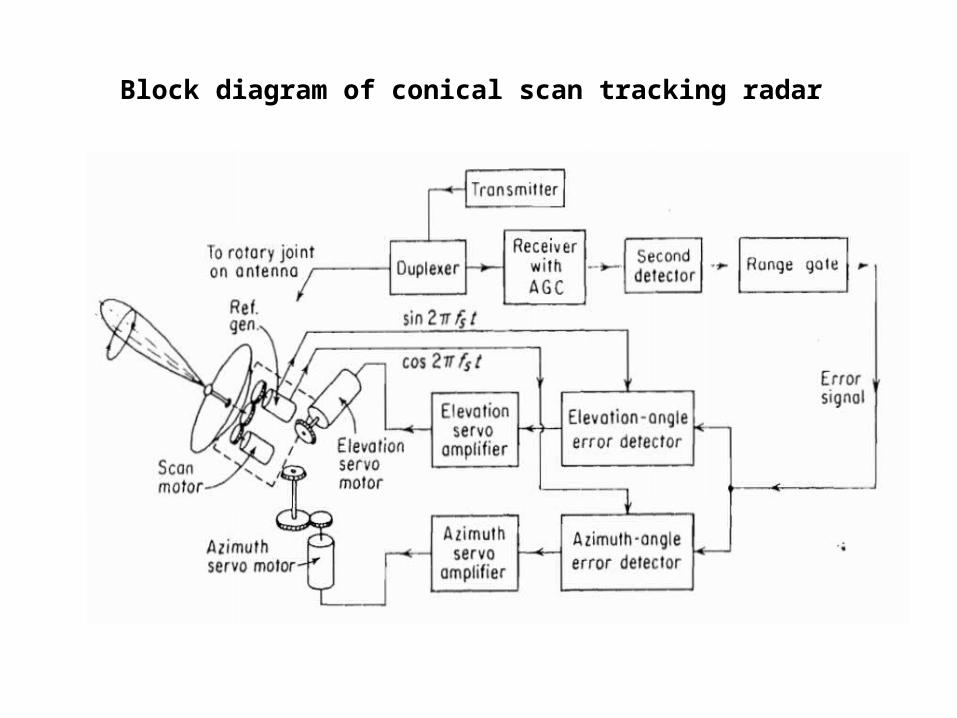
Block diagram of conical scan tracking radar
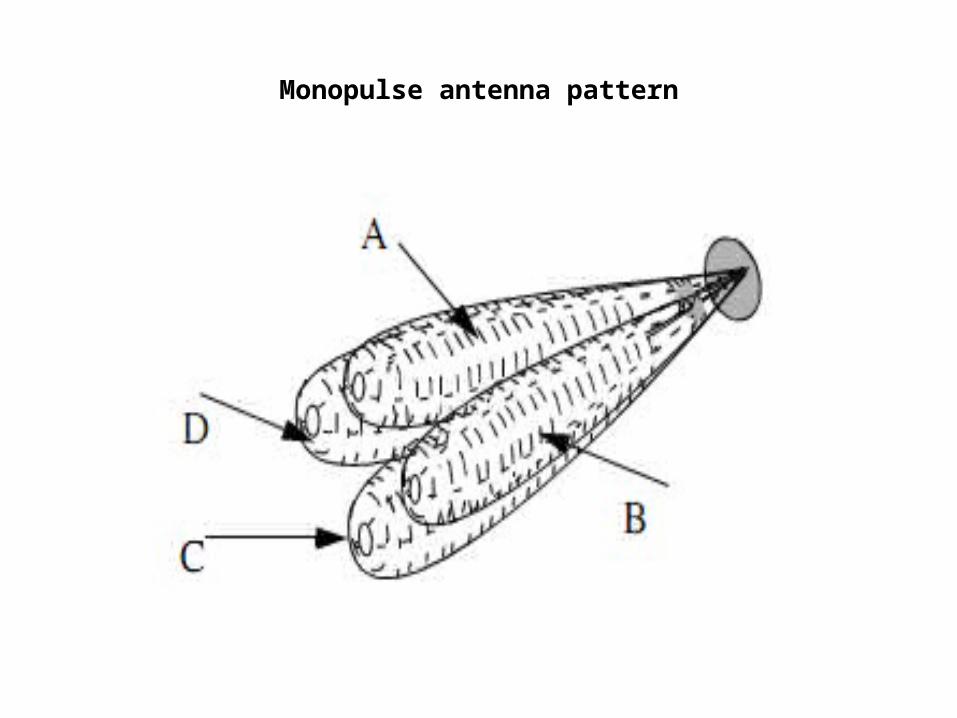
Monopulse antenna pattern
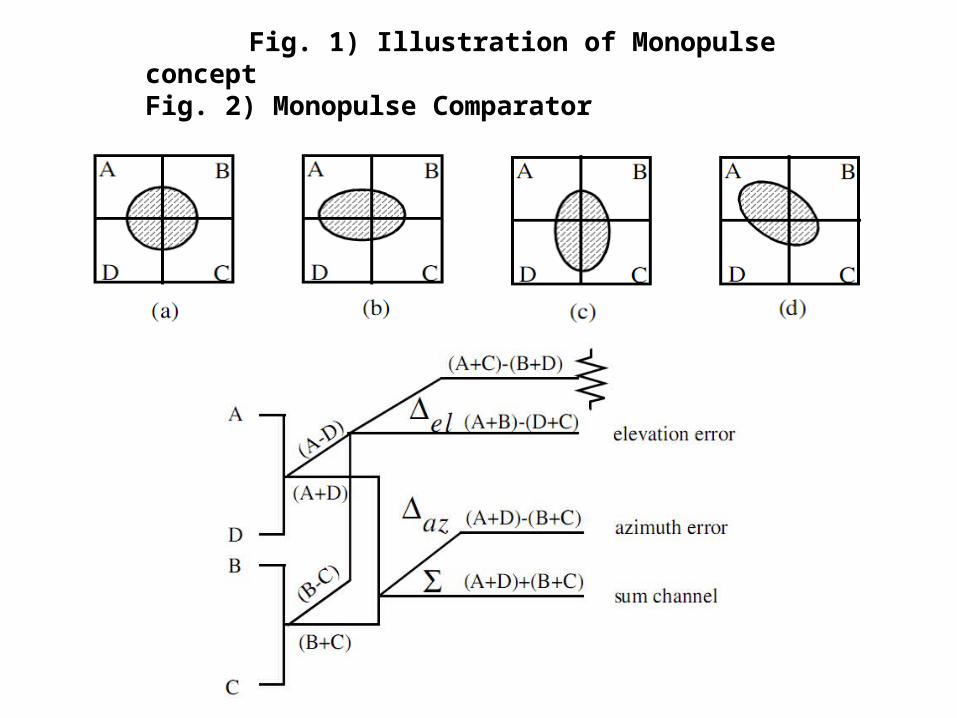
Fig. 1) Illustration of Monopulse conceptFig. 2) Monopulse Comparator
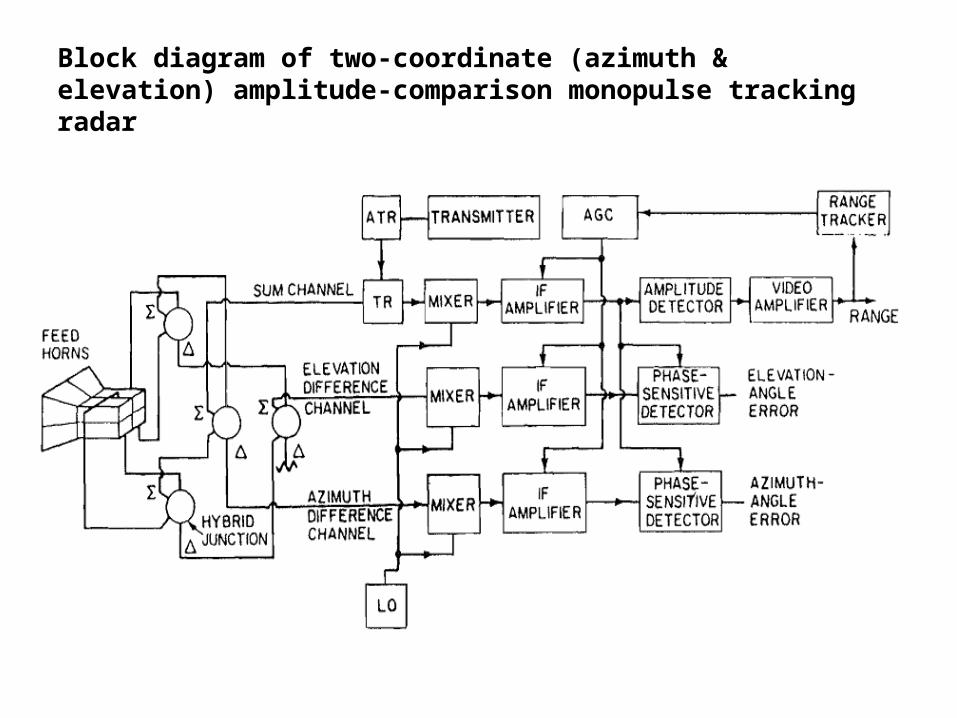
Block diagram of two-coordinate (azimuth & elevation) amplitude-comparison monopulse tracking radar
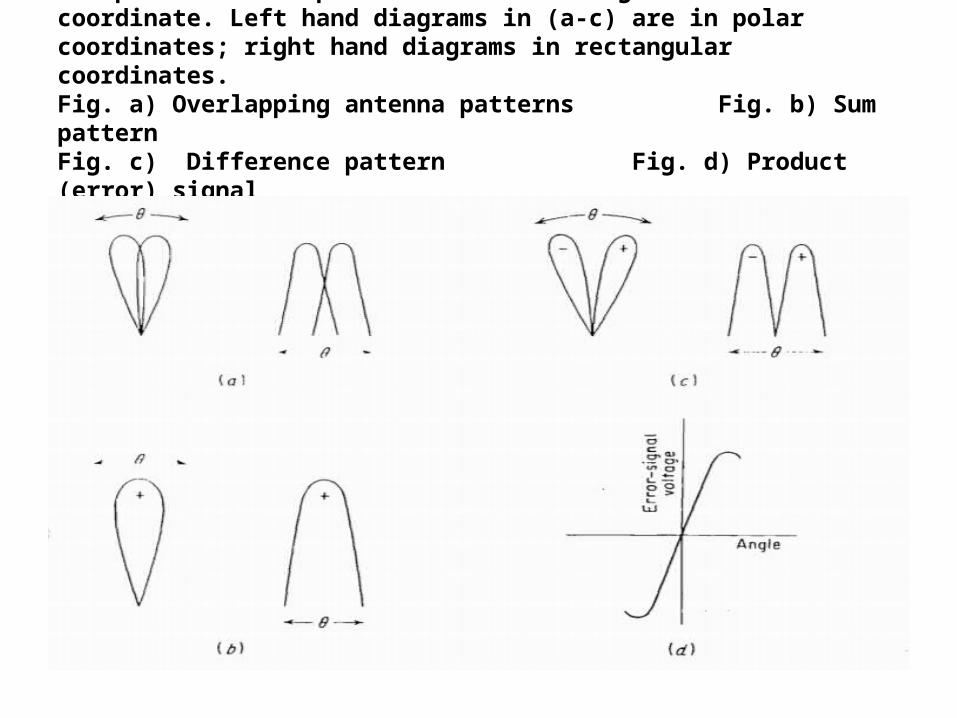
Monopulse antenna patterns and error signal in one coordinate. Left hand diagrams in (a-c) are in polar coordinates; right hand diagrams in rectangular coordinates.Fig. a) Overlapping antenna patterns Fig. b) Sum patternFig. c) Difference pattern Fig. d) Product (error) signal
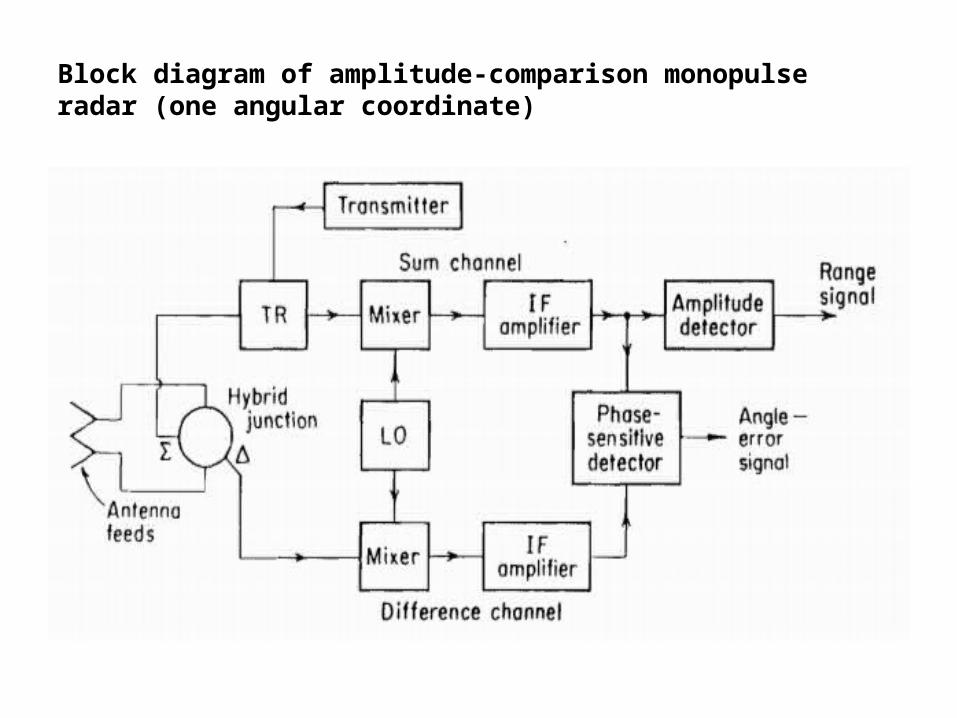
Block diagram of amplitude-comparison monopulse radar (one angular coordinate)

Wavefront phase relationships in phase-comparison monopulse radar
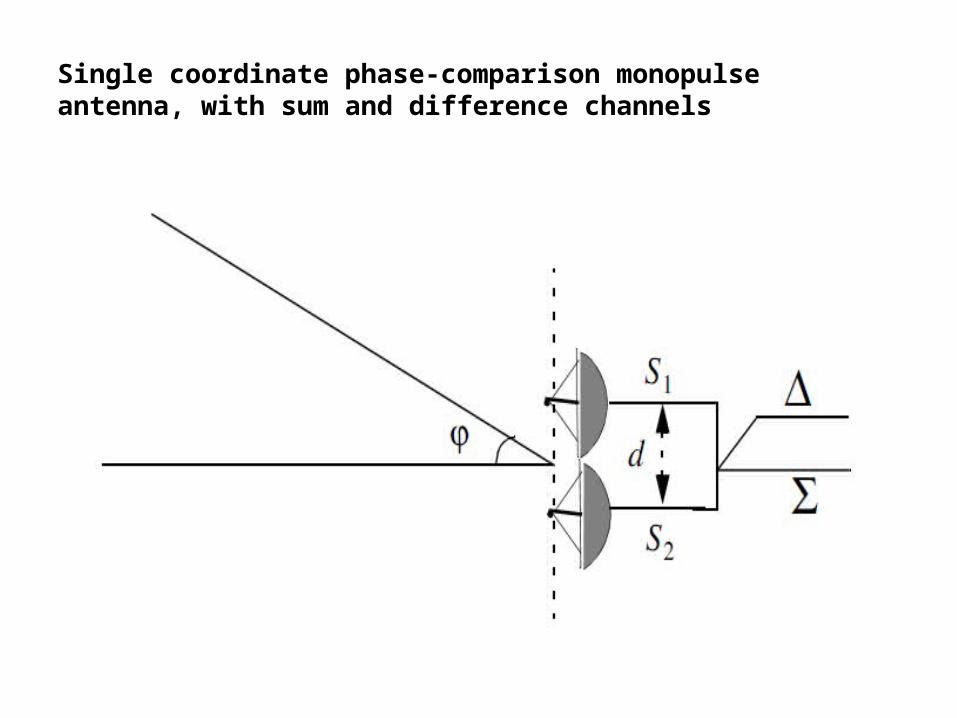
Single coordinate phase-comparison monopulse antenna, with sum and difference channels
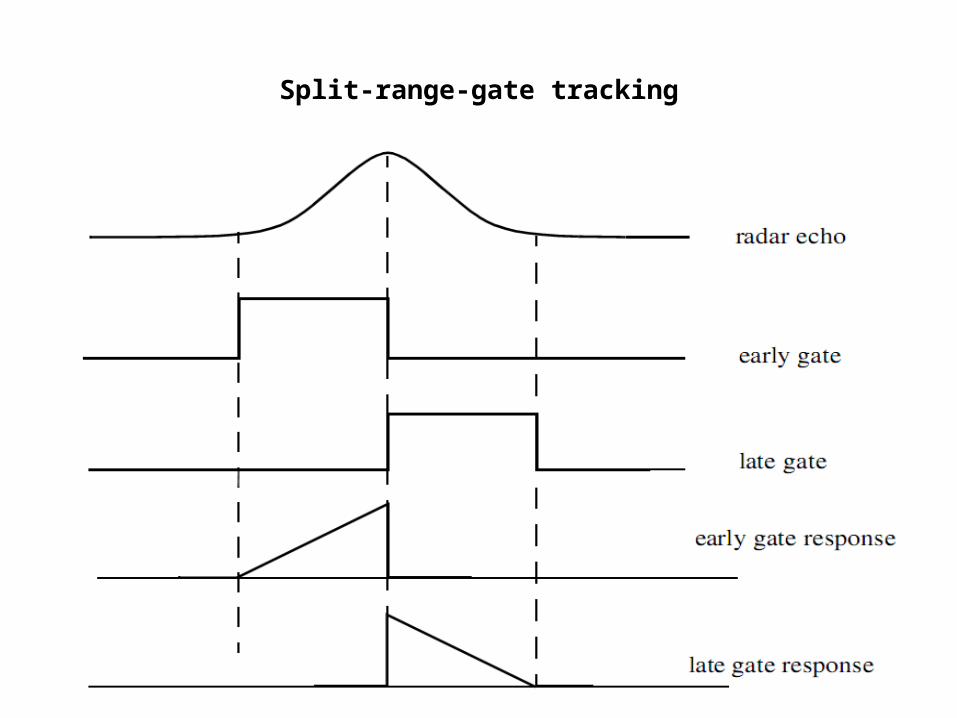
Split-range-gate tracking
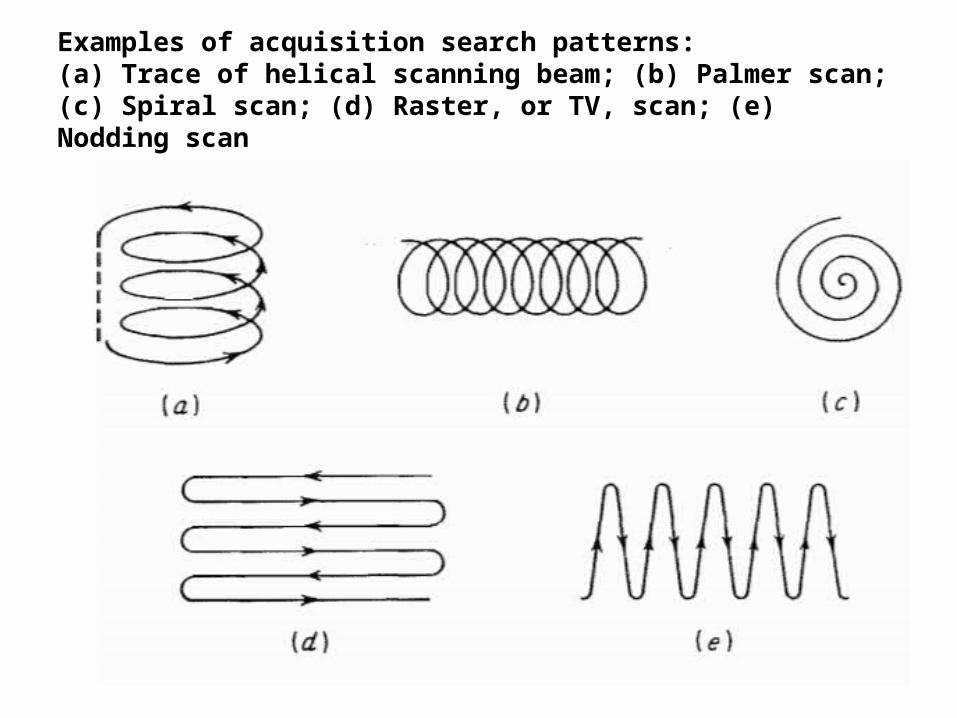
Examples of acquisition search patterns: (a) Trace of helical scanning beam; (b) Palmer scan; (c) Spiral scan; (d) Raster, or TV, scan; (e) Nodding scan
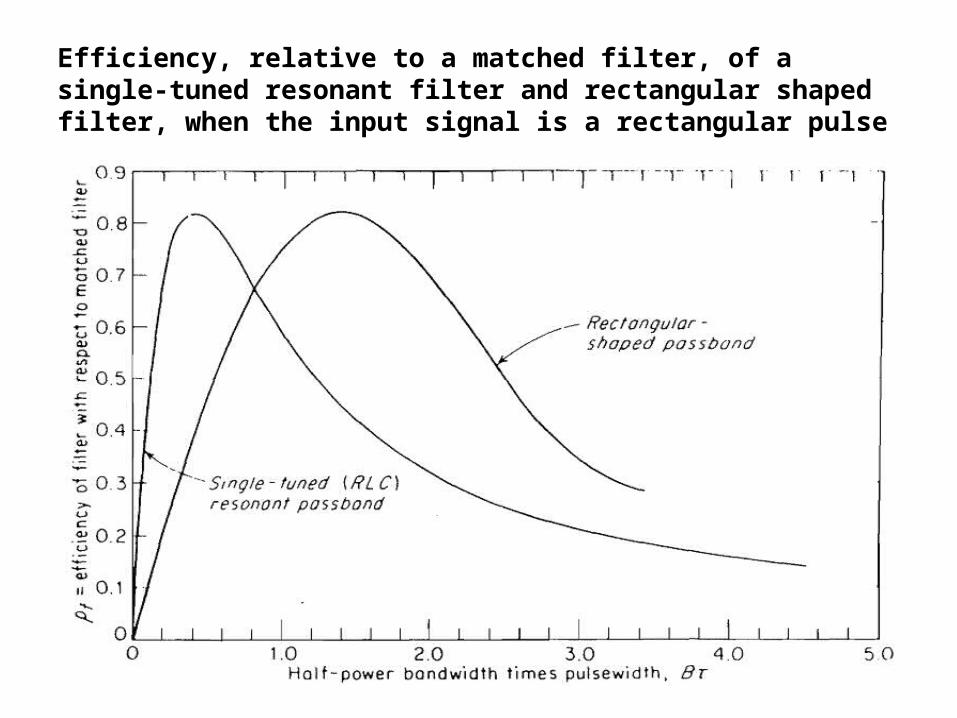
Efficiency, relative to a matched filter, of a single-tuned resonant filter and rectangular shaped filter, when the input signal is a rectangular pulse

Efficiency of nonmatched filters compared with the matched filter
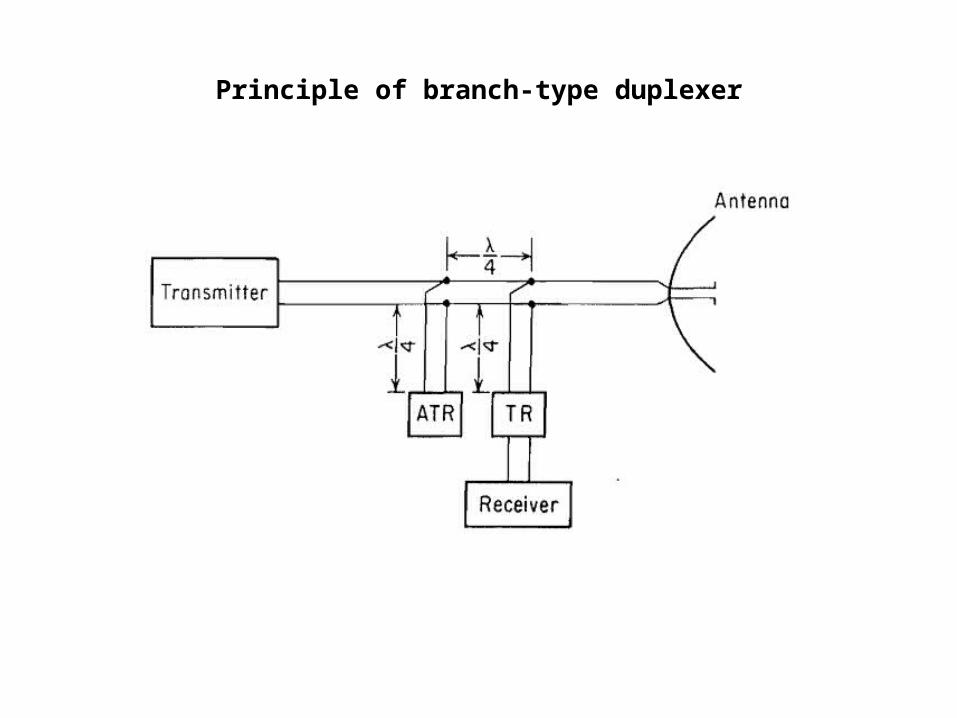
Principle of branch-type duplexer
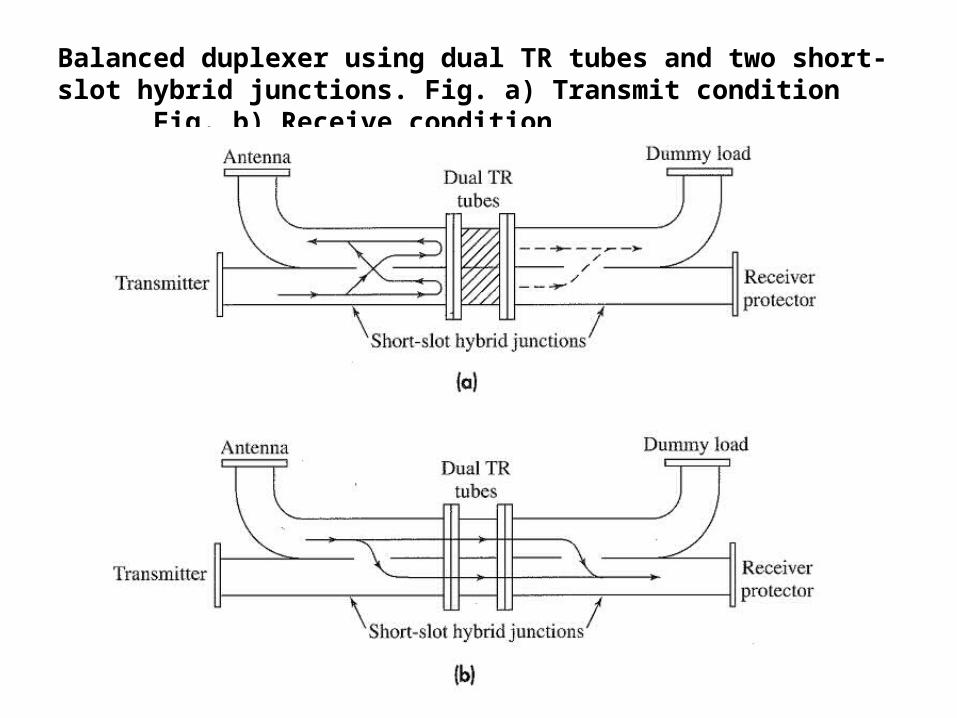
Balanced duplexer using dual TR tubes and two short-slot hybrid junctions. Fig. a) Transmit condition Fig. b) Receive condition
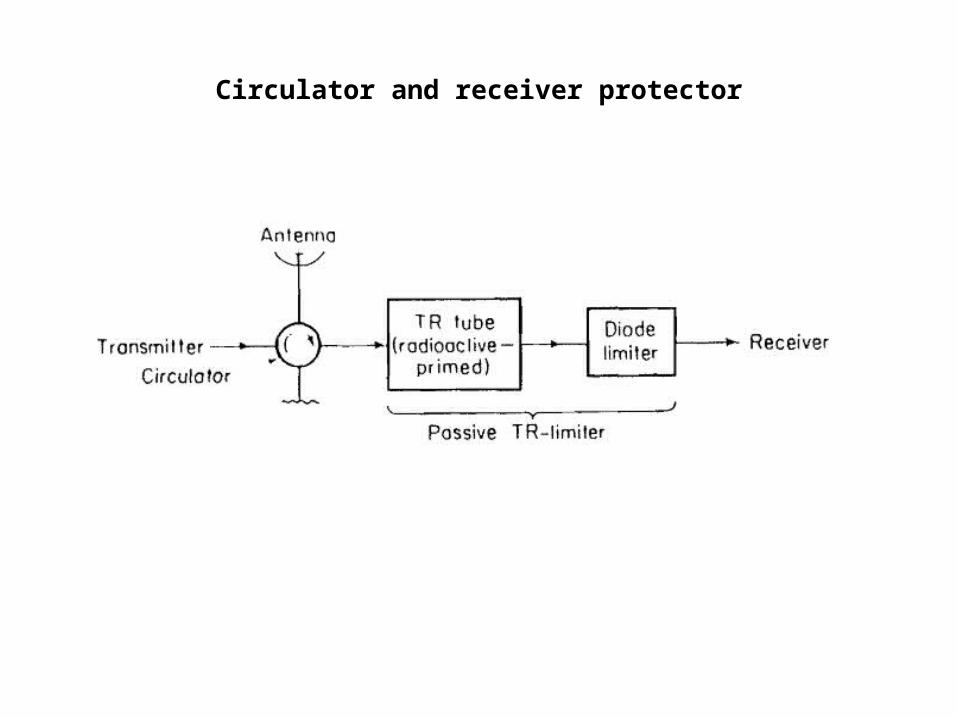
Circulator and receiver protector

Fig. a) N-element linear arrayFig. b) Steering of an antenna beam with variable phase shifters
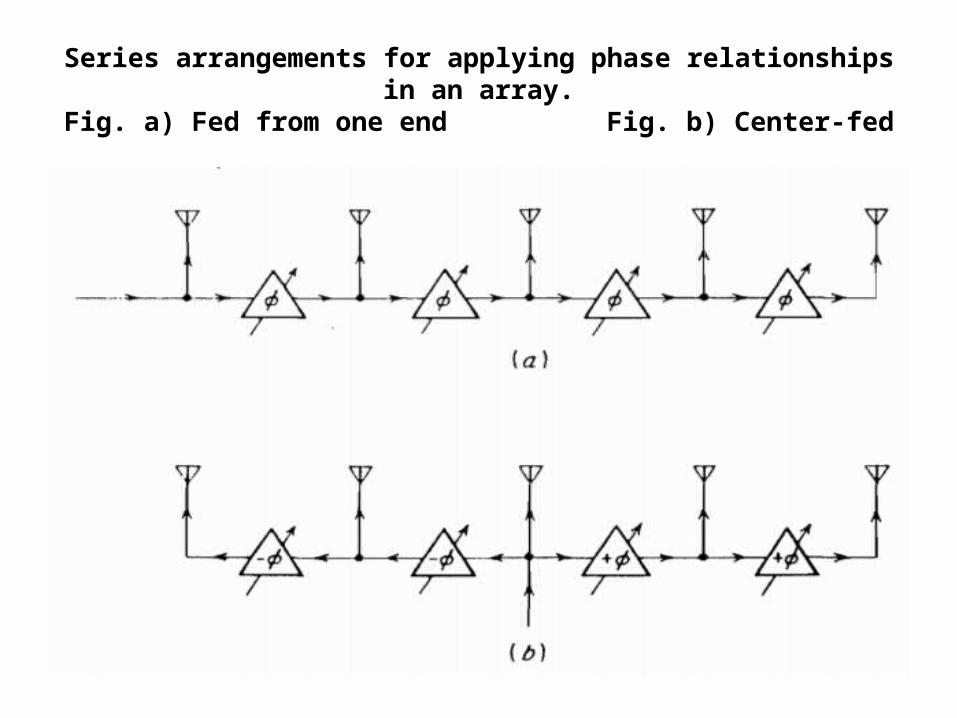
Series arrangements for applying phase relationships in an array.Fig. a) Fed from one end Fig. b) Center-fed