Radar Rain-Rate Estimators and Their Variability due to ... - jamc.pdfNOAA’s Hydrometeorology...
14
Radar Rain-Rate Estimators and Their Variability due to Rainfall Type: An Assessment Based on Hydrometeorology Testbed Data from the Southeastern United States SERGEY Y. MATROSOV Cooperative Institute for Research in Environmental Sciences, University of Colorado, and Physical Sciences Division, NOAA/Earth System Research Laboratory, Boulder, Colorado ROBERT CIFELLI,PAUL J. NEIMAN, AND ALLEN B. WHITE Physical Sciences Division, NOAA/Earth System Research Laboratory, Boulder, Colorado (Manuscript received 1 October 2015, in final form 7 March 2016) ABSTRACT S-band profiling (S-PROF) radar measurements from different southeastern U.S. Hydrometeorology Testbed sites indicated a frequent occurrence of rain that did not exhibit radar bright band (BB) and was observed outside the periods of deep-convective precipitation. This common nonbrightband (NBB) rain contributes ;15%–20% of total accumulation and is not considered as a separate rain type by current precipitation-segregation operational radar-based schemes, which separate rain into stratiform, convective, and, sometimes, tropical types. Collocated with S-PROF, disdrometer measurements showed that drop size distributions (DSDs) of NBB rain have much larger relative fractions of smaller drops when compared with those of BB and convective rains. Data from a year of combined DSD and rain-type observations were used to derive S-band-radar estimators of rain rate R, including those based on traditional reflectivity Z e and ones that also use differential reflectivity Z DR and specific differential phase K DP . Differences among same-type es- timators for mostly stratiform BB and deep-convective rain were relatively minor, but estimators derived for the common NBB rain type were distinct. Underestimations in NBB rain-rate retrievals derived using other rain-type estimators (e.g., those for BB or convective rain or default operational radar estimators) for the same values of radar variables can be on average about 40%, although the differential phase-based estimators are somewhat less susceptible to DSD details. No significant differences among the estimators for the same rain type derived using DSDs from different observational sites were present despite significant separation and differing terrain. Identifying areas of common NBB rain could be possible from Z e and Z DR measurements. 1. Introduction Errors of radar-based quantitative precipitation esti- mation (QPE) at the ground are caused by a number of different factors, including radar calibration un- certainties, partial beamfilling and blockage, vertical changes in observed variables between radar resolution volumes and the ground, and variability in drop size distributions (DSDs) that modify mean relations be- tween rainfall and radar variables. The DSD variability results in changes in relations between rain rate R and the equivalent radar reflectivity factor on horizontal polarization Z eh (hereinafter, just reflectivity Z e ), which are used in the traditional radar-based QPE methods and also in relations that additionally utilize polarimet- ric radar variables such as differential reflectivity Z DR and the specific differential phase shift K DP (e.g., Bringi and Chandrasekar 2001). For the continental United States, the Multi-Radar Multi-Sensor (MRMS) system, which was built using components of the National Mosaic and Multi-Sensor QPE (NMQ) system and which utilizes National Weather Service ground-based scanning S-band (;3 GHz) Weather Surveillance Radar-1998 Doppler (WSR-88D) measurements, uses several default Z e –R relations (e.g., Zhang et al. 2011), including those for convective rain (Z e 5 300R 1.4 ; Z e is in mm 6 m 23 and R is in millimeters per hour), stratiform rain (Z e 5 200R 1.6 ), Corresponding author address: Sergey Y. Matrosov, R/PSD2, 325 Broadway, Boulder, CO 80305. E-mail: [email protected] JUNE 2016 MATROSOV ET AL. 1345 DOI: 10.1175/JAMC-D-15-0284.1 Ó 2016 American Meteorological Society
Transcript of Radar Rain-Rate Estimators and Their Variability due to ... - jamc.pdfNOAA’s Hydrometeorology...

Radar Rain-Rate Estimators and Their Variability due to Rainfall Type:An Assessment Based on Hydrometeorology Testbed Data from
the Southeastern United States
SERGEY Y. MATROSOV
Cooperative Institute for Research in Environmental Sciences, University of Colorado, and Physical Sciences
Division, NOAA/Earth System Research Laboratory, Boulder, Colorado
ROBERT CIFELLI, PAUL J. NEIMAN, AND ALLEN B. WHITE
Physical Sciences Division, NOAA/Earth System Research Laboratory, Boulder, Colorado
(Manuscript received 1 October 2015, in final form 7 March 2016)
ABSTRACT
S-band profiling (S-PROF) radar measurements from different southeastern U.S. Hydrometeorology
Testbed sites indicated a frequent occurrence of rain that did not exhibit radar bright band (BB) and was
observed outside the periods of deep-convective precipitation. This common nonbrightband (NBB) rain
contributes ;15%–20% of total accumulation and is not considered as a separate rain type by current
precipitation-segregation operational radar-based schemes, which separate rain into stratiform, convective,
and, sometimes, tropical types. Collocated with S-PROF, disdrometer measurements showed that drop size
distributions (DSDs) of NBB rain have much larger relative fractions of smaller drops when compared with
those of BB and convective rains. Data from a year of combinedDSD and rain-type observations were used to
derive S-band-radar estimators of rain rateR, including those based on traditional reflectivityZe and ones that
also use differential reflectivity ZDR and specific differential phase KDP. Differences among same-type es-
timators for mostly stratiform BB and deep-convective rain were relatively minor, but estimators derived for
the common NBB rain type were distinct. Underestimations in NBB rain-rate retrievals derived using other
rain-type estimators (e.g., those for BB or convective rain or default operational radar estimators) for the
same values of radar variables can be on average about 40%, although thedifferential phase-based estimators are
somewhat less susceptible toDSD details. No significant differences among the estimators for the same rain type
derived using DSDs from different observational sites were present despite significant separation and differing
terrain. Identifying areas of common NBB rain could be possible from Ze and ZDR measurements.
1. Introduction
Errors of radar-based quantitative precipitation esti-
mation (QPE) at the ground are caused by a number of
different factors, including radar calibration un-
certainties, partial beamfilling and blockage, vertical
changes in observed variables between radar resolution
volumes and the ground, and variability in drop size
distributions (DSDs) that modify mean relations be-
tween rainfall and radar variables. The DSD variability
results in changes in relations between rain rate R and
the equivalent radar reflectivity factor on horizontal
polarization Zeh (hereinafter, just reflectivity Ze), which
are used in the traditional radar-based QPE methods
and also in relations that additionally utilize polarimet-
ric radar variables such as differential reflectivity ZDR
and the specific differential phase shift KDP (e.g., Bringi
and Chandrasekar 2001).
For the continental United States, the Multi-Radar
Multi-Sensor (MRMS) system, which was built using
components of the National Mosaic and Multi-Sensor
QPE (NMQ) system and which utilizes National
Weather Service ground-based scanning S-band
(;3GHz) Weather Surveillance Radar-1998 Doppler
(WSR-88D) measurements, uses several default Ze–R
relations (e.g., Zhang et al. 2011), including those for
convective rain (Ze 5 300R1.4; Ze is inmm6m23 and R is
in millimeters per hour), stratiform rain (Ze 5 200R1.6),
Corresponding author address: Sergey Y. Matrosov, R/PSD2,
325 Broadway, Boulder, CO 80305.
E-mail: [email protected]
JUNE 2016 MATROSOV ET AL . 1345
DOI: 10.1175/JAMC-D-15-0284.1
� 2016 American Meteorological Society

and warm ‘‘tropical’’ rain (Ze5 230R1.25). The stratiform
WSR-88D relation is often referred to as the Marshall–
Palmer relation (Marshall et al. 1955). Snowflake melting
is one of the dominant mechanisms for stratiform-rainfall
formation, and this rainfall type typically exhibits the
radar bright band caused by mixed-phase hydrometeors in
the melting layer. The convective WSR-88D relation repre-
sents the ‘‘Miami’’ relation fromWoodley (1970). The Ze 5230R1.25 relation, which is based on observed tropical rainfall
DSDs, was proposed for C-band (;5GHz) frequencies by
Rosenfeld et al. (1993) for monsoon, convective maritime
rain regimes, and continental squall lines. Algorithms that
are based on radarmeasurements were developed (e.g.,
Qi et al. 2013) to segregate observed rainfall into either
stratiform or convective type so that a corresponding
Ze–R relation can be applied. Rain-rate estimators that
use polarimetric radar variables are also expected to be
sensitive to rainfall type, although this sensitivity has
yet to be assessed in relative detail.
NOAA’s Hydrometeorology Testbed (HMT) pro-
gram maintains ground-based sites that provide es-
sential meteorological and hydrological observations.
Some of these sites are equipped with vertically
pointing S-band (;3GHz) profilers (S-PROFs), which
provide 60-m vertical resolution reflectivity and
Doppler velocity profiles. The averaging time for one
profile is typically about 1–1.3min (depending on the
S-PROF configuration). The S-PROF measurements
allow a robust classification of precipitation types, in-
cluding brightband (BB) stratiform-like rainfall, non-
brightband (NBB) rainfall, and also an NBB-rainfall
portion representing deep convection, which generally
corresponds to convective rain according to opera-
tional radar-based segregation algorithms (e.g., Qi
et al. 2013). Different aspects of the S-PROF-based
rainfall-type classification scheme are given by White
et al. (2003). The only subjective part of this scheme is
identifying deep-convective rainfall. For the purpose of
this study, the BB rain classified using this scheme is
considered a single category without subdividing it into
smaller subcategories [e.g., a ‘‘hybrid’’ BB-rain sub-
category as in White et al. (2003)] depending on the
reflectivity slope below the melting layer. In the dataset
used in this study, BB rain with a general increase of
reflectivity toward the ground contributed;95% of the
total BB-rain accumulation.
Earlier studies utilizing one winter season of data
from coastal sites in California from the HMT-West
(Martner et al. 2008) program (http://hmt.noaa.gov)
indicated that a significant portion of total precipitation
that results in NBB rainfall is characterized by DSDs
that differ markedly from those of BB stratiform-like
rainfall. Relative to BB rainfall, NBB rainfall contained
larger fractions of smaller drops, which was likely (as
these authors suggested) due to orographically forced
hydrometeor growth processes. The corresponding
NBB-rainZe–R relations derived for coastal HMT-West
areas were very different from default WSR-88D re-
lations. The results of the study by Martner et al. (2008)
were based on radar-profiler and collocated DSD mea-
surements at two coastal HMT-West sites.
The main objective of this study is to investigate the
influence of rainfall types on S-band Ze–R–based and
polarimetric rain-rate estimators using collocated
S-PROF-based rain-type differentiation and collocated
DSD measurements conducted at the HMT south-
eastern sites located in mountainous and flat-terrain
environments in North Carolina. The HMT southeastern
sites were deployed as part of the HMT-Southeast Pilot
Study (HMT-SEPS), aimed at identifying leading
sources of error in quantitative precipitation forecasts
(QPF) and QPE in this region. Other goals of this study
are to provide information on occurrences over the
annual cycle and intensities of different rain types and
to evaluate the possibility of distinguishing between
BB and NBB rain observed outside the deep-
convection periods on the basis of WSR-88D polari-
metric measurements. The term ‘‘common NBB rain’’
is hereinafter used in this study for this NBB rain type
that excludes deep-convective rain, which is typically
characterized by high-reflectivity cores (;30–35 dBZ)
above the freezing level.
2. Observational sites and datasets
Data from two HMT-SEPS sites in North Carolina
were collected using the S-PROF radars and collocated
ground-based disdrometers, tipping-bucket rain gauges,
and standard surface meteorological instruments. One
site was located near New Bern (EWN) in a coastal lo-
cation [35.0788N, 77.0468W; 3m above mean sea level
(MSL)] with flat terrain surrounding it. The other site at
Old Fort (OFT) was located;470 kmwest-northwest of
EWN in a mountainous region of the Appalachian
foothills (35.6438N, 82.1618W; 427m MSL). The HMT
site at Hankins (HKS), located near OFT, lacked an
S-PROF radar but had disdrometer and standard mete-
orological measurements. The general area of the HMT-
Southeast has nine WSR-88D systems (see Fig. 1).
Rainfall at EWN and OFT was observed by quality-
controlled Particle Size and Velocity (Parsivel) optical
disdrometers (Löffler-Mang and Joss 2000) that re-
corded DSD spectra every 2min. An annual cycle of the
observed rainfall data (10 August 2013–9 August 2014)
is used in this study, although the OFT Parsivel mal-
functioned from 30 May to 9 July 2014 (the
1346 JOURNAL OF APPL IED METEOROLOGY AND CL IMATOLOGY VOLUME 55

corresponding data were not used). Rare snowfall and
mixed-phase precipitation data observed at OFT and
EWN were excluded from the analysis.
Rainfall accumulations for individual events derived
from the Parsivel disdrometer DSD spectra and collo-
cated standard tipping-bucket-type meteorological
gauges were generally in agreement to within 10%–15%.
A close agreement of Parsivel rain-rate retrievals and
those from robust 2D-video-disdrometer measurements
(at least for not-very-heavy rainfall for which large and
nonfully melted hydrometeors can be present) was also
noted by Thurai et al. (2011). It provides an additional
indication for suitability of the Parsivel disdrometer data
in deriving rain rates that are approximately proportional
to the 3.7th DSD moment for drops smaller than ap-
proximately 3.5mm (e.g.,Matrosov 2005).While smaller-
drop parameter estimates from Parsivel disdrometers
(especially for the older disdrometer models) are gener-
ally less reliable than those for larger-drop estimates
(Löffler-Mang and Joss 2000), uncertainties of their
contribution to the higher DSD moments (i.e., rain rate
and especially reflectivity, which is proportional to the
sixth DSD moment for frequencies considered in this
study) are not expected to be crucial.
S-PROF vertically pointing measurements were used
to classify rain types in half-hour periods on the basis of
profile-by-profile analysis using the technique described
by White et al. (2003). If several different rain types
were observed during a particular 30-min period, the
rain type with more clearly defined profiles was assigned
to the entire half-hour period. An example of the EWN
S-PROF measurements for 27–28 June 2014 is shown in
Fig. 2. Periods of BB and common NBB rain are ob-
served during the last three hours on 27 June 2014 and
between approximately 1500 and 1700 UTC on
28 June 2014, respectively. Prior to BB rain on 27 June
2014, a heavy convective-core shower is observed
between around 1800 and 1920 UTC. This shower is
FIG. 1. A map showing the EWN, OFT, and HKS HMT-SEPS Physical Sciences Division
(PSD) observational sites and locations of nearby WSR-88D units.
FIG. 2. An example of S-PROF observations on 27–28 Jun 2014 at EWN.Different types of rain
are seen as described in the text. Note that time in the figure progresses from right to left.
JUNE 2016 MATROSOV ET AL . 1347

characterized by the lack of a pronounced bright band
and strong radar echo cores observed above the envi-
ronmental freezing level, which for this event was lo-
cated at;4.4 kmMSL (i.e.,;200m above the middle of
the bright band). Although radar echoes for common
NBB rain observed on 28 June 2014 do not extend very
high, which suggests the dominance of warm-rain pro-
cesses, sometimes echo tops of this rain type can be
noticeably higher than the environmental freezing level
(e.g., Matrosov et al. 2014). The convective-core rainfall,
which is specifically segregated in the WSR-88D-based
QPE schemes, and common NBB rain, which is usually
not considered as a distinct rain type by the radar-based
QPE algorithms, lack an identifiable radar bright band.
Table 1 presents the total accumulations and mean
rain rates and S-band reflectivities inferred from dis-
drometer measurements at the EWN and OFT sites for
different rain types as classified using the S-PROF
measurements. The total amounts of rainfall during the
annual period between 10 August 2013 and 9 August
2014 were similar at both sites (;1000–1200mm), with a
little more (less) than one-half of the total resulting from
BB rain at OFT (EWN). Similar fractions of BB rain in
total rainfall accumulations were also observed during
precipitation associated with cool-season atmospheric
river landfalls at the California coast (Matrosov et al.
2014).When comparedwithHMT-West, deep-convective
rain at the HMT-SEPS sites contributes more signifi-
cantly to the totals, with a noticeably higher fraction at
the coastal site (i.e., ;38% and 23% of total accu-
mulations at the EWN and OFT sites, respectively).
Contributions of common NBB rain, which is ob-
served more often than convective rain, are also sig-
nificant (i.e.,;15% and 20% of total accumulations at
EWN and OFT, respectively).
Microphysical differences among different rain types
are evident in Fig. 3, which shows their mean DSDs as a
function of the Parsivel bin size. These DSD represen-
tations were obtained by averaging drop counts for each
disdrometer size bin while accounting for the bin width.
All observed DSDs for a given rain type resulting in
S-band Ze of greater than 15dBZ were used for calcu-
lating mean DSDs. This reflectivity threshold roughly
corresponds to precipitation rates of 0.3–0.5mmh21,
which are typically associated with moderate to heavier
drizzle (Huschke 1959). Although BB rain and common
NBB rain have similar mean intensities (R of
;3.5mmh21), the former rain type, as seen from Fig. 3,
is typically characterized by a significantly smaller
(greater) relative fraction of small (large) drops than the
latter one (even though Parsivel smaller-drop counts
might be underestimated). This distinction results in
differing typical reflectivities of these rain types, with
meanZe values for BB rain being higher when compared
with common NBB rain of similar rain rate.
Deep-convective NBB rain (hereinafter, just convec-
tive rain) at both observational sites is more intense,
although general shapes of BB and convective-rain drop
size spectra are somewhat similar (except for larger drop
counts in convective rain). Even though some rain (es-
pecially convective rain) was missed during the 40-day
OFTParsivel outage period, all particular rain-type (i.e.,
BB, common NBB, and convective NBB rain) mean
DSDs are in close agreement at both sites in terms of
TABLE 1. Total accumulations and mean rain rates and reflectivities at the EWN andOFT sites for different types of rain according to the
Parsivel and gauge data.
Rain type BB rain Convective NBB common
EWN Parsivel/gauge 10 Aug 2013–9 Aug 2014 465mm/470mm 435mm/394mm 163mm/149mm
OFT Parsivel/gauge 10 Aug 2013–9 Aug 2014,
excluding 30 May 2013–9 Jul 2014
605mm/625mm 89mm/103mm 159mm/174mm
OFT gauge 30 May 13–9 Jul 14 36mm 169mm 61mm
EWN Parsivel mean R and Ze 3.2mmh21; 34.0 dBZ 13.3mmh21; 43.1 dBZ 3.8mmh21; 31.2 dBZ
OFT Parsivel mean R and Ze 3.6mmh21; 34.2 dBZ 13.6mmh21; 43.3 dBZ 3.5mmh21; 30.5 dBZ
FIG. 3. Mean DSDs observed at the HMT-Southeast OFT and
EWN sites for different types of rain during a 1-yr period between
10 Aug 2013 and 9 Aug 2014.
1348 JOURNAL OF APPL IED METEOROLOGY AND CL IMATOLOGY VOLUME 55

drop spectra shape and counts (see Fig. 3). This agree-
ment suggests a similarity of rainfall formation processes
for a given rain type, despite the fundamentally different
geographic characteristics at these two sites. The dif-
ferences in the mean EWN and OFT DSDs for com-
binedNBB rain, which includes convective and common
NBB parts, are due to differing convective-rain fractions
at these sites.
Disdrometer-derived DSDs are used in this study for
obtaining Ze–R relations and polarimetric rain-rate es-
timators in the next sections. Utilizing measured DSDs
without fitting observations by analytical functions such
as the gamma function, which is often used for de-
scribing raindrop DSDs, provides a more direct way of
developing QPE approaches since it avoids uncertainties
caused by fitting experimental data to approximately
match predetermined functional shapes. Also, several
recent studies (e.g., Adirosi et al. 2014, 2015; Ekerete
et al. 2015) have questioned the adequacy of the gamma-
function distribution for representing the natural vari-
ability of DSDs.
3. Reflectivity-based rain-rate estimators fordifferent rain types
Figure 4 shows scatterplots of S-band reflectivity
(assuming a beam tilt of 0.58) versus rain rate as de-
rived from the yearlong Parsivel DSD measurements
at different HMT-SEPS sites. DSD-based calcula-
tions allow for concurrent high-temporal-resolution
(;2min) estimates of different radar variables and
rain rates. The T-matrix calculations (e.g., Waterman
1965) and the spheroidal-drop-shape mean aspect
ratio model from Brandes et al. (2005) were used for
calculating radar variables using observed DSD
spectra. In addition to the S-PROF locations at EWN
and OFT, the data are shown also for the HKS site
that is located just 15 km from the OFT site in similar
terrain (see Fig. 1). The lack of an S-PROF at the
HKS site precluded rain-type differentiation at that
site. The all-rain-data scatterplots and best Ze–R re-
lations at HKS and OFT, however, are very close,
which supports an assumption that the OFT
Parsivel outage period did not significantly affect the
overall DSD statistics at this site. The mean all-rainZe–R
relations for OFT and HKS are also close to that at the
EWN coastal site despite the differing terrain and the
;470-km separation.
Since the S-PROF measurements at EWN and OFT
provided rain-type partitioning, Ze–R relations for dif-
ferent rain types could be derived using DSDsmeasured
at these sites. These relations are shown in Table 2 and
Fig. 5. They were derived using a customary power-law
least squares regression approach assuming Ze as an
independent variable but are presented in a traditional
form (i.e.,Ze5 aRb). It can be seen that relations for the
same rain type at both EWN and OFT are similar. For
BB, NBB common, and convective rains these relations
at both sites provide rain-rate estimates that are mostly
within about 20%, 10%, and 12%, respectively, when
reflectivities vary in the 15–53-dBZ range (note that a
FIG. 4. The Ze–R scatterplots for all rain data as based on the
Parsivel DSD measurements that resulted in Ze . 15 dBZ at the
(a) EWN, (b) OFT, and (c) HKS sites.
JUNE 2016 MATROSOV ET AL . 1349

53-dBZ reflectivity value is often considered to be a
threshold for hail detection). For each rain-rate esti-
mator, Table 2 also shows values of the normalized
mean absolute difference (NMAD), which is defined as
NMAD5 hjRD2R
Eji/hR
Di3 100%, (1)
where RD and RE are rain rates measured by the dis-
drometer and calculated using a particular estimator,
respectively, and angle brackets indicate averaging
over all data points. The NMAD value characterizes
the data scatter with respect to the best-fit relation and
serves as a measure of the estimator ‘‘quality’’ for a
given dataset.
Also relatively close are Ze–R relations for BB and
convective rains even though convective-core rainfall
is characterized by significantly higher mean re-
flectivities and rain rates when compared with BB rain
(see data in Table 1 and Fig. 3). Because of general
nonlinearity of the Ze–R relations, mean values of rain
rate and reflectivity do not exactly correspond to each
TABLE2.S-bandZe5
aRb,R5
cZd eZ
f dr,ZDR5
pZ
u e,andR5
gK
h DPrelationsandtheNMAD
characterizingdifferentrain-rate
estim
ators
derivedfrom
disdrometerDSDsforfour
differentrain
typesatthreeHMT-Southeast
sites(R
isin
millimeters
perhour,Zeisin
mm
6m
23exceptthatin
theZDR–ZerelationsZeisin
unitsof‘‘dBZ,’’K
DPisin
degreesper
kilometer,ZDRisin
decibels,andZdrisdim
ensionless).TheBrandes
etal.(2005)dropaxisratio–size
relationwasassumed.
Allrain
BBrain
Convective
NBBcommon
EW
N
Ze5
213R1.70(Z
e–RNMAD
537%);R5
0.0120Z
0:86
eZ
23:4
dr
(R–ZeZdrNMAD
518%);
ZDR5
4.733
1025Z
2:77
e;R5
42.0K
0:77
DP
(R–K
DPNMAD
521%
)
Ze5
253R
1.71(Z
e–R
NMAD
531%);
R5
0.0097Z
0:88
eZ
23:3
dr
(R–ZeZdr
NMAD
515%);ZDR5
6.373
1025Z
2:72
e;R5
42.2K
0:81
DP(R
–K
DP
NMAD
518%)
Ze5
203R
1.65(Z
e–RNMAD
530%
);R5
0.0093Z
0:89
eZ
23:4
dr
(R–ZeZdrNMAD
514%
);
ZDR5
5.643
1025Z
2:69
e;R5
41.3K
0:75
DP
(R–K
DPNMAD
518%)
Ze5
90R1.60(Z
e–RNMAD
529%);R
50.047Z
0:72
eZ
23:4
dr
(R–ZeZdrNMAD
517%);
ZDR5
3.193
1025Z
2:71
e;R5
51.7K
0:65
DP
(R–K
DPNMAD
517%
)
OFT
Ze5
173R1.70(Z
e–RNMAD
533%);R5
0.0131Z
0:85
eZ
23:3
dr
(R–ZeZdrNMAD
518%);
ZDR5
4.953
1025Z
2:73
e;R5
40.8K
0:73
DP
(R–K
DPNMAD
520%
)
Ze5
201R
1.67(Z
e–R
NMAD
527%);
R5
0.0117Z
0:85
eZ
23:0
dr
(R–ZeZdr
NMAD
515%);ZDR5
7.113
1025Z
2:65
e;R5
40.5K
0:75
DP(R
–K
DP
NMAD
516%)
Ze5
238R
1.60(Z
e–RNMAD
526%
);R5
0.0092Z
0:90
eZ
23:7
dr
(R–ZeZdrNMAD
513%
);
ZDR5
5.803
1025Z
2:71
e;R5
40.0K
0:73
DP
(R–K
DPNMAD
516%)
Ze5
86R1.65(Z
e–RNMAD
530%);R
50.050Z
0:72
eZ
23:9
dr
(R–ZeZdrNMAD
516%);
ZDR5
3.273
1025Z
2:70
e;R5
46.5K
0:65
DP
(R–K
DPNMAD
517%
)
HKS
Ze5
174R1.69(Z
e–RNMAD
534%);R5
0.0109Z
0:87
eZ
23:5
dr
(R–ZeZdrNMAD
517%);
ZDR5
4.413
1025Z
2:76
e;R5
40.5K
0:72
DP
(R–K
DPNMAD
522%
)
——
—
FIG. 5. S-band Ze–R relations for convective and (a) BB and
(b) common NBB rain types derived using DSDs measured at the
EWN and OFT sites. WSR-88D default relations are also shown
for comparison.
1350 JOURNAL OF APPL IED METEOROLOGY AND CL IMATOLOGY VOLUME 55

other according to these relations. A relative similarity
of BB-rain and convective-rain relations can be ex-
plained, in part, by the similarity of their typical DSD
spectra shapes (but not the actual drop counts), as
discussed in the previous section. Observed convective-
rain DSDs have higher drop counts for both smaller
and larger drops than do BB-rain DSDs. It results in an
increase of both Ze and R, and therefore the resulting
Ze–R relations are not widely different for these
rain types.
For the reflectivity interval 40 , Ze , 53 dBZ (i.e., a
typical reflectivity range for convective rain), R esti-
mates from convective-rain Ze–R relations derived for
both observational sites are generally higher by about
10%–20% than those obtained from the BB-rain Ze–R
relations (Fig. 5). This is similar to theWSR-88D default
convective-relation and stratiform-relation difference,
which, for this reflectivity interval, varies approximately
between 5% and 30%. Some larger differences between
convective-rain and BB-rain Ze–R relations for tropical
regions were reported previously (e.g., Tokay and Short
1996; Atlas et al. 1999; Thompson et al. 2015). Weak,
shallow convection was part of the convective-rain cat-
egory in some of these previous studies.
The WSR-88D default stratiform relation Ze 5200R1.6, which is used operationally (e.g., Zhang et al.
2011), approximates BB-rain and convective-rain re-
lations for the EWN and OFT sites relatively well
(Fig. 5a), even though some average rainfall over-
estimation can be expected when using this default re-
lation (e.g., about 10% and 20% for reflectivities of 30
and 50dBZ, respectively). The WSR-88D default con-
vective relation (Ze 5 300R1.4), however, provides more
significant mean overestimation (e.g., ;40% for con-
vective rainfall observed at a 50-dBZ reflectivity level).
Between approximately the 30- and 45-dBZ re-
flectivities these two defaultWSR-88D relations provide
rain-rate estimates that are within approximately 10%
of each other.
The common NBB rain, which is not differentiated by
the WSR-88D QPE approaches as a separate rain type,
is characterized by markedly different Ze–R relations
than both convective and BB rainfall (Fig. 5b). Al-
though the exponents b in the Ze 5 aRb relations for all
rain types are similar (;1.6–1.7), the prefactors a for
common NBB rain are smaller by about a factor of 2.5
than those for other rain types (see Table 2). This is
primarily due to the larger fraction of smaller drops in
the common NBB rain (relative to other rain types). It
results in reflectivities for this rain type being on average
about 3–4dB smaller than those for BB (or convective)
rain of similar intensity and is manifested by a shift of
common NBB-rain relations relative to other relations
as seen in Fig. 5b. When the WSR-88D standard
stratiform-rain relation is used for QPE in common
NBB rain (which would be the case when rain is not
classified as convective or warm using existing segrega-
tion approaches), an underestimation of rain rate by
about 40% can be expected given that other factors
[e.g., a vertical profile of reflectivity (VPR), radar cali-
bration, and beamfilling issues] are adequately ad-
dressed. Significant underestimation is also expected if
the WSR-88D warm-rain relation is used for typical
commonNBB-rain reflectivities (e.g.,;35%at 30dBZ).
Similar distinctions between common NBB-rain and
BB-rain Ze–R relations were observed in cold-season
California rains (Martner et al. 2008). These authors
suggested that restrained growth of hydrometeors (i.e.,
larger fractions of smaller drops) during NBB-rain
periods may be a result of orographically forced con-
densation and coalescence processes. Results obtained
here suggest that the NBB rain is also regularly ob-
served in other geographical areas, including those with
flat topography (e.g., the EWN site) where orographic
effects are not expected to play a significant role.
4. Polarimetric rain-rate estimators for differentrain types
TheZe–R relations have been used for deriving radar-
based QPE for a number of decades (e.g., Doviak
and Zrnic 1993). Although reflectivity-based relations
remain a viable option for deriving radar-based QPE, a
recent polarization upgrade of the WSR-88D network
provides opportunities for quantitative use of newly
available polarimetric radar variables when retrieving
rain rates. These new variables primarily include dif-
ferential reflectivity Zdr, which represents the linear
ratio of reflectivities at horizontal and vertical polari-
zations and is measured directly, and the specific dif-
ferential phase shift KDP, which is derived from
measurements of differential phase between horizon-
tally and vertically polarized radar signals. The use of
Ze–Zdr measurements provides an additional constraint
when compared with reflectivity-only measurements,
which can lead to more accurate rain-rate estimates.
Polarimetric estimators used with WSR-88D measure-
ments are conventionally expressed as power-law re-
lations (e.g., Bringi and Chandrasekar 2001):
R5 cZdeZ
fdr and (2)
R5 gKhDP , (3)
whereR is in millimeters per hour,Ze is inmm6m23, and
positive values ofKDP are in degrees per kilometer. The
dimensionless ratioZdr can be simply expressed in terms
JUNE 2016 MATROSOV ET AL . 1351

of the traditional logarithmic unit differential re-
flectivity: ZDR (dB) 5 10 log10(Zdr).
a. R(Ze, Zdr) estimators
Since values of differential reflectivity in rain are re-
lated to the characteristic drop size, such as the mass-
weighted drop size or the median volume drop size (e.g.,
Seliga and Bringi 1976), Zdr constraints could lead to
improvements of radar-based QPE even though there
is a certain statistical correspondence between Ze and
Zdr values. These values are also related on average
because heavier rainfall is usually associated with larger
drops. Figure 6 illustrates ZDR–Ze relations where cal-
culations of reflectivity and differential reflectivity using
DSDs for all rain types observed at the EWN and OFT
sites are shown. Table 2 also shows best power-law fits
for these relations obtained for different rain types.
Although different dropmean aspect ratio assumptions
cause very little relative change in calculated Ze values,
they affect ZDR values to a stronger degree. To illustrate
the sensitivity of differential reflectivity calculations to
the assumption of drop shapes, in addition to the data
obtainedwith the Brandes et al. (2005) drop aspect ratios,
Figs. 6a and 6b also show calculations using results from
another experimental study of drop mean aspect ratio–
size correspondence from Thurai et al. (2007). As can be
seen from these figures, the drop-shape model sensitivity
is relatively modest, and the best ZDR–Ze power-law fits
derived using the Brandes et al. (2005) and Thurai et al.
(2007) drop mean aspect ratio–drop size models (i.e., the
black and pink curves in Figs. 6a and 6b) are close. The
Ze–ZDR scatterplots for the DSD data from EWN and
OFT are very similar, with their respective differences in
the ZDR–Ze fits being generally within 0.2dB.
The R(Ze, Zdr) estimator in Eq. (2), which has been
used with WSR-88D polarimetric measurements, has
coefficients c 5 0.0067, d 5 0.93, and f 5 23.43
(Berkowitz et al. 2013). These particular coefficient
values found in Bringi and Chandrasekar (2001, section
8.1.1) were obtained using T-matrix simulations for as-
sumed theoretical gamma-function DSDs with in-
dependently varying parameters of this function (i.e.,
the gamma-function shape parameter, the median vol-
ume drop diameter, and the gamma-function ‘‘in-
tercept’’ parameter). Interdependencies of different
gamma-function parameters, however, might exist as
indicated by analyses of observed DSDs (Brandes et al.
2003). Also natural DSD ensembles have certain sta-
tistical properties (e.g., correlations, means as in Fig. 3,
and standard deviations) that are generally not ac-
counted for when gamma-function parameters are var-
ied independently within a predetermined range of their
possible variability. In this study, the coefficients in
Eq. (2) were obtained using experimentally measured
DSD spectra rather than modeled ones.
Rain-type-dependent R(Ze, Zdr) estimators were de-
rived using the least squares multiple regression analysis
and 1 year of Parsivel DSD spectra data from different
FIG. 6. Scatterplots of S-band differential reflectivity–horizontal
polarization reflectivity and corresponding power-law best fits
calculated using (a) EWN and (b) OFT site all-rain DSDs. (c) The
combined EWN and OFT data scatterplot for BB and common
NBB rain obtained using the Brandes et al. (2005) drop mean as-
pect ratios. The black line in (c) shows results from Eq. (4).
1352 JOURNAL OF APPL IED METEOROLOGY AND CL IMATOLOGY VOLUME 55

HMT-Southeast observational sites. The respective
rain-rate estimators are shown in Table 2 with co-
efficients derived using the Brandes et al. (2005) mean
spheroidal drop aspect ratio–size relation. Because of
noisiness of differential reflectivity measurements, the
use of R(Ze, Zdr) estimators could be more practical for
moderate and heavier rainfall when ZDR values are not
too small (i.e., drops are not too spherical), and there-
fore Table 2 shows statistical parameters of these esti-
mators corresponding to R . 5mmh21.
To better visualize these estimators and understand
differences among them, Figs. 7a–c present R values
calculated using R(Ze, Zdr) estimators from Table 2 as a
function of reflectivity Ze for different types of rain. To
assess the impact of Zdr as a second radar variable
influencing estimates of rain rate in events of typical
(for a given Ze), lower, and higher differential re-
flectivity values, Fig. 7a shows R estimates when a typ-
ical expected ZDR value corresponding to the best
power-law ZDR–Ze fits from Table 2 is assumed, and
Fig. 7b (Fig. 7c) shows data when this best-fit ZDR value
is decreased (increased) by 0.5 dB. A 0.5-dB ZDR value
represents a scatter of differential reflectivities around
the bestZDR–Ze fit. Figure 7d depicts the data for typical
Zdr values but using R(Ze, Zdr) estimators with co-
efficients (not shown in Table 2) derived assuming the
Thurai et al. (2007) drop mean aspect ratios rather than
those derived using the Brandes et al. (2005) drop-shape
results.
Comparison of Figs. 7a and 7d allows assessment of
the drop aspect ratio assumption on rain-rate estimates.
It can be seen that this assumption (between the two
aspect ratio models considered here) has only minor
impact on the results when reflectivity varies in a rela-
tively large interval from;20 to;45dBZ. Comparisons
of Figs. 7a–c with Figs. 5a and 5b, which are presented
for the same axis intervals, indicate that QPE results
obtained with rain-type-dependent Ze–R relations are
expected to generally be within those derived using
R(Ze, Zdr) estimators for corresponding rain types when
ZDR varies within approximately 60.5dB from the ex-
pected (for given a Ze) value.
It can also be seen from Fig. 7 that, similar to Ze–R
relations, the common NBB-rain R(Ze, Zdr) estimators
differ noticeably from those for convective and BB rain
types. The use of the default R 5 0.0067Ze0.93Zdr
23.43
WSR-88D estimator provides generally satisfactory re-
sults for those latter rain types, but it will result in QPE
underestimation by as much as a factor of ;2 when
common NBB rain is observed. The underestimation is
expected to be greater for lower reflectivities (e.g., Ze #
35 dBZ). The R(Ze, Zdr) estimators for the BB and
convective rain types provide close results, and there is
no significant dependence on which observational-site
FIG. 7. Rain rates obtained from the S-band R(Ze, Zdr) estimators as a function of reflectivity for (a), (d) mean
expected ZDR for all rain types and for mean expected ZDR (b) decreased and (c) increased by 0.5 dB. Here (a)–
(c) are for the Brandes et al. (2005) drop mean aspect ratio model, and (d) is for the Thurai et al. (2007) drop mean
aspect ratio model.
JUNE 2016 MATROSOV ET AL . 1353
DSDs are used for deriving coefficients in these esti-
mators. As seen from Fig. 7, there is no significant dif-
ference between R(Ze, Zdr) estimators for BB and
convective rain types, at least for reflectivities less than
;45 dBZ.
b. R(KDP) estimators
Rainfall retrieval using specific differential phase shift
KDP is another polarimetric radar approach that has
been usedwithWSR-88Dmeasurements. This approach
has a number of practical advantages (Zrnic and
Ryzhkov 1996), which include independence of radar
absolute calibration, immunity to partial beam blockage
and ground clutter canceling, and ease of isolating ef-
fects of anomalous propagation. The main disadvantage
of this rain-retrieval approach at S-band radar fre-
quencies is thatKDP values are generally small and often
noisy when derived using conventional filtering ap-
proaches (e.g., Hubbert and Bringi 1995) for lighter
rainfall, and therefore their practical use for such rainfall
is often limited except when applied at higher radar
frequencies (e.g., Matrosov et al. 2002, 2006). These
approaches, however, are useful for heavier rainfall, and
especially for deriving rain rates in rain–hail mixtures
(e.g., Balakrishnan and Zrnic 1990; Matrosov et al.
2013). WSR-88D use of R(KDP) estimators includes
estimatingR in suchmixtures using the estimator Eq. (3)
with g 5 44.0 and h 5 0.822 (Berkowitz et al. 2013).
Table 2 shows the R(KDP) estimators obtained using
calculations with the DSDs observed at the HMT-
Southeast sites and assuming the Brandes et al. (2005)
drop aspect ratios. The coefficients g and h in the best
power-law relations in Eq. (3) and the corresponding
NMAD values were derived for the drop spectra that
were characterized by KDP values of greater than a
threshold of 0.18km21. At this threshold, values of
specific differential phase shift obtained from differen-
tial phase shift measurements at S band using filtering
approaches are generally reliable (Matrosov et al. 2006),
although smaller KDP values could also be used in
practice when some additional averaging and special
KDP derivation approaches are applied (e.g., Lim et al.
2013). For the DSD dataset from this study, the number
of DSD spectra for which theoreticalKDP. 0.18km21 is
about 8%, 38%, and 5% of the total amount DSD
spectra with Ze . 15dBZ, for BB, convective NBB, and
common NBB rain, respectively. The choice of the drop
aspect ratio model [i.e., Brandes et al. (2005) aspect
ratio–drop size relation vs the one from Thurai et al.
(2007)] results only in very minor changes of the co-
efficients in the R(KDP) estimators. For different types
of rain, the respective changes in the prefactor g values
are generally within 5%, and the exponent h varies
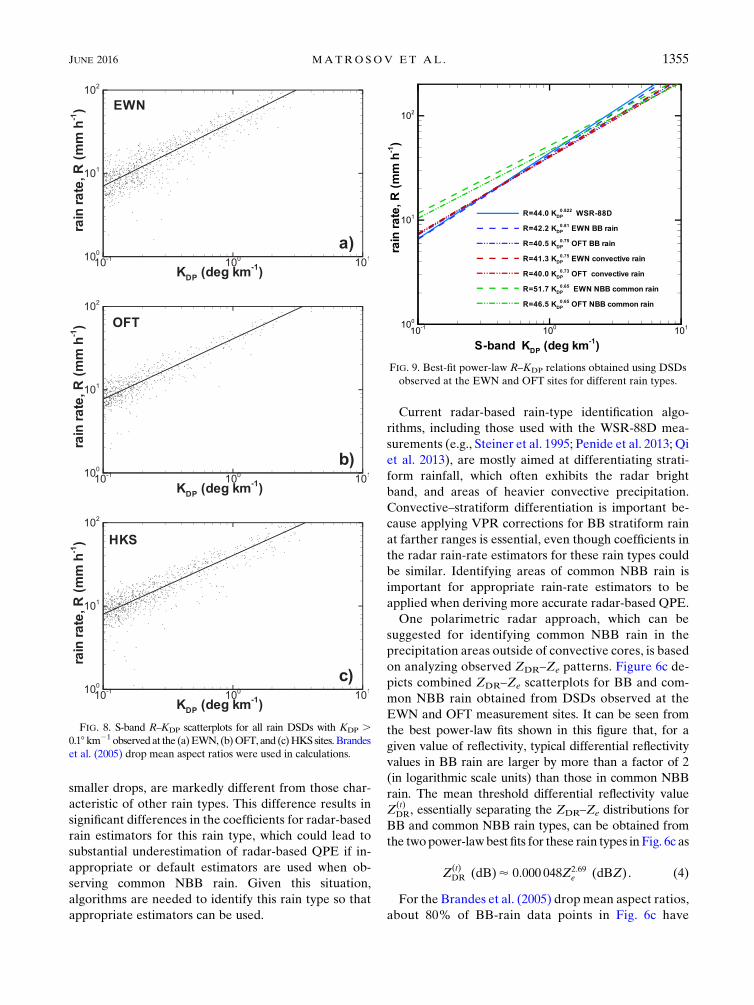
within 0.01 from the values shown in Table 2. Figure 8
shows R–KDP scatterplots for all rain DSDs observed at
EWN, OFT, and HKS. It can be seen that the amount of
data scatter and best power-law fit are very similar at all
the sites.
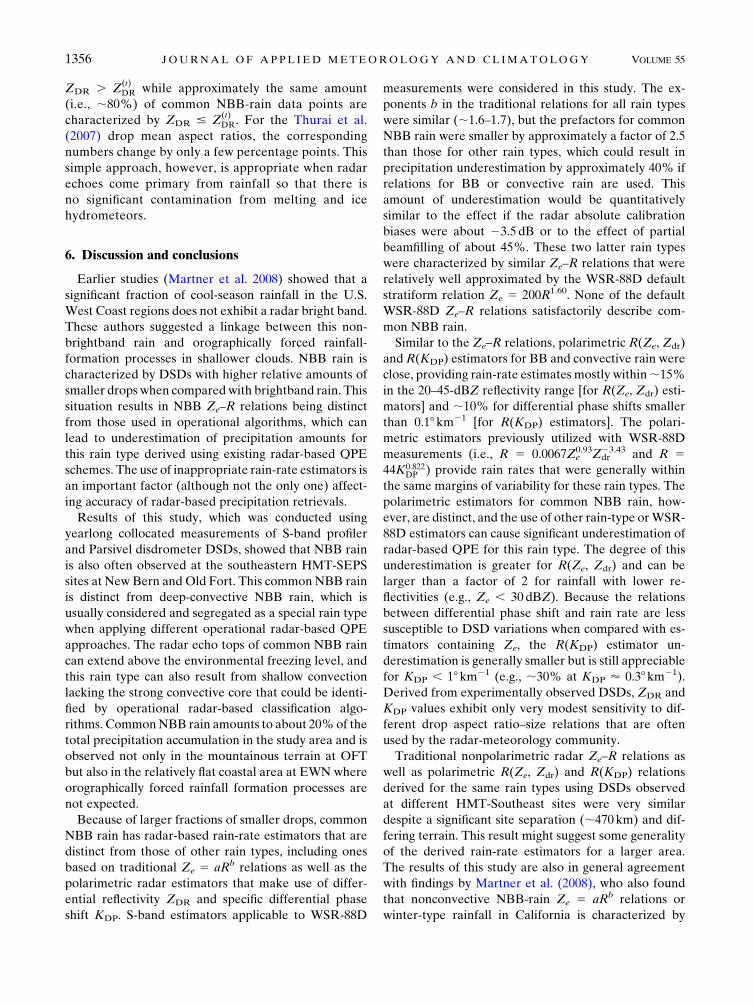
Figure 9 provides graphical comparisons of theR(KDP)
estimators obtained for various rain types and different
observational sites. As with other rain-rate estimators,
which were discussed previously, there are no significant
differences between estimators for the same rain type
derived from DSDs measured at the EWN and OFT
observational sites, even though the KDP thresholding
reduces the number of data points. As before, the esti-
mators for BB and NBB convective rain provide similar
results. The WSR-88D estimator also provides rain-rate
values that are generally close to the ones from BB-rain
and convective-rain estimators from both observational
sites when 0.18 , KDP , 28km21, which corresponds to
rain rates between approximately 7 and 70mmh21.
The coefficients in theR(KDP) estimators for common
NBB rain type are very different from those for other
relations in Table 2, which, in part, is due to the fact that
this rain type contains larger fractions of more spherical
smaller drops (as compared with larger drops that are
more nonspherical). The use of relations derived for BB
or convective rain (and also the WSR-88D relation) can
cause some significant underestimation of common
NBB rain rate for smaller KDP values (e.g., a greater
than 30% underestimation for KDP , 0.38km21). The
relative separation of the common NBB-rain R(KDP)
power-law fits from the fits for the other rain types,
however, is smaller than in the cases of the Ze–R and R
(Ze, Zdr) estimators. This is due, in part, to the fact that
KDP is approximately proportional to the lower DSD
moment (e.g., Zrnic and Ryzhkov 1996; Matrosov et al.
2006), and therefore themoment disparity is not as large
as for the Ze and R pair (i.e., ;6 for Ze and approxi-
mately ;3.67 for R) and specific-phase–rain-rate re-
lations are less susceptible to DSD details than are
relations that contain reflectivity. As seen from Table 2,
NMAD values for KDP-based estimators are very close
those for R(Ze, Zdr) estimators and are smaller than
those forZe–R relations. This result suggests that in their
range of applicability the polarimetric estimators are
potentiallymore accurate than the traditional reflectivity-
based approaches (given that polarimetric radar variables
are reliably measured).
5. Potential for using polarimetric data todifferentiate between BB and commonNBB rain
As shown in section 2, common NBB rain is charac-
terized by DSDs that, because of a larger fraction of
1354 JOURNAL OF APPL IED METEOROLOGY AND CL IMATOLOGY VOLUME 55
smaller drops, are markedly different from those char-
acteristic of other rain types. This difference results in
significant differences in the coefficients for radar-based
rain estimators for this rain type, which could lead to
substantial underestimation of radar-based QPE if in-
appropriate or default estimators are used when ob-
serving common NBB rain. Given this situation,
algorithms are needed to identify this rain type so that
appropriate estimators can be used.
Current radar-based rain-type identification algo-
rithms, including those used with the WSR-88D mea-
surements (e.g., Steiner et al. 1995; Penide et al. 2013; Qi
et al. 2013), are mostly aimed at differentiating strati-
form rainfall, which often exhibits the radar bright
band, and areas of heavier convective precipitation.
Convective–stratiform differentiation is important be-
cause applying VPR corrections for BB stratiform rain
at farther ranges is essential, even though coefficients in
the radar rain-rate estimators for these rain types could
be similar. Identifying areas of common NBB rain is
important for appropriate rain-rate estimators to be
applied when deriving more accurate radar-based QPE.
One polarimetric radar approach, which can be
suggested for identifying common NBB rain in the
precipitation areas outside of convective cores, is based
on analyzing observed ZDR–Ze patterns. Figure 6c de-
picts combined ZDR–Ze scatterplots for BB and com-
mon NBB rain obtained from DSDs observed at the
EWN and OFT measurement sites. It can be seen from
the best power-law fits shown in this figure that, for a
given value of reflectivity, typical differential reflectivity
values in BB rain are larger by more than a factor of 2
(in logarithmic scale units) than those in common NBB
rain. The mean threshold differential reflectivity value
Z(t)DR, essentially separating the ZDR–Ze distributions for
BB and common NBB rain types, can be obtained from
the twopower-lawbest fits for these rain types in Fig. 6c as
Z(t)DR (dB)’ 0:000 048Z2:69
e (dBZ) . (4)
For the Brandes et al. (2005) drop mean aspect ratios,
about 80% of BB-rain data points in Fig. 6c have
FIG. 9. Best-fit power-law R–KDP relations obtained using DSDs
observed at the EWN and OFT sites for different rain types.
FIG. 8. S-band R–KDP scatterplots for all rain DSDs with KDP .0.18 km21 observedat the (a)EWN, (b)OFT, and (c)HKSsites.Brandes
et al. (2005) drop mean aspect ratios were used in calculations.
JUNE 2016 MATROSOV ET AL . 1355
ZDR . Z(t)DR while approximately the same amount
(i.e., ;80%) of common NBB-rain data points are
characterized by ZDR # Z(t)DR. For the Thurai et al.
(2007) drop mean aspect ratios, the corresponding
numbers change by only a few percentage points. This
simple approach, however, is appropriate when radar
echoes come primary from rainfall so that there is
no significant contamination from melting and ice
hydrometeors.
6. Discussion and conclusions
Earlier studies (Martner et al. 2008) showed that a
significant fraction of cool-season rainfall in the U.S.
West Coast regions does not exhibit a radar bright band.
These authors suggested a linkage between this non-
brightband rain and orographically forced rainfall-
formation processes in shallower clouds. NBB rain is
characterized by DSDs with higher relative amounts of
smaller drops when comparedwith brightband rain. This
situation results in NBB Ze–R relations being distinct
from those used in operational algorithms, which can
lead to underestimation of precipitation amounts for
this rain type derived using existing radar-based QPE
schemes. The use of inappropriate rain-rate estimators is
an important factor (although not the only one) affect-
ing accuracy of radar-based precipitation retrievals.
Results of this study, which was conducted using
yearlong collocated measurements of S-band profiler
and Parsivel disdrometer DSDs, showed that NBB rain
is also often observed at the southeastern HMT-SEPS
sites at New Bern and Old Fort. This common NBB rain
is distinct from deep-convective NBB rain, which is
usually considered and segregated as a special rain type
when applying different operational radar-based QPE
approaches. The radar echo tops of common NBB rain
can extend above the environmental freezing level, and
this rain type can also result from shallow convection
lacking the strong convective core that could be identi-
fied by operational radar-based classification algo-
rithms. CommonNBB rain amounts to about 20%of the
total precipitation accumulation in the study area and is
observed not only in the mountainous terrain at OFT
but also in the relatively flat coastal area at EWN where
orographically forced rainfall formation processes are
not expected.
Because of larger fractions of smaller drops, common
NBB rain has radar-based rain-rate estimators that are
distinct from those of other rain types, including ones
based on traditional Ze 5 aRb relations as well as the
polarimetric radar estimators that make use of differ-
ential reflectivity ZDR and specific differential phase
shift KDP. S-band estimators applicable to WSR-88D
measurements were considered in this study. The ex-
ponents b in the traditional relations for all rain types
were similar (;1.6–1.7), but the prefactors for common
NBB rain were smaller by approximately a factor of 2.5
than those for other rain types, which could result in
precipitation underestimation by approximately 40% if
relations for BB or convective rain are used. This
amount of underestimation would be quantitatively
similar to the effect if the radar absolute calibration
biases were about 23.5 dB or to the effect of partial
beamfilling of about 45%. These two latter rain types
were characterized by similar Ze–R relations that were
relatively well approximated by the WSR-88D default
stratiform relation Ze 5 200R1.60. None of the default
WSR-88D Ze–R relations satisfactorily describe com-
mon NBB rain.
Similar to the Ze–R relations, polarimetric R(Ze, Zdr)
and R(KDP) estimators for BB and convective rain were
close, providing rain-rate estimates mostly within;15%
in the 20–45-dBZ reflectivity range [for R(Ze, Zdr) esti-
mators] and ;10% for differential phase shifts smaller
than 0.18km21 [for R(KDP) estimators]. The polari-
metric estimators previously utilized with WSR-88D
measurements (i.e., R 5 0.0067Ze0.93Zdr
23.43 and R 544K0:822
DP ) provide rain rates that were generally within
the same margins of variability for these rain types. The
polarimetric estimators for common NBB rain, how-
ever, are distinct, and the use of other rain-type orWSR-
88D estimators can cause significant underestimation of
radar-based QPE for this rain type. The degree of this
underestimation is greater for R(Ze, Zdr) and can be
larger than a factor of 2 for rainfall with lower re-
flectivities (e.g., Ze , 30 dBZ). Because the relations
between differential phase shift and rain rate are less
susceptible to DSD variations when compared with es-
timators containing Ze, the R(KDP) estimator un-
derestimation is generally smaller but is still appreciable
for KDP , 18km21 (e.g., ;30% at KDP ’ 0.38km21).
Derived from experimentally observed DSDs, ZDR and
KDP values exhibit only very modest sensitivity to dif-
ferent drop aspect ratio–size relations that are often
used by the radar-meteorology community.
Traditional nonpolarimetric radar Ze–R relations as
well as polarimetric R(Ze, Zdr) and R(KDP) relations
derived for the same rain types using DSDs observed
at different HMT-Southeast sites were very similar
despite a significant site separation (;470 km) and dif-
fering terrain. This result might suggest some generality
of the derived rain-rate estimators for a larger area.
The results of this study are also in general agreement
with findings by Martner et al. (2008), who also found
that nonconvective NBB-rain Ze 5 aRb relations or
winter-type rainfall in California is characterized by
1356 JOURNAL OF APPL IED METEOROLOGY AND CL IMATOLOGY VOLUME 55

significantly lower coefficients a relative to the case for
BB rain. Their values for a varied between 44 and 77,
and the exponents b were between 1.65 and 1.9.
Since common NBB rain frequently occurs in differ-
ent geographic areas and has radar rain-rate estimators
that are distinct from those of other rain types, it is im-
portant to distinguish it from other rain types. Existing
operational radar rain-type segregation schemes usually
differentiate between convective-core rain and strati-
form rain, which often exhibits the radar bright band,
but do not identify common NBB rain. S-PROF obser-
vations from HMT-SEPS show that periods of common
NBB rain, which is observed outside of deep-convection
periods, often interlace with periods of BB rain. The
NBB rain, however, can be potentially identified using
polarimetric Ze–ZDR measurements. As the results of
this study indicate, this rain type has distinct Ze–ZDR
patterns, which can be used for prospective techniques
to separate areas of NBB and BB rain. Future validation
and testing of common NBB-rain segregation tech-
niques should be based on closely collocated WSR-88D
polarimetric measurements and robust identification
of rain type from vertically pointing radar-profiler
observations.
Acknowledgments. This work has been supported by
the NOAA Office of Weather and Air Quality U.S.
Weather Research program and the Physical Sciences
Division at the NOAA Earth System Research Labo-
ratory. The authors are grateful to the PSD scientists
and engineers who deployed the instruments and col-
lected and quality controlled the high-quality data as
part of HMT-SEPS.
REFERENCES
Adirosi, E., E. Gorgucci, L. Baldini, and A. Tokay, 2014: Evalua-
tion of gamma raindrop size distribution assumption through
comparison of rain rates of measured and radar-equivalent
gamma DSD. J. Appl. Meteor. Climatol., 53, 1618–1635,
doi:10.1175/JAMC-D-13-0150.1.
——, L. Baldini, F. Lombardo, F. Russo, F. Napolitano, E. Volpi,
and A. Tokay, 2015: Comparison of different fittings of drop
spectra for rainfall retrievals. Adv. Water Resour., 83, 55–67,
doi:10.1016/j.advwatres.2015.05.009.
Atlas, D., C. W. Ulbrich, F. D. Marks Jr., E. Amitai, and C. R.
Williams, 1999: Systematic variation of drop size and
radar–rainfall relations. J. Geophys. Res., 104, 6155–6169,
doi:10.1029/1998JD200098.
Balakrishnan, N., and D. S. Zrnic, 1990: Estimation of rain and hail
rates in mixed-phase precipitation. J. Atmos. Sci., 47, 565–583,
doi:10.1175/1520-0469(1990)047,0565:EORAHR.2.0.CO;2.
Berkowitz, D. S., J. A. Schultz, S. Vasiloff, K. L. Elmore, C. D.
Payne, and J. B. Boettcher, 2013: Status of dual pol QPE in the
WSR-88Dnetwork.Proc. 27thConf. onHydrology, Austin,TX,
Amer.Meteor. Soc., 2.2. [Available online at https://ams.confex.
com/ams/93Annual/webprogram/Manuscript/Paper221525/
AMS27thHydro_2.2Berkowitz_et_al.pdf.]
Brandes, E. A., G. Zhang, and J. Vivekanandan, 2003: An eval-
uation of a drop distribution–based polarimetric radar rain-
fall estimator. J. Appl. Meteor., 42, 652–660, doi:10.1175/
1520-0450(2003)042,0652:AEOADD.2.0.CO;2.
——,——, and——, 2005: Corrigendum. J. Appl. Meteor., 44, 186,
doi:10.1175/1520-0450(2005)44,186:C.2.0.CO;2.
Bringi, V. N., and V. Chandrasekar, 2001: Polarimetric Doppler
Weather Radar. Cambridge University Press, 636 pp.
Doviak, R. J., and D. S. Zrnic, 1993: Doppler Radar and Weather
Observations. Academic Press, 562 pp.
Ekerete, K.’u.-M. E., F. H. Hunt, J. L. Jeffery, and I. E. Otung,
2015: Modeling rainfall drop size distribution in southern
England using a Gaussian mixture model. Radio Sci., 50,
doi:10.1002/2015RS005674.
Hubbert, J., and V. N. Bringi, 1995: An iterative filtering technique
for the analysis of copular differential phase and dual-frequency
radar measurements. J. Atmos. Oceanic Technol., 12, 643–648,
doi:10.1175/1520-0426(1995)012,0643:AIFTFT.2.0.CO;2.
Huschke, R. E., Ed., 1959: Glossary of Meteorology. Amer. Me-
teor. Soc., 638 pp.
Lim, S., R. Cifelli, V. Chandrasekar, and S. Y. Matrosov, 2013:
Precipitation classification and quantification using X-band
dual-polarization radar: Application in the Hydrometeorol-
ogy Testbed. J. Atmos. Oceanic Technol., 30, 2108–2120,
doi:10.1175/JTECH-D-12-00123.1.
Löffler-Mang, M., and J. Joss, 2000: An optical disdrometer for
measuring size and velocity of hydrometeors. J. Atmos.Oceanic
Technol., 17, 130–139, doi:10.1175/1520-0426(2000)017,0130:
AODFMS.2.0.CO;2.
Marshall, J. S., W. Hitschfeld, and K. L. S. Gunn, 1955: Ad-
vances in radar weather. Advances in Geophysics, Vol. 2,
H. E. Landsberg, Ed., Academic Press, 1–56, doi:10.1016/
S0065-2687(08)60310-6.
Martner, B. E., S. E. Yuter, A. B. White, S. Y. Matrosov, D. E.
Kingsmill, and F. M. Ralph, 2008: Raindrop size distributions
and rain characteristics in California coastal rainfall for pe-
riods with and without a radar bright band. J. Hydrometeor., 9,
408–425, doi:10.1175/2007JHM924.1.
Matrosov, S. Y., 2005: Attenuation-based estimates of rainfall rates
aloft with vertically pointing Ka-band radars. J. Atmos. Oce-
anic Technol., 22, 43–54, doi:10.1175/JTECH-1677.1
——, K. A. Clark, B. E. Martner, and A. Tokay, 2002: X-band
polarimetric radar measurements of rainfall. J. Appl. Me-
teor., 41, 941–952, doi:10.1175/1520-0450(2002)041,0941:
XBPRMO.2.0.CO;2.
——, R. Cifelli, P. C. Kennedy, S. W. Nesbitt, S. A. Rutledge, V. N.
Bringi, and B. E. Martner, 2006: A comparative study of
rainfall retrievals based on specific differential phase shifts at
X- and S-band radar frequencies. J. Atmos. Oceanic Technol.,
23, 952–963, doi:10.1175/JTECH1887.1.
——, ——, and D. Gochis, 2013: Measurements of heavy convec-
tive rainfall in the presence of hail in flood-prone areas using
an X-band polarimetric radar. J. Appl. Meteor. Climatol., 52,
395–407, doi:10.1175/JAMC-D-12-052.1.
——, F.M.Ralph, P.N.Neiman, andA.B.White, 2014:Quantitative
assessment of operational weather radar rainfall estimates over
California’s northern Sonoma County using HMT-West data.
J. Hydrometeor., 15, 393–410, doi:10.1175/JHM-D-13-045.1.
Penide, G., A. Protat, V. V. Kumar, and P. T. May, 2013: Com-
parisons of two convective/stratiform precipitation classifica-
tion techniques: Radar reflectivity texture versus drop size
JUNE 2016 MATROSOV ET AL . 1357

distribution-based approach. J. Atmos. Oceanic Technol., 30,
2788–2797, doi:10.1175/JTECH-D-13-00019.1.
Qi, Y., J. Zhang, and P. Zhang, 2013: A real-time automated
convective and stratiform precipitation segregation algorithm
in native radar coordinates. Quart. J. Roy. Meteor. Soc., 139,
2233–2240, doi:10.1002/qj.2095.
Rosenfeld, D., D. B. Wolff, and D. Atlas, 1993: General
probability-matched relations between radar reflectivity
and rain rate. J. Appl. Meteor., 32, 50–72, doi:10.1175/
1520-0450(1993)032,0050:GPMRBR.2.0.CO;2.
Seliga, T. A., and V. N. Bringi, 1976: Potential use of radar dif-
ferential reflectivity measurements at orthogonal polariza-
tions for measuring precipitation. J. Appl. Meteor., 15, 69–76,
doi:10.1175/1520-0450(1976)015,0069:PUORDR.2.0.CO;2.
Steiner, M., R. A. Houze Jr., and S. E. Yuter, 1995: Climatological
characterization of three-dimensional storm structure from
radar and rain gauge data. J. Appl. Meteor., 34, 1978–2007,
doi:10.1175/1520-0450(1995)034,1978:CCOTDS.2.0.CO;2.
Thompson, E. J., S. A. Rutledge, B. Dolan, and M. Thurai, 2015:
Drop size distributions of convective and stratiform rain over
the equatorial Indian and west Pacific Oceans. J. Atmos. Sci.,
72, 4091–4125, doi:10.1175/JAS-D-14-0206.1.
Thurai, M., G. J. Huang, V. N. Bringi, W. L. Randeu, and
M. Schönhuber, 2007: Drop shapes, model comparisons, and
calculations of radar parameters in rain. J. Atmos. Oceanic
Technol., 24, 1019–1032, doi:10.1175/JTECH2051.1.
——,W.A. Petersen, A. Tokay, C.Achultz, and P.Gatlin, 2011:Drop
size distribution comparisons between Parsivel and 2-D video
disdrometers.Adv. Geosci., 30, 3–9, doi:10.5194/adgeo-30-3-2011.
Tokay, A., and D. A. Short, 1996: Evidence from tropical rain-
drop spectra of the origin of rain from stratiform versus
convective clouds. J. Appl. Meteor., 35, 355–371, doi:10.1175/
1520-0450(1996)035,0355:EFTRSO.2.0.CO;2.
Waterman, P. C., 1965: Matrix formulation of electromag-
netic scattering. Proc. IEEE, 53, 805–812, doi:10.1109/
PROC.1965.4058.
White, A. B., P. J. Neiman, F. M. Ralph, D. E. Kingsmill, and
P. O. G. Persson, 2003: Coastal orographic rainfall processes
observed by radar during the California Land-Falling Jets
Experiment. J. Hydrometeor., 4, 264–282, doi:10.1175/
1525-7541(2003)4,264:CORPOB.2.0.CO;2.
Woodley, W. L., 1970: Precipitation results from a pyrotechnic
cumulus seeding experiment. J. Appl. Meteor., 9, 242–257,
doi:10.1175/1520-0450(1970)009,0242:PRFAPC.2.0.CO;2.
Zhang, J., and Coauthors, 2011: National Mosaic andMulti-Sensor
QPE (NMQ) system: Description, results, and future plans.
Bull. Amer. Meteor. Soc., 92, 1321–1338, doi:10.1175/
2011BAMS-D-11-00047.1.
Zrnic, D. S., and A. Ryzhkov, 1996: Advantages of rain measure-
ments using specific differential phase. J. Atmos. Oceanic
Technol., 13, 454–464, doi:10.1175/1520-0426(1996)013,0454:
AORMUS.2.0.CO;2.
1358 JOURNAL OF APPL IED METEOROLOGY AND CL IMATOLOGY VOLUME 55