
Quintain Estates and Development PLC Y E d R lt t 31 M h ... 31 M h 2011to 31 March 2011 Rebecca...
35
Quintain Estates and Development PLC Y E dR lt t 31 M h 2011 Year End Results to 31 March 2011 25 May 2011
Transcript of Quintain Estates and Development PLC Y E d R lt t 31 M h ... 31 M h 2011to 31 March 2011 Rebecca...

Quintain Estates and Development PLCY E d R lt t 31 M h 2011Year End Results to 31 March 2011
25 May 2011

Agendag
O iOverview
Financial Review
Urban Regeneration
Fund Management
Outlook
Quintain Estatesand Development PLC 2

Driving Growth for Profit: Progressg g
Urban Regeneration programme strategically placed
Fund Management continues to grow
Financial platform further stabilised
Quintain Estatesand Development PLC 3

Driving Growth for Profit: March 2011 Milestonesg
Milestone ProgressWembleyStart construction of the Hilton Hotel √
Progress the student accommodation √
Secure anchor tenants for the London Designer Outlet √
Greenwich Peninsula
Conclude the sale of Pier Walk and recycle the capital √
Start construction of the next building at Greenwich X
Fund Management
Invest designated equity from the rights issue √Expand the number of income-generating beds in iQ √Introduce an equity partner to Corsham Street √Create a new income generating fund √
Quintain Estatesand Development PLC 4
Achieve a 25% increase in funds under management √
Finance Review t 31 M h 2011to 31 March 2011
Rebecca Worthington, Finance Director
Ravensbourne College with new restaurant operator

Financial Highlightsg g
31 March 2011
£
31 March 2010
££m £m
Gross profit 26.2 25.9
Operating profit 5.6 4.8
Adj d fi (b f i l ) b f 3 6 2 6Adjusted profit (before capital movements) before tax 3.6 2.6
Loss before tax (48.1) (10.2)
EPRA diluted EPS 1.2p 0.1p
Net asset value per share31 March
2011pence
31 March 2010
penceChange
%
Basic 116 120 (3.3)
Diluted 115 120 (4.2)
EPRA 125 133 (6.0)
Quintain Estatesand Development PLC 6

Income Statement31 March
2011£m
31 March 2010
£m
Net rent 15.1 16.5
Trading sales - 0.1
Income from hotel operations 3.9 4.2
Fees from fund management 5.5 11.9
Other income 2.1 1.3
Impairment of trading properties (0.4) (8.1)
Gross profit 26.2 25.9
Administration expenses (20.6) (21.1)
Profit (loss) on sale of non-current assets 2 8 (7 7)Profit (loss) on sale of non current assets 2.8 (7.7)
Impairment of non-current assets - (3.3)
Net finance expenses (11.9) (11.6)
Joint ventures and associates 9.4 0.1
Pre tax profit (loss) excluding revaluation 5 9 (17 7)Pre-tax profit (loss) excluding revaluation 5.9 (17.7)
Revaluation movements on investment properties (54.0) 7.5
Pre-tax loss (48.1) (10.2)
Tax 13.4 2.1
L f fi i l i d (34 7) (8 1)
Quintain Estatesand Development PLC 7
Loss for financial period (34.7) (8.1)

Movement in Net Assets
EquityTaxFinanceOperations
650(0.4)
6.0
5.5
15.1640
£m
598.60.211.3
(20.6)622.4
600
610
620
630
560
12.82.8
(11.9)
9.4
(54.0)570
580
590
1 April Net rental Net fund Net hotel Impairment Adminis- Revaluation Share of profit Profit on Net finance Fair value of Taxation Other equity 31 March1 April 2010
Net rentalIncome
Net fundmanagement
income
Net hoteland otherincome
Impairmentof tradingproperties
Administrative
expenses
Revaluationof properties
Share of profitfrom JVs
andassociates
Profit onsales ofassets
Net financecosts
Fair value ofderivatives
Taxation Other equitymovements
31 March 2011
Quintain Estatesand Development PLC 8

Divisional Income Analysisy
Urban R i
Quercus iQ SeQuel OtherTotal QFM
Other Central Total
Proportional Accounting of Joint Ventures
Underlying movements
Regeneration
£m
Quercus
£m
iQ
£m
SeQuel
£m
Other
£mQFM
£m
Other
£m
Central
£m
Total
£m
Operating profit 15.1 8.4 7.4 7.3 0.2 23.3 1.3 (20.6) 19.1
Net finance expenses (2.3) (1.8) (4.5) - 0.2 (6.1) - (7.2) (15.6)
Net profit before disposalsand revaluation
12.8 6.6 2.9 7.3 0.4 17.2 1.3 (27.8) 3.5
Tax 0.1 - - - - - - (0.2) (0.1)
12.9 6.6 2.9 7.3 0.4 17.2 1.3 (28.0) 3.412.9 6.6 2.9 7.3 0.4 17.2 1.3 (28.0) 3.4
Capital movements
Profit from disposals 2.6 0.1 - 0.7 (0.7) 0.1 - - 2.7
Impairment (0.4) - - - - - - - (0.4)
Swap adjustments (2.3) - 1.4 - - 1.4 - (4.7) (5.6)
Revaluation movements (15.5) 1.7 9.4 (4.9) (33.2) (27.0) (2.7) - (45.2)
Tax (0.8) 1.4 (3.8) - - (2.4) - 13.6 10.4
P fit ft t (3 5) 9 8 9 9 3 1 (33 5) (10 7) (1 4) (19 1) (34 7)
Quintain Estatesand Development PLC 9
Profit after tax (3.5) 9.8 9.9 3.1 (33.5) (10.7) (1.4) (19.1) (34.7)

Valuations
Deficit Surplus Valuation
S h S h
Key Sectors
Six months30 September
2010
Six months31 March
2011
31 March2011
£m £m £m
Wembley City Retail & leisure, residential (13.1) 4.7 486.6
Greenwich Peninsula Commercial, residential (3.9) 6.4 241.5
Regional schemes Land residential (7.6) (2.0) 50.6
Quercus Long term healthcare 1.2 0.5 79.6
Q 6 1 3 3 154 4iQ Student accommodation 6.1 3.3 154.4
SeQuel Secondary property (3.5) (1.4) 83.7
Investment Portfolio Secondary property (2.0) (0.7) 32.5
Quantum Science parks 0.1 (0.2) 2.6
Corsham Street and other QFM
Student accommodationSecondary property (34.6) 1.5 23.7
Portfolio Total (57.3) 12.1 1,155.2
Quintain Estatesand Development PLC 10
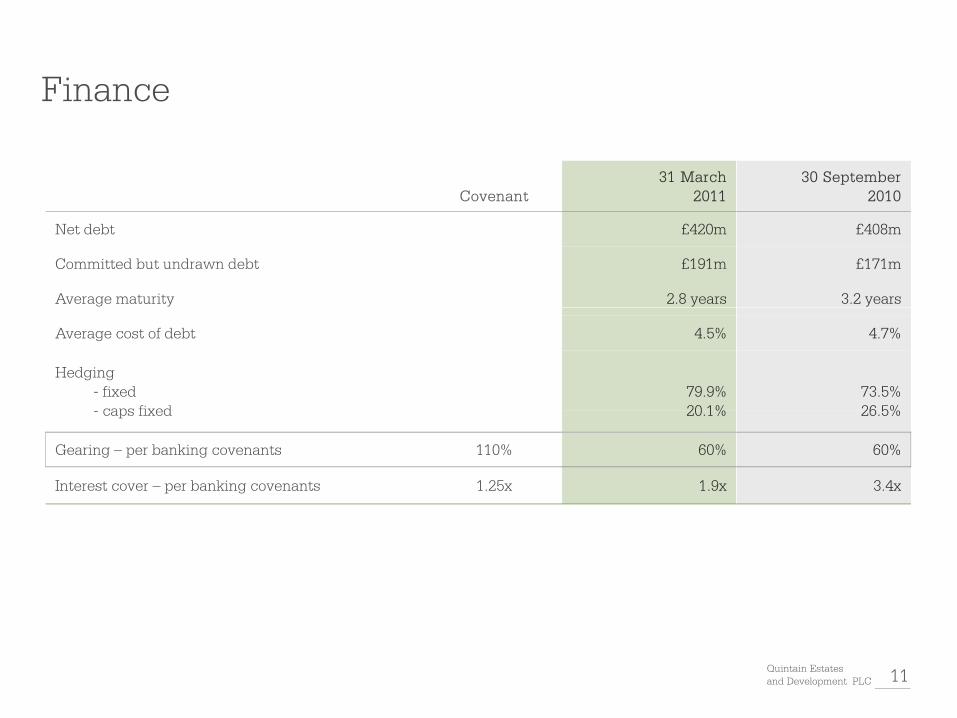
Finance
Covenant31 March
201130 September
2010
Net debt £420m £408m
Committed but undrawn debt £191m £171m
Average maturity 2.8 years 3.2 years
Average cost of debt 4.5% 4.7%
Hedging- fixed
caps fixed79.9%20 1%
73.5%26 5%- caps fixed 20.1% 26.5%
Gearing – per banking covenants 110% 60% 60%
Interest cover – per banking covenants 1.25x 1.9x 3.4x
Quintain Estatesand Development PLC 11

Capital Commitmentsp
31 March 20112011
£m
Group:
Middlehaven 6.4
Wembley Hilton Hotel, student accommodation and site wide
Dashwood Studios
Others
Joint ventures:
81.7
17.6
0.2
iQ – student accommodation in course of construction
SPark
Greenwich – MDL
62.6
3.8
1.4
173 7173.7
Quintain Estatesand Development PLC 12

Debt Maturity Profile at 30 September 2010
450
£m
y p(Excluding Joint Ventures)
350
400
450
£396m
200
250
300
£235m
100
150
200
0
50
2010 2011 2012 2013 2014 2015 2016
Quintain Estatesand Development PLC 13

Debt Maturity Profile with Options and Extensiony p
£m
As at 25 May 2011
300
350
£295m
200
250
100
150
£110m£126m
0
50
2011 2012 2013 2014 2015 2016
Quintain Estatesand Development PLC 14

Financial Outlook
Milestone Action
• Build recurring income and manage costs • Move towards positive operating cash flow
• Extend debt maturity profile • Extend, fully or through options, at least £400m of total debt facilities to 2016
Quintain Estatesand Development PLC 15

Urban Regenerationg
Quintain Estatesand Development PLC 16
North West lands at Wembley City

London – The Opportunitypp y
• Per capita GDP forecast to grow to $95,266 by 2025 1
Top six big cities with material GDP growth potential
2025
• No2 on the Global Cities Index2:
- Business activity
- Human capital
CityCountry
GDP in 2008
($bn*)
Pop.2008
(m)
Per CapitaGDP in
2008
GDP 2008
($bn1)
Pop.2025
(m)
Per CapitaGDP in
2025
London 565 9 $65 698 821 9 $95 266- Information exchange
- Cultural experience
- Political engagement
• London extends 607 square miles3
London U.K.
565 9 $65,698 821 9 $95,266
São Paulo Brazil
388 19 $20,638 782 21 $36,542
Mexico City
390 19 $20,526 745 21 $35,476
• It comprises 3.3 million homes 4
• Commercial floor space in Central London approximately 220 million square feet5
• Serviced by two major and three smaller
City Mexico
Shanghai China
233 15 $15,533 692 19 $35,670
Buenos Aires
362 13 $28,281 651 14 $47,174
• Serviced by two major and three smaller international airports
Argentina
Mumbai India
209 19 $11,000 594 26 $22,500
*$bn at PPP Source: (1) Pricewaterhouse Coopers and United Nations
Quintain Estatesand Development PLC 17
(2) Foreign Policy, A.T. Kearney, Chicago Council on Global Affairs
(3) Government Office for London
(4) Department for Communities and Local Government
(5) West-End, City and Canary Wharf – Savills

London – The Opportunitypp yM25
Hatfield 30 minutes
Central London
20 minutes to Central London by
Jubilee Line
Quintain Estatesand Development PLC 18

Quintain - The OpportunityM25
Hatfield 30 minutes
pp y
Wembley City Unit
Total consents 8 m sq ft
Incl 5 521 homesGreenwich Peninsula Unit
Total consents
Residential 10,000 homes
Commercial 3.5m sq ft
R t il 0 4 ft
Incl 5,521 homes
Western Core
Residential 3,727 homes
Commercial 1.0m sq ft
Retail, hotel and leisure 1.4m sq ft
Retail 0.4m sq ft
Peninsula Quays
Total 3.2m sq ft
Residential 3,500 homes
Retail 0 9m
North West Lands 1.7m
Residential 1,300 homes
Retail, hotel and leisure 0.6m sq ft
Commercial 0.2m sq ft
Central London
Retail 0.9m
20 minutes to Central London by
Jubilee Line
Quintain Estatesand Development PLC 19
Potential to deliver the equivalent of three new ‘Great Estates’

Wembley Cityy y
Valuation £m Income
31 March 2011
£m
31 March 2010
£mValuation £m
As at 1 April 2010 488.9
Capital expenditure on investment assets 32.0
Income £m £m
Rental income1 8.8 9.0
Income from trading property sales1
9.1 14.2
Capitalised interest 11.9
Disposals (21.0)
Valuation deficit (8.5)
A t 31 M h 2011 503 3
Hotel income 7.6 7.7
Fees from joint ventures 0.1 -
Other income 3.8 3.2
29 4 34 1As at 31 March 2011 503.3 29.4 34.1
1Includes share of joint venture income
Quintain Estates& Development plc 20

Wembley City Progressy y g
Planning
• Resolution to grant consent received in May for 1.7m sq ft of mixed use accommodation
Construction
• Hilton Hotel and student accommodation topped out in Mayin May
Commercial
• LDO now 30% let with a further 12% in solicitors’ hands (net internal floorspace)
• Discussions underway with Marks and Spencer• Discussions underway with Marks and Spencer
Residential
• 99% of 520 homes now sold or let
• £2.0m of rental income generated by rental business in 2011 ib i £0 5 fi2011 contributing £0.5m to profit
Commercialisation and estates management
• £3.8m income generated in 2011 (2010: £3.2m)Wembley City’s new Civic Square
Quintain Estates& Development plc 21

Wembley City Milestonesy y
Milestone Key Actions• Release £100m of capital • Secure joint venture partners:
- Hilton Hotel • Sell student accommodation
• Finalise planning on North West lands • Gain approval for Section 106 Agreements
• Focus on residential and place making to
• Fund and start building the London Designer Outlet this year
p gsupport delivery in the near term
• Secure 40% pre-lets at the London Designer Outletg y
• Increase income and profit contribution
g• Secure joint venture partner
• Increase operating profit at Wembley City by at least £1m
Quintain Estates& Development plc 22
y

Greenwich Peninsula
Valuation £m Income
31 March 2011
£m
31 March 2010
£mValuation £m
As at 1 April 2010 277.1
Capital expenditure 9.0
Income £m £m
Rental income 1.5 2.8
Fees from joint venture 0.2 0.7
Disposals (47.1)
Valuation surplus 2.5
As at 31 March 2011 241 5 1 7 3 5As at 31 March 2011 241.5 1.7 3.5
Quintain Estates& Development plc 23

Greenwich Peninsula Progressg
Construction
• £7.6m infrastructure investment
• Cable car to start on site creating direct link to Crossrail NEW IMAGE
Commercial
• TfL building sold for £97.1m (6% higher than latest valuation)
Residential
• Agreement reached with Lend Lease to develop two plots each independently
• Draft solution to affordable housing in place, awaiting l f LBGapproval from LBG
• Reserved matters planning to be progressed at Peninsula Quays
Quintain Estates& Development plc 24

Greenwich Peninsula Milestones
Milestone Key Actions• Accelerate residential development • Finalise and agree affordable housing
provision • Revisit master plan at Peninsula Quays
• Secure inward investment
• Attract new office and retail occupiers
• Secure forward sales of two plots at the Southern end of the Peninsula
• Attract two office and two retailer p
• Build Greenwich Peninsula’s sense of place
occupiers to Peninsula Central
• Improve marketing and landscaping to prepare the scheme for sustained p p presidential sales
Quintain Estates& Development plc 25

Fund Managementg
Quintain Estatesand Development PLC 26
iQ Hoxton

Quintain Fund Management 2010/11g
Sector Assets under management
Assets under management
QED equity invested
QED equity invested
31 March 2011
£m
31March 2010
£m
31 March 2011
£m
31 March 2010
£m
Healthcare 744 680 46 2 55 1Healthcare 744 680 46.2 55.1
Higher Education 324 243 94.0 68.0
Science Parks 22 7 10.5 6.9
Secondary Property 185 78 42.6 24.5Secondary Property 185 78 42.6 24.5
Total 1,275 1,008 193.3 154.5
Quintain Estatesand Development PLC 27

Quintain Fund Management Approachg pp
• Specialist fund management in niche k
Historic and forecast growth in funds under management
2 5property markets
- Healthcare
- Higher education
S i k
2.0
2.5
- Science parks
- Secondary property
• Compelling social, economic and environmental trends
1.0
1.5
£m
environmental trends
• Proven track record
• Target £2bn fund under management by 2013
0.0
0.5
2007 2008 2009 2010 2011 2012 2013
Year2013 Year
Quintain Estatesand Development PLC 28

Healthcare
Investment strategySupply and demand characteristics
• Liquidity proven in • Demographics
Growth in population of over 65s
• Liquidity – proven in Quercus
• Target NIY of 7-8%
• Target geared IRR of 12-14%
• Demographics
• Key supply issues / opportunities
• Demand trends
M k t th t ti l0
5
10
15
20
m
• Lease characteristics
• Strategic fit with QED
• Market growth potential2012 2016 2021 2026 2031
• 14 acquisitions completed
• 8 disposals
31 March 2011
31March 2010
Quintain holding 11.22% 14.95 %
Assets under management £744m £680m
• Practical completion achieved at Warrington
• 20 smaller refurbishment projects undertaken
• 13 care homes in administration
Capital invested £51.8m £57.2m
Income generated1 £10.9m £21.3m
Contribution to profits £9.8m (£3.7m)
Average lease length 28 yrs 29 yrs
Quintain Estatesand Development PLC
Average lease length 28 yrs 29 yrs
29
1 Fee income and joint venture revenue

Student Accommodation
Investment strategySupply and demand characteristics
• Co investor interest • Demographics still 800
Student applications supply / demand
• Co-investor interest
• Target NIY of 6-7%
• Target geared IRR of 13-15%
Di it l
• Demographics – still favourable
• Key supply issues/opportunities
• Demand trends 100200300400500600700
000s
• Diversity - leases
• Strategic fit with QED• Growth potential – HE
infrastructure
0100
2004 2005 2006 2007 2008 2009 2010
Accepted applicants Surplus demand
• 75.5% occupancy for next year
• 930 rooms under construction in London
31 March 2011
31March 2010
Quintain holding 49.98% 49.98 %
Assets under management £309m £209m
• Cash generative
• Strong platform for second phase of growth
Capital invested £67.7m £46.0m
Income generated1 £11.3m £8.5m
Contribution to profits £9.9m (£1.0m)
Quintain Estatesand Development PLC 30
1 Fee income and joint venture revenue

Science Parks
Investment strategySupply and demand characteristics
• Secure new investment • 78 UK Science Parks
Occupier by type
• Secure new investment
• Target NIY of 8-10%
• Target geared IRR of 13-15%
• Build critical mass
• 78 UK Science Parks
• Science central to Government’s growth agenda
• 2010 CSR: £4.6bn of
32%
3.%
9%
13% Bio related
Environmental
Energy
Computer Telecoms
Ind Technlogies
• Build critical mass resource and £1.9bn of capital to 2014/15
• Corporates collaborating more on R&D
3%
4%
21%
15% Materials
Tech Consultancy
Business Services
• Construction of buildings underway
• National Composites Centre almost ready for occupation
31 March 2011
31March 2010
Quintain’s holdings 50% 50%
Assets under management £22.0m £7.0m
• 'SPark one, 70,000 sq ft comprising an innovation centre, catering and conferencing facilities and grow on space will be ready late summer
• Good tenant interest
Capital invested £9.4m £5.8m
Income generated1 £0.7m £0.2m
Contribution to profits £0.4m £0.1m
Quintain Estatesand Development PLC 31
1 Fee income and joint venture revenue

Secondary Propertyy p y
Investment strategySupply and demand characteristics
• Secure new investment • 250bps yield gap
Prime versus Secondary All Property Yields• Secure new investment
• Target NIY of 8-10%
• Target geared IRR of 15-18%
• Distressed pricing
• 250bps yield gap between prime and secondary
• Pricing/value opportunities
02468
1012
• Distressed pricing
• Asset management intensive
• Letting risk0
2001 2002 2003 2004 2005 2006 2007 2008 2009 2010
Prime Secondary
Secondary Property
SeQuel
• £6.4m of sales
• £14 7m acquisitions
31 March 2011
31March 2010
Assets under management £83.7m £78.9m
Capital invested £37.4m £36.7m• £14.7m acquisitions
• £144,000 new leases
• Post year end £167,000 of income secured for 5 year term
• £553,000 income in solicitors’ hands
Albemarle
Income generated1 £9.0m £5.6m
Contribution to profits £3.1m £13.4m
Average lease length 5.1yrs 4.8yrs
Quintain Estatesand Development PLC
• Completed investment on excellent terms
32
1 Rental income and joint venture revenue

Fund Management Milestonesg
Milestone• Grow funds under management to at least £1.5bn
• Support growth by securing £40-50m of third party investment
• Increase income and profit contribution
• Create a new fund and/or secure partners for the residential elements at Greenwich and W blWembley
Key Actions Healthcare Higher Education Science and Technology Secondary Property
Q Q Q Q Q Q Q F dQuintainNew Bus.
Quercus QuintainNew Bus
iQ QuintainNew Bus
Quantum QuintainNew Bus
Funds
Secure third party investment
√ √ √ √ √
Acquisitions √ √ √ √
Development DashwoodStudios
Hoxton Bristol & Bath SP
Refurbishment
Increase/stabilise income √ √ Rent roll to £23m
√ Major pre-let
Property mgmt
E h kill b √ √ √ √
Quintain Estatesand Development PLC 33
Enhance skills base √ √ √ √

Summaryy
To drive profit for growth:
• Establish Wembley City as a thriving leisure and retail destination
• Re-invigorate development at Greenwich Peninsula
• Grow specialist fund management to £2bn by 2013
• Extend debt maturity
• Build recurring income and manage costs through our activities
Quintain Estatesand Development PLC 34

Quintain Estates and Development PLCY E d R lt t 31 M h 2011Year End Results to 31 March 2011
25 May 2011


![arXiv:1105.5746v1 [astro-ph.IM] 29 May 2011to test the general theory of relativity (Kramer et al. 2006). Pulsars are still being discovered (e.g., Keith et al. 2010). These, and previously](https://static.fdocuments.us/doc/165x107/60aaeee9fe0046429a3eb2f4/arxiv11055746v1-astro-phim-29-may-2011-to-test-the-general-theory-of-relativity.jpg)