Quarterly Report on the Performance and Service Quality of ...
20
Quarterly Report on the Performance and Service Quality of Intercity Passenger Train Operations Covering the Quarter Ending June 2021 (Third Quarter of Fiscal Year 2021) Federal Railroad Administration U.S. Department of Transportation
Transcript of Quarterly Report on the Performance and Service Quality of ...

Quarterly Report on the Performance and Service Quality of
Intercity Passenger Train Operations
Covering the Quarter Ending June 2021 (Third Quarter of Fiscal Year 2021)
Federal Railroad Administration U.S. Department of Transportation

Quarterly Report on Performance and Service Quality of Intercity Passenger Train Operations
This page is intentionally left blank.
Quarterly Report on Performance and Service Quality of Intercity Passenger Train Operations
i
Contents Page I. Introduction ................................................................................................................................3
II. Summary of Metrics and Standards ...........................................................................................4
III. Amtrak Route Structure and Descriptions .................................................................................6
IV. Quarterly Reporting Tables ........................................................................................................9
A. On-Time Performance and Train Delays ......................................................................... 9
B. Customer Service ........................................................................................................... 14
C. Financial ......................................................................................................................... 15
D. Public Benefits ............................................................................................................... 17

Quarterly Report on Performance and Service Quality of Intercity Passenger Train Operations
ii
Abbreviations, Acronyms, and Phrases in this Report C.F.R. Code of Federal Regulations
FRA Federal Railroad Administration
FY Fiscal Year (October 1 to September 30)
NEC Northeast Corridor, rail line between Boston, Massachusetts, and Washington, D.C.
OTP On-Time Performance
P.L. Public Law
PRIIA Passenger Rail Investment and Improvement Act of 2008, P.L. 110-432
MSA Metropolitan Statistical Area
U.S.C. United States Code
U.S. DOT United States Department of Transportation
Quarterly Report on Performance and Service Quality of Intercity Passenger Train Operations
3
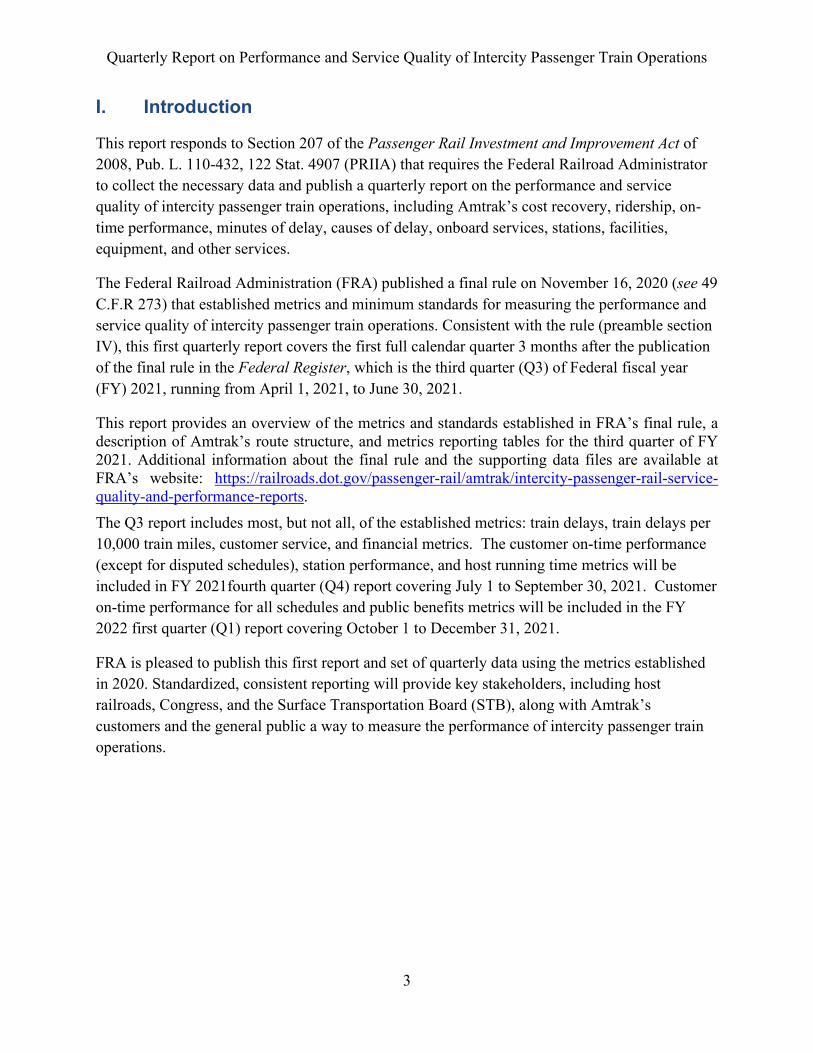
I. Introduction
This report responds to Section 207 of the Passenger Rail Investment and Improvement Act of 2008, Pub. L. 110-432, 122 Stat. 4907 (PRIIA) that requires the Federal Railroad Administrator to collect the necessary data and publish a quarterly report on the performance and service quality of intercity passenger train operations, including Amtrak’s cost recovery, ridership, on-time performance, minutes of delay, causes of delay, onboard services, stations, facilities, equipment, and other services.
The Federal Railroad Administration (FRA) published a final rule on November 16, 2020 (see 49 C.F.R 273) that established metrics and minimum standards for measuring the performance and service quality of intercity passenger train operations. Consistent with the rule (preamble section IV), this first quarterly report covers the first full calendar quarter 3 months after the publication of the final rule in the Federal Register, which is the third quarter (Q3) of Federal fiscal year (FY) 2021, running from April 1, 2021, to June 30, 2021.
This report provides an overview of the metrics and standards established in FRA’s final rule, a description of Amtrak’s route structure, and metrics reporting tables for the third quarter of FY 2021. Additional information about the final rule and the supporting data files are available at FRA’s website: https://railroads.dot.gov/passenger-rail/amtrak/intercity-passenger-rail-service-quality-and-performance-reports. The Q3 report includes most, but not all, of the established metrics: train delays, train delays per 10,000 train miles, customer service, and financial metrics. The customer on-time performance (except for disputed schedules), station performance, and host running time metrics will be included in FY 2021fourth quarter (Q4) report covering July 1 to September 30, 2021. Customer on-time performance for all schedules and public benefits metrics will be included in the FY 2022 first quarter (Q1) report covering October 1 to December 31, 2021.
FRA is pleased to publish this first report and set of quarterly data using the metrics established in 2020. Standardized, consistent reporting will provide key stakeholders, including host railroads, Congress, and the Surface Transportation Board (STB), along with Amtrak’s customers and the general public a way to measure the performance of intercity passenger train operations.
Quarterly Report on Performance and Service Quality of Intercity Passenger Train Operations
4
II. Summary of Metrics and Standards
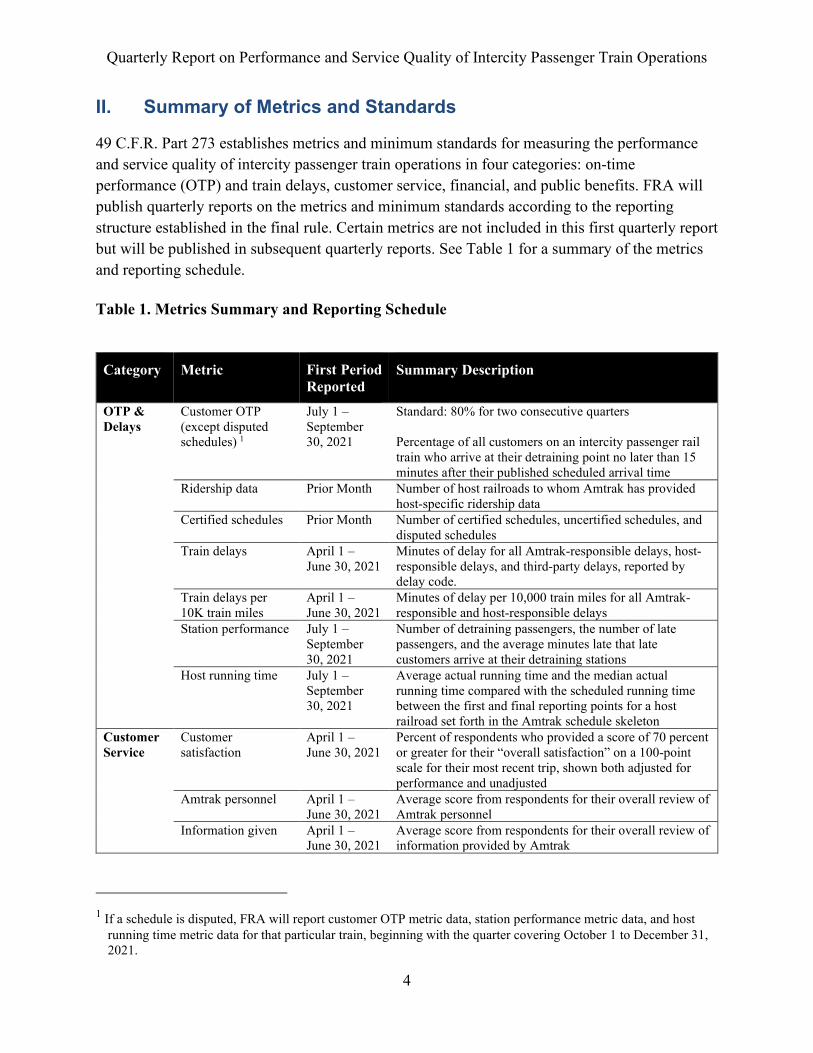
49 C.F.R. Part 273 establishes metrics and minimum standards for measuring the performance and service quality of intercity passenger train operations in four categories: on-time performance (OTP) and train delays, customer service, financial, and public benefits. FRA will publish quarterly reports on the metrics and minimum standards according to the reporting structure established in the final rule. Certain metrics are not included in this first quarterly report but will be published in subsequent quarterly reports. See Table 1 for a summary of the metrics and reporting schedule. Table 1. Metrics Summary and Reporting Schedule
Category Metric First Period Reported
Summary Description
OTP & Delays
Customer OTP (except disputed schedules) 1
July 1 – September 30, 2021
Standard: 80% for two consecutive quarters Percentage of all customers on an intercity passenger rail train who arrive at their detraining point no later than 15 minutes after their published scheduled arrival time
Ridership data Prior Month Number of host railroads to whom Amtrak has provided host-specific ridership data
Certified schedules Prior Month Number of certified schedules, uncertified schedules, and disputed schedules
Train delays April 1 – June 30, 2021
Minutes of delay for all Amtrak-responsible delays, host-responsible delays, and third-party delays, reported by delay code.
Train delays per 10K train miles
April 1 – June 30, 2021
Minutes of delay per 10,000 train miles for all Amtrak-responsible and host-responsible delays
Station performance July 1 – September 30, 2021
Number of detraining passengers, the number of late passengers, and the average minutes late that late customers arrive at their detraining stations
Host running time July 1 – September 30, 2021
Average actual running time and the median actual running time compared with the scheduled running time between the first and final reporting points for a host railroad set forth in the Amtrak schedule skeleton
Customer Service
Customer satisfaction
April 1 – June 30, 2021
Percent of respondents who provided a score of 70 percent or greater for their “overall satisfaction” on a 100-point scale for their most recent trip, shown both adjusted for performance and unadjusted
Amtrak personnel April 1 – June 30, 2021
Average score from respondents for their overall review of Amtrak personnel
Information given April 1 – June 30, 2021
Average score from respondents for their overall review of information provided by Amtrak
1 If a schedule is disputed, FRA will report customer OTP metric data, station performance metric data, and host
running time metric data for that particular train, beginning with the quarter covering October 1 to December 31, 2021.
Quarterly Report on Performance and Service Quality of Intercity Passenger Train Operations
5
Category Metric First Period Reported
Summary Description
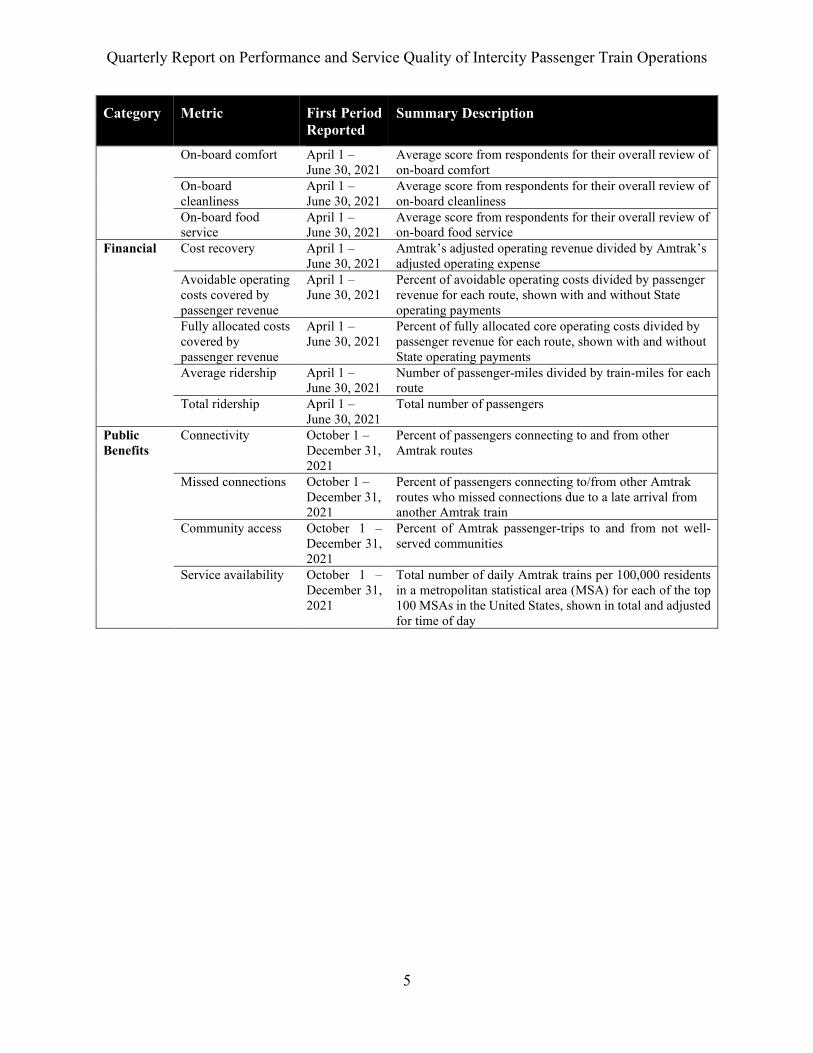
On-board comfort April 1 – June 30, 2021
Average score from respondents for their overall review of on-board comfort
On-board cleanliness
April 1 – June 30, 2021
Average score from respondents for their overall review of on-board cleanliness
On-board food service
April 1 – June 30, 2021
Average score from respondents for their overall review of on-board food service
Financial Cost recovery April 1 – June 30, 2021
Amtrak’s adjusted operating revenue divided by Amtrak’s adjusted operating expense
Avoidable operating costs covered by passenger revenue
April 1 – June 30, 2021
Percent of avoidable operating costs divided by passenger revenue for each route, shown with and without State operating payments
Fully allocated costs covered by passenger revenue
April 1 – June 30, 2021
Percent of fully allocated core operating costs divided by passenger revenue for each route, shown with and without State operating payments
Average ridership April 1 – June 30, 2021
Number of passenger-miles divided by train-miles for each route
Total ridership April 1 – June 30, 2021
Total number of passengers
Public Benefits
Connectivity October 1 – December 31, 2021
Percent of passengers connecting to and from other Amtrak routes
Missed connections October 1 – December 31, 2021
Percent of passengers connecting to/from other Amtrak routes who missed connections due to a late arrival from another Amtrak train
Community access October 1 – December 31, 2021
Percent of Amtrak passenger-trips to and from not well-served communities
Service availability October 1 – December 31, 2021
Total number of daily Amtrak trains per 100,000 residents in a metropolitan statistical area (MSA) for each of the top 100 MSAs in the United States, shown in total and adjusted for time of day
Quarterly Report on Performance and Service Quality of Intercity Passenger Train Operations
6
III. Amtrak Route Structure and Descriptions
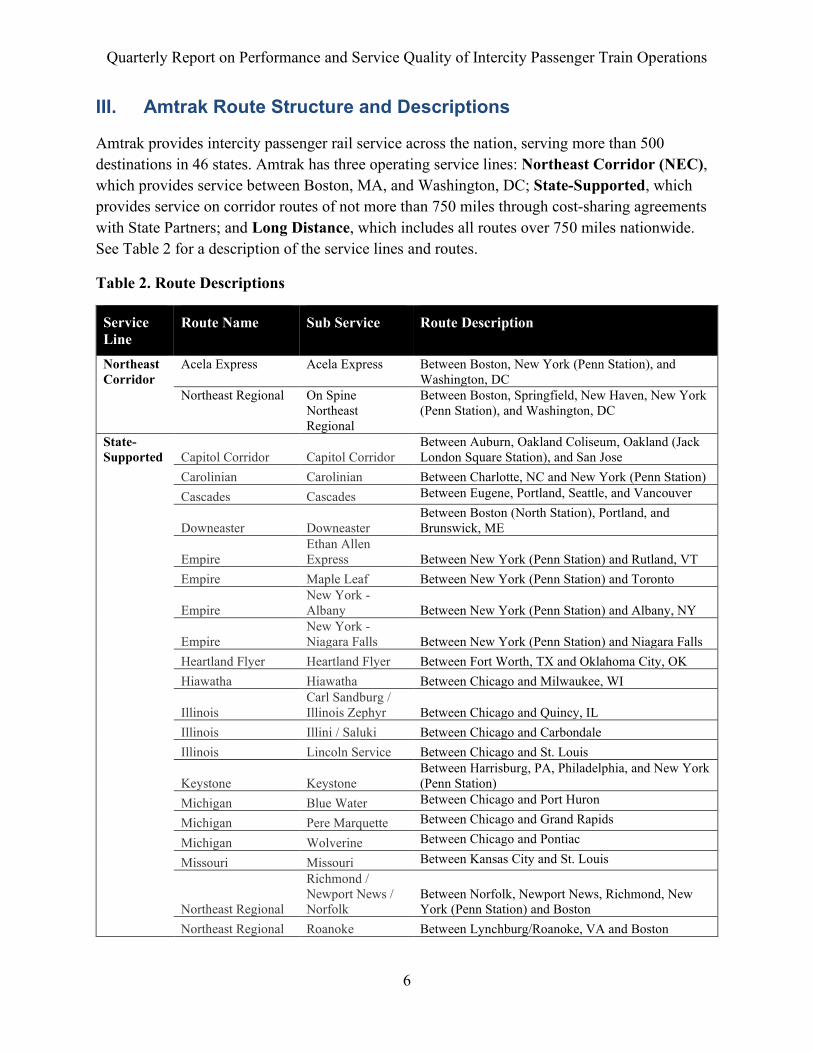
Amtrak provides intercity passenger rail service across the nation, serving more than 500 destinations in 46 states. Amtrak has three operating service lines: Northeast Corridor (NEC), which provides service between Boston, MA, and Washington, DC; State-Supported, which provides service on corridor routes of not more than 750 miles through cost-sharing agreements with State Partners; and Long Distance, which includes all routes over 750 miles nationwide. See Table 2 for a description of the service lines and routes.
Table 2. Route Descriptions
Service Line
Route Name Sub Service Route Description
Northeast Corridor
Acela Express Acela Express Between Boston, New York (Penn Station), and Washington, DC
Northeast Regional On Spine Northeast Regional
Between Boston, Springfield, New Haven, New York (Penn Station), and Washington, DC
State-Supported Capitol Corridor Capitol Corridor
Between Auburn, Oakland Coliseum, Oakland (Jack London Square Station), and San Jose
Carolinian Carolinian Between Charlotte, NC and New York (Penn Station) Cascades Cascades Between Eugene, Portland, Seattle, and Vancouver
Downeaster Downeaster Between Boston (North Station), Portland, and Brunswick, ME
Empire Ethan Allen Express Between New York (Penn Station) and Rutland, VT
Empire Maple Leaf Between New York (Penn Station) and Toronto
Empire New York - Albany Between New York (Penn Station) and Albany, NY
Empire New York - Niagara Falls Between New York (Penn Station) and Niagara Falls
Heartland Flyer Heartland Flyer Between Fort Worth, TX and Oklahoma City, OK Hiawatha Hiawatha Between Chicago and Milwaukee, WI
Illinois Carl Sandburg / Illinois Zephyr Between Chicago and Quincy, IL
Illinois Illini / Saluki Between Chicago and Carbondale Illinois Lincoln Service Between Chicago and St. Louis
Keystone Keystone Between Harrisburg, PA, Philadelphia, and New York (Penn Station)
Michigan Blue Water Between Chicago and Port Huron
Michigan Pere Marquette Between Chicago and Grand Rapids
Michigan Wolverine Between Chicago and Pontiac
Missouri Missouri Between Kansas City and St. Louis
Northeast Regional
Richmond / Newport News / Norfolk
Between Norfolk, Newport News, Richmond, New York (Penn Station) and Boston
Northeast Regional Roanoke Between Lynchburg/Roanoke, VA and Boston

Quarterly Report on Performance and Service Quality of Intercity Passenger Train Operations
7
Service Line
Route Name Sub Service Route Description
Northeast Regional Springfield Shuttles Between New Haven, CT, and Springfield, MA
Pacific Surfliner Pacific Surfliner Between San Luis Obispo, Goleta, Los Angeles, and San Diego, CA
Pennsylvanian Pennsylvanian Between New York (Penn Station) and Pittsburgh
Piedmont Piedmont Between Charlotte and Raleigh, NC
San Joaquins San Joaquins Between Bakersfield, Oakland (Jack London Square Station), and Sacramento, CA
Vermonter Vermonter Between St. Albans, VT, and Washington, DC Long Distance
Auto Train Auto Train Between Lorton, VA, and Sanford, FL
California Zephyr California Zephyr Between Chicago and Emeryville, CA
Capitol Ltd Capitol Ltd Between Chicago and Washington, DC
Cardinal Cardinal Between Chicago and New York (Penn Station) via Cincinnati
City Of New Orleans
City Of New Orleans
Between New York (Penn Station) and New Orleans
Coast Starlight Coast Starlight Between Los Angeles and Seattle
Crescent Crescent Between New York (Penn Station) and New Orleans
Empire Builder Empire Builder Between Chicago, Portland, and Seattle
Lake Shore Ltd Lake Shore Ltd Between Chicago, New York (Penn Station), and Boston via Cleveland and Buffalo
Palmetto Palmetto Between New York (Penn Station) and Savannah, GA
Silver Meteor Silver Meteor Between New York (Penn Station) and Miami via Charleston, SC
Silver Star Silver Star Between New York (Penn Station) and Miami via Columbia, SC
Southwest Chief Southwest Chief Between Chicago and Los Angeles
Sunset Ltd Sunset Ltd Between Los Angeles and New Orleans
Texas Eagle Texas Eagle Between Chicago and San Antonio
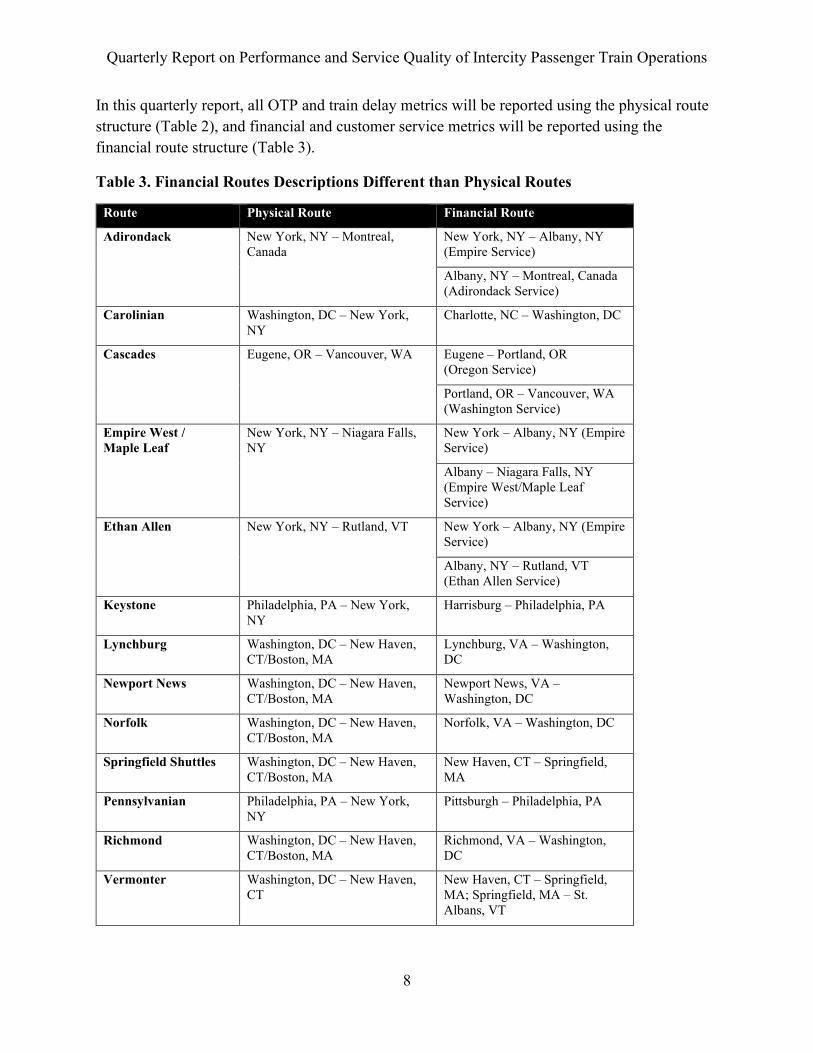
For some routes, Amtrak reports operational (train performance) data differently than it reports financial or ridership data. In some State-supported service arrangements, a State, under a contractual agreement with Amtrak, will provide financial support for a portion of a larger route.
Amtrak has two route hierarchies within its reporting systems to account for these arrangements. The first route hierarchy is used to track the physical versions of the routes on the network. This hierarchy includes the entire physical train that moves between its origin and ultimate destination. The second hierarchy, financial routes, are a financial construction in Amtrak’s accounting that breaks the physical train up into the Amtrak-supported portion of the route and State-supported portion of the route. These financial routes exist to allocate financials between the State-supported segment and the Amtrak-Supported segment for various accounting purposes. See Table 3 for a summary of where financial routes may be different from physical routes.
Quarterly Report on Performance and Service Quality of Intercity Passenger Train Operations
8
In this quarterly report, all OTP and train delay metrics will be reported using the physical route structure (Table 2), and financial and customer service metrics will be reported using the financial route structure (Table 3).
Table 3. Financial Routes Descriptions Different than Physical Routes
Route Physical Route Financial Route
Adirondack New York, NY – Montreal, Canada
New York, NY – Albany, NY (Empire Service)
Albany, NY – Montreal, Canada (Adirondack Service)
Carolinian Washington, DC – New York, NY
Charlotte, NC – Washington, DC
Cascades Eugene, OR – Vancouver, WA Eugene – Portland, OR (Oregon Service)
Portland, OR – Vancouver, WA (Washington Service)
Empire West / Maple Leaf
New York, NY – Niagara Falls, NY
New York – Albany, NY (Empire Service)
Albany – Niagara Falls, NY (Empire West/Maple Leaf Service)
Ethan Allen New York, NY – Rutland, VT New York – Albany, NY (Empire Service)
Albany, NY – Rutland, VT (Ethan Allen Service)
Keystone Philadelphia, PA – New York, NY
Harrisburg – Philadelphia, PA
Lynchburg Washington, DC – New Haven, CT/Boston, MA
Lynchburg, VA – Washington, DC
Newport News Washington, DC – New Haven, CT/Boston, MA
Newport News, VA – Washington, DC
Norfolk Washington, DC – New Haven, CT/Boston, MA
Norfolk, VA – Washington, DC
Springfield Shuttles Washington, DC – New Haven, CT/Boston, MA
New Haven, CT – Springfield, MA
Pennsylvanian Philadelphia, PA – New York, NY
Pittsburgh – Philadelphia, PA
Richmond Washington, DC – New Haven, CT/Boston, MA
Richmond, VA – Washington, DC
Vermonter Washington, DC – New Haven, CT
New Haven, CT – Springfield, MA; Springfield, MA – St. Albans, VT

Quarterly Report on Performance and Service Quality of Intercity Passenger Train Operations
9
IV. Quarterly Reporting Tables
This section includes definitions of each of the metrics and any associated standard. There are also descriptions of the reported data for each metric, including definitions of key terms, and other notes as needed. To access the data files, please visit: https://railroads.dot.gov/passenger-rail/amtrak/intercity-passenger-rail-service-quality-and-performance-reports. The following services did not operate during the quarter: Northeast Regional-Richmond, Adirondack, Ethan Allen, and Vermonter.
A. On-Time Performance and Train Delays
1. Customer On-Time Performance The customer on-time performance metric is the percentage of all customers on an intercity passenger rail train who arrive at their detraining point no later than 15 minutes after their published scheduled arrival time, reported by train and by route. The customer on-time performance minimum standard is 80 percent for any 2 consecutive quarters.
Data Description and Notes No data reported for this quarter. This metric will be reported in the quarterly report covering July 1 – September 30, 2021.
2. Ridership Data The ridership data metric is the number of host railroads to whom Amtrak has provided ridership data reported by host railroad and by month.
Data Description and Notes Ridership data means, in a machine-readable format: the total number of passengers, by train and by day; the station-specific number of detraining passengers, reported by host railroad, whose railroad right-of-way serves the station, by train and by day; and the station-specific number of on-time passengers reported by host railroad whose railroad right-of-way serves the station, by train and by day. There are two host railroads not listed in the data over which Amtrak does not currently operate: Florida East Coast Railway and Sound Transit. Ridership data will be provided to these host railroads in advance of operations. Amtrak provided ridership data to Portland Terminal Railroad Company via BNSF Railway.
3. Certified Schedules The certified schedule metric is the number of certified schedules, uncertified schedules, and disputed schedules, reported by train, by route, and by host railroad (excluding switching and terminal railroads), identified in a notice to the Federal Railroad Administrator by Amtrak.

Quarterly Report on Performance and Service Quality of Intercity Passenger Train Operations
10
Data Description and Notes Monthly reports are available at: https://railroads.dot.gov/passenger-rail/amtrak/intercity-passenger-rail-service-quality-and-performance-reports. No data reported for this quarter. This metric will be reported in the quarterly report covering July 1 – September 30, 2021. Certified schedule means a published train schedule that Amtrak and the host railroad jointly certify is aligned with the customer on-time performance metric and standard. Uncertified schedule means a published train schedule that has not been reported as a certified schedule or a disputed schedule. Disputed schedule means: (1) A published train schedule for which a specific change is sought: (i) that is the only subject of a non-binding dispute resolution process led by a neutral third-party and involving Amtrak and one or more host railroads; (ii) that is the only subject of a non-binding dispute resolution process led by a neutral third-party that has been initiated by one or more host railroads and Amtrak has not consented to participate in the process within 30 calendar days; or (iii) that is the only subject of a non-binding dispute resolution process led by a neutral third-party that has been initiated by Amtrak and the host railroad has not consented to participate in the process within 30 calendar days.
4. Train Delays The train delays metric is the minutes of delay for all Amtrak-responsible delays, host-responsible delays, and third-party delays, for the host railroad territory within each route. The train delays metric is reported by delay code by: total minutes of delay; Amtrak-responsible delays; Amtrak’s host-responsible delays; Amtrak’s host-responsible delays and Amtrak-responsible delays combined; non-Amtrak host-responsible delays; and third-party delays. The train delays metric is also reported by the number of non-Amtrak host-responsible delay minutes disputed by host railroad and not resolved by Amtrak.
Data Description and Notes Amtrak-responsible delays means delays recorded by Amtrak, in accordance with Amtrak procedures, as Amtrak-responsible delays, including passenger-related delays at stations, Amtrak equipment failures, holding for connections, injuries, initial terminal delays, servicing delays, crew and system delays, and other miscellaneous Amtrak-responsible delays. Host-responsible delays means delays recorded by Amtrak, in accordance with Amtrak procedures, as host-responsible delays, including freight train interference, slow orders, signals, routing, maintenance of way, commuter train interference, passenger train interference, catenary or wayside power system failure, and detours. Third-party delays means delays recorded by Amtrak, in accordance with Amtrak procedures, as third-party delays, including bridge strikes, debris strikes, customs, drawbridge openings, police-related delays, trespassers, vehicle strikes, utility company delays, weather-related delays (including heat or cold orders, storms, floods/washouts,

Quarterly Report on Performance and Service Quality of Intercity Passenger Train Operations
11
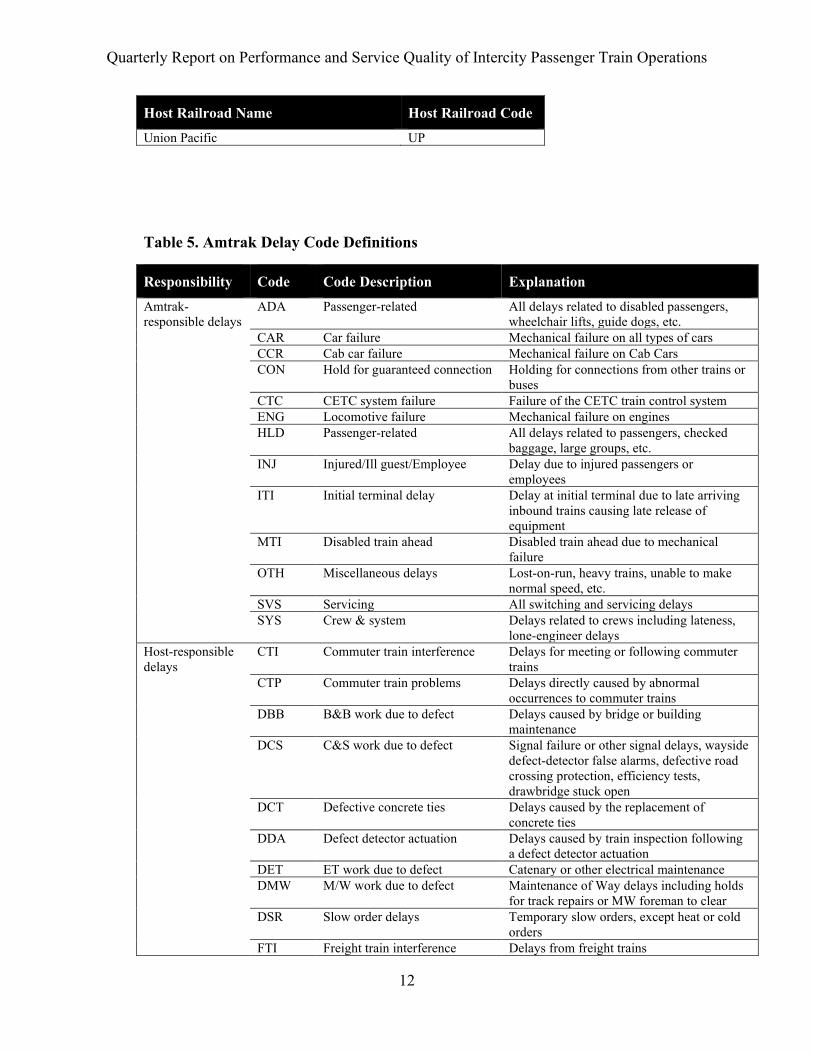
earthquake-related delays, slippery rail due to leaves, flash-flood warnings, wayside defect detector actuations caused by ice, and high-wind restrictions), acts of God, or waiting for scheduled departure time. In this quarterly dataset, the third-party delays are coded as “Neither.” Delay minutes disputed by host railroad and not resolved by Amtrak means delay minutes for which a host railroad disputed the code used by Amtrak to classify the delay, or the number of delay minutes assigned to the host railroad, but were not changed by Amtrak after the host’s initial request. Ultimately, Amtrak and the host railroads may agree that a different delay code or number of delay minutes is appropriate following further discussion; this data only reports delay minutes that were not adjusted after the host railroad’s initial request for reclassification. Delays are reported by operating business line, which is similar to the service line structure (see Amtrak Route Structure and Descriptions). The NEC business line includes the following routes: Acela, Northeast Regional, Northeast Regional – Richmond / Newport News / Norfolk, Northeast Regional – Roanoke, and Northeast Regional – Springfield Shuttles. See Table 4 for a list of host railroads and abbreviated host railroad codes used in the delay reports. See Table 5 for a list of the delay codes, abbreviations, and responsibilities. Table 4. Host Railroad Names and Codes
Host Railroad Name Host Railroad Code Amtrak AM Belt Railway of Chicago BR BNSF Railway Company BN Buckingham Branch Railroad BB Central Florida Rail Corridor FR Chicago Terminal CT CN – IC (Former GTW and IC) CC Conrail Shared Assets CR CP Rail (Soo Line) CP CSX Corporation CS Florida DOT (CSX Dispatched) FL Kansas City Terminal KC Long Island Railroad LG Massachusetts DOT MA MBTA MT Metra ME Metro-North Railroad MN Michigan DOT MI Minnesota Commercial MC New Mexico DOT NM Norfolk Southern NS Pan Am Railways (formerly Guilford) GT S.C.R.R.A (Moorpark to LAX) SC San Diego Northern SN Terminal Railroad Assn. Of St. Louis (TRRA) TR Trinity Rail Express TE
Quarterly Report on Performance and Service Quality of Intercity Passenger Train Operations
12
Host Railroad Name Host Railroad Code Union Pacific UP
Table 5. Amtrak Delay Code Definitions
Responsibility Code Code Description Explanation Amtrak-responsible delays
ADA Passenger-related All delays related to disabled passengers, wheelchair lifts, guide dogs, etc.
CAR Car failure Mechanical failure on all types of cars CCR Cab car failure Mechanical failure on Cab Cars CON Hold for guaranteed connection Holding for connections from other trains or
buses CTC CETC system failure Failure of the CETC train control system ENG Locomotive failure Mechanical failure on engines HLD Passenger-related All delays related to passengers, checked
baggage, large groups, etc. INJ Injured/Ill guest/Employee Delay due to injured passengers or
employees ITI Initial terminal delay Delay at initial terminal due to late arriving
inbound trains causing late release of equipment
MTI Disabled train ahead Disabled train ahead due to mechanical failure
OTH Miscellaneous delays Lost-on-run, heavy trains, unable to make normal speed, etc.
SVS Servicing All switching and servicing delays SYS Crew & system Delays related to crews including lateness,
lone-engineer delays Host-responsible delays
CTI Commuter train interference Delays for meeting or following commuter trains
CTP Commuter train problems Delays directly caused by abnormal occurrences to commuter trains
DBB B&B work due to defect Delays caused by bridge or building maintenance
DCS C&S work due to defect Signal failure or other signal delays, wayside defect-detector false alarms, defective road crossing protection, efficiency tests, drawbridge stuck open
DCT Defective concrete ties Delays caused by the replacement of concrete ties
DDA Defect detector actuation Delays caused by train inspection following a defect detector actuation
DET ET work due to defect Catenary or other electrical maintenance DMW M/W work due to defect Maintenance of Way delays including holds
for track repairs or MW foreman to clear DSR Slow order delays Temporary slow orders, except heat or cold
orders FTI Freight train interference Delays from freight trains
Quarterly Report on Performance and Service Quality of Intercity Passenger Train Operations
13
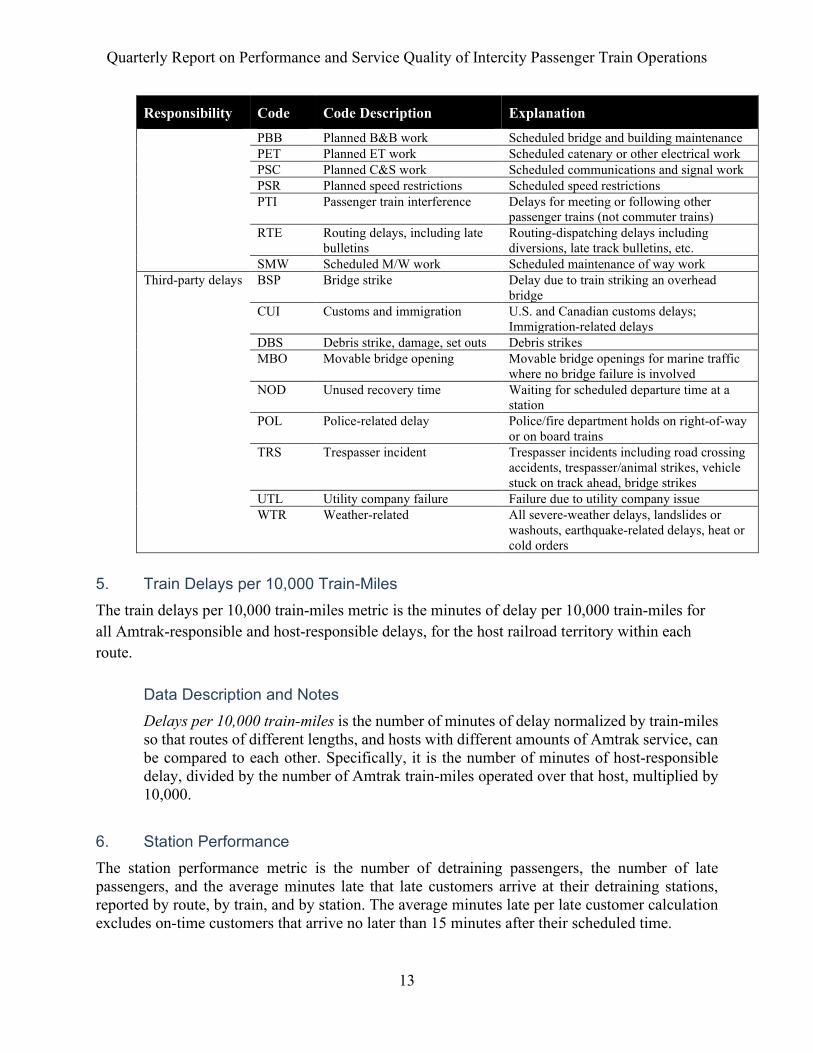
Responsibility Code Code Description Explanation PBB Planned B&B work Scheduled bridge and building maintenance PET Planned ET work Scheduled catenary or other electrical work PSC Planned C&S work Scheduled communications and signal work PSR Planned speed restrictions Scheduled speed restrictions PTI Passenger train interference Delays for meeting or following other
passenger trains (not commuter trains) RTE Routing delays, including late
bulletins Routing-dispatching delays including diversions, late track bulletins, etc.
SMW Scheduled M/W work Scheduled maintenance of way work Third-party delays BSP Bridge strike Delay due to train striking an overhead
bridge CUI Customs and immigration U.S. and Canadian customs delays;
Immigration-related delays DBS Debris strike, damage, set outs Debris strikes MBO Movable bridge opening Movable bridge openings for marine traffic
where no bridge failure is involved NOD Unused recovery time Waiting for scheduled departure time at a
station POL Police-related delay Police/fire department holds on right-of-way
or on board trains TRS Trespasser incident Trespasser incidents including road crossing
accidents, trespasser/animal strikes, vehicle stuck on track ahead, bridge strikes
UTL Utility company failure Failure due to utility company issue WTR Weather-related All severe-weather delays, landslides or
washouts, earthquake-related delays, heat or cold orders
5. Train Delays per 10,000 Train-Miles The train delays per 10,000 train-miles metric is the minutes of delay per 10,000 train-miles for all Amtrak-responsible and host-responsible delays, for the host railroad territory within each route.
Data Description and Notes Delays per 10,000 train-miles is the number of minutes of delay normalized by train-miles so that routes of different lengths, and hosts with different amounts of Amtrak service, can be compared to each other. Specifically, it is the number of minutes of host-responsible delay, divided by the number of Amtrak train-miles operated over that host, multiplied by 10,000.
6. Station Performance The station performance metric is the number of detraining passengers, the number of late passengers, and the average minutes late that late customers arrive at their detraining stations, reported by route, by train, and by station. The average minutes late per late customer calculation excludes on-time customers that arrive no later than 15 minutes after their scheduled time.

Quarterly Report on Performance and Service Quality of Intercity Passenger Train Operations
14
Data Description and Notes. No data reported for this quarter. This metric will be reported in the quarterly report covering July 1 – September 30, 2021.
7. Host Running Time The host running time metric is the average actual running time and the median actual running time compared with the scheduled running time between the first and final reporting points for a host railroad set forth in the Amtrak schedule skeleton, reported by route, by train, and by host railroad (excluding switching and terminal railroads).
Data Description and Notes. Actual running time means the actual elapsed travel time of a train’s travel on a host railroad, between the departure time at the first reporting point for a host railroad segment and the arrival time at the reporting point at the end of the host railroad segment. Scheduled running time means the scheduled duration of a train’s travel on a host railroad, as set forth in the Amtrak schedule skeleton. Schedule skeleton means a schedule grid used by Amtrak and host railroads to communicate the public schedule of an Amtrak train and the schedule of operations of an Amtrak train on host railroads. No data reported for this quarter. This metric will be reported in the quarterly report covering July 1 – September 30, 2021.
B. Customer Service
1. Customer Satisfaction The customer satisfaction metric is the percent of respondents to the Amtrak customer satisfaction survey who provided a score of 70 percent or greater for their “overall satisfaction” on a 100-point scale for their most recent trip, by route, shown both adjusted for performance and unadjusted. 2. Amtrak Personnel The Amtrak personnel metric is the average score from respondents to the Amtrak customer satisfaction survey for their overall review of Amtrak personnel on their most recent trip, by route. 3. Information Given The information given metric is the average score from respondents to the Amtrak customer satisfaction survey for their overall review of information provided by Amtrak on their most recent trip, by route.
Quarterly Report on Performance and Service Quality of Intercity Passenger Train Operations
15
4. On-board Comfort The on-board comfort metric is the average score from respondents to the Amtrak customer satisfaction survey for their overall review of onboard comfort on their most recent trip, by route. 5. On-board Cleanliness The on-board cleanliness metric is the average score from respondents to the Amtrak customer satisfaction survey for their overall review of on-board cleanliness on their most recent trip, by route. 6. On-board Food Service The on-board food service metric is the average score from respondents to the Amtrak customer satisfaction survey for their overall review of on-board food service on their most recent trip, by route.
Data Description and Notes for all Customer Service Metrics Amtrak’s customer satisfaction survey means a market-research survey that measures Amtrak’s satisfaction score as measured by specific service attributes that cover the entire customer journey. FRA will publish information about Amtrak’s customer satisfaction survey (including the survey questions and methodology) annually as an appendix to the quarterly report. Amtrak adjusts overall satisfaction score performance by removing passengers who arrive at their destinations on State-supported and long-distance routes excessively late (30 minutes late for State-supported routes and 120 minutes for long-distance routes) from the system-wide calculation. Amtrak provided the percent of respondents to the Amtrak customer satisfaction survey who provided a score of 70 percent or greater for their overall satisfaction (Top 4) and the percent of respondents who provided a score of 80 percent or greater (Top 3).
C. Financial
1. Cost Recovery The cost recovery metric is Amtrak’s adjusted operating revenue divided by Amtrak’s adjusted operating expense. This metric is reported at the corporate level/system-wide and for each route and is reported in constant dollars of the reporting year based on the Office of Management and Budget’s gross domestic product chain deflator.
Data Description and Notes Adjusted operating expenses means Amtrak’s operating expenses adjusted to exclude certain Amtrak expenses that are not considered core to operating the business. The major exclusions are depreciation, capital project–related expenditures not eligible for capitalization, the non-cash portion of pension and post-retirement benefits, and Amtrak’s

Quarterly Report on Performance and Service Quality of Intercity Passenger Train Operations
16
Office of Inspector General expenses. Adjusted operating expenses do not include any operating expenses for State-supported routes that are paid for separately by States. System-wide (Total Amtrak) includes Ancillary and Infrastructure expenses not related to train operations. National Train Service includes expenses from all train operations and routes. Special Trains includes expenses related to contracting of Amtrak’s equipment crews for private excursion. FY21 Q3 results do not include a late June Insurance Claim entry for $15 million.
2. Avoidable Operating Costs Covered by Passenger Revenue The avoidable operating costs covered by passenger revenue metric is the percent of avoidable operating costs divided by passenger revenue for each route, shown with and without State operating payments.
Data Description and Notes Avoidable operating costs means costs incurred by Amtrak to operate train service along a route that would no longer be incurred if the route were no longer operated. For this quarterly report, Avoidable Operating Expense is calculated by adding Frequency Variable & Route Variable costs. Passenger revenue means intercity passenger rail revenue generated from passenger train operations, including ticket revenue, food and beverage sales, operating payments collected from States or other sponsoring entities, special trains, and private car operations.
3. Fully Allocated Core Operating Costs Covered by Passenger Revenue The fully allocated core operating costs covered by passenger revenue metric is the percent of fully allocated core operating costs divided by passenger revenue for each route, shown with and without State operating payments.
Data Description and Notes Fully allocated core operating costs means Amtrak’s total costs associated with operating an Amtrak route, including direct operating expenses, a portion of shared expenses, and a portion of corporate overhead expenses. Fully allocated core operating costs exclude ancillary and other expenses that are not directly reimbursed by passenger revenue to match revenues with expenses. Passenger revenue means intercity passenger rail revenue generated from passenger train operations, including ticket revenue, food and beverage sales, operating payments collected from States or other sponsoring entities, special trains, and private car operations.

Quarterly Report on Performance and Service Quality of Intercity Passenger Train Operations
17
4. Average Ridership The average ridership metric is the number of passenger-miles divided by train-miles for each route.
Data Description and Notes None.
5. Total Ridership The total ridership metric is the total number of passengers on Amtrak trains, reported by route.
Data Description and Notes None.
D. Public Benefits
1. Connectivity The connectivity metric is the percent of passengers connecting to and from other Amtrak routes, updated on an annual basis.
Data Description and Notes Under this metric, a connection means a passenger arriving on one train and connecting to a departing train within 23 hours. No data reported for this quarter. This metric will be updated annually and will be reported in the quarterly report covering October 1 – December 31, 2021.
2. Missed Connections The missed connections metric is the percent of passengers connecting to/from other Amtrak routes who missed connections due to a late arrival from another Amtrak train, reported by route and updated on an annual basis.
Data Description and Notes No data reported for this quarter. This metric will be updated annually and will be reported in the quarterly report covering October 1 – December 31, 2021.
Quarterly Report on Performance and Service Quality of Intercity Passenger Train Operations
18
3. Community Access The community access metric is the percent of Amtrak passenger-trips to and from not well-served communities, updated on an annual basis.
Data Description and Notes Not well-served communities means those rural communities: within 25 miles of an intercity passenger rail station; more than 75 miles from a large airport; and more than 25 miles from any other airport with scheduled commercial service or an intercity bus stop. No data reported for this quarter. This metric will be updated annually and will be reported in the quarterly report covering October 1 – December 31, 2021.
4. Service Availability The service availability metric is the total number of daily Amtrak trains per 100,000 residents in a metropolitan statistical area (MSA) for each of the top 100 MSAs in the United States, shown in total and adjusted for time of day, updated on an annual basis.
Data Description and Notes The metric, as adjusted for time of day, shows only those trains that arrive or depart between 5:00 a.m. and 11:00 p.m. No data reported for this quarter. This metric will be updated annually and will be reported in the quarterly report covering October 1 – December 31, 2021.