TfL’s quarterly finance, performance reports
165
TfL’s quarterly finance, investment and operational performance reports Quarter 4, 2015/16
Transcript of TfL’s quarterly finance, performance reports

TfL’s quarterly finance, investment and operational performance reportsQuarter 4, 2015/16

About Transport for London
We are the integrated transport authority for London. Our purpose is to keep London working and growing
and to make life in the Capital better. We reinvest all of our income to run and improve London’s transport
services.
Our operational responsibilities include London Underground, London Buses, Docklands Light Railway,
London Overground, TfL Rail, London Trams, London River Services, London Dial-a-Ride, Victoria Coach
Station, Santander Cycles and the Emirates Air Line.
On the roads, we regulate taxis and the private hire trade, run the Congestion Charging scheme, manage the
city’s 580km red route network, operate all of the Capital’s 6,200 traffic signals and work to ensure a safe
environment for all road users.
We are delivering one of the world’s largest programmes of transport capital investment, which is building
Crossrail, modernising Tube services and stations, improving the road network and making the roads safer,
especially for more vulnerable road users, such as pedestrians and cyclists.
We are pioneers in integrated ticketing and providing information to help people move around London.
Oyster is the world’s most popular smartcard, and contactless payment is making travel ever more
convenient. Real-time travel information is provided by us directly and through third parties who use the
data TfL makes openly and freely available to power apps and other services.
Improving and expanding transport in London is central to driving economic growth, jobs and housing across
the country.

2
Executive Summary Quarter 4 (Periods 10-13), 13 December 2015 – 31 March 2016
Our performance was strong over the full year. Customer satisfaction improved, or was maintained, on
every service, with both London Underground (LU) and buses achieving their highest levels. Passenger
journeys were also up on last year for most of our services, although buses saw a decline in demand. Bus
journeys were down due to a slight dip in reliability this year, due to congestion from increased traffic flows
and the construction of effects of our Road Modernisation Plan; we expect bus reliability and passenger
journeys to pick up in the latter half of 2016/17. Underlying reliability improved in LU for the fifth
consecutive year. Road safety has seen further improvements; the numbers of people killed and seriously
injured on our roads is down by 42.3 per cent from the 2005-2009 baseline, the lowest level on record.
Our finances show some slippage against Budget over the full year. Our Operating Account is £202m under
Budget while our Capital Account is £113m lower than Budget. Total cash balances (including funds ring
fenced for the Crossrail project) now stand at £3.3bn, £315m higher than Budget. Over the full year we used
£1,364m of our cash reserves to help fund our capital investment programme.
Outlook
We are now undertaking a root-and-branch review of our business to eliminate unnecessary duplication in
our operations, obtain greater value from our vast procurement activity, significantly cut reliance on
expensive agency staff and stop IT projects which only deliver limited benefits. We have already identified
savings to cover the next two years, including:
A fundamental review of our organisational structure to review management layers and eliminate
wasteful duplication across all our functions, including bringing together engineering operations and IT
departments (estimated saving £20-25m)
Improved procurement and renegotiation of contracts from our suppliers and other third-party spending
which accounts for over two thirds of our total budget (estimated saving £50-60m)
Reprioritisation and consolidation of IT projects which deliver relatively low benefits (estimated saving
£20-30m)
Freezing recruitment for all but the most essential roles and significantly cutting the most expensive of
the existing circa 3,000 agency contractors

3
Customer
• Customer satisfaction levels remain high, with all services better, or equal to, target and last year. Over
the full year, LU achieved record customer satisfaction levels of 85 – this was consistently achieved in
every individual quarter. This has been achieved against a backdrop of record passenger journeys, with
journeys up 3.4 per cent from 2014/15.
• Bus customer satisfaction was 86 over the year, equalling its highest score on record.
• Underlying LU passenger journeys remain strong, with a record breaking number of journeys in Quarter
3. The quarter saw four out of five of the busiest weeks and the five busiest days on record.
• Bus passenger journeys remain down against target and last year. Over the full year bus passenger
journeys totalled 2,323 million, 62 million or 2.6 per cent lower than last year, and 122 million or 5 per
cent below Budget. Journeys in Quarter 4 were particularly low, with 57 million fewer journeys than the
same quarter last year, a decline of 8 per cent.
Reliability
• Underlying LU reliability is at its best ever levels, with year-on-year reductions every year since 2011.
LU delivered a 38 per cent reduction in delays from 2011 to 2015, with delays on the Tube now at their
lowest ever level. On the Victoria, Jubilee and Northern lines, reliability has improved by 74 per cent, 67
per cent and 40 per cent respectively.
• Both bus excess wait time and theTransport for London Road Network (TLRN) journey time reliability
continue to be affected by increased traffic levels, a rapidly rising population, and by our Road
Modernisation Plan and urban improvement schemes.
• This has led to a worsening in bus reliability. Over the full year, bus excess wait time was 1.2 minutes,
0.1 minutes worse than target and last year. We have introduced measures to improve reliability and
reduce the short-term construction impacts from our Road Modernisation Plan, and expect reliability to
see improvement from the second half of 2016/17.

4
Safety and security
The number of people killed and seriously injured (KSI) on our roads continues to fall. Figures from our
annual Casualties in Greater London report show that KSIs fell by three per cent in2015 to the lowest
level on record and by 42.3 per cent from the 2005-2009 baseline1. This performance keeps us on track
meet the tougher longer term target of a 50 per cent reduction in KSIs by 2020 against the baseline.
Both the rates and volumes of crime are up on our services. Since 2010/11, the crime rate fell by 29 per
cent on buses to 7.5 crimes per million passenger journeys, and by 36 per cent on the LU and DLR
network to 7.3 crimes per million passenger journeys. However, despite this long-term reduction, there
has been a rise in the volume of recorded crime this year compared with 2014/15 on all networks. This
increase is largely due to rises in reported sexual offences and violence against the person (VAP) - the
latter primarily due to new crime recording practices introduced in summer 2014.
Financial update
Our Operating Account is £202m under Budget while our Capital Account is £113m lower than Budget.
The underspend on our Operating Account was driven by lower bus fares income of £87m, more than
offset by project rephasing of £200m and cost reductions of £100m.
Our Capital Account variance was driven by £548m of project rephasing to future years (which is offset
by a £337m overprogramming provision), and a net increase in costs of £60m, the latter largely from the
Metropolitan Line Extension. This project will be funded by the DfT and from a Local Enterprise
Partnership.
Total cash balances (including funds ring fenced for the Crossrail project) now stand at £3.3bn, £315m
higher than Budget. Over the full year we used £1,364m of our cash reserves to help fund our capital
investment programme.
We expect to continue to use our cash balances to fund the improvements outlined in the new 2016/17
Budget and Business Plan. We also hold a prudential minimum level of cash - approximately £500m -
which is held for exceptional circumstances and so that we retain a high credit rating with our investors.
Following continued investment we expect our cash balances – after taking into account the prudential
minimum - to reduce to zero by the end of 2017/18.
£2.8bn cash funding
for investment projects
Crossrail £1.5bn
Cycle Superhighways £0.1bn
New Routemasters £0.1bn
Jubilee, Northern and Victoria line upgrades £0,5bn
Bank and Victoria station upgrades £0.5bn
1 The UK standard for measuring reductions in KSI statistics: Strategic framework for road safety (May, 2011)
5
Delivery
Reliability
Rail reliability Full year Variance
to Target
LU: Lost Customer Hours 1 26.4 7.6
LU: Lost Customer Hours
(excl. industrial action) 18.4 -0.4
LU: Excess Journey Time 2 4.6 0.1
LU: Excess Journey Time
(excl. industrial action) 4.3 -0.1
DLR departures 3 98.5 -0.5
DLR departures
(excl. industrial action) 99.1 0.1
London Overground PPM 4 94.4 -0.1
TfL Rail 94.0 2.0
Bus and roads reliability Full year Variance
to Target
Buses: Excess Wait Time 5 1.2 0.1
TLRN journey time
reliability 6 87.8 0.8
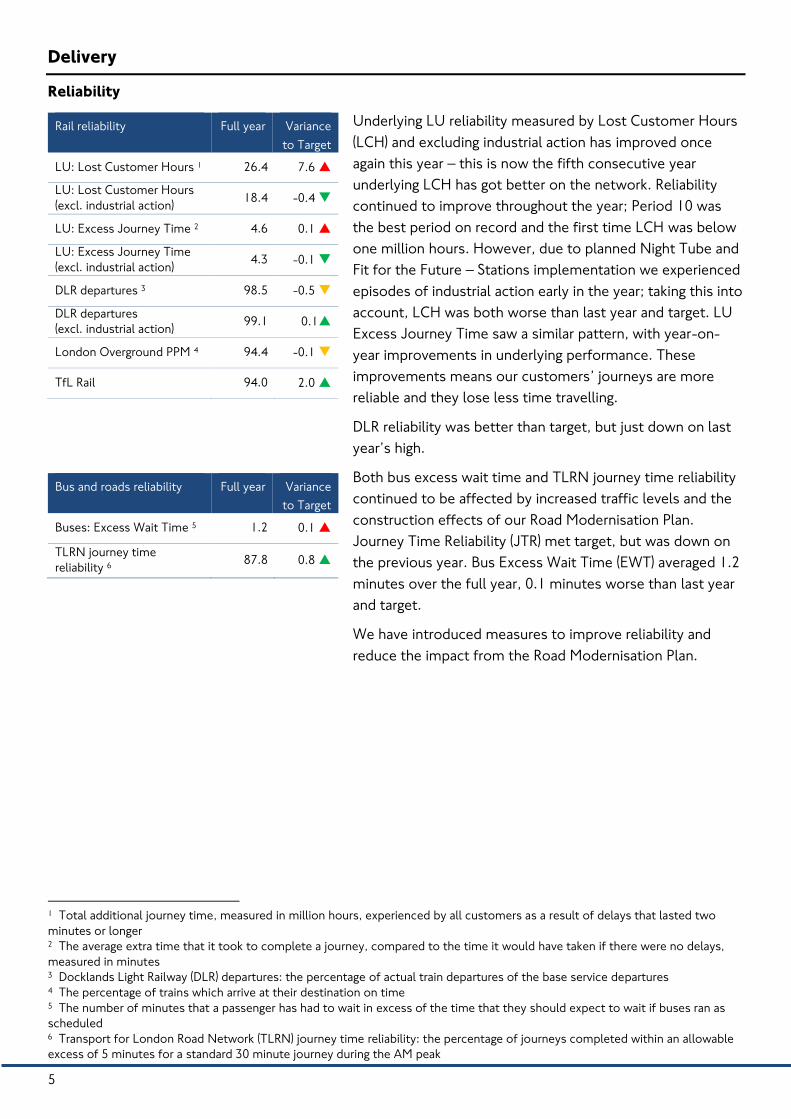
Underlying LU reliability measured by Lost Customer Hours
(LCH) and excluding industrial action has improved once
again this year – this is now the fifth consecutive year
underlying LCH has got better on the network. Reliability
continued to improve throughout the year; Period 10 was
the best period on record and the first time LCH was below
one million hours. However, due to planned Night Tube and
Fit for the Future – Stations implementation we experienced
episodes of industrial action early in the year; taking this into
account, LCH was both worse than last year and target. LU
Excess Journey Time saw a similar pattern, with year-on-
year improvements in underlying performance. These
improvements means our customers’ journeys are more
reliable and they lose less time travelling.
DLR reliability was better than target, but just down on last
year’s high.
Both bus excess wait time and TLRN journey time reliability
continued to be affected by increased traffic levels and the
construction effects of our Road Modernisation Plan.
Journey Time Reliability (JTR) met target, but was down on
the previous year. Bus Excess Wait Time (EWT) averaged 1.2
minutes over the full year, 0.1 minutes worse than last year
and target.
We have introduced measures to improve reliability and
reduce the impact from the Road Modernisation Plan.
1 Total additional journey time, measured in million hours, experienced by all customers as a result of delays that lasted two
minutes or longer 2 The average extra time that it took to complete a journey, compared to the time it would have taken if there were no delays,
measured in minutes 3 Docklands Light Railway (DLR) departures: the percentage of actual train departures of the base service departures 4 The percentage of trains which arrive at their destination on time 5 The number of minutes that a passenger has had to wait in excess of the time that they should expect to wait if buses ran as
scheduled 6 Transport for London Road Network (TLRN) journey time reliability: the percentage of journeys completed within an allowable
excess of 5 minutes for a standard 30 minute journey during the AM peak

6
Crime
Recorded crime Full year,
2015/16
Variance
to Target
LU and DLR 7.3 0.5
London Overground 6.8 -0.7
London Buses 7.5 0.3
Crime volumes Full year,
2015/16
Variance
to
2014/15
LU and DLR 10,719 1,120
London Overground 1,253 452
London Buses 17,367 258
Both the rate and levels of crime have improved on the LU
and DLR network and on buses over recent years. Since
2010/11, the crime rate has fallen by 29 per cent on buses
to 7.5 crimes per million passenger journeys, and by 36 per
cent on the LU and DLR network to 7.3 crimes per million
passenger journeys. However, despite this long-term
reduction trend, there has been a rise in recorded crime in
the full year 2015/16 compared with 2014/15 on all the
networks. This increase is largely due to rises in reported
sexual offences and violence against the person (VAP) - the
latter primarily due to new crime recording practices
established in Summer 2014.
Increases in VAP offences reflect wider increases across
London and the UK. VAP offences are being closely
monitored and resources have been put in place to address
the increases.
In line with Project Guardian expectations, there has been an
increase in the number of sexual offences reported to the
police on the bus network and on LU and DLR. Project
Guardian was launched in July 2013 to reduce unwanted
sexual behaviour on public transport in London, which has
been historically underreported. Project Guardian aims to
increase confidence in reporting of sexual offences, to
reduce the risk of becoming a victim and to target offenders.
Road safety
Safety Full year,
2015/16
Variance to
target
Cumulative reduction in
killed and seriously
injured1
42.3 2.3
Road safety has improved dramatically in London.
Provisional figures for 2015 show that there was a reduction
in KSIs of 42.3 per cent from the baseline, to the lowest
level on record.
Quarter 4 continued the trend, with the lowest level of KSIs
(527) on record for Quarter 4; KSIs are 43.9 per cent
reduction from the 2005-2009 baseline. This performance
keeps us on track meet the tougher longer term target of a
50 per cent reduction in KSIs by 2020 against the 2005-2009
baseline.
During Quarter 4, we hosted a 20mph conference for all
London boroughs, providing an update on the 20mph trials
on the TLRN and to share best practice examples of 20mph
implementation, both in London and other parts of the UK.
We also completed a trial of Intelligent Speed Assistance
(ISA) on buses and are reviewing the evidence from the trial
to identify the next steps in applying this technology.
1 The UK standard for measuring reductions in KSI statistics: Strategic framework for road safety (May, 2011).

7
Project and milestone progress
Budget milestone completion 1 Full year,
2015/16
Completed on time or early 88%
Late by less than 90 days 7%
Late by 90 days or more 5%
£m Full year,
2015/16
actuals
Variance to
Budget
Capital expenditure 2,470 99 4%
Revenue investment 310 70 18%
Total investment 2,780 169 6%
Our Investment programme is vital in keeping London
moving, working and growing. In 2015/16 we delivered 88
per cent of our investment project milestones on time,
with a further seven per cent complete within 90 days of
target date. Key milestones and improvements include:
The Central line platforms at Tottenham Court Road
re-opened following an 11-month closure, during
which we constructed a new step-free access lift
shaft, a new passageway that will link to the new
larger ticket hall, and refitted the platforms and
refurbished escalators.
Following the award of the Automatic Train Control
(ATC) contract to Thales we are beginning to fit out
ATC equipment on LU trains, and are now trialling
these at the Derby test track. Once complete this will
help increase passenger capacity through a more
reliable and frequent train service.
As part of our works to enable a 36 trains per hour
peak service to be introduced across the Victoria line
next year, we replaced the deep level crossover at
Walthamstow and installed new, more reliable point
machines. The Victoria line is already the most
frequent rail service in the UK.
On our major Tube station upgrades we achieved a
key milestone with the tunnel breakthrough from
Bond Street station into the new Crossrail station. At
Victoria, we completed the connection of the tunnels
joining the new north ticket hall and enlarged south
ticket hall.
On the Northern Line Extension we started
construction of the retaining walls within which the
new Battersea and Nine Elms Underground stations
and track junctions will be built in subterranean boxes.
On roads we completed the Hammersmith Flyover
strengthening works, which have prolonged its life and
will ensure no major maintenance is required for many
years. As part of our Road Modernisation Plan, we
completed the second phase of works at Elephant &
Castle to transform this vital transport interchange.
We also competed construction of two key Cycle
Superhighways, including the North – South and East –
1 Automatic Train Control (ATC) milestones have been excluded from these scores following the cancellation of the ATC contract
in December 2013

8
West. On the North-South Cycle Superhighway, the
final section of the two-way lane opened on
Blackfriars Bridge, with the full length of the route now
running from Elephant & Castle to Stonecutter Street
near Holborn Viaduct.

9
Value
Financial summary
Operating account
£m Full year,
2015/16
actuals
Variance to
Budget
Fares income 4,550 (90) -2%
Other income 675 34 5%
Total income 5,225 (56) -1%
Operating
expenditure (6,306) 328 5%
Group Items (327) 17 5%
Margin (1,408) 289 17%
DfT grants 628 (41) -6%
GLA precept 6 0 0%
BRR 773 (75) -9%
Other revenue
grants 29 29 N/A
Total revenue
grants 1,436 (87) -6%
Operating
contribution to
fund investment
28 202 116%
Capital account
£m
Full year,
2015/16
actuals
Variance to
Budget
Capital
expenditure (2,413) 98 4%
Sales of property 407 22 6%
Crossrail
expenditure (1,508) 27 2%
Net capital
expenditure (3,514) 146 -4%
Operating
contribution 28 202 116%
Investment grant 925 0 0%
Crossrail funding
sources 959 66 7%
Other capital
grants 132 (33) -20%
Working capital (491) (65) -15%
Net borrowing 598 (3) 0%
Cash movements 1,364 315 19%
Over the full year, our Operating Account is £202m under
Budget while our Capital Account is £113m lower than
Budget. Total cash balances (including funds ring fenced for
the Crossrail project) now stand at £3.3bn, £315m higher
than Budget. Over the full year we used £1,364m of our
cash reserves to help fund our capital investment
programme.
The £202m underspend on our Operating Account is driven
by a combination of:
• Lower fares income of £90m, mainly from £87m lower
bus fares income, driven by less fare-paying passengers,
a result of the deterioration in reliability of the bus
network. This has been partly offset by better than
expected performance on the Tube and London
Overground from increased passenger journeys.
• In addition, fare income is down by a further £22m
across the Group due to a provision for payment of
compensation to the Train Operating Companies (TOCs)
for lost revenue as a result of introduction of daily
capping in January 2015.
• Operating expenditure is £328m under Budget, driven by
a combination of rephasing of project expenditure
totalling £200m (offset by a £53m overprogramming
provision) and cost savings of £100m. Project rephasing
includes: £51m for the Central and Victoria line fleet
Heavy Overhaul Programme; £29m relating to Fit for the
Future – Stations and Predict & Prevent projects; £13m
for Mini Holland schemes; £10m for the Earls Court
Joint Venture. Cost savings include: £18m from LU
operational savings, including traction current and
provisions that were not required; £56m from lower bus
contract costs, a result of lower diesel and wage
inflation, and lower bus performance payments due to
the deterioration in reliability.
• Operating grants are £87m lower than Budget, a result of
lower DfT General Grant of £48m – with £31m from the
Summer Budget – and Business Rates Retention of
£66m, a result of lower receipts to London boroughs.
• Capital expenditure is £98m under Budget, largely a
result of project rephasing. Key rephasing includes the
£113m on the Four Lines Modernisation project, £83m

10
for the Northern Line Extension (NLE), £47m on
infrastructure renewals, £33m for the Metropolitan Line
Extension, £35m on TfL Rail trains, £21m on Cycle
Quietways, £15m on road Structures and Tunnels
projects. In addition, Crossrail project expenditure is
£25m lower than Budget.
• Capital funding is £33m higher than Budget, within an
upside of £66m for Crossrail – largely driven by higher
developers’ contributions – partly offset by lower capital
grants of £33m which is down to match this year’s
underspend on the Northern Line Extension.
Cash balances and movements
£m End of
2015/16
Variance to
Budget
Crossrail SFA 1,539 (35)
Other TfL 1,776 350
Closing cash 3,314 315
£m
Variance to
Budget
Timing differences
Investment rephasing 748
Crossrail 27
Overprogramming (390)
Grant changes (12)
Working capital (65)
Total timing differences 308
Underlying differences
Net cost reductions/ (increases) 39
Group items 17
Fares income (90)
Grant changes (42)
Other 83
Total underlying changes 7
Total cash movements 315
In 2015/16 we used £1,364m of our cash reserves to help
fund our extensive improvements across the transport
network. Against Budget, our cash reserves are now £315m
higher than expected.
Our total cash balances stand at £3,314m at the end of the
financial year, with £1,539m solely ring fenced to deliver the
Crossrail project.
We expect to continue to use our balances to fund the
improvements outlined in the new 2016/17 Budget and
Business Plan. We also hold a prudential minimum level of
cash - approximately £500m - which is held for exceptional
circumstances and so that we retain a high credit rating with
our investors. Following continued investment we expect
our cash balances – after taking into account the prudential
minimum - to reduce to zero by the end of 2017/18.
11
Efficiencies
£m Full year,
2015/16
actuals
Variance to
Budget
Gross savings
secured 180 (16)
Implementation
costs (97) 23
Net efficiencies 83 6
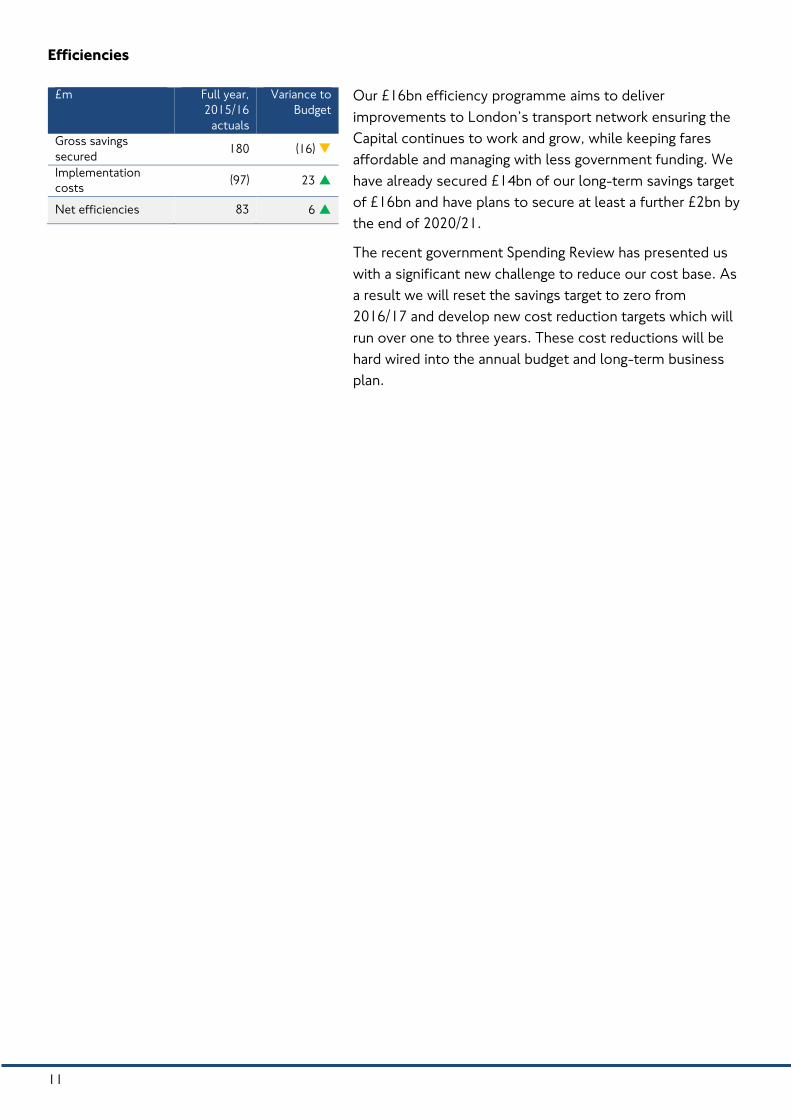
Our £16bn efficiency programme aims to deliver
improvements to London’s transport network ensuring the
Capital continues to work and grow, while keeping fares
affordable and managing with less government funding. We
have already secured £14bn of our long-term savings target
of £16bn and have plans to secure at least a further £2bn by
the end of 2020/21.
The recent government Spending Review has presented us
with a significant new challenge to reduce our cost base. As
a result we will reset the savings target to zero from
2016/17 and develop new cost reduction targets which will
run over one to three years. These cost reductions will be
hard wired into the annual budget and long-term business
plan.

12
Customer
Passenger journeys
Million Full year,
2015/16
Variance to
Target
London Underground 1,349.3 5.6
London Buses 2,323 -122
DLR 117.0 -2.3
London Overground 184.4 15.9
Tramlink 27.0 -4.1
Emirates Air Line 1.5 -0.2
TfL Rail 40.1 8.3
London River Services 10.3 0.1
Cycling
Cycling levels Full year,
2015/16
Variance to
Target
Cycling growth per
cent 3.1 -0.9
Cycling levels on
TLRN1 323 -25
Cycle Hire 9,886 -414
LU experienced a record breaking number of journeys in
2015/16, with a year-on-year increase of 3.4 per cent.
Demand was especially high in Quarter 3, which saw a
record breaking number of journeys with both the four
busiest weeks and five busiest days on record. Daily
passenger journeys topped 4.8 million twice, and weekly
demand exceeded 29 million journeys for the first time.
Bus passenger journeys totalled 2,323 million over the full
year, 62 million or 2.6 per cent lower than last year, and 122
million or 5 per cent below Budget. Journeys in Quarter 4
were particularly low, with 57 million fewer journeys than
the same quarter last year, a decline of 8 per cent.
The primary cause of this decline in demand is due to the
slight deterioration in the reliability of the bus network, due
to increased traffic levels driven by London’s strong
economic growth (including extensive building and
construction projects across London), a rapidly rising
population, our Road Modernisation Plan and by urban
improvement schemes.
Passenger journeys on the DLR in 2015/16 totalled 117
million, an increase of 6.1 per cent – 6.8 million journeys -
on the previous year. Passenger numbers were two per cent
lower than target, largely due to the industrial action in
Period 8.
London Overground saw passengers up by 44.6 million from
2014/15, with 66 per cent of this increase from the new
services operated on the West Anglia route, which began on
31 May 2015.
More than 645,000 journeys are made by bike every day in
London and cycling in London has more than doubled in the
last decade. Over the full year, cycling levels in central
London increased by 3.1 per cent.
2015/16 saw a record £158m invested in cycling. The
budget for the year was £145m, with £13m of schemes
delivered ahead of schedule, principally reflecting good
progress made on the implementation of Cycle
Superhighways.
1 Cycling levels on the Transport for London Road Network (TLRN), indexed at 100 in March 2000
13
Customer satisfaction and complaints
CSS score Full year,
2015/16
Variance
to Target
London Underground 85 1
London Buses 86 1
DLR 89 1
London Overground 84 2
Tramlink 90 2
Emirates Air Line 93 0
TfL Rail 83 3
Transport for London
Road Network (TLRN) 74 0
Dial-a-Ride 92 0
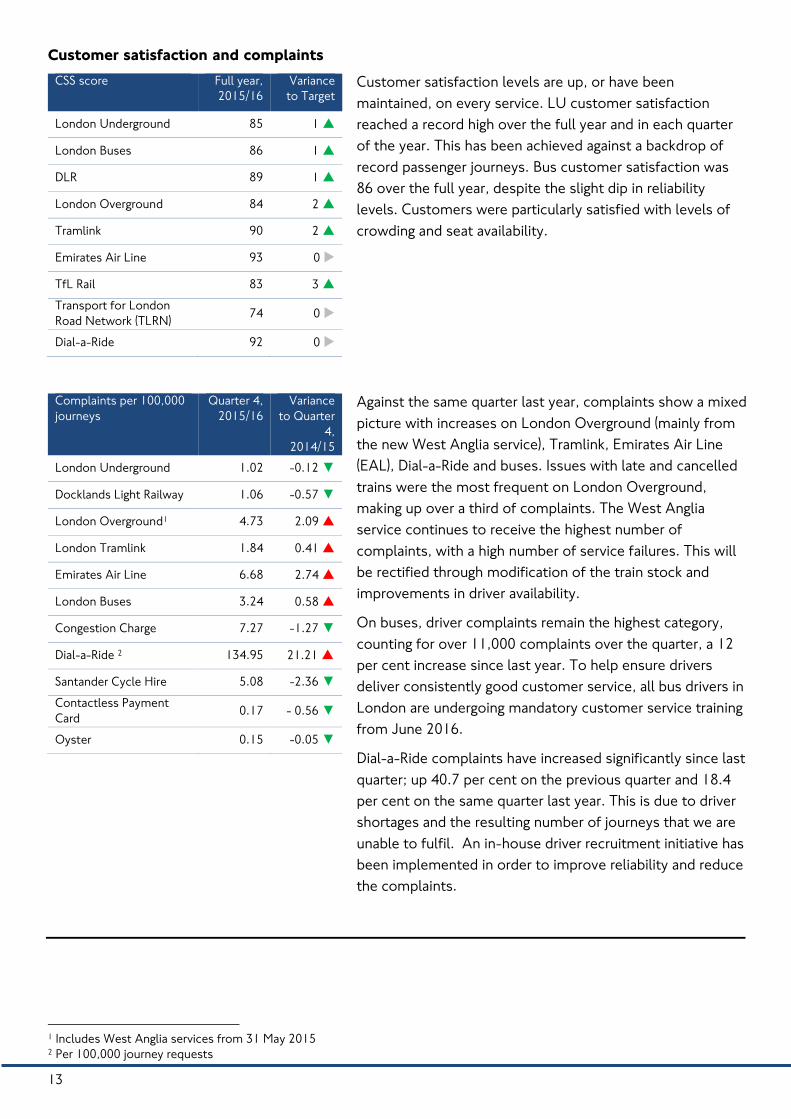
Customer satisfaction levels are up, or have been
maintained, on every service. LU customer satisfaction
reached a record high over the full year and in each quarter
of the year. This has been achieved against a backdrop of
record passenger journeys. Bus customer satisfaction was
86 over the full year, despite the slight dip in reliability
levels. Customers were particularly satisfied with levels of
crowding and seat availability.
Complaints per 100,000
journeys
Quarter 4,
2015/16
Variance
to Quarter
4,
2014/15
London Underground 1.02 -0.12 ▼
Docklands Light Railway 1.06 -0.57 ▼
London Overground1 4.73 2.09
London Tramlink 1.84 0.41
Emirates Air Line 6.68 2.74
London Buses 3.24 0.58
Congestion Charge 7.27 -1.27 ▼
Dial-a-Ride 2 134.95 21.21
Santander Cycle Hire 5.08 -2.36 ▼
Contactless Payment
Card 0.17 - 0.56 ▼
Oyster 0.15 -0.05 ▼
Against the same quarter last year, complaints show a mixed
picture with increases on London Overground (mainly from
the new West Anglia service), Tramlink, Emirates Air Line
(EAL), Dial-a-Ride and buses. Issues with late and cancelled
trains were the most frequent on London Overground,
making up over a third of complaints. The West Anglia
service continues to receive the highest number of
complaints, with a high number of service failures. This will
be rectified through modification of the train stock and
improvements in driver availability.
On buses, driver complaints remain the highest category,
counting for over 11,000 complaints over the quarter, a 12
per cent increase since last year. To help ensure drivers
deliver consistently good customer service, all bus drivers in
London are undergoing mandatory customer service training
from June 2016.
Dial-a-Ride complaints have increased significantly since last
quarter; up 40.7 per cent on the previous quarter and 18.4
per cent on the same quarter last year. This is due to driver
shortages and the resulting number of journeys that we are
unable to fulfil. An in-house driver recruitment initiative has
been implemented in order to improve reliability and reduce
the complaints.
1 Includes West Anglia services from 31 May 2015 2 Per 100,000 journey requests

14
People
Headcount
FTE End of
2015/16
Variance
to Budget
£m staff
cost
variance
to
Budget
London
Underground 21,613 (1,365) (6)
London Rail 378 (73) (7)
Surface Transport 3,859 (132) 0
Shared Services 4,380 (424) (9)
Crossrail 983 21 ▼ 4
Total TfL 31,214 (1,972) (17)
At the end of the financial year, we employed 31,214 full-
time equivalent (FTE) staff, 1,972 more than Budget. Overall
staff costs are £17m higher than Budget over the full year.
While headcount is seven per cent higher than Budget, staff
costs are one per cent over. The financial impact from the
headcount variance to Budget is lessened as the average
headcount variance over the full year was 730. In addition,
pay awards were less than Budget, due to lower inflation and
our new Pay for Performance framework.
The main increases were:
• 652 higher in LU Operations, largely driven by delays to
the Fit for the Future - Stations programme. Staff were
expected to leave during the final quarter of 2015/16,
but the majority of these staff will now leave in the first
quarter of 2016/17. The impact on staff costs is small as
these staff have been employed for an additional three
periods
• 242 additional staff to deliver the Four Lines
Modernisation programme. The cost was included in the
Budget, but we then anticipated staff would be
employed indirectly through the contractor. In
addition,130 Project Management Office (PMO) staff
transferred from shared services, where the cost impact
to TfL is neutral
• 98 additional FTEs in Surface Transport’s Taxi & Private
Hire to support the higher volumes of private hire
licences and compliance activities. These staff will be
funded by through licence application income
• 338 project staff across shared services, supporting
Night Tube and Fit for the Future – Stations
implementation, the London Road User Project,
investment projects including Silvertown Tunnel,
Crossrail 2 development as well as support functions
including Desktop Futures and Web Integration. Staff
costs for most of these additional roles were fully
costed into the project, but were not included as FTE in
the Budget. Staff working on Crossrail 2 are funded by a
DfT grant
• 175 roles due to increased demand, including the Lost
Property Office, customer contact centres, and in HR
due to increased recruitment demand and support for

15
schemes such as graduates and apprentices. These staff
costs were not included in the Budget.

Operational and Financial Performance
Report Quarter 1, 2014/15
Operational and Financial Performance
Report
Quarter 4, 2015/16
2
Operational and Financial Performance Report
Quarter 4 (Periods 10-13), 13 December 2015 – 31 March 2016
Contents
Delivery 3
Value 11
Customer 30
People 40
Appendix A: Business Unit financial tables 42
Appendix B: Reconciliation to the investment programme 44
Appendix C: Balance sheet 45
Appendix D: Cash summary 49
Appendix E: Financial comparison with 2014/15 50
Glossary: Operational performance 52
3
Delivery
Reliability
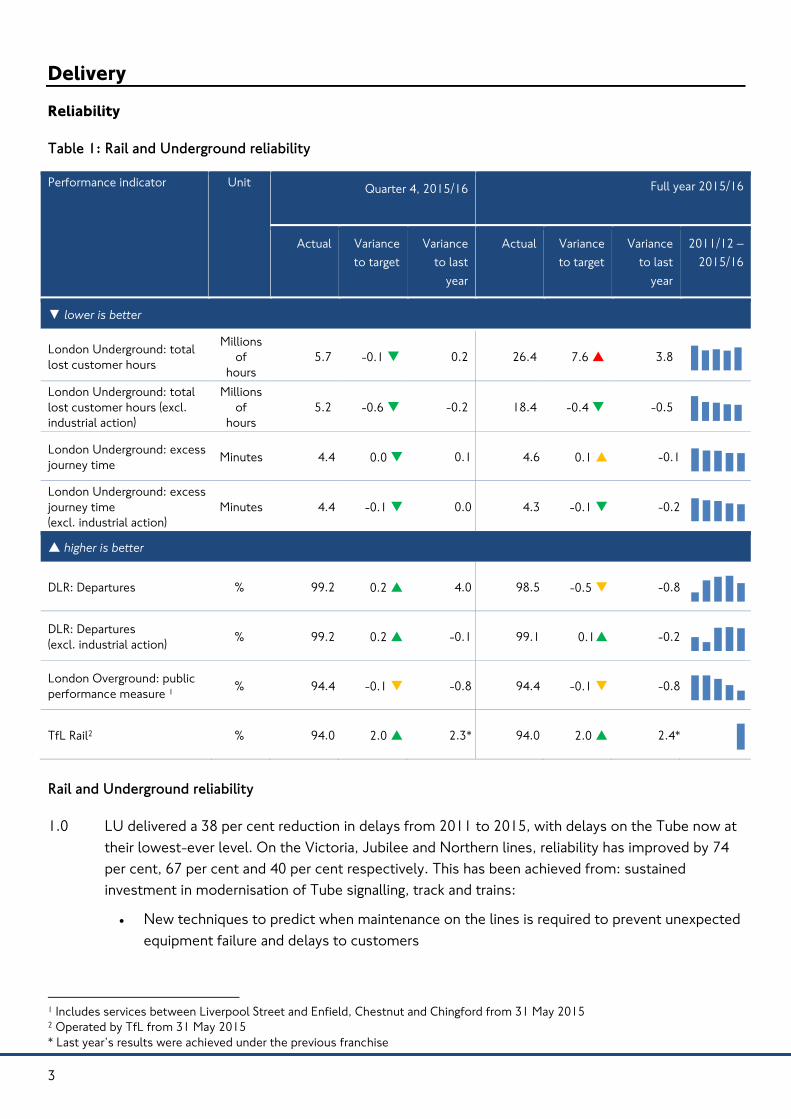
Table 1: Rail and Underground reliability
Performance indicator Unit Quarter 4, 2015/16 Full year 2015/16
Actual Variance
to target
Variance
to last
year
Actual Variance
to target
Variance
to last
year
2011/12 –
2015/16
▼ lower is better
London Underground: total
lost customer hours
Millions
of
hours
5.7 -0.1 0.2 26.4 7.6 3.8
London Underground: total
lost customer hours (excl.
industrial action)
Millions
of
hours
5.2 -0.6 -0.2 18.4 -0.4 -0.5
London Underground: excess
journey time Minutes 4.4 0.0 0.1 4.6 0.1 -0.1
London Underground: excess
journey time
(excl. industrial action)
Minutes 4.4 -0.1 0.0 4.3 -0.1 -0.2
higher is better
DLR: Departures % 99.2 0.2 4.0 98.5 -0.5 -0.8
DLR: Departures
(excl. industrial action) % 99.2 0.2 -0.1 99.1 0.1 -0.2
London Overground: public
performance measure 1 % 94.4 -0.1 -0.8 94.4 -0.1 -0.8
TfL Rail2 % 94.0 2.0 2.3* 94.0 2.0 2.4*
Rail and Underground reliability
1.0 LU delivered a 38 per cent reduction in delays from 2011 to 2015, with delays on the Tube now at
their lowest-ever level. On the Victoria, Jubilee and Northern lines, reliability has improved by 74
per cent, 67 per cent and 40 per cent respectively. This has been achieved from: sustained
investment in modernisation of Tube signalling, track and trains:
New techniques to predict when maintenance on the lines is required to prevent unexpected
equipment failure and delays to customers
1 Includes services between Liverpool Street and Enfield, Chestnut and Chingford from 31 May 2015 2 Operated by TfL from 31 May 2015
* Last year’s results were achieved under the previous franchise

4
Working with the British Transport Police to respond to incidents more quickly by getting
engineers to incidents under ‘blue light’ conditions
Locating engineering and operations staff in one control centre to speed up incident recovery
times
The installation of covers on train passenger alarms, which has significantly reduced the
number of accidental activations.
1.1 Over the full year, underlying LCH which excludes the effects of industrial action, was better than
target and improved on 2014/15. Quarter 4 performance was also significantly better than target
and the same quarter last year. Period 10 was the best period on record and the first time LCH was
below one million. The Quarter saw two significant incidents on the Central line towards the end
of the year: a third party tunnel breach at Shepherd’s Bush, and a power supply problem at Bow.
1.2 London Overground (LO) reliability, as measured by the public performance measure (PPM) moving
annual average (MAA), was 94.4 per cent over the full year, just under the target of 94.5 per cent.
LO had a strong finish to the year, with reliability in three periods of Quarter 4 exceeding 95 per
cent. The West Anglia fleet performed well in Period 13 and, together with better reliability, the
lines out of Liverpool Street achieved 96.3 per cent PPM, representing a vast improvement in
reliability before TfL began operating the service.
1.3 Performance has continued to improve on the services running from Liverpool Street to Shenfield
(known as TfL Rail), which will form part of the Elizabeth line. The PPM MAA has shown a strong
upward trend since TfL took over these services, and is now comfortably better than target. TfL
Rail remains in fifth place in the national PPM league (based on the MAA).
1.4 DLR departures performance was 99.2 per cent for the Quarter and 98.5 per cent over the full year
(excluding industrial action), which was better than target although just down on last year’s
performance. Performance has been consistently good throughout the year on the DLR, having
only dipped below target in three periods, or four including Period 8 when there was a 48 hour
strike.

5
Road and bus reliability
1.5 Since late 2014/15 road and bus reliability have been affected by increased traffic levels, driven by
London’s strong economic growth (including extensive building and construction projects across
London), a rapidly rising population, as well as the construction effects of our Road Modernisation
Plan.
Table 2: Road and bus reliability
Performance indicator Unit Quarter 4, 2015/16 Full year 2015/16
Actual Variance
to target
Variance
to last
year
Actual Variance
to target
Variance
to last
year
2011/12 –
2015/16
▼ lower is better
London Buses: excess
wait time Minutes 1.1 0.0 0.0 1.2 0.1 0.1
TLRN: planned serious
and severe disruption Hours 414 - 80 1,404 -96 473
TLRN: unplanned serious
and severe disruption per
event
Hours per
event 2.0 0.0 -0.2 1.9 -0.1 -0.1 N/A
higher is better
TLRN: journey time
reliability (AM peak) % 88.2 1.3 0.0 87.8 0.8 -0.5
Dial-a-Ride: trip requests
scheduled % 89.3 -1.7 -2.4 89.9 -1.1 -0.3
1.6 Over the full year bus excess wait time was 1.2 minutes, 0.1 minutes worse than both target and
last year. This was due to the continued high levels of congestion caused by London’s population
growth and our Road Modernisation Plan, the latter including major highway schemes, Cycle
Superhighways and urban improvement schemes. Further measures have recently been introduced
to reduce the impact of major roadworks and a wider deterioration in traffic congestion upon
service reliability.
1.7 Full-year journey time reliability in 2015/16 was 87.8%, 0.8 percentage points better than target1
but 0.5 percentage points worse than last year. Quarter 4 saw strong performance, despite a
background of challenging conditions including increased demand for road space and planned
disruption from highways improvements as part of our Road Modernisation Plan.
1.8 Quarter 4 saw a total of 1,055 hours of serious and severe disruption resulting from unplanned and
planned events, spread across 374 separate incidents. Planned disruption totalled 414 hours, with
unplanned totalling 641 hours. Planned disruption was up 80 hours compared to the same quarter
last year, largely due to the increased intensity of improvement schemes..
1.9 The amount of disruption per event, a measure of our effectiveness in resolving unplanned
incidents, averaged 2.0 hours in Quarter 4, 0.2 hours less than Quarter 4 last year.
1 JTR targets for 2015/16 were lower compared to last year due to the anticipated effects of our Road Modernisation Plan

6
1.10 For the full year Dial-a-Ride scheduled 1,454,053 trips, 89.9 per cent of trips requested.
Performance was particularly affected during Quarter 4 due to the effects of a driver shortage and
from reduced service levels due to vehicle reliability issues.
7
Safety and security
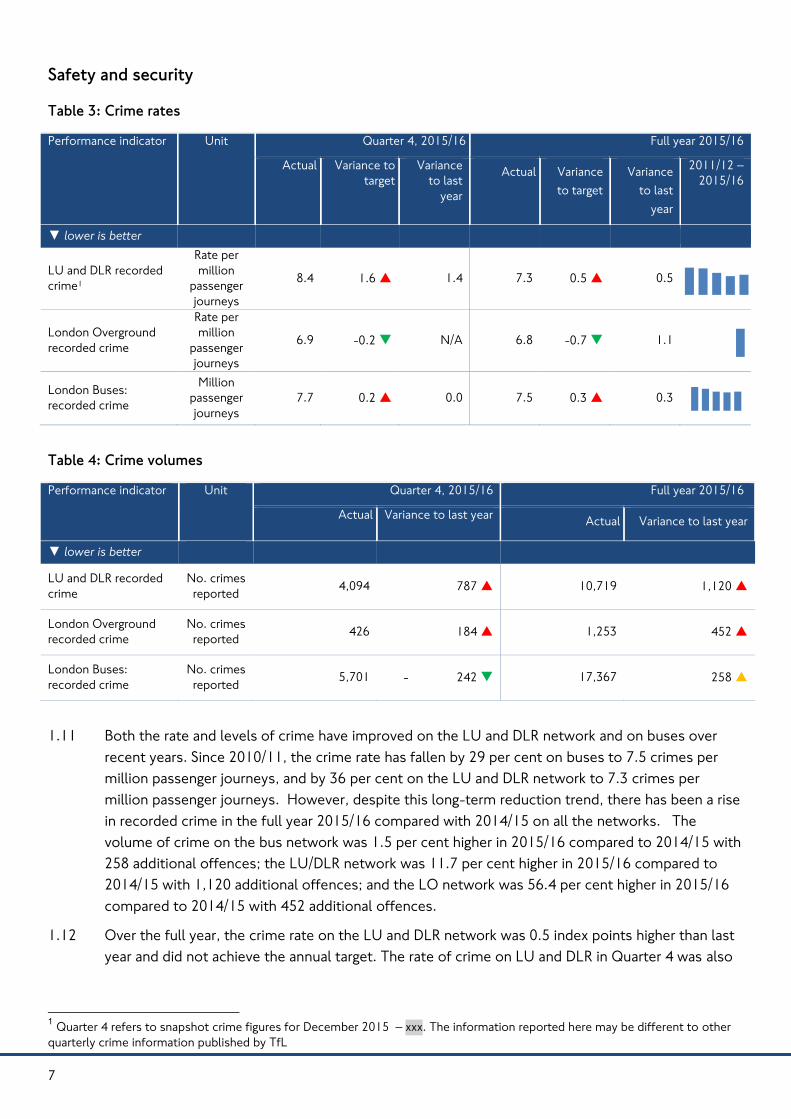
Table 3: Crime rates
Performance indicator Unit Quarter 4, 2015/16 Full year 2015/16
Actual Variance to
target
Variance
to last
year
Actual Variance
to target
Variance
to last
year
2011/12 –
2015/16
▼ lower is better
LU and DLR recorded
crime1
Rate per
million
passenger
journeys
8.4 1.6 1.4 7.3 0.5 0.5
London Overground
recorded crime
Rate per
million
passenger
journeys
6.9 -0.2 N/A 6.8 -0.7 1.1
London Buses:
recorded crime
Million
passenger
journeys
7.7 0.2 0.0 7.5 0.3 0.3
Table 4: Crime volumes
Performance indicator Unit Quarter 4, 2015/16 Full year 2015/16
Actual Variance to last year Actual Variance to last year
▼ lower is better
LU and DLR recorded
crime
No. crimes
reported 4,094 787 10,719 1,120
London Overground
recorded crime
No. crimes
reported 426 184 1,253 452
London Buses:
recorded crime
No. crimes
reported 5,701 - 242 17,367 258
1.11 Both the rate and levels of crime have improved on the LU and DLR network and on buses over
recent years. Since 2010/11, the crime rate has fallen by 29 per cent on buses to 7.5 crimes per
million passenger journeys, and by 36 per cent on the LU and DLR network to 7.3 crimes per
million passenger journeys. However, despite this long-term reduction trend, there has been a rise
in recorded crime in the full year 2015/16 compared with 2014/15 on all the networks. The
volume of crime on the bus network was 1.5 per cent higher in 2015/16 compared to 2014/15 with
258 additional offences; the LU/DLR network was 11.7 per cent higher in 2015/16 compared to
2014/15 with 1,120 additional offences; and the LO network was 56.4 per cent higher in 2015/16
compared to 2014/15 with 452 additional offences.
1.12 Over the full year, the crime rate on the LU and DLR network was 0.5 index points higher than last
year and did not achieve the annual target. The rate of crime on LU and DLR in Quarter 4 was also
1 Quarter 4 refers to snapshot crime figures for December 2015 – xxx. The information reported here may be different to other
quarterly crime information published by TfL
8
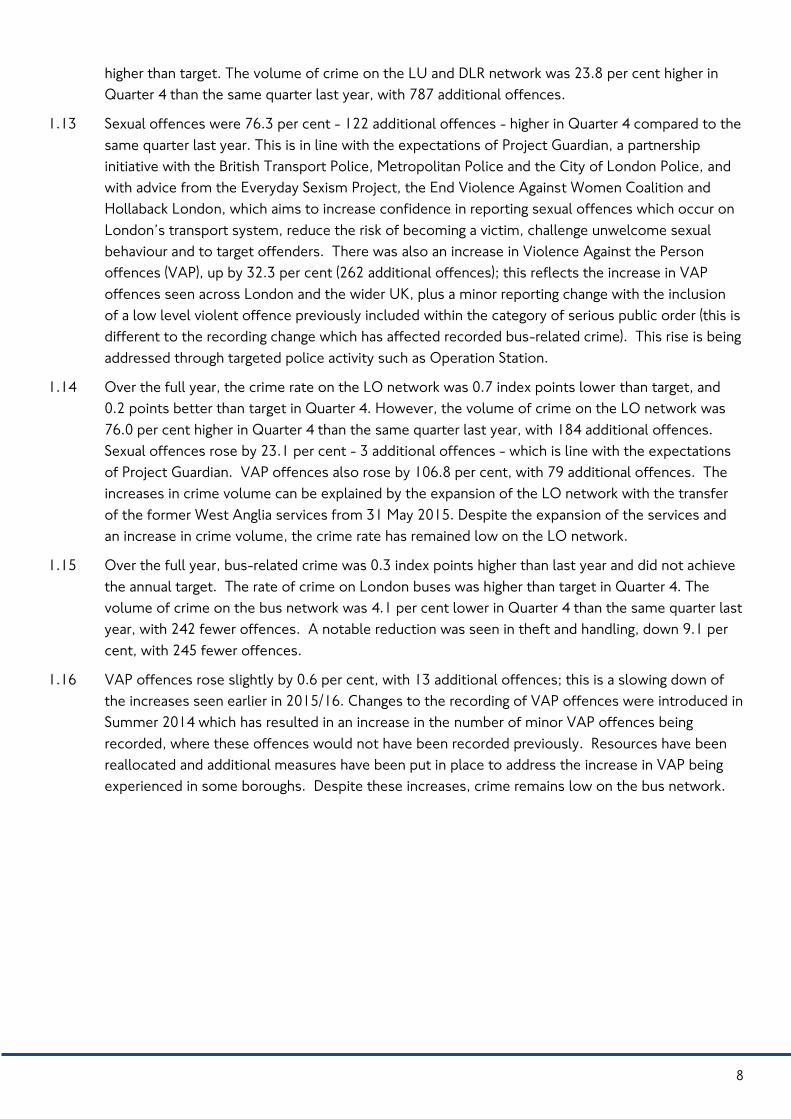
higher than target. The volume of crime on the LU and DLR network was 23.8 per cent higher in
Quarter 4 than the same quarter last year, with 787 additional offences.
1.13 Sexual offences were 76.3 per cent - 122 additional offences - higher in Quarter 4 compared to the
same quarter last year. This is in line with the expectations of Project Guardian, a partnership
initiative with the British Transport Police, Metropolitan Police and the City of London Police, and
with advice from the Everyday Sexism Project, the End Violence Against Women Coalition and
Hollaback London, which aims to increase confidence in reporting sexual offences which occur on
London’s transport system, reduce the risk of becoming a victim, challenge unwelcome sexual
behaviour and to target offenders. There was also an increase in Violence Against the Person
offences (VAP), up by 32.3 per cent (262 additional offences); this reflects the increase in VAP
offences seen across London and the wider UK, plus a minor reporting change with the inclusion
of a low level violent offence previously included within the category of serious public order (this is
different to the recording change which has affected recorded bus-related crime). This rise is being
addressed through targeted police activity such as Operation Station.
1.14 Over the full year, the crime rate on the LO network was 0.7 index points lower than target, and
0.2 points better than target in Quarter 4. However, the volume of crime on the LO network was
76.0 per cent higher in Quarter 4 than the same quarter last year, with 184 additional offences.
Sexual offences rose by 23.1 per cent - 3 additional offences - which is line with the expectations
of Project Guardian. VAP offences also rose by 106.8 per cent, with 79 additional offences. The
increases in crime volume can be explained by the expansion of the LO network with the transfer
of the former West Anglia services from 31 May 2015. Despite the expansion of the services and
an increase in crime volume, the crime rate has remained low on the LO network.
1.15 Over the full year, bus-related crime was 0.3 index points higher than last year and did not achieve
the annual target. The rate of crime on London buses was higher than target in Quarter 4. The
volume of crime on the bus network was 4.1 per cent lower in Quarter 4 than the same quarter last
year, with 242 fewer offences. A notable reduction was seen in theft and handling, down 9.1 per
cent, with 245 fewer offences.
1.16 VAP offences rose slightly by 0.6 per cent, with 13 additional offences; this is a slowing down of
the increases seen earlier in 2015/16. Changes to the recording of VAP offences were introduced in
Summer 2014 which has resulted in an increase in the number of minor VAP offences being
recorded, where these offences would not have been recorded previously. Resources have been
reallocated and additional measures have been put in place to address the increase in VAP being
experienced in some boroughs. Despite these increases, crime remains low on the bus network.

9
Table 5: Safety
Performance indicator Unit Quarter 4, 2015/16 Full year 2015/16
Actual Variance to
target
Variance
to last
year
Forecast Variance
to target
Variance
to last
year
2011/12 –
2015/16
▼ lower is better
London Underground
& Rail significant
injuries per million
hours
Rate 0.16 -0.24 -0.15 0.16 -0.24 -0.15 N/A
1.17 Rail & Underground significant injuries per million hours includes death (excluding suicide) and
RIDDOR (Reporting of Injuries, Diseases and Dangerous Occurrences Regulations) reportable
injuries to all customers, staff and contractors. It is aligned with the revised Office of Rail and Road
(ORR) standard. The trend of improvement in 2014/15 has continued throughout 2015/16, with a
significant injuries rate of 0.16 per million hours over the full year. Quarter 4 saw a 48 per cent
improvement from the same quarter last year.

10
Road safety
Table 6: Killed and seriously injured (KSI) reduction from 2005-2009 average
Performance indicator Unit Quarter 4, 2015/16 Full year 2015/16
Actual Variance to
target
Variance
to last
year
Forecast Variance
to target
Variance
to last
year
2011/12 –
2015/16
higher is better
Cumulative reduction
in KSI Londonwide 1 % 43.9 3.3 3.1 42.3 2.3 2.1
1.18 In Quarter 4 527 people were killed or seriously injured (KSI) on London’s roads. This is the lowest
level of KSIs on record for Quarter 4 and represents a 43.9 per cent reduction from the 2005-2009
baseline. The reduction in KSIs for quarter 4 is 3.1 percentage points better than the same quarter
last year.
1.19 Road safety has improved dramatically in London. We are well on track to reduce KSIs by 50 per
cent against the 2005-2009 baseline by 2020. Our annual Casualties in Greater London report
shows that KSIs fell by three per cent in 2015 to the lowest level on record; and by a reduction of
42 per cent from the baseline
1.20 During Quarter 4, we hosted a 20mph conference for all London boroughs, providing an update on
the 20mph trials on the TLRN and to share best practice examples of 20mph implementation, both
in London and other parts of the UK. Under the Pedestrian Town Centres project, a strategy and
action plan was developed to improve the environment and safety for pedestrians in Tooting and
Peckham. The programme aims to pilot innovative and creative solutions, and use the learning
from these in other town centres across London.
1.21 We also completed a trial of Intelligent Speed Assistance (ISA) on buses and are now reviewing the
evidence from the trial in order to identify the next steps in applying this technology.
1 Reduction from a baseline of the 2005-2009 average, July 2015 to September 2015

11
Value
The operating and capital accounts below show financial variances over the full year against Budget and our
latest full-year forecast, the latter completed in Quarter 3. The table highlights TfL’s operating contribution
to fund investment, after revenue grants, including DfT General Grant, Business Rates Retention and the
Greater London Authority (GLA) precept. The operating contribution is used to help fund investment and is
allocated to projects through the annual business planning process.
Table 7: TfL group finances – Operating account
TfL group
(£m)
Full year 2015/16
Actual Budget Variance to Budget Quarter 3
forecast
Actual variance to
Quarter 3 forecast
Fares income 4,550 4,640 (90) -2% 4,584 (34) -1%
Other operating income 675 641 34 5% 675 1 0%
Total income 5,225 5,281 (56) -1% 5,259 (34) -1%
Operating expenditure (net of
third-party contributions) (6,306) (6,634) 328 -5% (6,492) 186 -3%
Operating margin (1,081) (1,353) 272 -20% (1,234) 152 -13%
Interest income 1 25 23 2 10% 23 2 11%
Debt interest (372) (401) 30 -7% (378) 6 -2%
Contingency and group items 20 34 (15) -43% 37 (17) -46%
Margin (1,408) (1,697) 289 -17% (1,552) 144 -10%
Finance sources
General grant 591 640 (48) -8% 591 0 0%
Overground grant 37 29 8 26% 37 0 0%
GLA precept 6 6 0 0% 6 0 0%
Business Rates Retention 773 848 (75) -9% 773 0 0%
Other revenue grants 29 (0) 29 N/A 1 28 2,795%
Total revenue grants 1,436 1,522 (87) -6% 1,408 28 2%
Operating contribution to fund
investment 2 28 (175) 202 116% (144) 172 119%
1 Includes interest on the Crossrail Sponsors’ Fund Account 2 The operating contribution to fund investment is allocated to projects in our annual Business Plan. Any in-year variances to
these values are assessed as part of our planning process.

12
Table 8: TfL group finances – Capital account
TfL group
(£m)
Full year 2015/16
Actual Budget Variance to Budget Quarter 3
forecast
Actual variance to
Quarter 3 forecast
Capital expenditure (2,460) (2,569) 108 -4% (2,526) 65 3%
Third-party contributions –
capital 47 57 (10) -18% 65 (18) -28%
Sales of property and other
assets 407 385 22 6% 393 14 3%
Net capital expenditure excl.
Crossrail (2,006) (2,126) 120 -6% (2,068) 61 3%
Crossrail capital expenditure (1,508) (1,535) 27 -2% (1,613) 105 7%
Net capital expenditure incl.
Crossrail (3,514) (3,661) 146 -4% (3,681) 166 5%
Finance sources
Surplus/ -deficit to fund
investment 28 (175) 202 116% (144) 172
-
119%
Investment grant 925 925 0 0% 925 0 0%
Crossrail funding sources 959 893 66 7% 906 53 6%
Other capital grants 132 165 (33) -20% 141 (9) -6%
Working capital (491) (427) (65) 15% (339) (152) 45%
Borrowing 598 601 (3) 0% 598 1 0%
Cash movement 1,364 1,678 (315) -19% 1,594 (231) -14%
Total 3,514 3,661 (146) -4% 3,681 (166) -5%

13
Fares income
2.0 Total fares income is £4,550m over the full year, £90m lower than Budget and a variance of 1.9 per
cent. LU and London Overground have seen higher than expected levels of passenger journeys,
driven by a strong economy and population growth. However, bus fares income was £87m lower
than Budget, a result of lower passenger numbers. As in previous quarters, this is largely due to
reduced bus reliability, which has been affected by high levels of traffic flows and the construction
impacts from our Road Modernisation Plan.
2.1 In addition to lower bus fares income, fare income is down by a further £22m across the Group
due to the provision of payment for compensation to the Train Operating Companies (TOCs) for
lost revenue as a result of introduction of daily capping in January 2015.
Table 9: Fares income
Fares income
(£m)
Full year 2015/16
Actual Budget Variance to
Budget
Quarter 3
forecast
Actual variance to
Quarter 3
forecast
London Underground 2,552 2,556 (4) 2,561 (9)
London Rail (incl. TfL Rail) 473 472 1 489 (16)
London Buses 1,524 1,611 (87) 1,534 (10)
Total fares income 4,550 4,640 (90) 4,584 (34)
2.2 LU fares income was £4m lower than Budget over the full year:
£55m additional income largely due to increased passenger numbers coupled with a
favourable travelcard allocation; offset by
£17m compensation to TOCs for lost revenue as a result of introduction of daily capping in
January 2015 (see Section 2.1 above)
A further £17m reduction from lower than expected fare increases in January 2016, due to a
lower than previously assumed inflation rate (which in part determines the level of increase)
and a real terms fares freeze, whereas the Budget assumed fares would increase at the rate
of inflation plus one per cent
£16m lower income due to industrial action in July and August
£9m lower than expected income due to deferred introduction of Night Tube.
2.3 Against forecast for the year, LU fares income was £9m lower than forecast driven by the £17m
compensation to the Train Operating Companies (noted above) partly offset by a favourable
travelcard allocation from DLR.
2.4 London Rail and TfL Rail fares income was £1m higher than Budget for the year, mainly due to
passenger journey growth on London Overground and TfL Rail, partly offset by lower than
expected demand on DLR and Tramlink.
2.5 Against the Quarter 3 forecast, LR and TfL Rail fares income was down by £16m, with DLR income
down by £10m due to the combined impact of lower passenger volumes and the reallocation of
travelcard allocation to LU.
14
2.6 Bus fares income was £87m below Budget, a result of less fare paying passenger journeys than
anticipated; fare paying passenger volumes are 104.5 million under Budget. The primary cause of
this decline in demand is due to the deterioration in the reliability of the bus network, through
congestion caused by London’s population growth and the construction of major highway and
urban improvement schemes. Underlying passenger volumes are 3.6 per cent down on last year,
with fare paying passengers down by 4.3 per cent and non-fare paying passengers lower by 2.1 per
cent.
Other operating income
Table 10: Other operating income
Other operating income
(£m)
Full year 2015/16
Actual Budget Variance to
Budget
Quarter 3
forecast
Actual variance to
Quarter 3 forecast
London Underground 147 140 7 148 (1)
London Rail (incl. TfL Rail) 27 26 1 28 (2)
Congestion Charge, LEZ and
Road Network Compliance 294 300 (6) 300 (5)
Santander Cycles 16 16 0 16 0
Other Surface Transport 118 102 15 115 2
Shared services 74 57 16 67 6
Total other income 675 641 34 674 1
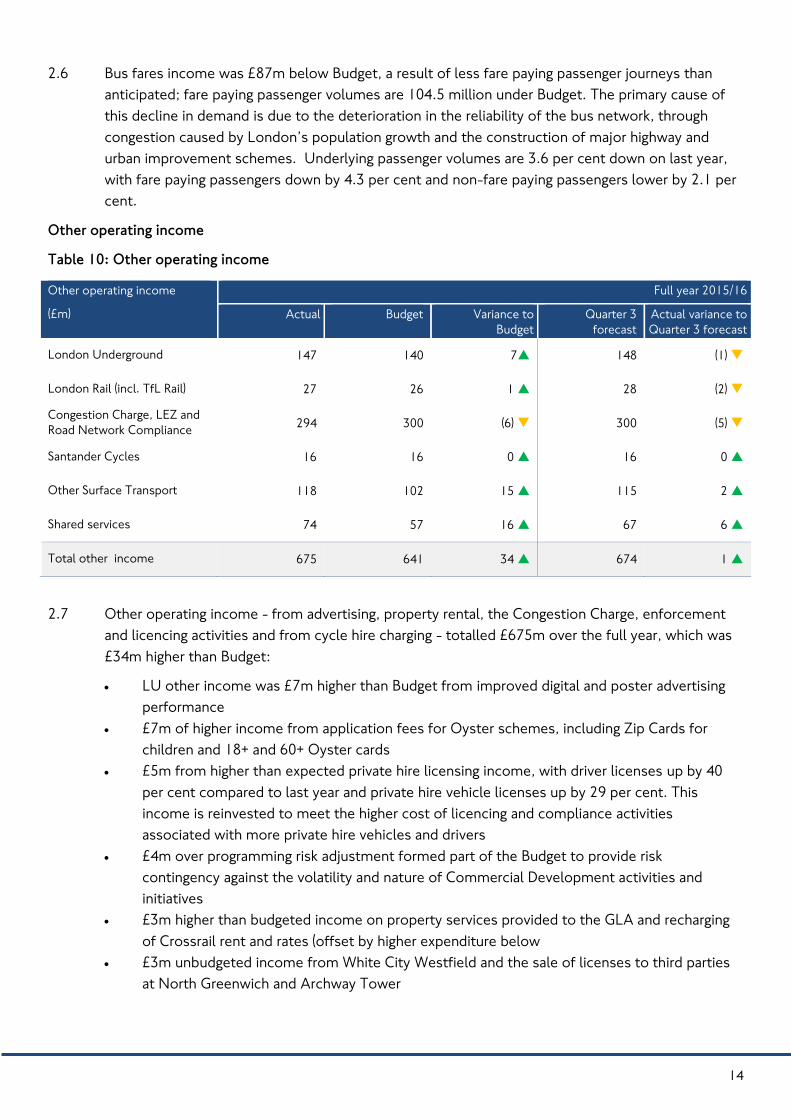
2.7 Other operating income - from advertising, property rental, the Congestion Charge, enforcement
and licencing activities and from cycle hire charging - totalled £675m over the full year, which was
£34m higher than Budget:
LU other income was £7m higher than Budget from improved digital and poster advertising
performance
£7m of higher income from application fees for Oyster schemes, including Zip Cards for
children and 18+ and 60+ Oyster cards
£5m from higher than expected private hire licensing income, with driver licenses up by 40
per cent compared to last year and private hire vehicle licenses up by 29 per cent. This
income is reinvested to meet the higher cost of licencing and compliance activities
associated with more private hire vehicles and drivers
£4m over programming risk adjustment formed part of the Budget to provide risk
contingency against the volatility and nature of Commercial Development activities and
initiatives
£3m higher than budgeted income on property services provided to the GLA and recharging
of Crossrail rent and rates (offset by higher expenditure below
£3m unbudgeted income from White City Westfield and the sale of licenses to third parties
at North Greenwich and Archway Tower

15
£1m up from the provision of replacement bus services to Network Rail, higher advertising
revenue on New Routemasters, increased shelter advertising revenues, and higher than
expected Lane Rental charges.
2.8 Congestion Charge income was down £5m against Budget, with Autopay detection volumes 15 per
cent lower than Budget and due to lower registrations volumes than expected (450,000
registrations against the Budget level of 490,000. Traffic Enforcement Notice Processing (TENP)
income is £9m lower, reflecting an increase in PCN reductions following the efforts to resolve
workflow queries in the backlog. Lower TENP income is partially offset by higher Congestion
Charge e Enforcement income of £8m, suggesting that some drivers are not opting to pay on
account, but risking the resulting PCN fines.

16
Operating expenditure
Table 11: Operating expenditure
Operating expenditure
(£m)
Full year 2015/16
Actual Budget Variance to Budget Quarter 3
forecast
Actual variance to
Quarter 3 forecast
London Underground (2,242) (2,348) 106 (2,306) 64
London Rail (incl. TfL Rail) (519) (557) 39 (544) 26
Surface Transport (2,856) (2,956) 89 (2,898) 31
Shared services (679) (772) 94 (744) 66
Total operating
expenditure (6,296) (6,634) 328 (6,492) 186
2.9 Total TfL operating expenditure is £6,296m in 2015/16, up £143m from our 2014/15 results - an
increase of 2.3 per cent. Against the 2015/16 Budget, expenditure is £328m lower, a variance of
5.1 per cent. The variance to Budget is driven by rephasing of project expenditure totalling £200m
(offset by a £53m overprogramming provision) and cost savings of £100m, and other items
including reclassification of expenditure from operating to capital expenditure.
2.10 LU operating expenditure is £106m under Budget over the full year, with operations, maintenance
and back office expenditure £54m lower than Budget and renewals and reliability improvements
£45m under Budget. The key variances include:
£76m of rephasing, including £51m of delays to the Central and Victoria line fleet Heavy
Overhaul Programme, £29m relating to Fit for the Future – Stations and Predict & Prevent
projects, and £6m from a deferral within the Integrated Stations Programme following a
scope review
£18m of operational cost decreases, including £9m from lower traction costs due a mix of
lower prices and volumes (the latter from delayed Night Tube introduction and industrial
action when a reduced service was operated) and a further £9m from operational rebates and
unutilised provisions
£9m reduction relating to accounting reclassification for statutory accounts purposes
Project rephasing was offset by the release of a £26m overprogramming provision
These underspends were partly offset by increased costs, including £9m on train fleet
maintenance and £8m additional contractual incentive fees.
2.11 Against forecast, LU operating expenditure is £64m lower than forecast, £45m lower on operations
and £15m lower on renewals and reliability projects. Major movements included:
£12m deferred operating expenditure comprising various fleet works including Central, Victoria
and Bakerloo line overhaul costs
£34m rephased expenditure relating to a number of rescheduled programmes including Jubilee
and Northern line upgrades, Lifts & Escalators and Legacy Train Systems life extension works
£16m operating cost decrease including lower traction current costs, operational contract
rebates and unutilised provisions.
17
2.12 LR and TfL Rail operating expenditure is £39m lower than Budget for the full year. Key variances
included:
£15m cost decreases largely due to lower performance payments to LO rail operating
company plus prior year profit share payment
£14m reduction due to operating expenditure reclassified as capital
£6m rephased costs including delayed LO rebrand activity and DLR electronic control unit
overhauls
Partly offsetting these were cost increases of £8m including project management and legal
costs relating to West Anglia devolution, and additional TfL Rail costs.
2.13 Against forecast for the year, LR/TfL Rail operating expenditure was £26m under. The reduction
includes LO rephasing including delayed station works and West Anglia maintenance and signalling
spend, plus other smaller variances across the area.
2.14 Surface Transport operating expenditure was £100m lower than Budget over the full year, due to
£75m net cost reductions, £42m of project rescheduling (partly offset by a £27m overprogramming
provision) and a £10m reclassification of risk expenditure from revenue to capital. Cost reductions
totalled £107m and included:
£56m from lower bus contract costs, due to worse than expected bus contractor
performance, lower than budgeted diesel prices and less ticket commission costs as a result
of lower fare income
£14m cost reductions across a number of areas, including lower than expected policing costs
due to difficulties in Metropolitan Police Service (MPS) recruitment, lower iBus costs and
savings in passenger survey expenditure
£12m from Local Implementation Plans (LIPS) projects due to slow delivery of major
schemes
£12m cost reductions in Asset Management largely due to savings identified following the
restructure of Traffic Infrastructure revenue maintenance activities, reduced A13 DBFO
payments and a London Highway Alliance Contract (LoHAC) annual volume rebate
A further £9m of savings across a range of initiatives following a detailed prioritisation
exercise
The main cost increases were:
£10m in the Asset Management Directorate related to LoHAC contractual entitlements for
design for maintenance, local overheads and statutory utility drawings.
£7m extra costs on buses to improve reliability and a further £2m higher fuel costs for New
Routemasters with the actual miles per gallon achieved less efficient than that assumed in the
Budget.
2.15 Project rescheduling to future years totalled £42m, partly offset by £27m of overprogramming. The
key slippages included:
£13m slippages in Strategy and Planning, including Strategy & Outcome Planning (Cycle Super
Hubs, Monitoring & Research and Crossrail Complementary Measures)
£13m related to slow progress on Mini Hollands, in particular delays in getting construction
for Mini Hollands Kingston started owing to difficulties appointing a contractor. There were
also delays due to slow progress on Transforming Streets and Places projects and delays in

18
Better Junctions programme due to difficulties in agreeing a design for the northern
roundabout with Westminster.
2.16 Shared services (including HR, IM, Finance, Marketing and Communications and Planning)
expenditure was £679m over the full year, £94m lower than Budget. The key reasons for this
underspend are:
£41m lower than budgeted expenditure for property and advertising investments (incorrectly
budgeted as operating expenditure) that have been re-profiled and moved to capital in
current forecasts
£38m accounting adjustment for rent and rates transferred from Finance to business areas at
the end of the financial year
£10m lower expenditure on the Earls Court project reflecting re-sequencing of demolition
and construction costs offset by additional land acquisitions and an incorrect split between
opex and capex in the budget. The delays to budgeted investment do not impact on the
critical path for the development
£7m lower merchant fees for card payments following the imposition of a cap on fees by the
European Union.
2.17 Full-year shared services expenditure is £66m lower than forecast, they key variances being:
A £38m accounting adjustment for rent and rates transferred from Finance to business areas
at the end of the year
£9m savings made across property portfolio, including buildings and maintenance, catering,
dilapidations, rates and utilities
£5m of savings for various projects including Future Ticketing project, transformation
projects throughout corporate and various IM projects
£3m lower merchant fees for card payments following the imposition of a cap on fees by the
European Union
£3m rephased costs due to delay of Night Tube and Gatwick Oyster extension
£3m savings from Revenue Collection Contract due to contractor not meeting SLAs and
lower than expected transition costs;
£2m Oyster card savings from lower procurement volumes and reduced photocard costs.

19
Interest income, debt service and other group items
Table 12: Interest income, debt service and other group items
Interest income, debt service
and other group items (£m) Full year 2015/16
Actual Budget Variance to
Budget
Quarter 3
forecast
Actuals variance
to Quarter 3
forecast
Interest income 25 23 2 23 2
Debt service (372) (401) 30 (378) 6
Contingency and other group
items 20 34 (15) 37 (17)
Total interest, debt service and
other group items (327) (344) 17 (318) (8)
2.18 In Quarter 1 we completed most of the planned borrowing for the full year. A combination of low
market rates and a successful execution of £400m Green Bond and £120m private placement
transactions allowed TfL to achieve an overall favourable rate of interest, significantly lower than
expected when completing the Budget. This has resulted in a £30m saving in debt service over the
full year.
2.19 In the full year contingency and other group items are £15m higher than Budget.

20
Capital expenditure
Table 13: Capital expenditure
Gross Capital expenditure
(£m)
Full year 2015/16
Actual Budget Variance to
Budget
Quarter 3
forecast
Actuals variance
to Quarter 3
forecast
London Underground (1,199) (1,217) 19 (1,162) (37)
London Rail (incl. TfL Rail) (233) (301) 68 (284) 51
Surface Transport (501) (500) (1) (501) 0
Shared services (527) (548) 21 (577) 50
Gross capital expenditure (2,460) (2,569) 108 (2,526) 65
2.20 Over the full year, our capital expenditure totalled £2,476m, £497m more than in 2014/15. The
single main reason for this increase is the purchase of £376m of loan notes for the Earls Court joint
venture project. Expenditure is £108m lower than Budget, due to £548m of project rephasing to
future years (which is offset by a £337m overprogramming provision), and a net increase in costs of
£60m, the latter largely from the Metropolitan Line Extension. This project will be funded by the
DfT and from a Local Enterprise Partnership.
2.21 LU capital expenditure is £19m lower than Budget over the year, due to £351m of project
rephasing (partly reduced by an overprogramming provision of £198m) which is partly offset by cost
increases of £117m. Rephasing includes:
£113m on Four Lines Modernisation driven by the Automatic Train Control (ATC)
programme, reflecting alignment to the new signalling contractor’s schedule - which was
awarded after the budget was finalised
£83m due to major design changes on Northern Line Extension impacting delivery schedule
£47m relating to infrastructure renewals, including Sub-Surface Line (SSL) power upgrade,
lifts, escalators, plant strategy and legacy train renewals
£33m rephased Metropolitan Line Extension due to delays following the programme
transition
A net £16m on stations due to underspend of £31m - including Vauxhall, Asset
Development and Stations Work Improvement Programme - offset by £15m of accelerated
spend on property compensation and acquisition costs on Bank station where the Transport
& Works Act Order was secured earlier than anticipated
£13m within World Class Capacity including minor delays to the Victoria line upgrade
£25m for rephasing across a number of projects including Fit for the Future Stations, Predict
& Prevent, and Information Communications Technology Transformation
Project rephasing was partly offset by the release of a £198m overprogramming provision.
In addition, there were cost increases of £117m including:
£64m from the Metropolitan Line Extension programme, due to the agreement made with
the Department for Transport to take on the responsibility for delivering the programme –
this expenditure is expected to be funded from the DfT and a Local Enterprise Partnership

21
£38m for the Northern line upgrade following a re-estimate of the project scope to deliver
the required benefits.
2.22 Against forecast, LU capital expenditure for the year was £37m higher than forecast. Expenditure
totalling £101m has been rephased into future years, including:
£35m of rephasing on the Four Lines Modernisation
£26m on Station Upgrades and the Northern Line Extension
Project rephasing was more than offset by the release of a £115m overprogramming
provision.
In addition there was a £28m increase in Station Capacity expenditure mainly due to Bank Station
accelerated spend on property compensation and compulsory purchases and Victoria Station fit-
out works with fewer delays than anticipated.
2.23 LR/TfL Rail capital expenditure was £68m lower than budget for the year. This was largely due to
reductions:
£35m rephased expenditure in TfL Rail mainly due to rolling stock milestone re-profiled
£35m delayed spend across LO including delayed station works, lower spend on renewals
and enhancements, reprofiled Gospel to Barking electrification project and delay in awarding
West Anglia station works contract
£19m DLR rephasing of rebranding costs, Your Railway and Customer Experience project
slippage including Blackwall stairs, ROV canopies, Limehouse escalator and East India Urban
Realm, plus other smaller variances across the area
Project rephasing was partly offset by the release an overprogramming provision of £8m.
The delayed expenditure was partly offset by a £14m increase from a reclassification of operating
expenditure to capital.
2.24 Against forecast for the year, LR/TfL Rail capital expenditure was £51m lower. Key variances
include £34m in TfL Rail due to delayed milestone achievement on the rolling stock contract and
£11m in LO largely due to rephased West Anglia station works following extended tender period.
2.25 Surface Transport capital expenditure was £1m higher than Budget over the year, a result of £92m
expenditure rescheduled to future years, £18m of Management Contingency which has not been
needed, £36m of cost reductions and reduced scope. This was more than offset by £131m of
overprogramming as we anticipated – and made a provision for – more project slippage than
actually materialised during the year.
2.26 The key items that have been rescheduled include:
£15m on the Structures and Tunnels Improvement Programme 1 (STIP1) due to Network Rail
possession and design approval issues across all bridges, as well as delays due to cracks in
beams at Highbury Corner Bridge
£21m on cycle Quietways due to issues across several boroughs, including Lewisham ,
which required re-design, and on Millwall link which required negotiation with Network Rail
for access
£13m London Cycling Grid due to borough resource constraints
£8m on the Better Junctions programme which has been reschedule to future years,
including Westminster Bridge South delayed following consultation with stakeholders and a
new design to incorporate consultees
£7m of slippage on Future Bus Systems

22
£6m delays in New Routemaster delivery
£4m rephasing across the Cycle Superhighways Programme, including CS11 which has been
put on hold due to the estimated negative impacts on traffic flow on Hendon Way and
Finchley Road
£4m on the Cycle Hire Relet, from delays in confirming transition of the Cycle Hire system
and the revenue collection solution.
2.27 The main works ahead of schedule were £15m of expenditure was accelerated into 2015/16 from
later years, including additional carriageway renewals which will deliver value for money, and
lighting expenditure which will maximise energy efficiency and financial savings. These variances
were offset by overprogramming of £131m.
2.28 In addition, we made £31m of cost savings in Surface Transport, including £14m savings from the
release of project risk, £9m from the Hammersmith Flyover, £2m from Fore Street Tunnel, a
further £7m from AMD Asset Capital Programme.
2.29 Shared services capital expenditure is £533m, £376m of which was for the purchase of Earls Court
joint venture loan notes. Over the full year, expenditure is £17m under Budget, largely a result of
project rephasing including End User Computing, Stratford Hib and the Future Ticketing project. In
addition, £6m of project contingency is no longer required. This rephasing and cost reduction has
been partly offset by £4m for the purchase of hardware for the Data Consolidation project,
supporting Oyster and Contactless ticketing systems.
2.30 Capital expenditure in shared services is £45m lower than the latest forecast. This is due to £17m
of project reprofiling above (Section 2.29), £21m rephasing of commercial development, as well as
£5m of project contingency is no longer required.

23
Capital third-party contributions
Table 14: Capital third-party contributions
Third-party contributions
(£m)
Full year 2015/16
Actual Budget Variance to
Budget
Quarter 3
forecast
Actuals variance
to Quarter 3
forecast
London Underground 31 32 (2) 45 (14)
London Rail (incl. TfL Rail) 3 7 (4) 3 0
Surface Transport 13 17 (3) 16 (3)
Shared services (0) 1 (2) 0 (1)
Capital third-party
contributions 47 57 (10) 65 (18)
2.31 LU third-party contributions were £2m lower than budget for the year, with delays in Crossrail
funded stations project offsetting unbudgeted Metropolitan Line Extension contributions. For the
full year against forecast, LU third-party contributions were £14m lower, mainly driven by phasing
of the third-party funded element of the Cross stations project.
2.32 LR/TfL Rail third-party contributions were £4m lower than Budget in the year, mainly due to
phasing of LO and DLR projects and, therefore, corresponding funding..
2.33 Surface Transport third-party contributions are £3m lower than Budget over the full year due to the
transfer of Community Infrastructure Levy (CIL) funding - for Elephant & Castle and Wandsworth
Gyratory – to grant income, the latter included in other capital grants (see Section 2.40). This was
partly offset by the drawdown of deferred income for footways capital renewals.
Sales of property and other assets
Table 15: Sales of property and other assets
Sales of property and other
assets
(£m)
Full year 2015/16
Actual Budget Variance to
Budget
Quarter 3
forecast
Actuals variance
to Quarter 3
forecast
Total sales of property and
other assets 407 385 22 393 14
2.34 In the year to date property sales expenditure is £407m, predominantly from the sale of £376m of
land for the Earls Court joint venture in exchange for loan notes.
24
Crossrail
Table 16: Crossrail
Crossrail
(£m)
Full year 2015/16
Actual Budget Variance to
Budget
Quarter 3
forecast
Actuals variance
to Quarter 3
forecast
Crossrail (1,508) (1,535) 27 (1,613) 105
2.35 Crossrail project expenditure is £27m under Budget over the full year.
2.36 Direct costs (including risk) were £44m below Budget for the full year, due to:
Programme risk –underspend of £120m due to budget being held centrally, but related spend
occurring at a Sector level
Systemwide - underspend of £85m primarily due to less than budgeted procurement,
signalling design work and lower than expected production
Operations – underspend of £12m driven by works at Old Oak Common being budgeted for
but no longer being required
Surface works – underspend of £8m due to a revised funding agreement for Network Rail
Traction Power; offset by
Stations – overspend of £93m primarily due to contractor performance and delays at
Whitechapel, and overspends on design and labour costs to support the Systemwide
Programme
Civils – overspends of £82m driven by the late finish of Tunnels West; Portals and Shafts to
enable early access to Systemwide and an overspend on Ilford Yard due to poor contractor
performance and rephrasing of cost since the budget was set
Other – net overspend of £6m.
2.37 Indirect project costs were £4m above Budget for the full year, predominantly due to:
A payment to Network Rail to extend the interim funding agreement (£9m)
A provision for Rights of Light settlements (£4m); offset by
A reduction in legal fees and insurance costs to re-align with forecast project costs (£5m)
Lower than expected staff costs due to vacancies (£2m)
Other net underspends (£2m).
2.38 Land and Property costs were £12m above Budget for the full year. This is predominantly due to:
New commitment at Plumstead (£7m)
Upward revaluations across a number of sites including Farringdon (£4m), Ealing Broadway
(£3m), Limmo Peninsula (£2m) and Paddington (£2m)
A number of downward revaluations but most notably Tottenham Court Road (£2m),
Westbourne Grove (£2m) and Hayes and Harlington (£3m).
2.39 Against the latest forecast, Crossrail expenditure is £105m lower, predominantly driven by direct
project cost underspends. Material drivers include:
Civils – an underspend of £43m driven by Eastern Running Tunnels’ better than expected
productivity on Tunnel Boring Machine (TBM) dismantling, cost reduction initiatives,
agreement of disallowed costs and an underspend on risk.
25
Systemwide - underspend of £36m primarily due to low productivity on the main works;
schedule changes on the communications and controls contract; lower than budgeted
procurement and slippages for the Limmo Bulk Supply Point, and later than planned access
for the High Voltage Power contractor; as well as rephasing of risk in relation to the
Systemwide contracts; and
Programme risk –underspend of £25m due to budget being held centrally, but related spend
occurring at a Sector level.
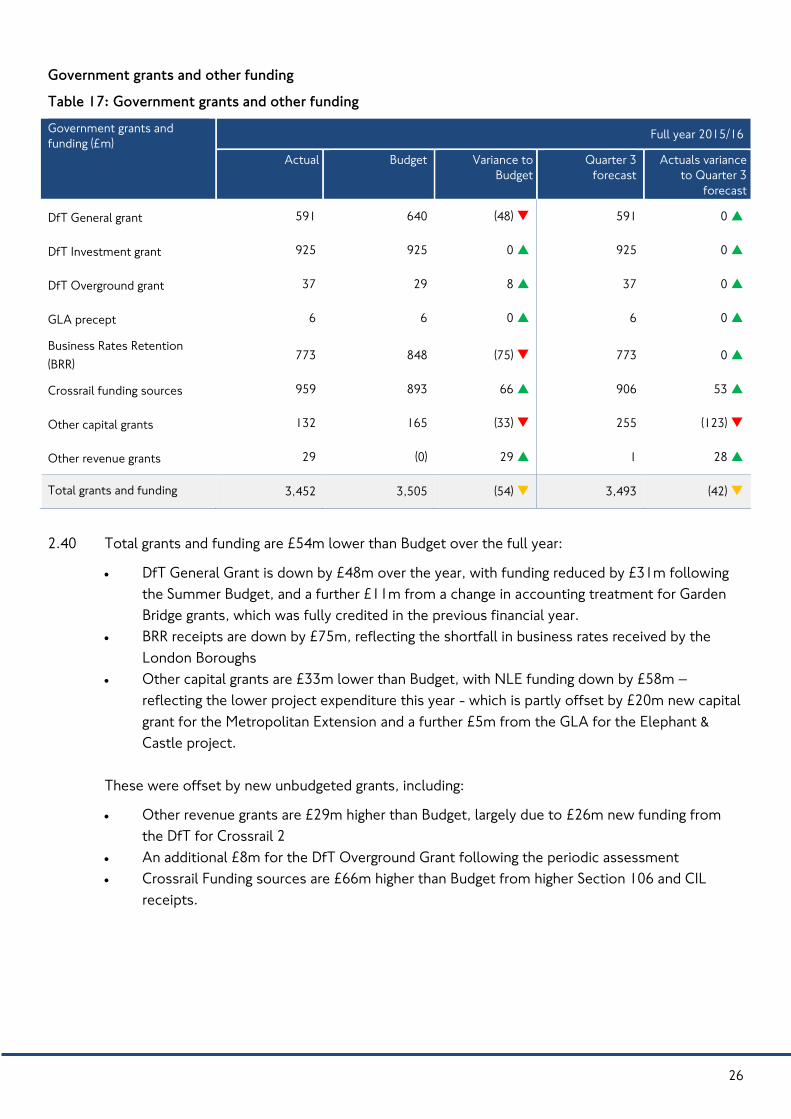
26
Government grants and other funding
Table 17: Government grants and other funding
Government grants and
funding (£m) Full year 2015/16
Actual Budget Variance to
Budget
Quarter 3
forecast
Actuals variance
to Quarter 3
forecast
DfT General grant 591 640 (48) 591 0
DfT Investment grant 925 925 0 925 0
DfT Overground grant 37 29 8 37 0
GLA precept 6 6 0 6 0
Business Rates Retention
(BRR) 773 848 (75) 773 0
Crossrail funding sources 959 893 66 906 53
Other capital grants 132 165 (33) 255 (123)
Other revenue grants 29 (0) 29 1 28
Total grants and funding 3,452 3,505 (54) 3,493 (42)
2.40 Total grants and funding are £54m lower than Budget over the full year:
DfT General Grant is down by £48m over the year, with funding reduced by £31m following
the Summer Budget, and a further £11m from a change in accounting treatment for Garden
Bridge grants, which was fully credited in the previous financial year.
BRR receipts are down by £75m, reflecting the shortfall in business rates received by the
London Boroughs
Other capital grants are £33m lower than Budget, with NLE funding down by £58m –
reflecting the lower project expenditure this year - which is partly offset by £20m new capital
grant for the Metropolitan Extension and a further £5m from the GLA for the Elephant &
Castle project.
These were offset by new unbudgeted grants, including:
Other revenue grants are £29m higher than Budget, largely due to £26m new funding from
the DfT for Crossrail 2
An additional £8m for the DfT Overground Grant following the periodic assessment
Crossrail Funding sources are £66m higher than Budget from higher Section 106 and CIL
receipts.

27
Working capital
Table 18: Working capital
Working capital
(£m)
Full year 2015/16
Actual Budget Variance to
Budget
Quarter 3 forecast Actuals variance
to Quarter 3
forecast
Working capital (491) (427) (65) (339) (152)
2.41 Working capital is £65m adverse at the end of 2015/16. This is due to lower project expenditure
across the Group, with £79m relating to reduced creditors.
Borrowing and reserve movements
Table 19: Net borrowing and reserve movements
Borrowing, repayments and
cash reserve movements
(£m)
Full year 2015/16
Actual Budget Variance to
Budget
Quarter 3
forecast
Actuals variance to
Quarter 3 forecast
Borrowings Raised 624 626 (3) 623 1
Borrowings Repaid (25) (25) 0 (25) 0
Net borrowing 598 601 (3) 598 1
2.42 Over the full year we borrowed £624m to help fund our investment programme, £3m less than
expected at the time of the Budget.

28
Cash movements and balances
Table 20: Cash movements
Borrowing, repayments and
cash reserve movements
(£m)
Full year 2015/16
Actual Budget Variance to
Budget
Quarter 3
forecast
Actuals variance to
Quarter 3 forecast
Reserve movements 1,364 1,678 315 1,594 222
2.43 In 2015/16 we used £1,364m of our cash reserves to help fund our extensive improvements across
the transport network. Against Budget, our cash reserves are now £315m higher than expected.
Table 21: Cash balances
Cash summary
(£m)
Full year 2015/16
Actual Budget Variance to
Budget
Quarter 3
forecast
Actuals variance
to Quarter 3
forecast
Crossrail Sponsors’ Funding
Account 1,539 1,574 (35) 1,445 93
Other TfL cash balances 1,776 1,426 350 1,647 128
Closing cash 3,314 3,000 315 3,093 222
2.44 Our total cash balances stand at £3,314m at the end of the financial year, with £1,539m ring
fenced to deliver the Crossrail project.
2.45 Our cash balances are allocated to investment and cannot be used for any other purpose. We
expect to continue to use our balances to fund further improvements across the network. We also
hold a prudential minimum level of cash - approximately £500m - which is held for exceptional
circumstances and so that we retain a high credit rating with our investors. Following continued
investment we expect our cash balances – after taking into account the prudential minimum - to
reduce to zero by the end of 2017/18.
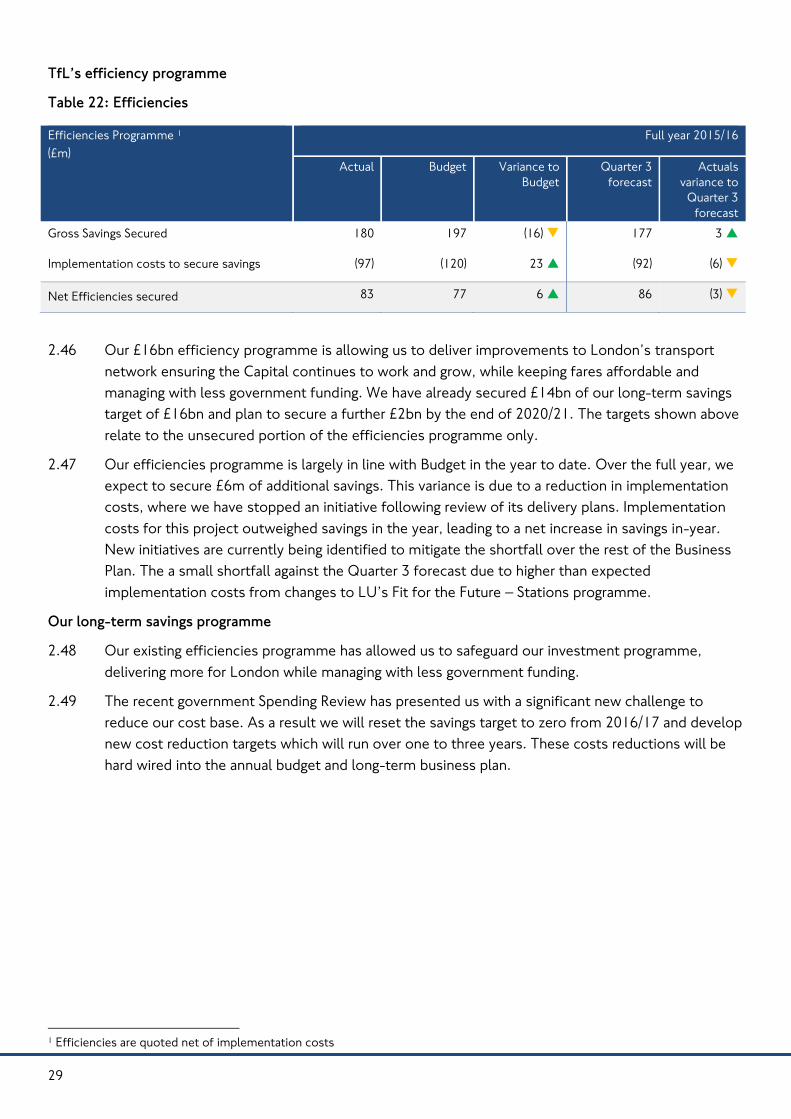
29
TfL’s efficiency programme
Table 22: Efficiencies
Efficiencies Programme 1
(£m)
Full year 2015/16
Actual Budget Variance to
Budget
Quarter 3
forecast
Actuals
variance to
Quarter 3
forecast
Gross Savings Secured 180 197 (16) 177 3
Implementation costs to secure savings (97) (120) 23 (92) (6)
Net Efficiencies secured 83 77 6 86 (3)
2.46 Our £16bn efficiency programme is allowing us to deliver improvements to London’s transport
network ensuring the Capital continues to work and grow, while keeping fares affordable and
managing with less government funding. We have already secured £14bn of our long-term savings
target of £16bn and plan to secure a further £2bn by the end of 2020/21. The targets shown above
relate to the unsecured portion of the efficiencies programme only.
2.47 Our efficiencies programme is largely in line with Budget in the year to date. Over the full year, we
expect to secure £6m of additional savings. This variance is due to a reduction in implementation
costs, where we have stopped an initiative following review of its delivery plans. Implementation
costs for this project outweighed savings in the year, leading to a net increase in savings in-year.
New initiatives are currently being identified to mitigate the shortfall over the rest of the Business
Plan. The a small shortfall against the Quarter 3 forecast due to higher than expected
implementation costs from changes to LU’s Fit for the Future – Stations programme.
Our long-term savings programme
2.48 Our existing efficiencies programme has allowed us to safeguard our investment programme,
delivering more for London while managing with less government funding.
2.49 The recent government Spending Review has presented us with a significant new challenge to
reduce our cost base. As a result we will reset the savings target to zero from 2016/17 and develop
new cost reduction targets which will run over one to three years. These costs reductions will be
hard wired into the annual budget and long-term business plan.
1 Efficiencies are quoted net of implementation costs

30
Customer
Passenger journeys
Table 23: Passenger journeys
Millions Quarter 4, 2015/16 Full year 2015/16
Actual Variance to
target
Variance to
last year
Actual Variance to
target
Variance to
last year
2011/12 –
2015/16
higher is better
London Underground 395.9 4.0 -13.3 1,349.3 5.6 43.9
London Buses 662 -53 -57 2,323 -122 -62
DLR 34.3 -0.9 -0.3 117.0 -2.3 6.8
London Overground 54.3 3.6 10.5 184.4 15.9 44.6
London Tramlink 8.1 -1.8 -1.4 27.0 -4.1 -3.7
Emirates Air Line 0.3 -0.1 0.0 1.5 -0.2 0.0
TfL Rail 13.0 1.7 N/A 40.1 8.3 N/A N/A
London River Services 2.17 0.1 0.1 10.3 0.1 0.3
3.0 LU experienced a record breaking number of journeys in 2015/16, with a year-on-year increase of
3.4 per cent. Demand was especially high in Quarter 3, which saw a record breaking number of
journeys on the Tube with both the four busiest weeks and five busiest days on record. Daily
passenger journeys topped 4.8 million twice, and weekly demand exceeded 29 million journeys for
the first time.
3.1 Bus passenger journeys totalled 2,323 million over the full year, 62 million or 2.6 per cent lower
than last year, and 122 million or 5 per cent below Budget. Journeys in Quarter 4 were particularly
low, with 57 million fewer journeys than the same quarter last year, a decline of 8 per cent.
3.2 The primary cause of this decline in demand is due to the slight deterioration in the reliability of
the bus network, due to increased traffic levels driven by London’s strong economic growth
(including extensive building and construction projects across London), a rapidly rising population,
our Road Modernisation Plan and by town centre improvements.
3.3 Passenger journeys on the DLR in 2015/16 totalled 117 million, an increase of 6.1 per cent – 6.8
million journeys - on the previous year. Passenger numbers were two per cent lower than target,
largely due to the industrial action in Period 8.
3.4 London Trams passenger journeys were 27 million in 2015/16, which was 4.1 million lower than
target and 3.7 million lower than last year. Planned closures in Periods 7 and 8 coupled with
declining number of visitors to Croydon shopping centres affected demand in the year.

31
3.5 LO carried 184.4 million people in 2015/16, an increase of 44.6 million on the previous year. Over
66 per cent of this increase was from the new services operated on the West Anglia route, which
began in May 2015.
Cycling
3.0 More than 645,000 journeys are made by bike every day in London, and cycling in London has
more than doubled in the last decade. Levels of cycling in central London reached a daily average
of 453,065 kilometres, or an estimated 148,000 journeys. This represents a 6.5 percent increase in
cycling compared to the same quarter in 2014. Over the full year, cycling levels in central London
increased by 3.1 per cent.
Table 24: Cycling journeys on the Transport for London Road Network (TLRN)
Unit Quarter 4, 2015/16 Full year 2015/16
Actual Variance
to target
Variance
to last
year
Actual Variance
to target
Variance
to last
year
2011/12 –
2015/16
higher is better
Central London
Cycling CC Zone – per
cent growth
per cent 6.5 3.5 7 3.1 -0.9 3.1 N/A
Cycling levels on the
TLRN 1 Index 235 -53 -28 323 -25 -7
Cycle Hire 000s 2,176 -51 -106 9,886 -414 -198
3.1 The TLRN cycling index has been in place for over 15 years and uses 38 automatic counters to
measure cycling on London’s main roads. This provides a long-term and detailed view of changes
in cycling levels on London’s main roads, which have more than tripled since the index began.
Over time, however, some counters have stopped working and, due the historic location of
counters, the index does not correctly capture cycling on new infrastructure such as cycle
superhighways. This means that the index is no longer a true representation of cycling on
London’s main roads. As part of TfL’s London cycle monitoring plan, enhanced cycling measures
have been developed that correctly represent cycling on London’s roads to report during the new
financial year.
3.2 The TLRN cycling index reports that levels of cycling on London’s main roads during quarter 4 of
2015/16 were 10.6 percent (28 index points) lower than the same period last year. The latest full-
year index of cycle flows on the TLRN for 2015/16 is 323, which is 2.1 percent lower than last year
and below the full-year target of a 5.6 per cent increase in cycling between 2014/15 and 2015/16.
3.3 The full-year target for cycling growth during 2015/16 is based on past growth in cycling levels on
the TLRN, which has increased by an average of 9.1 per cent each year since the index began. This
level of growth was not recorded by the TLRN cycling index this year, and further analysis is
underway to understand whether this change is due to long term changes in patterns of cycling

32
growth; short term responses to road disruption; weather; or failures of the monitoring equipment
to provide accurate readings.

33
Table 25: Cycling: expenditure, 2012/13 to 2021/22
Cycling expenditure £m Full year 2015/16
Actual Budget Variance to
Budget
Quarter 3
forecast
Actuals variance
to Quarter 3
forecast
Cycling expenditure (158) (145) (13) (145) (13)
3.4 2015/16 has seen a record £158m invested in cycling. The Budget for the year was £145m, with
£13m of schemes delivered ahead of the business plan profile, reflecting good progress made on
the implementation of Cycle Superhighways.
3.5 We are now four years into the ten year £913m Cycling Vision, with £315m invested so far. By the
end of 2016/17, at the halfway mark, the total spend is likewise budgeted to hit fifty percent of the
ten year total.
3.6 In Quarter 4 we made further progress in delivering improvements to London’s cycling
infrastructure:
Construction progressed well on the four upgraded Cycle Superhighway routes plus four new
routes. These were all open by May 2016
• The core Better Junctions programme saw progress at a number of locations. At Oval
Triangle all cycle facilities are now fully operational. By the end of the Quarter, about 50 per
cent of the main construction works were complete at Stockwell Cross, as were all the
planned utility works. And at Archway Gyratory the main construction works started as
planned on 29 February 2016.
• All three Mini-Holland boroughs have begun construction. A pedestrian/cycle bridge and a
cycle hub were completed in Waltham Forest. Designs for half of the total 101 schemes that
make up the mini-Hollands programme have been submitted by boroughs and a fifth of them
have started consultation.
• On the Central London grid, 80 per cent of the total 134 schemes have been approved for
construction, and a third are either complete or now under construction. Good progress has
been made on the Quietways programme with five of the first phase of eight routes under
construction.
Alongside infrastructure delivery we are supporting behaviour change measures, including
cycle training for adults and children and engaging businesses through Cycling Workplaces.

34
Customer satisfaction
3.7 Customer satisfaction has increased or been maintained, across all of our services.
3.8 LU’s Customer Satisfaction Survey (CSS) overall score was a record 85 over the full year and for
each quarter, also the highest quarterly scores ever achieved. In Quarter 4, customer satisfaction
with the temperature inside the train, in line with seasonal trends, and with the length of time
waiting for a train. After dipping in Quarter 3, the Central line customer satisfaction returned to its
previous peak of 85, with customers reporting fewer delays and better scores for journey comfort
and train crowding.
3.9 Bus customer satisfaction also continued to improve, also reaching 86 over the full year and in
Quarter 4. Customers were particularly satisfied with the level of crowding and seat availability in
the Quarter. They were also more positive about the ease of journey, boarding and paying.
3.10 Dial-a-Ride satisfaction is up two points compared to the same time last year, particularly among
those who travelled and have been recently contacted. Customers are more satisfied with the
service, despite a slight decline in the proportion of requests scheduled compared to the same
time last year. Satisfaction with the booking process increased to 82, the highest score since
Quarter 2 last year, reflecting an improvement in peak call answering times.
Table 26: Customer satisfaction by service
Score (out of 100) Quarter 4, 2015/16 Full year 2015/16
Actual Variance to
target
Variance to
last year
Actual Variance to
target
Variance to
last year
2011/12 –
2015/16
higher is better
London Underground 85 1 0 85 1 1
London Buses 86 2 2 86 2 1
DLR 89 1 1 89 1 0
London Overground 84 2 1 84 2 1
London Tramlink 91 3 2 90 2 1
Emirates Air Line 93 0 -1 93 0 0
TfL Rail 83 3 N/A 83 3 N/A N/A
Transport for London
Road Network (TLRN) 74 0 0 74 0 0
Dial-a-Ride 93 1 1 92 0 0

35
Customer satisfaction – environment
Table 27: Environmental performance
Numbers Quarter 4, 2015/16 Full year 2015/16
Actual Variance to
target
Variance to
last year
Actual Variance to
target
Variance to
last year
higher is better
Hybrid bus introduction 1,670 N/A 417 1,670 20 417
3.11 The proportion of the bus fleet served by low-carbon emission and quieter diesel-electric buses
remains at 19 per cent. There are currently around 1,670 hybrids in the fleet and this total will grow
further (including the 800 New Routemasters) to around 20 per cent by late 2016. In addition, the
bus fleet now has around 1,000 of the latest ultra-low emission Euro VI engine vehicles, many of
which are hybrids.

36
Customer complaints
Table 28: Customer complaints
No. complaints per 100,000 journeys Quarter 4, 2015/16
Actual Variance to Quarter 3,
2014/15
▼ lower is better
London Underground 1.02 -0.12 ▼
Docklands Light Railway 1.06 -0.57 ▼
London Overground 4.73 2.09
TfL Rail 4.75 N/A
London Tramlink 1.84 0.41
Emirates Air Line 6.68 2.74
London Buses 3.24 0.58
Streets 0.17 0.17
Congestion Charge 7.27 -1.27 ▼
Dial-a-Ride 134.95 21.21
River Services 0.64 -0.08 ▼
Santander Cycle Hire 5.08 -2.36 ▼
Taxi and Private Hire 5.81 -1.17 ▼
Contactless Payment Card 0.17 - 0.56 ▼
Oyster 0.15 -0.05 ▼
3.12 Complaints about London Overground increased to 4.73 per 100,000 journeys. Issues with late
and cancelled trains remains the most frequent cause for contact, making up over a third of
complaints. The West Anglia service continues to receive the highest number of complaints, with a
high number of service failures. This will be rectified through modification of the train stock and
improvements in driver availability.
3.13 London Buses complaints have increased by 0.58 per 100,000 journeys from Quarter 4 of last year.
Driver complaints remain the highest category, counting for over 11,000 complaints over the
quarter; this is a 12 per cent rise on last year. To help ensure drivers deliver consistently good
customer service, all bus drivers in London are undergoing mandatory customer service training,
starting in June 2016.
3.14 Complaints regarding congestion charging continue to reduce, down 15 per cent on Quarter 4 of
last year. The auto pay system remains the most frequent cause for complaint due to payments

37
being rejected by the card issuer. Complaints about contact centre staff dropped over the quarter
due to improved training.
3.15 Dial-a-Ride complaints have increased significantly since last quarter; up 40.7 per cent on the
previous quarter and 18.4 per cent on the same quarter last year. This is due to on an ongoing issue
with driver shortage, and the number of journeys that we were unable to fulfil. An in-house driver
recruitment initiative has been implemented in order to improve reliability and reduce the
complaints.
3.16 Complaints about Santander Cycles reduced by 2.36 per 100,000 journeys. This reduction can be
attributed to customer familiarity with the system, with fare queries and issues with access keys
both reducing significantly. Journeys were down during the winter period, with 31 per cent less
than Quarter 3 and 43 per cent less than Quarter 4.
3.17 Complaints regarding Taxi and Private Hire reduced to 5.81 per 100,000 journeys. Over 70 per cent
of complaints are in relation to driver behaviour. Each driver is informed of the issue, and steps are
put in place to avoid similar complaints going forward.
3.18 Contactless Payment Card usage continues to increase, with the number of journeys more than
doubling from last year. Despite this, there has been a large decrease of over 80 per cent in issues
with touching in/out complaints as customers get used to using the technology.

38
Customer services
Table 29: Customer communications and correspondence
Quarter 4, 2015/16 Full year 2015/16
Actual Variance to
target
Variance to
last year
Actual Variance to
target
Variance to
last year
higher is better
Correspondence Service
level agreement 92.0 12.0 9.8 81.7 1.7 -1.5
Mystery shopper quality
assessment scores 87.2 2.2 1.5 86.8 1.8 1.6
▼ lower is better
Call abandonment rate 10.3 -4.7 -0.7 12.6 -2.4 -1.7
3.19 Our correspondence performance improved by nine per cent on Quarter 3 and is almost 10 per
cent better than Quarter 4 last year. On average, our periodic demand dropped by 20 per cent in
comparison to last quarter. In particular, bus related correspondence dropped significantly, with
seasonal trends resulting in reliability contacts reducing by 37 per cent.
3.20 Our average periodic telephony demand dropped by 22 per cent from the previous quarter. This
was partly due to the ending of the student photocard application peak in Quarter 3, with periodic
demand subsequently reduced by 46 per cent in Quarter 4. This drop in demand enabled us to
improve our abandonment rate by over 6 per cent compared to the previous quarter.
3.21 Our quality score improved by 1.5 percentage point from Quarter 3 last year. We continued to
perform particularly well on telephony, scoring 95 per cent over the period.
Ticketing
Table 30: Ticketing system availability 1
Quarter 4, 2015/16 Full year 2015/16
Actual Variance to
target
Variance to
last year
Actual Variance to
target
Variance to
last year
higher is better
London Underground-
ticketing system overall
availability
98.88 0.08 0.09 98.72 -0.08 -0.11
London Buses- ticketing
system overall
availability
99.49 0.49 N/A 99.38 0.38 N/A
1 TfL entered into a new Revenue Collection Contract during Quarter 2, 2015/16. This changed the measurement of
availability and figures are not precisely comparable with previous quarters.

39
16,000,000
17,000,000
18,000,000
19,000,000
20,000,000
21,000,000
Period 10 Period 11 Period 12 Period 13
3.22 London Underground ticketing system availability was above target, improving by 0.5 per cent from
Quarter 3. Quicker fix fault times has helped to improve availability. London Buses ticketing
availability remained above target
Website and social media
3.23 Social media, including Twitter and Facebook continues to be an increasingly important method of
communicating with our customers. Our 21 Twitter feeds provide real time travel updates,
ticketing information and weekend engineering work schedules. The total social media followers
has now reached 4.3 million.
3.24 The Digital Media Monitor survey of March 2016 shows that more Londoners are using the website
than ever before at 83 per cent (up from 80 per cent in Autumn 2015). The number of Londoners
using apps powered by our data remains at 42 per cent.
3.25 The number of users rating our website as ‘above average’, ‘good’ or ‘excellent’ remains at 90 per
cent, achieving the 2015/16 target.
Chart 2: Social media followers, 2014/15 to 2015/16
Chart 3: Website visits, Quarter 4 2015/16
0
500,000
1,000,000
1,500,000
2,000,000
2,500,000
3,000,000
3,500,000
4,000,000
Period 10 Period 11 Period 12 Period 13
Facebook fans Twitter followers

40
People
4.0 At the end of Quarter 4, TfL’s headcount – measured in full-time equivalent (FTE) - was 31,214,
1,972 higher than Budget. Overall staff costs are, however, £17m higher than Budget over the full
year. While headcount is seven per cent higher than Budget, staff costs are one per cent over. The
financial impact from the headcount variance to Budget is lessened as the average headcount
variance over the full year was 730. In addition, pay awards were less than Budget, due to lower
inflation and our new Pay for Performance framework.
Table 31: Headcount
FTE End of
2015/16
Variance to Budget Average year
to date FTE
Average
variance to
Budget
£m – YTD variance
London Underground 21,613 (1,365) 7% 21,419 (536) (6) 0%
London Rail 378 (73) 24% 339 (33) (7) 38%
Surface Transport 3,859 (132) 4% 3,706 (2) 0 1%
Shared services 4,380 (424) 11% 4,294 (244) (9) 3%
Crossrail 983 21 ▼ -2% 988 85 4 ▼ 0%
Total TfL 31,214 -1,972 7% 30,746 (730) (17) 1%
4.1 At the end of Quarter 4, LU and London Rail employed 21,991 FTE – 21,613 in LU and 378 in
London Rail - which was 1,438 higher than Budget. LU headcount is 1,365 higher than Budget.
Underlying headcount was 1,105 higher, after taking in to account a 260 vacancy provision that was
included in the Budget; the vacancy provision was not utilised as recruitment levels are now
running closer to the underlying budget than previously assumed. The key drivers of the underlying
headcount variance are:
652 more FTEs in Operations than budgeted, largely driven by delays to the Fit for the Future
– Stations programme. The majority of the programme leavers were budgeted to leave the
organisation from January 2016, but this has been delayed to the first quarter of 2016/17
242 additional headcount to deliver the Four Lines Modernisation programme
130 Project Management Office staff transferred from corporate services to LU
4.2 London Rail (including TfL Rail) is 73 higher than Budget at the end of the Quarter, mainly due to
additional resources for London Overground projects that were not budgeted - including the
Barking Riverside Extension – and the use of agency staff for Tram maintenance rather than
external consultants.
4.3 Surface Transport headcount is 132 FTE – or four per cent – higher than Budget, primarily due to
externally funded posts including 98 additional FTEs in Taxi & Private Hire to support the higher
volumes of private hire licence applications and greater compliance activities.
4.4 Over the full year Surface Transport staff costs were £0.3m – less than one per cent - under the
gross staff cost Budget. This was a result of average headcount exceeding Budget by only two FTE,
and lower than Budget pay awards for operational staff.

41
4.5 Shared services headcount is 424 higher than Budget, from a combination of:
338 additional project roles supporting areas such as Night Tube and Fit for the Future –
Stations implementation, the London Road User Project, investment projects including
Silvertown Tunnel, Crossrail 2 development as well as support functions including Desktop
Futures and Web Integration
175 roles due to increased demand, including the Lost Property Office, customer Contact
Centres, and in HR due to increased recruitment demand and support for schemes such as
graduates and apprentices
These increases have been partly offset by 33 vacancies.
4.6 The full year financial impact from the increased headcount is £9m. This is largely due to the
increased recruitment demand across TfL, and £3m of additional work for Crossrail 2 and GLA, the
latter offset by increased income from the DfT and the GLA.

42
Appendix A: Business Unit financial tables
Rail and Underground
London Underground &
London Rail
(£m)
Full year 2015/16 Section
Actual Budget Variance to
Budget
Quarter 3
forecast
Actual
variance to
Quarter 3
forecast
London Underground 2,552 2,556 (4) 2,561 (9) 2.2 and 2.3
London Rail 473 472 1 489 (16) 2.4 and 2.5
Total fares income 3,025 3,029 (3) 3,050 (25)
Other operating income 173 165 8 176 (2) 2.7
Total operating income 3,198 3,194 5 3,226 (27)
LU operating costs (2,132) (2,191) 59 (2,182) 49 2.10, 2.11,
2.12 and 2.13
Renewals and reliability
Projects (110) (157) 47 (124) 14
London Rail Operations (incl.
TfL Rail) (519) (557) 39 (544) 26 2.12 and 2.13
Total operating expenditure (2,761) (2,906) 145 (2,850) 89
Capital expenditure
London Underground (1,199) (1,217) 19 (1,162) (37) 2.21 and 2.22
Third-party capital
contributions 31 32 (2) 45 (14) 2.31
London Rail (233) (301) 68 (284) 51 2.23 and 2.24
Third-party capital
contributions 3 7 (4) 3 (0) 2.32
Net capital expenditure (960) (1,191) 231 (1,023) 63
Net Service Expenditure (1,199) (1,217) 19 (1,162) (37)

43
Surface Transport
Surface Transport
(£m)
Full year 2015/16 Section
Actual Budget Variance to
Budget
Quarter 3
forecast
Actual
variance to
Quarter 3
forecast
Bus fares income 1,524 1,611 (87) 1,534 (10) 2.6
Bus contract costs (1,987) (2,036) 49 (2,003) 16 2.14 and
2.15
Direct Bus Subsidy (463) (425) (38) (469) 6
Other Bus Income 32 29 4 33 (0) 2.7 and 2.8
Bus operating Expenditure (78) (84) 7 (79) 1
2.14 and
2.15
Bus Capital Expenditure (120) (141) 21 (126) 6
2.25, 2.26,
2.27 and
2.28
Net Bus Service Expenditure (628) (622) (6) (641) 13
Other Surface Transport
Other Operating Income 386 382 4 390 (3) 2.7 and 2.8
Other Operating Expenditure (792) (828) 36 (807) 15 2.14 and
2.15
Other Capital Expenditure (368) (342) (25) (359) (9)
2.25, 2.26,
2.27 and
2.28
Net Service Expenditure (1,401) (1,410) 8 (1,417) 16
Shared services
Corporate
(£m)
Full year 2015/16 Section
Actual Budget Variance to
Budget
Quarter 3
forecast
Actual
variance to
Quarter 3
forecast
Other Operating Income 74 57 16 67 6 2.7
Operating Expenditure (net of
third-party contributions) (679) (772) 94 (744) 66 2.16 and
2.17
Net capital Expenditure (121) (163) 42 (184) 64 2.29 and
2.30
Net Service Expenditure (726) (878) 152 (862) 136

44
Appendix B: Reconciliation to the Investment Programme Report (IPR)
TfL group
(£m)
Full year, 2015/16
Actual Budget Quarter 3 forecast Actuals variance to
Quarter 3 forecast
TfL gross capital expenditure
London Underground (1,199) (1,217) 19 (1,162) 55
London Rail (233) (301) 68 (284) 17
Surface Transport (501) (500) (1) (501) (1)
Shared services (537) (550) 13 (578) (29)
Total gross capital
expenditure (2,470) (2,569) 99 (2,526) 43
London Underground (110) (157) 47 (124) 33
Surface Transport (199) (222) 23 (206) 17
TfL revenue investment (310) (380) 70 (330) 50
London Underground (1,309) (1,375) 66 (1,287) 88
London Rail (233) (301) 68 (284) 17
Surface Transport (700) (722) 22 (707) 16
Shared services (537) (550) 13 (578) (29)
TfL gross investment
programme (2,780) (2,948) 169 (2,856) 92

45
Appendix C: Balance Sheet
TfL Group Balance Sheet at Quarter 3 (£m) End of 2015/16
Actual Variance to
Budget
Quarter 3
forecast
Variance to
Quarter 3
forecast
Long term assets* – (higher) / lower than budget 36,207 (707) 35,534 (673)
Stocks and short term debtors – (higher) / lower than budget 710 (132) 615 (95)
Short term loans receivable – (higher) / lower than budget 622 688 1,283 661
Cash & short term investments – (higher) / lower than budget 3,314 (324) 3,084 (230)
Creditors - higher / (lower) than budget (2,940) (54) (3,102) (162)
Derivative net liabilities - higher / (lower) than budget (111) 32 (98) 13
Borrowings – higher / (lower) than budget (9,113) (2) (9,111) 2
Provisions – higher / (lower) than budget (3.152) 86 (3,029) 123
Total Net Assets – (higher) / lower than budget 25,537 (413) 25,176 (361)
Long-term assets
5.0 Long term assets at the end of Quarter 4 were £36,207m, £707m above the full year Budget.
However, £660m of the variance was caused by the extension to the repayment date of the cash
advance made to Network Rail by Crossrail (causing a higher proportion of the loan to score as long
term assets – there is an offsetting effect below in the short term loan receivable balance). A
further £158m was due to the year end property revaluation exercise and £26m was for unrealised
fair value adjustment in the carrying value of our share of the Earl’s Court Partnership company net
assets, neither of which was included in the budget.
5.1 Excluding the impact of these three unbudgeted increases, the underlying variance for long term
assets was £137m below Budget, £107m of which was lower activity capital expenditure as
detailed above. The remaining £30m includes £6m net for higher depreciation / lower disposals,
£10m lower long term invested balances, £10m for lower cash advances to the Earls Court
Partnership and a net £4m for other debtor and derivative movements.
5.2 The long term asset outturn variance to the Quarter 3 forecast of £673m was similarly affected by
the three ‘one-off’ adjustments to property values (£158m), the Earls Court investment (£26m) and
the Network Rail advance (£660m), leaving the underlying variance at £171m below forecast. This
was due to lower than expected capital expenditure activity in the final quarter of £159m (£107m
from the Crossrail project and £52m in other TfL). The remaining variance of £12m was again the
net of higher depreciation and lower disposals across the group of £5m and £7m lower cash
advanced to the Earls Court Partnership.

46
Stocks and short-term debtors
5.3 Stock and short term debtors were £132m above Budget at the end of Quarter 4. In Corporate, Rail
Settlement Plan (RSP) balances were £30m higher than the budget as TfL has sold a smaller
proportion of tickets for our own and National Rail services than assumed, meaning TfL is now due
to receive higher amounts from the Train Operating Companies. In LU and LR, capital debtors
were £27m higher than budget as a result of the re-financing of certain assets. trade and other
receivables were £44m higher than Budget including £12m for some contractual income. Accrued
income was £34m above budget, including £18m in TfL for Crossrail related Community
Infrastructure Levy and £9m in London Rail in respect of London Overground Rail Operations Ltd.
(LOROL) and the West Anglia franchise, which were partially offset by a £20m reduction in the
grant accrued for the Northern Line Extension. Finally, stocks were £17m higher than Budget,
mainly due to increased levels of maintenance items such as new rolling stock parts.
5.4 Against the Quarter 3 forecast, the full year balance for short term debtors and stock was £95m
above Budget. Many of the issues listed in the year to date are repeated here including the
LOTRAIN capital debtor (£27m), the Exterion advertising debtor (£11m) and the RSP debtor (£15m),
whilst stock levels, which had expected to reduce by year end, remained £14m above Budget. The
remaining £28m variance across the Group was for trade and other debtors.
5.5 As referenced above, the short term loan variances against both Budget and forecast represents
the agreement to defer repayment of an element of the Network Rail cash advance into future
periods, rather than receive full settlement in May 2016. The full balance of the Network Rail loan
at year end was £1,283m, in increase of £460m in the year. £623m will be repaid in 2017 and the
remaining balance in 2018.
Cash and short-term investments
5.6 Cash and short term investments at Quarter 4 were £3,314m some £314m above Budget and
£230m higher than forecast at Quarter 3. Appendix D below summarises actual and forecast cash
movements compared to Budget.
Creditors
5.7 Year to date creditors were £54m, or 1.8 per cent lower than Budget, and £162m or 5.2% below
the quarter 3 forecast. The budget variance was primarily driven by lower capital creditors in R&U
and Crossrail, reflecting the reduced capital activity, partially offset by higher trade creditors and
accruals across the group. Again, the forecast variance reflects certain assumptions used at
quarter 3 on expenditure and payment profiles around the year end on major projects such as Four
Line Modernisation, which did not materialise at the year end.
Derivatives
5.8 The derivatives position at quarter 4 is based on market values. TfL is obliged to record the fair
value of its derivatives on the balance sheet. Where hedge accounting applies, any movement in
the fair value of the derivative liability is recognised directly in reserves; otherwise the movement is
recorded in the income statement. The fair value movement is expected to reverse by maturity in
future years.

47
Borrowings
5.9 Borrowings at Quarter 4 were as expected, on budget and forecast.
Provisions
5.10 Provisions at the end of Quarter 4 were £86m higher than budget £32m of which related to the
Crossrail project, with lower payments for property claims of £16m and an £16m increase in the
balance for contractual claims. Elsewhere provisions were established for potential commercial
claims. The outturn was £123m higher than the quarter 3 forecast position. The Crossrail project
accounted for £71m with lower property related payments of £24m and a £46m for increased
property and contractual claims. As per the budget position, the forecast variance includes the
effect of the other commercial claims provision as well as adjustments to severance and
dilapidation provisions.

48
Balance Sheet
(£m)
Full year, 2015/16
Actual Budget Variance to
Budget
Quarter 3
forecast
Variance to
Quarter 3
forecast
Intangible assets 123 97 (26) 90 (33)
Property, plant & equipment 34,391 34,452 61 34,511 120
Investment properties 518 438 (80) 438 (80)
Share of net assets of associate entities 70 44 (26) 44 (26)
Long term investments* - 10 10 - -
Long term derivatives 7 - (7) - (7)
Long term debtors 1,098 459 (639) 451 (647)
Non current assets 36,207 35,500 (707) 35,534 (673)
Stocks 71 53 (18) 56 (15)
Assets held for Sale 639 525 (114) 559 (80)
Short term debtors 5 23 18 5 -
Short term derivative 622 1,310 688 1,283 661
Cash and Short Term Investments 3,314 2,990 (324) 3,084 (230)
Current Assets 4,651 4,901 250 4,987 336
Short term creditors (2,201) (2,216) (15) (2,353) (152)
Short term derivatives (21) (1) 20 (11) 10
Short term borrowings (832) (784) 48 (784) 48
Short term lease liabilities (94) (53) 41 (95) (1)
Short term provisions (222) (137) 85 (100) 122
Current Liabilities (3,370) (3,191) 179 (3,343) 27
Long term creditors (80) (119) (39) (79) 1
Long term borrowings (8,281) (8,331) (50) (8,327) (46)
Long term lease liabilities (565) (606) (41) (575) (10)
Long term derivatives (95) (101) (6) (92) 3
Other provisions (46) (47) (1) (49) (3)
Pension provision (2,884) (2,882) 2 (2,880) 4
Long Term Liabilities (11,951) (12,086) (135) (12,002) (51)
Total Net Assets 25,537 25,124 (413) 25,176 (361)
Capital and Reserves
Usable reserves 3,238 2,882 (356) 2,853 (385)
Unusable reserves 22,299 22,242 (57) 22,323 24
Total capital employed 25,537 25,124 (413) 25,176 (361)
Cash and Investments
CRL Sponsor funding account 1,539 1,574 35 1,448 (91)
Other cash and investments 1,775 1,426 (349) 1,636 (139)
Total as above 1 3,314 3,000 (314) 3,084 (230)
1 Includes Cash and Investments, and long-term investments

49
Appendix D: Cash summary
Cash Summary In / (Out) Flow
(£m)
£m
Year to date Full year, 2015/16
Actual Budget Variance to
Budget
Quarter 3
Forecast
Variance to
Budget
Margin (1,408) (1,697) (289) (1,552) (155)
Working Capital Movements 110 41 (69) (10) (120)
Cash Spend on Operating Activities (1,298) (1,656) (358) (1,562) (275)
Net Capital Expenditure (2,006) (2,126) (120) (2,068) (51)
Crossrail (1,508) (1,535) (25) (1,613) (105)
Working Capital Movements 165 322 157 411 246
Cash Spend on Capital Activities (3,349) (3,339) 10 (3,270) 90
Cash Settlement of derivatives - - - - -
Capitalised Interest and other items not included
in activity or working capital 98 111 13 130 32
Fair value adjustment for long term investments - - - - -
Loans to 3rd Parties (issued) / repaid (862) (900) (38) (870) (8)
Non-Activity Movements (764) (789) (25) (740) 24
Grants, Precept & other contributions 3,448 3,505 57 3,380 (68)
Borrowings Raised 624 626 2 623 (1)
Borrowings Repaid (25) (25) - (25) -
Total Funding 4,047 4,106 59 3,978 (69)
Net Movement in Cash (1,364) (1,678) (314) (1,594) (230)

50
Appendix E: Financial comparison with 2014/15
TfL group finances – operating income, expenditure and funding
TfL group Full Year, 2015/16
(£m) Actuals, 2014/15 Actuals, 2015/16 Year on year change
Fares income 4,281 4,550 268 6%
Other operating income 720 675 -45 -6%
Total income 5,002 5,225 223 4%
Operating expenditure (net of third-party
contributions) -6,152 -6,306 -154 2%
Operating margin -1,150 -1,081 69 -6%
Interest income 28 25 -3 -9%
Debt interest -358 -372 -14 4%
Contingency and group items 27 20 -7 -27%
Margin -1,453 -1,408 46 -3%
Finances sources
General grant 897 591 -306 -34%
Overground grant 26 37 11 40%
GLA precept 6 6 0 0%
Business Rates Retention 828 773 -55 -7%
Other revenue grants 8 29 21 271%
Total revenue grants 1,766 1,436 -329 -19%
Operating contribution to fund investment 313 28 -284 -91%

51
TfL group finances – capital expenditure, income and funding
TfL group Full Year, 2015/16
(£m) Actuals, 2014/15 Actuals, 2015/16 Year on year change
Capital expenditure -1,979 -2,460 -482 24%
Third-party contributions – capital 25 47 22 86%
Sales of property and other assets 47 407 360 761%
Net capital expenditure excl. Crossrail -1,906 -2,006 -100 5%
Crossrail capital expenditure -1,475 -1,508 -33 2%
Net capital expenditure incl. Crossrail -3,382 -3,514 -133 4%
Finance sources
Surplus/ -deficit to fund investment 313 28 -285 -91%
Crossrail funding sources 1,702 959 -742 -44%
Investment grant 909 925 16 2%
Metronet grant 124 132 7 6%
Other capital grants -389 -491 -102 26%
Working capital 645 598 -47 -7%
Net borrowing and reserve movements 76 1,364 1,288 1,695%
Total 3,382 3,514 133 4%
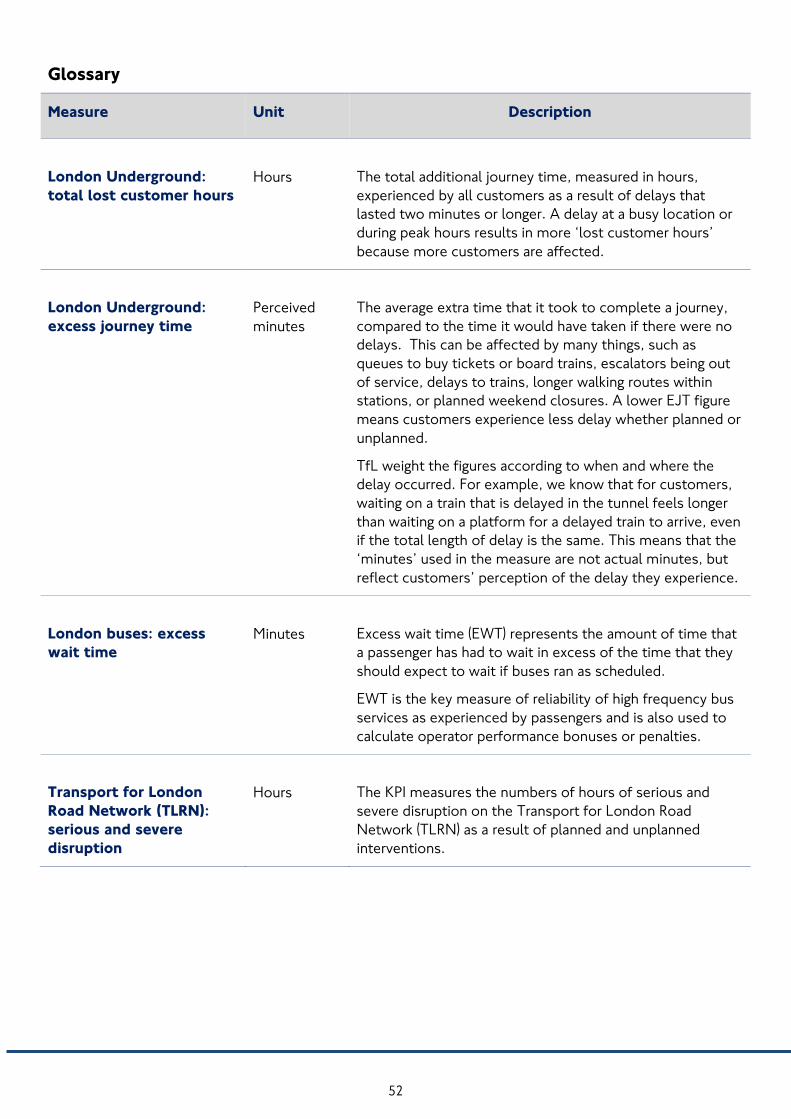
52
Glossary
Measure Unit Description
London Underground:
total lost customer hours
Hours
The total additional journey time, measured in hours,
experienced by all customers as a result of delays that
lasted two minutes or longer. A delay at a busy location or
during peak hours results in more ‘lost customer hours’
because more customers are affected.
London Underground:
excess journey time
Perceived
minutes
The average extra time that it took to complete a journey,
compared to the time it would have taken if there were no
delays. This can be affected by many things, such as
queues to buy tickets or board trains, escalators being out
of service, delays to trains, longer walking routes within
stations, or planned weekend closures. A lower EJT figure
means customers experience less delay whether planned or
unplanned.
TfL weight the figures according to when and where the
delay occurred. For example, we know that for customers,
waiting on a train that is delayed in the tunnel feels longer
than waiting on a platform for a delayed train to arrive, even
if the total length of delay is the same. This means that the
‘minutes’ used in the measure are not actual minutes, but
reflect customers’ perception of the delay they experience.
London buses: excess
wait time
Minutes
Excess wait time (EWT) represents the amount of time that
a passenger has had to wait in excess of the time that they
should expect to wait if buses ran as scheduled.
EWT is the key measure of reliability of high frequency bus
services as experienced by passengers and is also used to
calculate operator performance bonuses or penalties.
Transport for London
Road Network (TLRN):
serious and severe
disruption
Hours
The KPI measures the numbers of hours of serious and
severe disruption on the Transport for London Road
Network (TLRN) as a result of planned and unplanned
interventions.
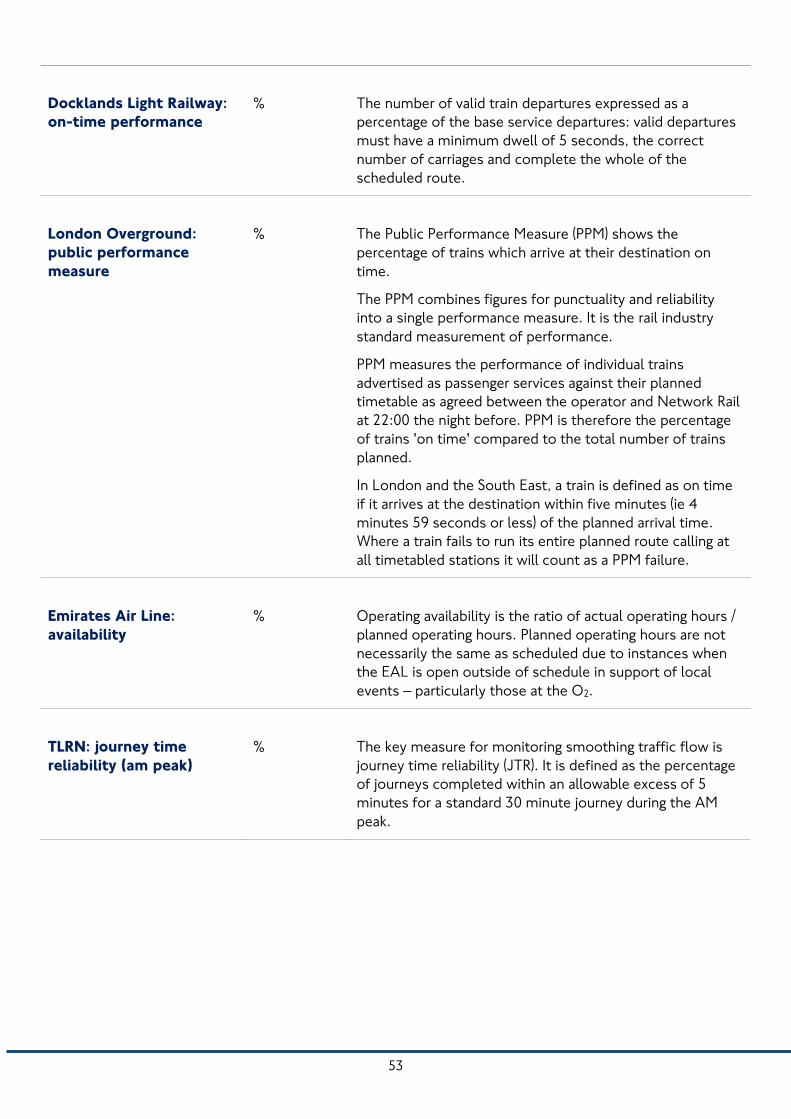
53
Docklands Light Railway:
on-time performance
%
The number of valid train departures expressed as a
percentage of the base service departures: valid departures
must have a minimum dwell of 5 seconds, the correct
number of carriages and complete the whole of the
scheduled route.
London Overground:
public performance
measure
%
The Public Performance Measure (PPM) shows the
percentage of trains which arrive at their destination on
time.
The PPM combines figures for punctuality and reliability
into a single performance measure. It is the rail industry
standard measurement of performance.
PPM measures the performance of individual trains
advertised as passenger services against their planned
timetable as agreed between the operator and Network Rail
at 22:00 the night before. PPM is therefore the percentage
of trains 'on time' compared to the total number of trains
planned.
In London and the South East, a train is defined as on time
if it arrives at the destination within five minutes (ie 4
minutes 59 seconds or less) of the planned arrival time.
Where a train fails to run its entire planned route calling at
all timetabled stations it will count as a PPM failure.
Emirates Air Line:
availability
%
Operating availability is the ratio of actual operating hours /
planned operating hours. Planned operating hours are not
necessarily the same as scheduled due to instances when
the EAL is open outside of schedule in support of local
events – particularly those at the O2.
TLRN: journey time
reliability (am peak)
%
The key measure for monitoring smoothing traffic flow is
journey time reliability (JTR). It is defined as the percentage
of journeys completed within an allowable excess of 5
minutes for a standard 30 minute journey during the AM
peak.
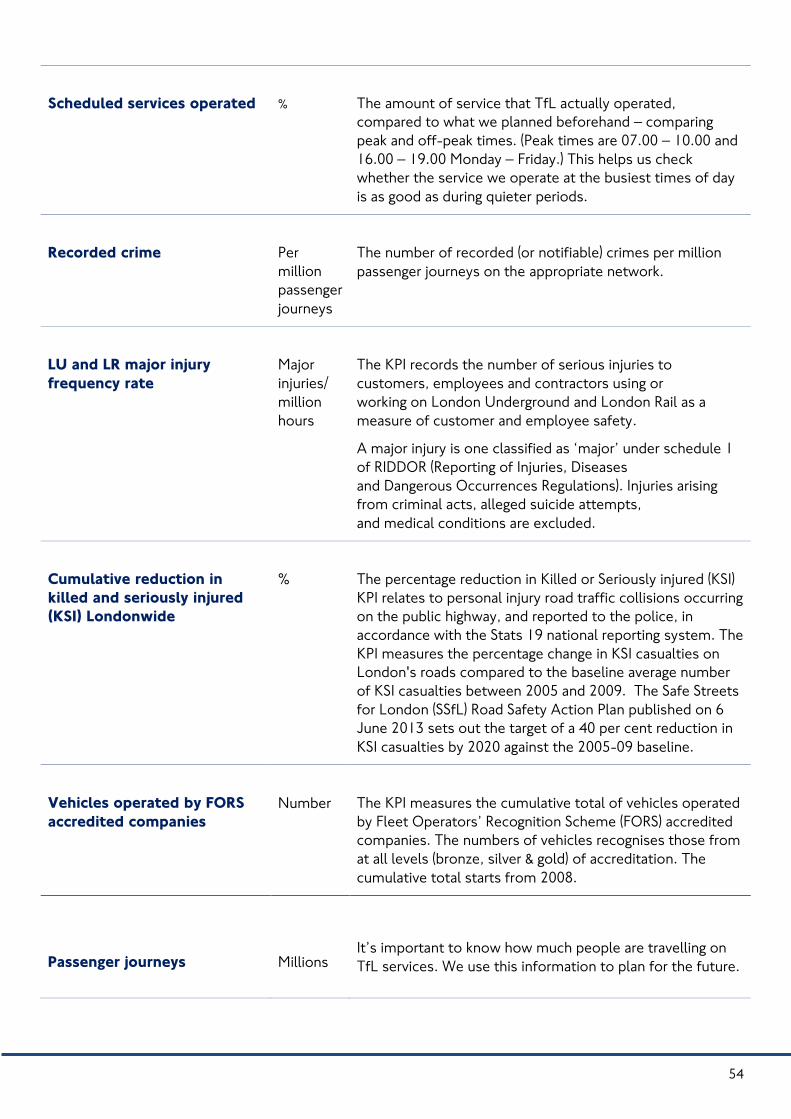
54
Scheduled services operated
%
The amount of service that TfL actually operated,
compared to what we planned beforehand – comparing
peak and off-peak times. (Peak times are 07.00 – 10.00 and
16.00 – 19.00 Monday – Friday.) This helps us check
whether the service we operate at the busiest times of day
is as good as during quieter periods.
Recorded crime
Per
million
passenger
journeys
The number of recorded (or notifiable) crimes per million
passenger journeys on the appropriate network.
LU and LR major injury
frequency rate
Major
injuries/
million
hours
The KPI records the number of serious injuries to
customers, employees and contractors using or
working on London Underground and London Rail as a
measure of customer and employee safety.
A major injury is one classified as ‘major’ under schedule 1
of RIDDOR (Reporting of Injuries, Diseases
and Dangerous Occurrences Regulations). Injuries arising
from criminal acts, alleged suicide attempts,
and medical conditions are excluded.
Cumulative reduction in
killed and seriously injured
(KSI) Londonwide
%
The percentage reduction in Killed or Seriously injured (KSI)
KPI relates to personal injury road traffic collisions occurring
on the public highway, and reported to the police, in
accordance with the Stats 19 national reporting system. The
KPI measures the percentage change in KSI casualties on
London's roads compared to the baseline average number
of KSI casualties between 2005 and 2009. The Safe Streets
for London (SSfL) Road Safety Action Plan published on 6
June 2013 sets out the target of a 40 per cent reduction in
KSI casualties by 2020 against the 2005-09 baseline.
Vehicles operated by FORS
accredited companies
Number
The KPI measures the cumulative total of vehicles operated
by Fleet Operators’ Recognition Scheme (FORS) accredited
companies. The numbers of vehicles recognises those from
at all levels (bronze, silver & gold) of accreditation. The
cumulative total starts from 2008.
Passenger journeys
Millions
It’s important to know how much people are travelling on
TfL services. We use this information to plan for the future.

55
Cycling levels on the TLRN Index
The purpose of this indicator is to assess the level of cycle
use on the TLRN. The overall ambition is to increase cycling
levels by 400% such that by 2025 cycling will equate to a
5% mode share of all journey trips. This indicator does not
represent cycling across London as a whole; It only
represents cycling on the 5% of London’s roads that are the
TLRN. The indicator is presented as an indexed flow relative
to a baseline of March 2000 (a flow level that is represented
as 100 on the index). Sixty automatic cycle counters on the
TLRN provide sample counts of cyclists using the network.
The indicator converts these counts into an index that is
used to represent increases in cycle flows on the TLRN
over time. It does not represent the total number of cyclists
in London. Automatic cycling counters are pieces of
monitoring equipment that emit a magnetic field that
detects the presence of a moving cycle.
Customer satisfaction %
One of our most important performance measures is
customer satisfaction; this helps us understand what the
people who use our services really think.
An independent research company interviews around
10,000 customers every year, as they complete their trip.
They are asked to make an ‘overall evaluation’ of their
journey experience, by giving a score out of 10. We take the
average of everybody’s scores and multiply it by 10, to give
a final result out of 100

1
Funit test
Investment Programme Report Quarter Four
January-March 2016
The new south plaza entrance

Report contents
TfL Investment Programme ..................................... 3Investment Programme highlights .......................... 4IPR programme updates .......................................... 6Financial performance ............................................ 90Variance definitions and key ................................. 94
2

TfL Investment Programme Our Investment Programme described in this report contains a range of projects that will deliver world-class transport services to London. The report covers the larger projects, defined as those with an estimated final cost of £50m or more. Significant yet smaller value projects may be included to provide a rounded view of the whole Transport for London (TfL) Investment Programme.
This Investment Programme Report (IPR) includes:
• Investment Programme highlights – summary of progress of the overall InvestmentProgramme
• Programme updates – commentary update to the significant projects and programmeswithin the Investment Programme and commentary on significant delivery milestonemovements or variances
• Financial variance – variance with commentary on financial key performance indicators (KPIs)
3
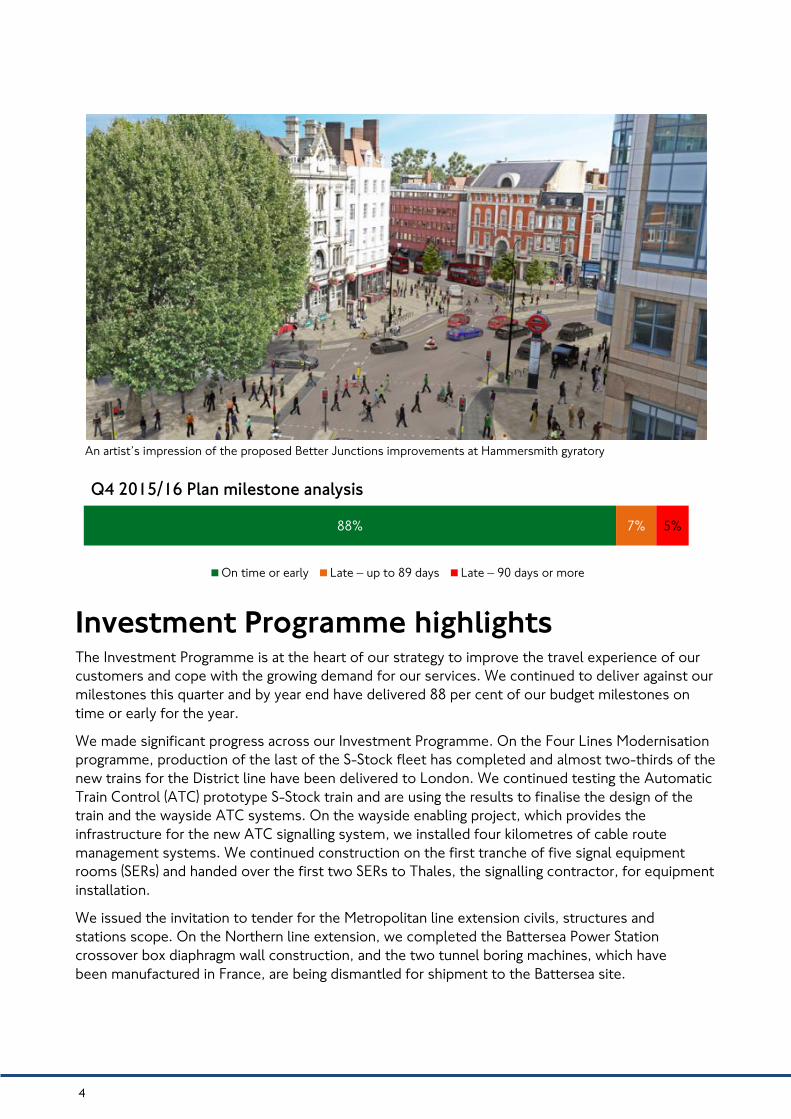
An artist’s impression of the proposed Better Junctions improvements at Hammersmith gyratory
Investment Programme highlights The Investment Programme is at the heart of our strategy to improve the travel experience of our customers and cope with the growing demand for our services. We continued to deliver against our milestones this quarter and by year end have delivered 88 per cent of our budget milestones on time or early for the year.
We made significant progress across our Investment Programme. On the Four Lines Modernisation programme, production of the last of the S-Stock fleet has completed and almost two-thirds of the new trains for the District line have been delivered to London. We continued testing the Automatic Train Control (ATC) prototype S-Stock train and are using the results to finalise the design of the train and the wayside ATC systems. On the wayside enabling project, which provides the infrastructure for the new ATC signalling system, we installed four kilometres of cable route management systems. We continued construction on the first tranche of five signal equipment rooms (SERs) and handed over the first two SERs to Thales, the signalling contractor, for equipment installation.
We issued the invitation to tender for the Metropolitan line extension civils, structures and stations scope. On the Northern line extension, we completed the Battersea Power Station crossover box diaphragm wall construction, and the two tunnel boring machines, which have been manufactured in France, are being dismantled for shipment to the Battersea site.
88% 7% 5%
Q4 2015/16 Plan milestone analysis
On time or early Late – up to 89 days Late – 90 days or more
5% 2%
4
On New Tube for London (NTfL), we released the invitation to negotiate for the design and build of the NTfL trains and, following approval of the NTfL signalling and train control procurement strategy, we also released the signalling pre-qualification questionnaire. The Board has approved funding for the scope for the next two financial years.
As part of continuing works to ensure our station assets are maintained, we re-opened Tufnell Park station to customers two weeks early on 4 March 2016. We replaced two lifts with new, more energy efficient ones, contributing towards TfL’s commitment to reduce the carbon footprint of Tube stations. We took advantage of the station closure to refurbish the ticket hall with an extra ticket gate, automatic wide-aisle gate and an improved customer information area. For the Victoria station upgrade works, we started work on the lift to connect the existing Network Rail (NR) concourse to the enlarged London Underground (LU) ticket hall, and the south ticket hall floor slab has been fully cast.
We entered into a funding agreement and a land and works agreement with Barking Riverside Ltd, which were signed in early March 2016. We submitted our application for a Transport and Works Act Order (TWAO) to the Secretary of State for Transport on 31 March 2016. If approved, construction of the 4.5km extension of the Gospel Oak to Barking line could start in late 2017, with train services starting in 2021.
Our TfL Rail station improvement works started in a phased approach at the 11 stations on the eastern section of the Crossrail route. The work will conclude in 2017 and includes significant external station renovations, new architectural internal fit-out and installation of gatelines to increase station security. The work is complementary with the Crossrail Anglia works that Network Rail will complete and will harmonise the appearance between these existing stations and the new central London stations. This will create a ‘family of stations’ with step-free access across the entire route.
We have been preparing the Silvertown Tunnel Development Consent Order application, which we submitted post quarter end on 29 April 2016. The application is to provide all the necessary powers and consents to construct, operate and maintain the Silvertown Tunnel.
We completed construction activities on two sections of central London’s key Cycle Superhighways, providing a safer environment for people to cycle by making junctions safer and reducing the risk of coming into contact with vehicles. On the North-South Cycle Superhighway, the final section of the two-way lane has opened on Blackfriars Bridge with the full length of the route now running from Elephant and Castle to Stonecutter Street near Holborn Viaduct. On the East-West Cycle Superhighway, which now connects with the North-South Cycle Superhighway, the first section of the route is in use between Tower Hill and Parliament Square.
Following public consultation for Hammersmith gyratory between 2 February and 15 March 2016, we are producing the consultation response report, which we hope to publish in summer 2016 confirming a way ahead.
5

IPR programme updates London Underground ............................................................................... 9
London Rail capacity and growth ............................................................ 45
Crossrail ................................................................................................. 54
Business change and technology ............................................................ 56
Surface Transport ................................................................................... 61
Financial performance ............................................................................ 90
The milestones in the chart above represent projects of all values, including those of a lower value than are covered in this report. The London Rail capacity and growth 2015/16 portfolio comprises 15 budget milestones, of which only half feature in this report as the other half relate to projects with an estimated final cost of less than £50m. The significantly late milestone score of 27 per cent comprises four milestones that are not covered in this report. Following the Government’s Spending Review and Autumn Statement 2015, the Yourailway Royal Victoria and Canary Wharf to Stratford double track projects are on hold pending a decision on whether to continue, defer or cancel them. The Yourailway Limehouse project was delayed for this reason while the decision to continue the project was made. We decided to delay the Croydon town centre Dingwall loop TWAO application submission while Westfield prepares to submit a replacement planning application, a key dependency for the financing of the project, in July 2016.
90%
91%
60%
88%
10%
4%
13%
6%
5%
27%
6%
Surface Transport
Business change,technology and
Corporate
London Railcapacity and growth
London Underground –
capital programmes and commercial
development
Q4 2015/16 Plan milestone analysis
On time or early Late – up to 89 days Late – 90 days or more
6

London Underground and London Rail
Four Lines Modernisation (4LM) ............................. 9S-Stock train roll-out ...................................................................... 9Automatic Train Control (ATC) ................................................... 10
Metropolitan line extension ................................... 12Infrastructure renewals .......................................... 15
Track programme ........................................................................... 154LM Major Power Works (Traction) ............................................. 17Power system control replacement (SCADA) ........................... 19
Legacy train systems ............................................. 20Northern line extension .......................................... 22World Class Capacity ............................................. 24
Capacity I modernisations............................................................ 25Capacity II modernisations .......................................................... 27
New Tube for London (NTfL) ................................. 29Stations, Crossrail and third party ........................ 31
Vauxhall station upgrade ............................................................. 31Tottenham Court Road station upgrade ................................... 32Bond Street station upgrade ........................................................ 33Bank Bloomberg Place ................................................................... 35Bank station capacity .................................................................... 35Bank station systems integration upgrade ................................ 37Victoria station upgrade ............................................................... 38Future station capacity ................................................................. 40Integrated Stations Programme (ISP) .......................................... 40
7
London Underground lifts and escalators ................................. 41London Underground Crossrail works ....................................... 43
London Rail capacity and growth ......................... 45London Overground capacity improvement ............................. 45London Overground Station Capacity Programme (LOSTAT) . 46Trams Wimbledon line enhancement ........................................ 47Barking Riverside extension ......................................................... 48On Network Stations Improvement Programme ...................... 49Crossrail rolling stock programme .............................................. 51
Crossrail ................................................................... 54Crossrail Limited (CRL) .................................................................. 54
8

London Underground Four Lines Modernisation (4LM) Overview
The 4LM project covers 40 per cent of the LU network. This major modernisation programme will deliver a 33 per cent increase in peak-hour capacity, operating at 32 trains per hour on one of the world’s most complex railways. To continue running reliable and regular services on the Circle, Metropolitan, District and Hammersmith & City lines, we are introducing a phased replacement of fleet, signalling and supporting systems most of which are at, or beyond, their design life. The need for their replacement has also created an opportunity for asset modernisation and delivery of improved journey times and capacity; both are essential to accommodate London’s projected population and employment growth.
The modernisation includes the complete replacement of trains across all four lines with new ‘S-Stock’ trains. These trains are walk-through with air conditioning, are fully access compliant and have improved visual and audio displays, dedicated wheelchair spaces and colour contrasting interiors.
S-Stock train roll-out
Quarterly progress
S-Stock roll-out on the Metropolitan, Circle and Hammersmith & City lines has completed and 51 (of a total of 80) new trains for the District line have been delivered to London. Production of the last of the 192 trains (an additional train was added to the order for the Metropolitan line extension project) in the S-Stock fleet has also been completed. Introduction of the fleet into service is planned to complete in 2016, ahead of the Department for Transport’s (DfT’s) milestone date.
S-Stock train in service at Liverpool Street
Programme milestones forecast
Milestone Current plan date
Actual/ forecast
date RAG Commentary
Forecast change from
Q3 (days)
Roll-out of new air-conditioned trains on the District line complete (Annex B: 2016)
31-Dec-16 24-Oct-16 -7
9

4LM
Programme financial forecast Full life In year
Spend to end Quarter 4, 2015/16 £m
Estimated final cost (EFC) £m
Authority £m Variance to authority
£m/%
EFC movement in quarter £m/%
Year-end actual £m
Year budget
£m
Variance to budget £m/%
2,907.8 3,134.9 3,144.0 9.1 0.3% 3.9 0.1% 137.6 140.3 2.7 1.9%
The EFC is below authority.
Automatic Train Control (ATC)
Quarterly progress
The approach to delivering 4LM is to drive the forward-leaning programme plan (where zero time risk allowance is included), which is 18 months earlier than the contracted programme plan (where a significant level of risk allowance is included). If the forward-leaning plan is achieved, we will deliver considerable cost saving and early revenue benefits. The signalling design and fitting of ATC equipment to trains currently represents a risk of three months to the forward-leaning plan and we are exploring mitigations to recover the forward-leaning position.
We continued testing the ATC prototype S-Stock train at the Melton Rail Innovation and Development Centre. The test results are being used to finalise the design of the train and the wayside ATC systems. We will start testing finalised design on the pre-production train in summer 2016.
Our work to change the track layout to optimise the infrastructure capacity ready for ATC included plain lining (removal) of points at Hornchurch and Gloucester Road. Seven of the 21 sites requiring track work are complete.
On the wayside enabling project, which provides the infrastructure for the new ATC signalling system, installation of cable route management systems (CRMS) started at Paddington and Euston Square stations. We installed four kilometres of CRMS during Quarter 4.
We continued construction on the first tranche of five signal equipment rooms and the first two of these, at Hammersmith and Edgware/Paddington, have been handed over to Thales, the signalling contractor, for installation of their equipment.
Hammersmith signal equipment room, which has been completed and handed over to Thales to start installation of the ATC signalling system
10

Programme milestones forecast
Milestone Current plan date
Actual/ forecast
date RAG Commentary
Forecast change from
Q3 (days) Train-borne system approved 26-Jan-18 26-Jan-18
It should be noted that to implement the timetable changes associated with revenue service uplifts, a number of adjacent migration areas need to be commissioned and an appropriate reliability proving period completed. The forecast dates are the forward-leaning programme plan (ie the earliest possible commissioning dates) for Thales, based on services operated at the time.
-
Revenue service – Hammersmith (H&C) to Latimer Road
25-Aug-19 16-Apr-18 -
Revenue service – Sloane Square to Paddington (Circle)/Barons Court/Fulham Broadway/Olympia
16-Aug-20 25-Mar-19 -
Revenue service – Becontree to Upminster
03-Dec-20 15-Jul-19 -
Revenue service – Fulham Broadway to Wimbledon
16-Oct-21 26-May-20 -
Revenue service – South Harrow/West Harrow to Uxbridge
26-Mar-22 20-Nov-20 -
Significant quarterly milestones movement
Milestone description Current plan date
Q4 forecast
date RAG Movement commentary
Forecast change
from Q3 (days)
Start site installation 09-Apr-16 07-Apr-16 Complete
We postponed the start on site to allow more time to develop the design of the signalling system, however, it was achieved ahead of the plan date.
-93
Programme financial forecast Full life In year
Spend to end Quarter 4, 2015/16 £m
Estimated final cost (EFC) £m
Authority £m Variance to authority
£m/%
EFC movement in quarter £m/%
Year-end actual £m
Year budget £m
Variance to budget £m/%
742.5 2,257.0 2,268.0 11.0 0.5% 6.5 0.3% 138.7 235.3 96.6 41.0%
The EFC is below authority. The year-end actual is less than the budget as the budget was set before the award of the ATC signalling contract. Following contract award, the expenditure profile and the associated infrastructure works have been updated.
11
4LM

Metropolitan line extension Overview
The key objectives of the Metropolitan line extension are to provide a catalyst for regeneration and growth in the Watford area, and to improve connectivity between southwest Hertfordshire and northwest London. The project involves the diversion and extension of the existing Metropolitan line from just north of Croxley to a new terminus at Watford Junction via the existing Watford High Street station. The scope also includes the construction of a 400-metre viaduct and two new stations at Cassiobridge and Watford Vicarage Road; the upgrading of infrastructure on the disused Croxley Green Network Rail branch line; the installation of a new signalling system (including over the Network Rail-owned section); and the purchase of an additional S-Stock train.
Quarterly progress
The revised procurement strategy for delivery of the respective packages has been approved. The repackaging of the Taylor Woodrow (TW) Stage 2 works was the key element of the revision of the procurement strategy. This allows us to enter into service level agreements (SLAs) with our internal delivery partners (IDPs) and start the negotiation of terms and conditions with Network Rail for works on NR infrastructure.
The invitation to tender (ITT) was issued to TW for the Stage 2 civils, structures and stations scope. We are in the process of reviewing the tender from TW and, assuming the negotiated submission represents an acceptable position, we will seek procurement authority in Quarter 2 2016/17.
Final drafting of the SLAs for the signalling, power and track works will be undertaken by our IDPs and the associated estimates are being completed. It is intended that the SLAs will be ready for sign-off in May 2016.
Design on the LU-operable section continues to plan and we continue to negotiate the signalling and power solutions for the NR section. We are working with NR to ensure that the scope required in the preferred solution is within the available budget.
The planned route for the Metropolitan line extension to Watford Junction
12

Metropolitan line extension
Programme milestones forecast
Milestone Current plan date
Actual/ forecast
date RAG Commentary
Forecast change from
Q3 (days)
Start on site 16-Jun-16 12-Sep-16
This relates to the revised procurement strategy. The repackaging of the major civil engineering works contract is the key element of this strategy. The revised contract award date does not necessarily impact the overall programme.
-
Network Rail signalling contract award (Guide to Rail Investment Process [GRIP] Stage 4 Single Option Development)
14-Aug-16 14-Jul-16 31
Structures piling commences 22-Oct-16 29-Nov-16
Delayed due to design delays specifically on the viaduct and the delay in contract award from March 2016 to August 2016 to strengthen the tender documents, and afford more time to explore value engineering (VE) and value management (VM) opportunities.
-38
Station construction starts 19-Jan-17 16-Feb-17
Delayed due to design delays specifically on the stations and the delay in contract award from March 2016 to August 2016 to strengthen the tender documents, and afford more time to explore value engineering and value management opportunities.
-28
Network Rail signalling (GRIP Stage 4) complete
01-Aug-17 11-Jul-17 -
Vicarage Road station complete 18-Mar-19 18-Dec-18 -
GRIP Stage 6 (construction, testing and commission) installation complete
11-Dec-19 12-Sep-19
The contemporaneous rationale given in January when the movement in the contract award date was reported was to strengthen the tender documents and afford more time to explore VE/VM opportunities. These date movements did not impact the delivery into service date.
-
Delivery into service 13-Dec-20 13-Dec-20 -
13

Metropolitan line extension
Significant quarterly milestones movement
Milestone description
Current plan date
Q4 forecast
date RAG Movement commentary
Forecast change
from Q3 (days)
Wiggenhall junction installation works complete
27-Mar-19 27-Mar-19
The previous schedule forecast of 27 December 2018 was based on information available at the time. However, we have now received a schedule from NR (who will undertake these works), which reflects delays owing to contract negotiations taking longer than expected.
-90
Trial running of train commence
09-Jul-20 30-Jan-20
We are now in receipt of all schedules from suppliers and, having integrated the schedules, the overall critical path has been shortened, however, this has not impacted the completion.
133
Significantly late milestones
Milestone description Current plan date
Variance to budget (days)
Variance commentary
Stage 2 contract award 31-Mar-16 -124
This relates to the delay in the procurement process which was identified in the first period of Quarter 4, in particular the award of the major civil engineering works contract, which is currently not on the project’s critical path.
Programme financial forecast Full life In year
Spend to end Quarter 4, 2015/16 £m
Estimated final cost (EFC) £m
Authority £m
Variance to authority
£m/%
EFC movement in quarter £m/%
Year-end actual
£m
Year budget
£m
Variance to budget £m/%
52.1 299.7 285.1 -14.6 -5.1% -0.7 -0.3% 48.0 17.0 -31.0 -182.4%
The EFC is currently in excess of authority. A value engineering and management exercise is underway to identify opportunities to reduce the EFC and align with current authority.
The increase against budget relates to the Mayoral decision to transfer the delivery obligations for the programme from Hertfordshire County Council to TfL, which was made after the budget was set.
14
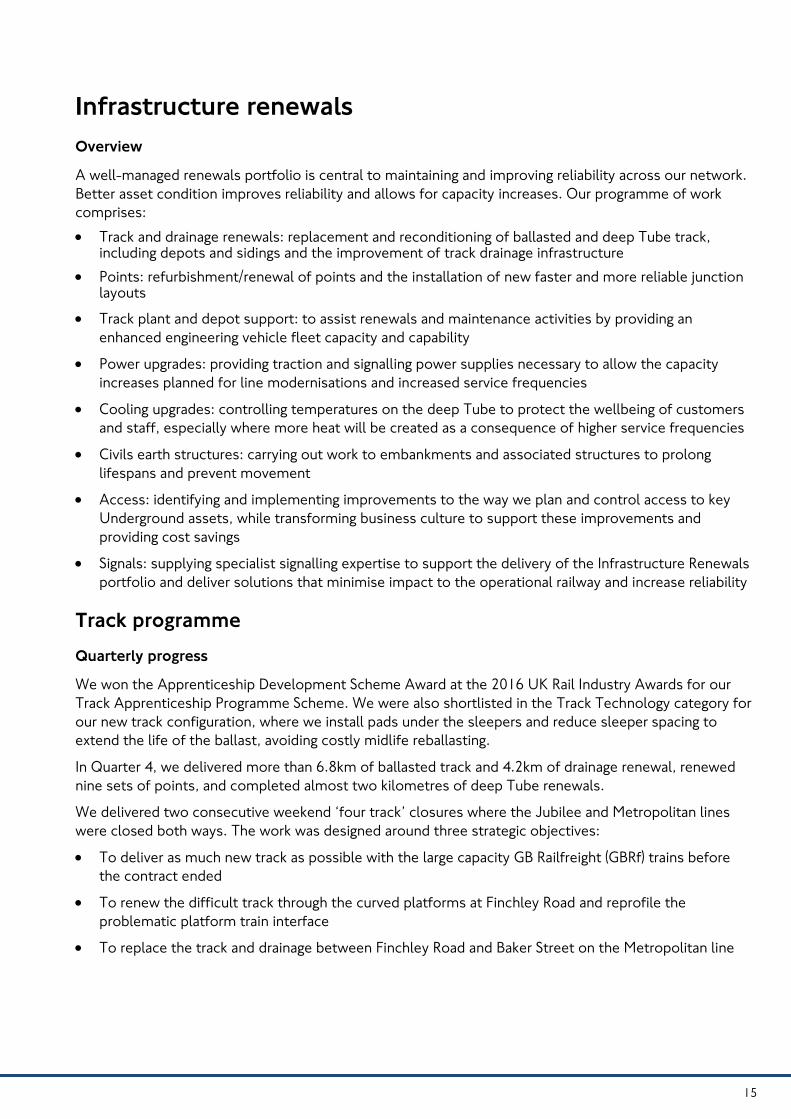
Infrastructure renewals Overview
A well-managed renewals portfolio is central to maintaining and improving reliability across our network. Better asset condition improves reliability and allows for capacity increases. Our programme of work comprises: • Track and drainage renewals: replacement and reconditioning of ballasted and deep Tube track,
including depots and sidings and the improvement of track drainage infrastructure• Points: refurbishment/renewal of points and the installation of new faster and more reliable junction
layouts
• Track plant and depot support: to assist renewals and maintenance activities by providing anenhanced engineering vehicle fleet capacity and capability
• Power upgrades: providing traction and signalling power supplies necessary to allow the capacityincreases planned for line modernisations and increased service frequencies
• Cooling upgrades: controlling temperatures on the deep Tube to protect the wellbeing of customersand staff, especially where more heat will be created as a consequence of higher service frequencies
• Civils earth structures: carrying out work to embankments and associated structures to prolonglifespans and prevent movement
• Access: identifying and implementing improvements to the way we plan and control access to keyUnderground assets, while transforming business culture to support these improvements andproviding cost savings
• Signals: supplying specialist signalling expertise to support the delivery of the Infrastructure Renewalsportfolio and deliver solutions that minimise impact to the operational railway and increase reliability
Track programme
Quarterly progress
We won the Apprenticeship Development Scheme Award at the 2016 UK Rail Industry Awards for our Track Apprenticeship Programme Scheme. We were also shortlisted in the Track Technology category for our new track configuration, where we install pads under the sleepers and reduce sleeper spacing to extend the life of the ballast, avoiding costly midlife reballasting.
In Quarter 4, we delivered more than 6.8km of ballasted track and 4.2km of drainage renewal, renewed nine sets of points, and completed almost two kilometres of deep Tube renewals.
We delivered two consecutive weekend ‘four track’ closures where the Jubilee and Metropolitan lines were closed both ways. The work was designed around three strategic objectives:
• To deliver as much new track as possible with the large capacity GB Railfreight (GBRf) trains beforethe contract ended
• To renew the difficult track through the curved platforms at Finchley Road and reprofile theproblematic platform train interface
• To replace the track and drainage between Finchley Road and Baker Street on the Metropolitan line
15
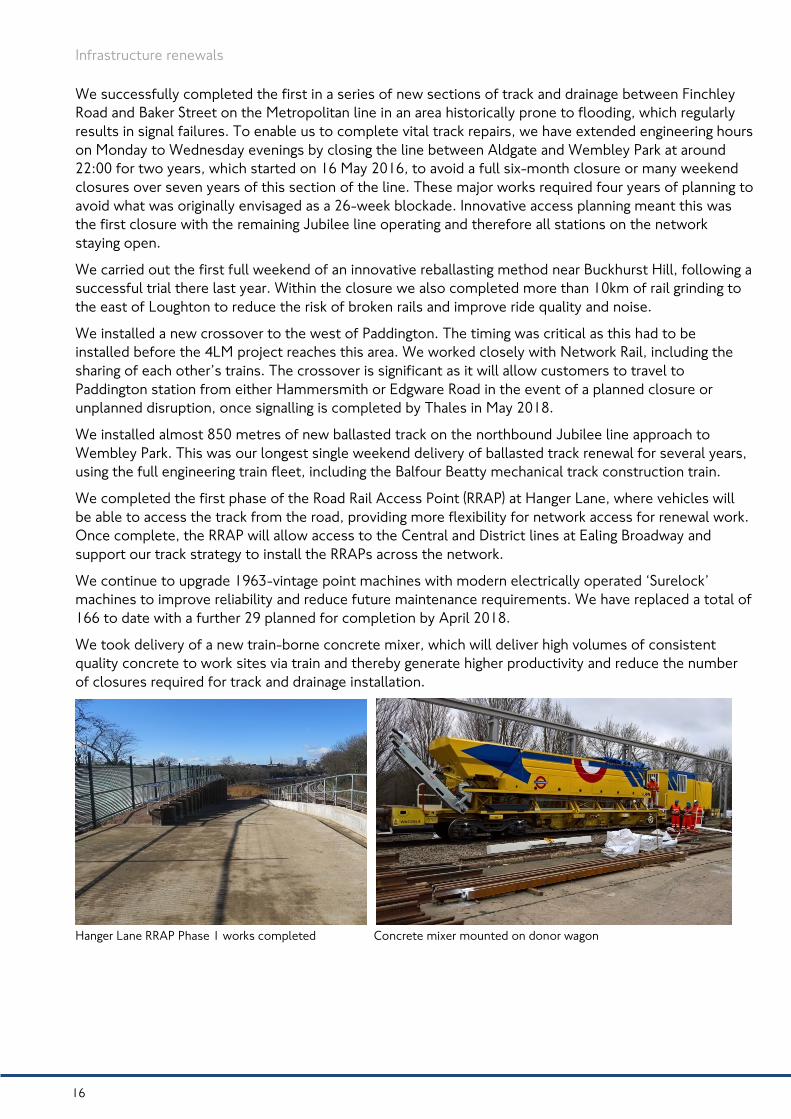
Infrastructure renewals
We successfully completed the first in a series of new sections of track and drainage between Finchley Road and Baker Street on the Metropolitan line in an area historically prone to flooding, which regularly results in signal failures. To enable us to complete vital track repairs, we have extended engineering hours on Monday to Wednesday evenings by closing the line between Aldgate and Wembley Park at around 22:00 for two years, which started on 16 May 2016, to avoid a full six-month closure or many weekend closures over seven years of this section of the line. These major works required four years of planning to avoid what was originally envisaged as a 26-week blockade. Innovative access planning meant this was the first closure with the remaining Jubilee line operating and therefore all stations on the network staying open.
We carried out the first full weekend of an innovative reballasting method near Buckhurst Hill, following a successful trial there last year. Within the closure we also completed more than 10km of rail grinding to the east of Loughton to reduce the risk of broken rails and improve ride quality and noise.
We installed a new crossover to the west of Paddington. The timing was critical as this had to be installed before the 4LM project reaches this area. We worked closely with Network Rail, including the sharing of each other’s trains. The crossover is significant as it will allow customers to travel to Paddington station from either Hammersmith or Edgware Road in the event of a planned closure or unplanned disruption, once signalling is completed by Thales in May 2018.
We installed almost 850 metres of new ballasted track on the northbound Jubilee line approach to Wembley Park. This was our longest single weekend delivery of ballasted track renewal for several years, using the full engineering train fleet, including the Balfour Beatty mechanical track construction train.
We completed the first phase of the Road Rail Access Point (RRAP) at Hanger Lane, where vehicles will be able to access the track from the road, providing more flexibility for network access for renewal work. Once complete, the RRAP will allow access to the Central and District lines at Ealing Broadway and support our track strategy to install the RRAPs across the network.
We continue to upgrade 1963-vintage point machines with modern electrically operated ‘Surelock’ machines to improve reliability and reduce future maintenance requirements. We have replaced a total of 166 to date with a further 29 planned for completion by April 2018.
We took delivery of a new train-borne concrete mixer, which will deliver high volumes of consistent quality concrete to work sites via train and thereby generate higher productivity and reduce the number of closures required for track and drainage installation.
Hanger Lane RRAP Phase 1 works completed Concrete mixer mounted on donor wagon
16

Infrastructure renewals
Programme milestones forecast
Milestone Current plandate
Actual/ forecast
date RAG Commentary
Forecast change from
Q3 (days) Ballasted track renewal and reballast – achieve 13,760 metres
08-Jan-16 08-Jan-16 Complete -
Achieve 'consent to operate' for first of two new tamping machines
03-Mar-16 21-Mar-16 Complete
Restricted access to the network, due to engineering prioritisation, caused delays to works for signal sighting and final commissioning of tampers.
-45
Renew points and crossings units – achieve 35 units
31-Mar-16 20-Feb-16 Complete 40
Ballasted track renewal and reballast – achieve 19,500 metres
31-Mar-16 07-Mar-16 Complete 24
Track drainage renewal – achieve 6,000 metres
31-Mar-16 27-Feb-16 Complete 33
Deep Tube renewal – achieve 6,012 metres
31-Mar-16 31-Mar-16 Complete -
Upminster sidings project works – finish on site
31-Mar-16 31-Mar-16 Complete -
Neasden depot project works – finish on site
31-Mar-16 26-Mar-16 Complete 5
Cumulative 16 per cent of track replaced on Sub-Surface and Bakerloo, Central and Victoria (BCV) lines (Annex B: 2016)
31-Dec-16 25-May-16
This milestone has been set as a DfT milestone in the ‘Spending Review 2015: 2016/17-2020/21 funding agreement’ letter received from the DfT in March 2016 with a revised plan date.
-54
Programme financial forecast Annual In year
Spend to end Quarter 4, 2015/16 £m
Estimated Final Cost (EFC) £m
Authority £m
Variance to authority
£m/%
EFC movement in quarter £m/%
Year-end actual £m
Year budget
£m
Variance to budget £m/%
251.4 251.4 229.8 -21.6 -9.4% 3.4 1.3% 251.4 229.8 -21.6 -9.4%
The current year EFC increase is due to the new three-year Track authority which was approved after the budget was set and the workbank has been reprofiled. The workbank EFC is in line with authority.
17

Infrastructure renewals
4LM Major Power Works (Traction) This programme provides the traction and signalling power supply upgrades to allow capacity and service frequency increases on the Sub-Surface network.
On the west end of the District line, we switched on the new transformer at Putney Bridge and the substation at Chiswick Park. At Shepherd’s Bush substation, we commissioned the new traction supply voltage board. We also completed the detailed design for the new Cromwell Curve substation.
On the east end of the District line, we energised new 22kV feeders to Plaistow and completed concept designs for the substation ventilation. We installed and pre-commissioned a new high voltage board at East Ham substation and completed commissioning of the new track paralleling hut at Southfields, which maintains traction voltage levels between substations.
We completed the installation of the new 132kV road route supply from Hendon grid station to the Neasden bulk supply point.
Major power work for the 4LM signalling upgrade progressed to schedule: we started work on site for the Neasden bulk supply point and substations for Blackfriars, North Ealing and Upminster depot. We handed over the Stepney Green transformer room to maintenance and the contract is underway for the third package of transformer rooms.
We are holding clarification meetings with the 4LM high voltage network power quality equipment tenderers.
The track paralleling hut at Southfields
Programme milestones forecast
Milestone Current plan date
Actual/ forecast
date RAG Commentary
Forecast change from
Q3 (days) Package 3B Putney Bridge first transformer rectifier ready to energise
12-Feb-16 12-Feb-16 Complete -18
Package 3B Chiswick Park substation ready to energise
17-Feb-16 17-Feb-16 Complete -28
Package 5A enabling works complete (first cable route)
18-Feb-16 18-Feb-16 Complete -
Package 5A all cable route surveys complete
07-Mar-16 07-Mar-16 Complete -
18
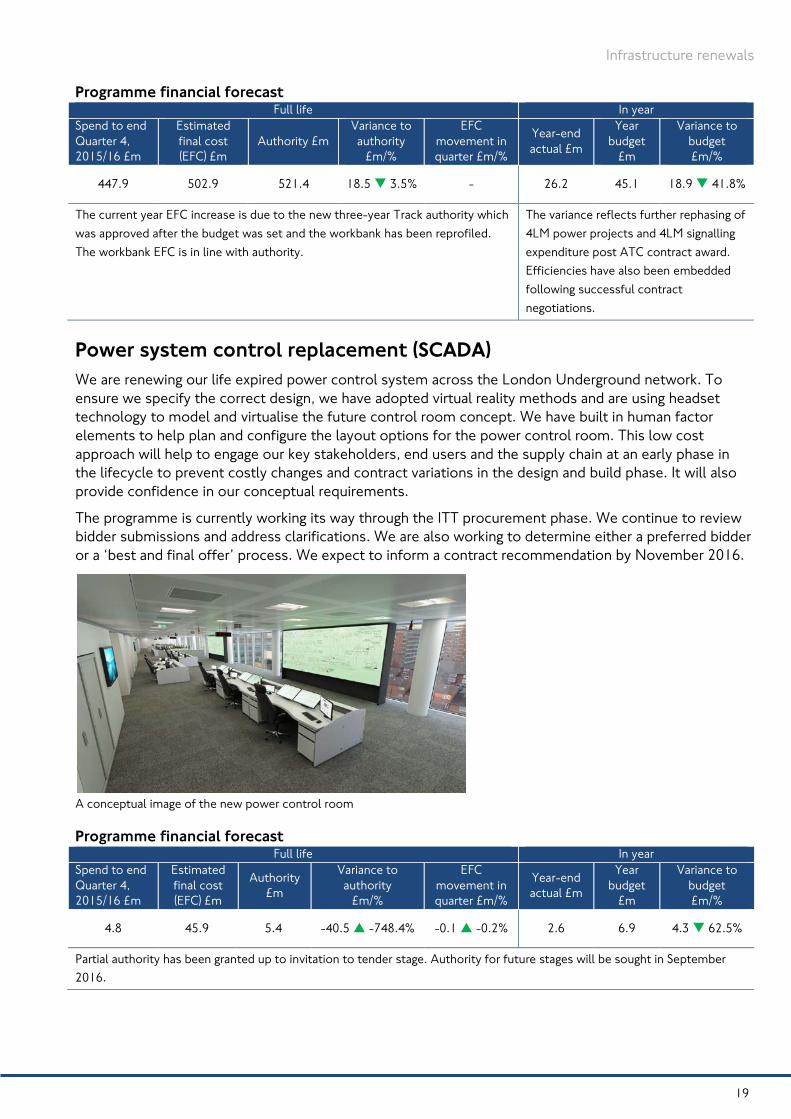
Infrastructure renewals
Programme financial forecast Full life In year
Spend to end Quarter 4, 2015/16 £m
Estimated final cost (EFC) £m
Authority £m Variance to authority
£m/%
EFC movement in quarter £m/%
Year-end actual £m
Year budget
£m
Variance to budget £m/%
447.9 502.9 521.4 18.5 3.5% - 26.2 45.1 18.9 41.8%
The current year EFC increase is due to the new three-year Track authority which was approved after the budget was set and the workbank has been reprofiled. The workbank EFC is in line with authority.
The variance reflects further rephasing of 4LM power projects and 4LM signalling expenditure post ATC contract award. Efficiencies have also been embedded following successful contract negotiations.
Power system control replacement (SCADA) We are renewing our life expired power control system across the London Underground network. To ensure we specify the correct design, we have adopted virtual reality methods and are using headset technology to model and virtualise the future control room concept. We have built in human factor elements to help plan and configure the layout options for the power control room. This low cost approach will help to engage our key stakeholders, end users and the supply chain at an early phase in the lifecycle to prevent costly changes and contract variations in the design and build phase. It will also provide confidence in our conceptual requirements.
The programme is currently working its way through the ITT procurement phase. We continue to review bidder submissions and address clarifications. We are also working to determine either a preferred bidder or a ‘best and final offer’ process. We expect to inform a contract recommendation by November 2016.
A conceptual image of the new power control room
Programme financial forecast Full life In year
Spend to end Quarter 4, 2015/16 £m
Estimated final cost (EFC) £m
Authority £m
Variance to authority
£m/%
EFC movement in quarter £m/%
Year-end actual £m
Year budget
£m
Variance to budget £m/%
4.8 45.9 5.4 -40.5 -748.4% -0.1 -0.2% 2.6 6.9 4.3 62.5%
Partial authority has been granted up to invitation to tender stage. Authority for future stages will be sought in September 2016.
19

Legacy train systems Overview
The programme’s objective is to extend the life of trains to keep them in service until New Tube for London delivers new trains. The programme will deliver a range of refurbishments on the Bakerloo 1972 Tube Stock, battery locomotives (engineering trains), Central line 1992 Tube Stock, installation of inter-car canopy barriers on the Waterloo & City line fleet, and improvements to track monitoring through the installation of an automatic track monitoring system on LU fleets.
Quarterly progress
We completed 750-volt upgrades on 23 out of 28 existing battery locomotives and life extension works on 15, all of which are on or ahead of schedule. We are continuing life extension work on the Bakerloo 1972 Tube Stock and the fourth train, of a planned eight trains per year, is ahead of schedule.
We are creating a programme to deliver a number of significant improvements to the Central line fleet. This includes replacement of the train management system to improve fleet maintenance management. We will also upgrade the traction system. The tenders were returned post quarter end on 8 April 2016 and we expect to award the contract by the end of 2016.
Saloon of a refurbished 72TS carriage
Programme milestones forecast
Milestone Current plan date
Actual/ forecast date RAG Commentary
Forecast change
from Q3 (days)
Complete life extension work for 16th battery loco
24-Feb-16 25-Jan-16 Complete 2
Complete life extension work for 17th battery loco
28-Jun-16 07-Jun-16 21
Battery locos engineering vehicles available for service upgraded for 750v traction supply
28-Nov-16 28-Oct-16 -
Finish on site – 28 battery locomotives
18-Apr-19 02-Apr-19 -6
20
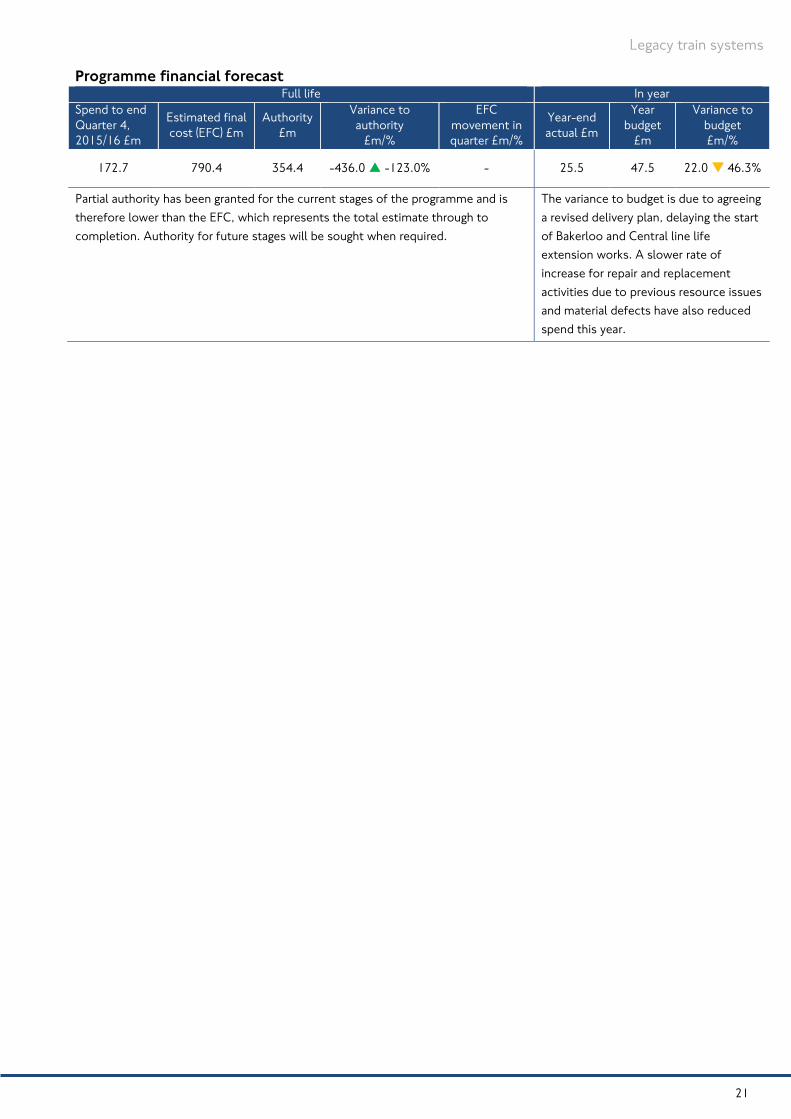
Legacy train systems
Programme financial forecast Full life In year
Spend to end Quarter 4, 2015/16 £m
Estimated final cost (EFC) £m
Authority £m
Variance to authority
£m/%
EFC movement in quarter £m/%
Year-end actual £m
Year budget
£m
Variance to budget £m/%
172.7 790.4 354.4 -436.0 -123.0% - 25.5 47.5 22.0 46.3%
Partial authority has been granted for the current stages of the programme and is therefore lower than the EFC, which represents the total estimate through to completion. Authority for future stages will be sought when required.
The variance to budget is due to agreeing a revised delivery plan, delaying the start of Bakerloo and Central line life extension works. A slower rate of increase for repair and replacement activities due to previous resource issues and material defects have also reduced spend this year.
21

Northern line extension Overview
The primary aim of the Northern line extension (NLE) is to support economic growth in London and the wider UK economy by facilitating the sustainable regeneration of the Vauxhall Nine Elms Battersea (VNEB) Opportunity Area. This includes the creation of a major new residential, business and leisure district in London’s Central Activities Zone (CAZ). The London Plan (2011) defines the CAZ policy area as the City of London, most of Westminster and the inner parts of Camden, Islington, Hackney, Tower Hamlets, Southwark, Lambeth and Kensington and Chelsea.
The London Plan designates VNEB as an Opportunity Area with the potential to create more than 20,000 new homes and more than treble the number of jobs, totalling 25,000. This level of development cannot occur sustainably without the appropriate transport infrastructure. The NLE will achieve this primary aim by providing a twin-tunnelled extension from Kennington to a terminus station at Battersea Power Station, via an intermediate station at Nine Elms. The NLE will help to relieve existing congestion at Vauxhall station, and provide relief to the Northern line south of Kennington and to the Victoria line. Journey times from Battersea Power Station to the West End or the City will, in some cases, be less than 15 minutes.
The project will provide the infrastructure works, signalling, power supply, communications and control systems to support a regular service on this new section of the Northern line. We are working to achieve these key deliverables and target completion is in 2020.
Quarterly progress
Since September 2015, the Battersea muck-away conveyor has moved 50,000 tonnes of spoil from excavations at the Battersea Power Station and from the Nine Elms stations on to river barges for removal to a land reclamation site to the east of Tilbury. So far, more than 5,500 lorry movements have been avoided and the barges have also reduced the NLE carbon footprint by 74 tonnes of carbon dioxide (CO2).
We have completed the diaphragm wall construction at the Battersea Power Station crossover box. Once the bearing piles are installed, we will start excavation of the crossover box within the vast retaining walls. The launch of the tunnel boring machines (TBMs) is dependent on this activity as boring will start from the crossover box.
The two TBMs have been manufactured in France, accepted by LU and our contractor Ferrovial Agroman Laing O'Rourke (FLO) joint venture, and are being dismantled for shipment to the Battersea Power Station site.
The design of the main Battersea station has progressed and, as part of the technical approval process, we received and are reviewing the compliance submission for the primary structure. The London Borough of Wandsworth approved an application for outline planning permission for the redesigned eastern station entrance on 8 March 2016.
At the Nine Elms station construction site, we continue piling activities for the retaining walls which, when excavated, will create the void for the new station box. We installed the first of 30 plunge columns – 15-metre-long steel girders that are concreted into deep holes with extreme precision – that will support the new structure.
22

Northern line extension
We will construct the station platforms at the base of the box, linked to the surface by lifts and escalators. There will be three underground levels in the station for use by the public, staff, and for equipment. Above the station, we plan a major development of four buildings that will include residential units, offices and shops. The London Borough of Lambeth approved a detailed consent planning application for this development on 8 March 2016.
In support of Talent Match’s week of events with our suppliers, we hosted nine young people at the Battersea Power Station site where they learnt about various project processes. Talent Match is a youth-led approach supporting long-term unemployed young people by helping them to find and stay in work. We took part in Lambeth Academy’s first ever careers fair for students of all ages from Lambeth Academy and other schools. We are also visiting local schools as part of our school engagement programme to provide information to local children about these construction works in their community.
The muck-away conveyor Installation of the first plunge column at Nine Elms site
Programme milestones forecast
Milestone Currentplan date
Actual/ forecast
date RAG Commentary
Forecast change
from Q3 (days)
Kennington completion of loop and platform early enabling works
18-Jan-16 18-Jan-16 Complete -9
First tunnel boring machine (TBM) final factory acceptance test (FAT) approved to allow TBM to be delivered
28-Mar-16 26-Feb-16 Complete -7
23

Northern line extension
Milestone Current plan date
Actual/ forecast
date RAG Commentary
Forecast change
from Q3 (days)
Battersea crossover box retaining walls, piles and plunged columns all complete
02-Jul-16 29-Apr-16
Battersea station box initial civils design issued for construction
19-Jul-16 27-May-16
Spray concrete lining and excavation to bottom of shaft complete
04-Aug-16 07-Jul-16
Nine Elms phase two capping beam start
30-Sep-16 16-Jun-16
Northbound tunneling headwall No 1 completion
12-Jan-17 23-Nov-16
Battersea station box retaining walls, piles and plunged columns all complete
20-Mar-17 07-Feb-17
Significantly late milestones
Milestone description Current plan date
Variance to budget
(days) Variance commentary
Battersea commence excavation works (crossover box)
14-Mar-16 -95 Battersea Power Station Development Company (BPSDC) over station development (OSD) design changes delayed finalisation of the station box design. This has delayed the design and construction activities. The project will continue to work with BPSDC to mitigate the slippage.
Handover of crossover box for commencement of tunnelling launch chambers
30-Mar-16 -106
Northern line extension completion 31-Dec-20 -169
Programme financial forecast Full life In year
Spend to end Quarter 4, 2015/16 £m
Estimated final cost (EFC) £m
Authority £m
Variance to authority
£m/%
EFC movement in quarter £m/%
Year-end actual £m
Year budget
£m
Variance to budget £m/%
* * * * * * * *
Marked * where there is commercial confidentiality.
24

World Class Capacity Overview
The World Class Capacity programme will provide additional capacity beyond that delivered by the first phase of upgrades on the Northern, Victoria and Jubilee lines. There are also relatively minor works outstanding to complete the original scope for the Northern line upgrade. Reliability and performance on the Jubilee and Northern line is excellent, with both lines consistently performing better than target. Once complete, redundant assets will be decommissioned and removed. The assets to be decommissioned include lineside signals, train-stops and associated cabling and control centre assets.
The second phase of upgrades are at differing stages of maturity, with the Victoria line Upgrade 2 in implementation, Jubilee line Upgrade 2 in design and the Northern line Upgrade 2 feasibility stage concluded and progressing to the design phase. We are planning capacity improvements across three lines, which will increase the Victoria line peak service from a current level of 34 trains per hour (tph) up to 36tph by spring 2017. The Jubilee line capacity will increase from a current peak service level of 30tph up to 36tph by mid 2019, and capacity on the Northern line (central branches) will further increase to 30tph by mid 2023.
Capacity I modernisations
Quarterly progress
The Northern line upgrade works were substantially completed at the end of March 2016. The final Northern line software upgrade (3.17) has been achieved in part but the majority has been postponed to 2017, where it is planned for delivery alongside Working Timetable 58 on 30 August 2017.
The Jubilee line midlife refurbishment scope is being increased to address water ingress, but will be delivered within the existing budget through use of a joint LU fleet maintenance and supplier team. We are now working towards putting contracts in place to start work at the end of September 2016.
Enabling works, which are underway on site at Stratford Market depot for the train fit-out building, are expected to complete mid May 2016.
Programme milestones forecast
Milestone Current plan date
Actual/ forecast
date RAG Commentary
Forecast change
from Q3 (days)
Northern line software commissioning 3.16
28-Sept-15 13-Feb-16 Complete
This was initially impacted by the prioritisation of Night Tube with further delays due to inclement weather.
-13
25

World Class Capacity
Significant quarterly milestones movement
Milestone description Current plan date
Q4 forecast
date RAG Movement commentary
Forecast change
from Q3 (days)
Award ‘key’ contracts for Jubilee line rolling stock midlife fit-out
26-Jul-15 30-Jun-16
Initial procurement delays have lead to cost and scope changes. Tender clarifications have also been required on key points. The revised forecast date allows time for the invited suppliers to submit responses, which we will review.
-123
Northern line software commissioning 3.17
25-Apr-16 30-Aug-17
The initial delay was caused by a knock-on impact of software commissioning 3.16. Further delays, caused by rescoping, access and safety issues, have resulted in the majority of activities being postponed to August 2017 where it will be implemented alongside Working Timetable 58.
-546
Commencement of Jubilee line midlife fit-out
30-Nov-16 30-Oct-16
This milestone was delayed while an alternative delivery strategy was developed to allow existing scope and the additional water ingress work to be completed within the existing budget. The contract award will now take place in June 2016 and commencement of the fit-out will follow in October 2016.
-122
Complete Jubilee line fit-out of first train
31-Mar-17 09-Feb-17
In light of a reassessment based on previous experience of the fit-out, assurance and acceptance process on the equivalent Northern line project, the duration of works on train one is now estimated to be 80 days. The milestone continues to be forecast ahead of the current plan date.
-132
Significantly late milestones
Milestone description Current plan date
Variance to budget (days)
Variance commentary
Award ‘key’ contracts for Jubilee line rolling stock midlife fit-out
26-Jul-15 -340 As above.
Northern line software commissioning 3.17
25-Apr-16 -492 As above.
Programme financial forecast Full life In year
Spend to end Quarter 4, 2015/16 £m
Estimated final cost (EFC) £m
Authority £m
Variance to authority
£m/%
EFC movement in quarter £m/%
Year-end actual
£m
Year budget
£m
Variance to budget £m/%
1,239.7 1,279.3 1,639.1 359.8 21.9% 43.9 3.3% 18.2 4.0 -14.2 -356.3%
Through collaborative working, savings were made resulting in the contractor delivering below the target price. The authority and EFC reductions in Quarter 4 reflect scope transfer within capital programmes.
The variance to budget reflects additional costs that have arisen in prior quarters in the close-out process of the Jubilee and Northern line upgrade programme.
26

World Class Capacity
Capacity II modernisations
Quarterly progress
We completed a strategic review of scope, cost, implementation strategy and risk on the Victoria line Upgrade 2, which has resulted in a revised delivery approach with a reduced scope and that will provide a more robust 36tph service in spring 2017. Siemens is working on a proposal and price that supports this. The revised approach was approved by senior management in April 2016.
The Jubilee line Upgrade 2 (JLU2) and Northern line Upgrade 2 authority submissions were approved by the Board on 17 March 2016. The JLU2 funding approval was based on a 10 per cent EFC reduction, which we identified through a series of scope and cost reviews, and the new authority of £69m reflects this.
A Northern line train in service
Programme milestones forecast
Milestone Currentplan date
Actual/ forecast
date RAG Commentary
Forecast change
from Q3 (days)
Jubilee line – all concept design complete
28-Feb-16 31-Jan-16 Complete -
Significant quarterly milestones movement
Milestone description Current plan date
Q4 forecast
date RAG Movement commentary
Forecast change
from Q3 (days)
Victoria line Upgrade 2 (VLU2) – completion of signalling works required to support 36tph for the 90 minute peak
25-Apr-17 25-Apr-17
The new NEC3 contract will better protect TfL from risk and will be more suited to capital works projects once agreed. Delays from the Quarter 3 forecast date are due to a lengthy rebid process following change to contract, which have considerably impacted the signalling works. The milestone continues to be forecast on the current plan date.
-133
27

World Class Capacity
Programme financial forecast Full life In year
Spend to end Quarter 4, 2015/16 £m
Estimated final cost (EFC) £m
Authority £m
Variance to authority
£m/%
EFC movement in quarter £m/%
Year-end actual
£m
Year budget
£m
Variance to budget £m/%
27.7 1,001.2 155.0 -846.2 -545.9% -7.5 -0.7% 20.1 38.7 18.7 48.2%
Partial authority has been granted for the current stages of the programme and is therefore lower than the EFC, which represents the total estimate through to completion. Authority for future stages will be sought when required.
The variance to budget is a result of rephasing of the Victoria line Upgrade 2 programme due to delays during contract negotiations with the signalling contractor, which are now complete.
28

New Tube for London (NTfL) Overview
As a coordinated series of modernisation schemes for the Piccadilly, Bakerloo, Central and Waterloo & City lines, the NTfL programme will form the next generation of line modernisations. The programme provides an opportunity to capitalise on the need to renew life-expired assets and to deliver long-term business transformation through the introduction of more efficient maintenance models and higher levels of automation. This technology-enabled change will improve the customer experience and will result in a Piccadilly line capacity increase of 60 per cent (space for up to an additional 19,000 customers per hour).
Quarterly progress
We released the invitation to negotiate for the design and build of the NTfL trains on 18 January 2016 to the five pre-qualified manufacturers – Alstom, Bombardier, CAF, Hitachi and Siemens. Tenders are due for return in July 2016.
The Board approved funding for the scope for the next two financial years. We have developed a detailed two-year baseline to measure the performance of this work and to derive an efficiencies plan. We also developed an interim baseline for the engineering, procurement and construction phase of the programme, which reflects the current programme maturity. Following approval of the NTfL signalling and train control procurement strategy, we released the signalling pre-qualification questionnaire in March 2016.
New Tube for London will introduce new state-of-the-art trains
Programme milestones forecast
Milestone Current plan date
Actual/ forecast
date RAG Commentary
Forecast change
from Q3 (days)
Issue ITT for NTfL rolling stock (Annex B: 2015)
29-Dec-15 18-Jan-16 Complete -
29

New Tube for London
Programme financial forecast Full life In year
Spend to end Quarter 4, 2015/16 £m
Estimated final cost (EFC) £m
Authority £m
Variance to authority
£m/%
EFC movement in quarter
£m/%
Year-end actual £m
Year budget
£m
Variance to budget £m/%
48.1 55.7 154.1 98.4 63.9% 0.8 1.4% 14.2 18.1 3.9 21.5%
On 17 March 2016, additional authority of £95m was approved by the Board to start the procurement of new rolling stock and signalling systems for the Piccadilly line modernisation, to deliver enabling works, and continue design development for the Bakerloo, Central and Waterloo & City line upgrades. An EFC transfer will be enacted in Quarter 1 to reflect the authority uplift.
30

Stations, Crossrail and third party Overview
Stations are the gateway to our network. For them to perform effectively they need to cope with the millions of customers who use them every day. As we increase the capacity on the network and run more trains, our key stations must be rebuilt to meet and cope with the increased customer demand. We continue to meet the challenge of keeping stations open and operating safely and effectively while we rebuild them. A programme of station capacity upgrades is central to London Underground’s strategy to meet rising demand and changing customer needs, to ensure that congestion does not rise significantly.
As well as increasing capacity, we also need to ensure our station assets are maintained. The Integrated Stations Programme (ISP) will implement a range of improvements to ensure stations remain safe, maintainable and operable. ISP will also deliver improvements to the condition of customer facing areas (including walls, ceilings and floors). In conjunction with current and potential third party funding, we have developed a strategy for a partnership step-free access programme at approximately 12 additional stations during the next 10 years, where this is not being delivered by other programmes.
Vauxhall station upgrade
Quarterly progress
On 12 February 2016, we opened the newly replaced lift that links the bus station and the Underground station ticket hall. The premises works associated with the new step-free access lift to platform level are continuing and site works are expected to complete in late summer 2016.
Programme milestones forecast
Milestone Current plan date
Actual/ forecast
date RAG Commentary
Forecast change
from Q3 (days)
Bring into use – bus station lift
31-Mar-16 12-Feb-16 Complete -23
31

Stations, Crossrail and third party
Significant quarterly milestones movement
Milestone description Current plan date
Q4 forecast
date RAG Movement commentary
Forecast change
from Q3 (days)
Vauxhall station capacity and step-free access (SFA) – bring into use (lift and stairs)
08-Jan-16 23-May-16
Completion of the step-free and congestion relief scheme has been delayed until late summer 2016 due to ongoing quality issues with some of the blockwork in the vicinity of the SFA lift lobbies and with the rendering to the cross passages. We have committed more LU resources to support the contractor in delivering the final elements of the scheme. The newly replaced lift linking the bus station and the Underground station ticket hall was successfully opened on 12 February 2016 and the premises works associated with the new SFA lift to platform level are continuing.
-68
Vauxhall station capacity and SFA – completion of all site works (including snagging)
11-Mar-16 23-May-16 -68
Vauxhall mandatory asset information deliverable (MAID) accepted by LU
25-Jan-16 27-Jul-16
Completion of MAID documentation has been delayed until early summer 2016, while we focus on delivery of the physical project works.
-75
Significantly late milestones Milestone description Current plan
date Variance to
budget (days) Variance commentary
Vauxhall station capacity and step-free access bring into use (lift and stairs)
08-Jan-16 -136 As previous.
Vauxhall MAID accepted by LU 25-Jan-16 -184 As previous.
Programme financial forecast Full life In year
Spend to end Quarter 4, 2015/16 £m
Estimated final cost (EFC) £m
Authority £m
Variance to authority
£m/%
EFC movement in quarter £m/%
Year-end actual £m
Year budget
£m
Variance to budget £m/%
26.1 30.2 35.1 4.9 13.9% 0.4 1.2% 5.5 10.8 5.3 49.3%
The EFC is below authority and reflects savings on the primary tunnel lining works risk provision and legal fees for party wall requirements.
The variance to budget reflects the contractor's revised programme.
Tottenham Court Road station upgrade
Quarterly progress
Waterproofing is progressing well within both the LU and the Crossrail stations. We completed preparations for the removal of Sir Eduardo Paolozzi’s Church Window mosaic from the former entrance for relocation to the new Central line interchange passageway.
The project was shortlisted in the infrastructure category of the Royal Institution of Chartered Surveyors (RICS) Awards 2016 and the judging panel has visited the site.
32

Stations, Crossrail and third party
Sir Eduardo Paolozzi’s mosaic
Significant quarterly milestones movement
Milestone description Current plan date
Q4 forecast date RAG Movement commentary
Forecast change
from Q3 (days)
New passenger facilities open including new entrances to the station and new ticket hall (Annex B: 2016)
20-Nov-16 15-Sep-16
The positive forecast date movement reflects the contractor’s revised programme to completion.
67
Programme financial forecast Full life In year
Spend to end Quarter 4, 2015/16 £m
Estimated final cost (EFC) £m
Authority £m
Variance to authority
£m/%
EFC movement in quarter £m/%
Year-end actual
£m
Year budget
£m
Variance to budget £m/%
452.3 487.2 538.0 50.8 9.4% -0.1 0.0% 49.6 41.2 -8.4 -20.5%
Efficiency savings have resulted in an EFC that is lower than authority. The variance to budget reflects the contractor's revised programme.
Bond Street station upgrade
Quarterly progress
We completed the secondary spray concrete lining and started the blockwork in the northern tunnels. We started fit-out of the southern tunnels and this is progressing to schedule.
The construction of the new escalator shaft to the Jubilee line is nearing completion and escalator installation started post quarter end at the end of April 2016.
33

Stations, Crossrail and third party
The new escalator shaft
Programme milestones forecast
Milestone Current plan date
Actual/ forecast
date RAG Commentary
Forecast change
from Q3 (days)
Start escalator 9 and 10 installation
21-Jun-16 31-May-16 The plan date has been revised to reflect agreed changes to the installation sequence and schedule.
-18
Tunnelling set up decommissioned
18-Jul-16 24-May-16 9
Over station development frame handover to developer
28-Apr-17 11-Apr-17 -12
Bond Street station upgrade complete including a new station entrance and step-free access to all platforms (Annex B: 2017)
28-Apr-17 11-Apr-17 -12
Programme financial forecast Full life In year
Spend to end Quarter 4, 2015/16 £m
Estimated final cost (EFC) £m
Authority £m
Variance to authority
£m/%
EFC movement in quarter £m/%
Year-end actual £m
Year budget
£m
Variance to budget £m/%
269.5 307.5 307.6 0.1 0.0% 0.3 0.1% 41.9 36.4 -5.5 -15.2%
The EFC is in line with authority. The variance to budget is due to tunnel and Baker Street to Bond Street works brought forward to realign with the latest programme schedule.
34
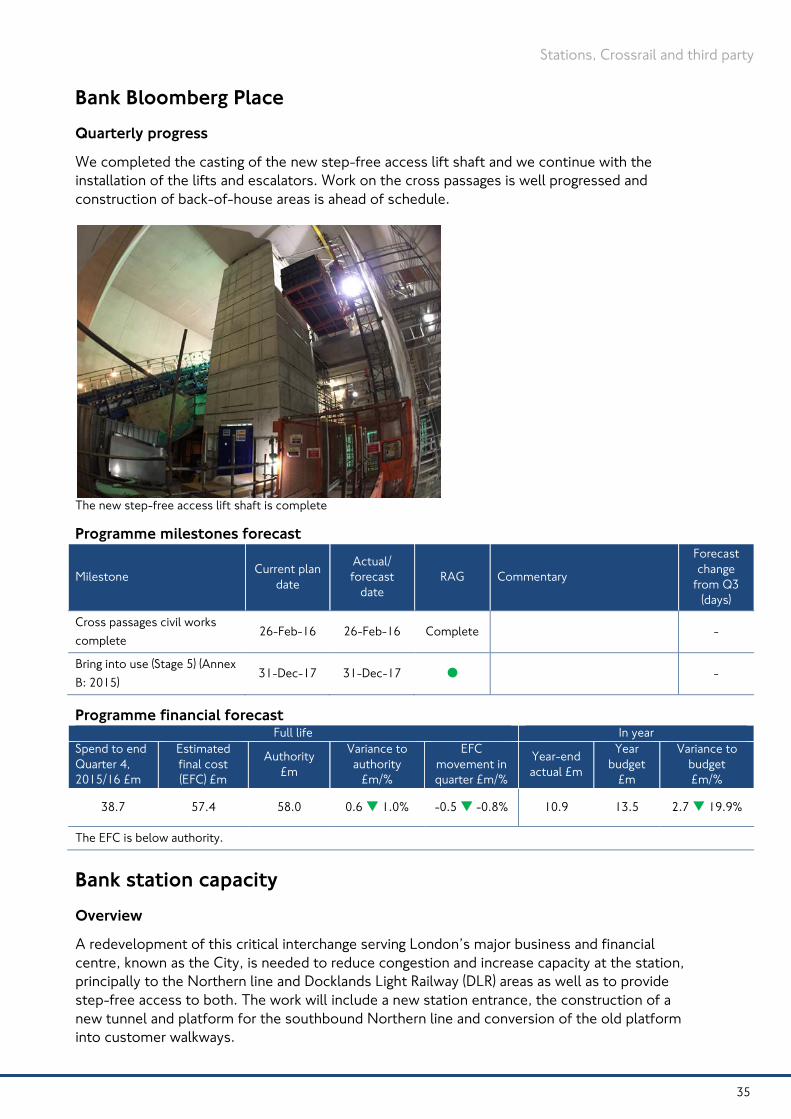
Stations, Crossrail and third party
Bank Bloomberg Place
Quarterly progress
We completed the casting of the new step-free access lift shaft and we continue with the installation of the lifts and escalators. Work on the cross passages is well progressed and construction of back-of-house areas is ahead of schedule.
The new step-free access lift shaft is complete
Programme milestones forecast
Milestone Current plan date
Actual/ forecast
date RAG Commentary
Forecast change
from Q3 (days)
Cross passages civil works complete
26-Feb-16 26-Feb-16 Complete -
Bring into use (Stage 5) (Annex B: 2015)
31-Dec-17 31-Dec-17 -
Programme financial forecast Full life In year
Spend to end Quarter 4, 2015/16 £m
Estimated final cost (EFC) £m
Authority £m
Variance to authority
£m/%
EFC movement in quarter £m/%
Year-end actual £m
Year budget
£m
Variance to budget £m/%
38.7 57.4 58.0 0.6 1.0% -0.5 -0.8% 10.9 13.5 2.7 19.9%
The EFC is below authority.
Bank station capacity
Overview
A redevelopment of this critical interchange serving London’s major business and financial centre, known as the City, is needed to reduce congestion and increase capacity at the station, principally to the Northern line and Docklands Light Railway (DLR) areas as well as to provide step-free access to both. The work will include a new station entrance, the construction of a new tunnel and platform for the southbound Northern line and conversion of the old platform into customer walkways.
35

Stations, Crossrail and third party
Quarterly progress
Funding for the delivery of the second and final stage of the project was approved by the Board on 17 March 2016. We took possession of all the buildings on the ‘whole block site’ and started early isolation and strip-out works prior to main demolition. (Post quarter end we commenced demolition works). The design is nearing completion (targeted for mid June 2016) and utility diversion works are progressing well. We are preparing to start main construction works in Quarter 1.
We hosted an information drop-in session for key stakeholders from the surrounding businesses and local authority, TfL staff and customers. The session provided opportunity for internal and external stakeholders to learn more about the project and ask questions directly of the project team. Feedback from those who attended was positive.
Reviewing the Bank station project plans
Programme milestones forecast
Milestone Current plan date
Actual/ forecast
date RAG Commentary
Forecast change
from Q1 (Days
Transport and Works Act Order grant of powers
15-Jun-16 12-Jan-16 Complete -1
Completion of all designs to compliance to Category 1 Standard for Design Assurance
31-Mar-16 14-Jun-16
A single date for full design compliance was restricting our ability to leverage design capability through the supply chain. Following rescheduling of the completion of the design, we accepted a minor delay to design completion to benefit from greater supply chain design input.
42
Start on site 16-Jun-16 21-Apr-16 -
Works to relieve station congestion on the Northern line at Bank complete (Annex B: 2021)
31-Dec-21 31-Dec-21 -
36

Stations, Crossrail and third party
Significant quarterly milestones movement
Milestone description Current plan date
Q4 forecast date RAG Movement commentary
Forecast change
from Q3 (days)
Partial opening (without new ticket hall entrance/exit or lift)
08-Oct-20 27-Jul-20
The project has yet to commence construction and we are in the process of refining our schedule; as such there are changes to milestone dates while the schedule evolves.
87
New ticket hall open to the public 14-Sept-21 06-Apr-21 164
Programme financial forecast Full life In year
Spend to end Quarter 4, 2015/16 £m
Estimated final cost (EFC) £m
Authority £m
Variance to authority
£m/%
EFC movement in quarter £m/%
Year-end actual
£m
Year budget
£m
Variance to budget £m/%
213.2 607.5 607.5 - - 75.6 57.6 -18.0 -31.1%
Additional authority of £353.2m approved by the Board on 17 March 2016. The project is now fully authorised at £607.5m.
The variance to budget is as a result of acceleration of property compensation and acquisitions.
Bank station systems integration upgrade
Quarterly progress
We started demolition of the old station operations room (and completed it post quarter end), and the cable management system installation is well progressed. Progress has improved on the design and premises works following the resolution of design issues.
New station operation room worksite following the demolition works
37
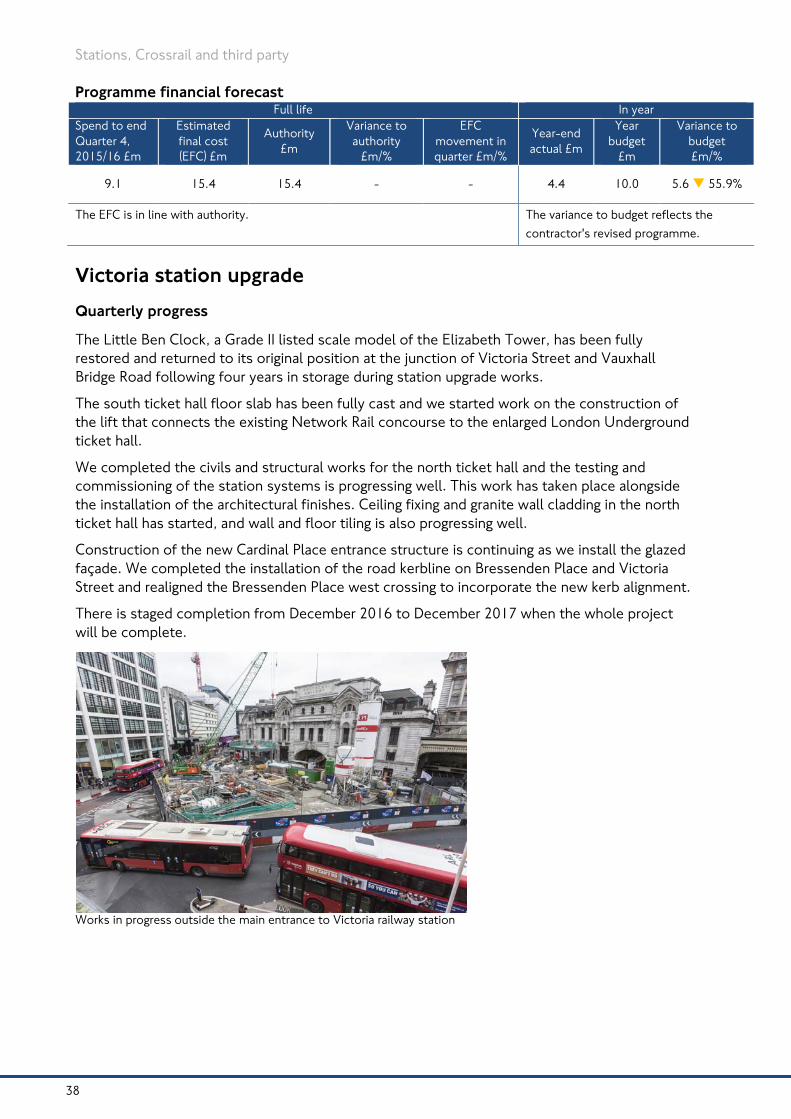
Stations, Crossrail and third party
Programme financial forecast Full life In year
Spend to end Quarter 4, 2015/16 £m
Estimated final cost (EFC) £m
Authority £m
Variance to authority
£m/%
EFC movement in quarter £m/%
Year-end actual £m
Year budget
£m
Variance to budget £m/%
9.1 15.4 15.4 - - 4.4 10.0 5.6 55.9%
The EFC is in line with authority. The variance to budget reflects the contractor's revised programme.
Victoria station upgrade
Quarterly progress
The Little Ben Clock, a Grade II listed scale model of the Elizabeth Tower, has been fully restored and returned to its original position at the junction of Victoria Street and Vauxhall Bridge Road following four years in storage during station upgrade works.
The south ticket hall floor slab has been fully cast and we started work on the construction of the lift that connects the existing Network Rail concourse to the enlarged London Underground ticket hall.
We completed the civils and structural works for the north ticket hall and the testing and commissioning of the station systems is progressing well. This work has taken place alongside the installation of the architectural finishes. Ceiling fixing and granite wall cladding in the north ticket hall has started, and wall and floor tiling is also progressing well.
Construction of the new Cardinal Place entrance structure is continuing as we install the glazed façade. We completed the installation of the road kerbline on Bressenden Place and Victoria Street and realigned the Bressenden Place west crossing to incorporate the new kerb alignment.
There is staged completion from December 2016 to December 2017 when the whole project will be complete.
Works in progress outside the main entrance to Victoria railway station
38

Stations, Crossrail and third party
Programme milestones forecast
Milestone Current plan date
Actual/ forecast
date RAG Commentary
Forecast change
from Q1 (Days
Completion of south paid area link tunnelling
18-Mar-16 11-Feb-16 Complete -13
South ticket hall station operations room complete
31-Dec-16 12-Oct-16
The plan date has been revised in the ‘Spending Review 2015: 2016/17-2020/21 funding agreement’ letter received from the DfT in March 2016.
49
North ticket hall complete 31-Dec-16 19-Dec-16 12
Hand back north ticket hall worksites to Land Securities
31-Dec-16 19-Dec-16 12
North ticket hall complete, including step-free access to all platforms via lifts (Annex B: 2017)
31-Dec-17 01-Feb-18
The plan date and milestone name has been revised in the ‘Spending Review 2015: 2016/17-2020/21 funding agreement’ letter received from the DfT in March 2016. We are in the process of agreeing revised contractual agreements with the main contractor to allow us to deliver within or ahead of the plan date.
-14
Significant quarterly milestones movement
Milestone description Current plan date
Q4 forecast date RAG Movement commentary
Forecast change
from Q3 (days)
Hand back basement areas to Network Rail
26-Jun-17 27-May-16
The schedule has been revised to secure the project end date. The dates for some intermediate milestones have changed.
-101
Programme financial forecast Full life In year
Spend to end Quarter 4, 2015/16 £m
Estimated final cost (EFC) £m
Authority £m
Variance to authority
£m/%
EFC movement in quarter £m/%
Year-end actual £m
Year budget £m
Variance to budget £m/%
465.3 608.3 677.4 69.0 10.2% -0.7 -0.1% 69.0 78.1 9.1 11.7%
Efficiency savings have resulted in an EFC that is lower than authority. The variance to budget is due to design delays impacting the delivery schedule.
39
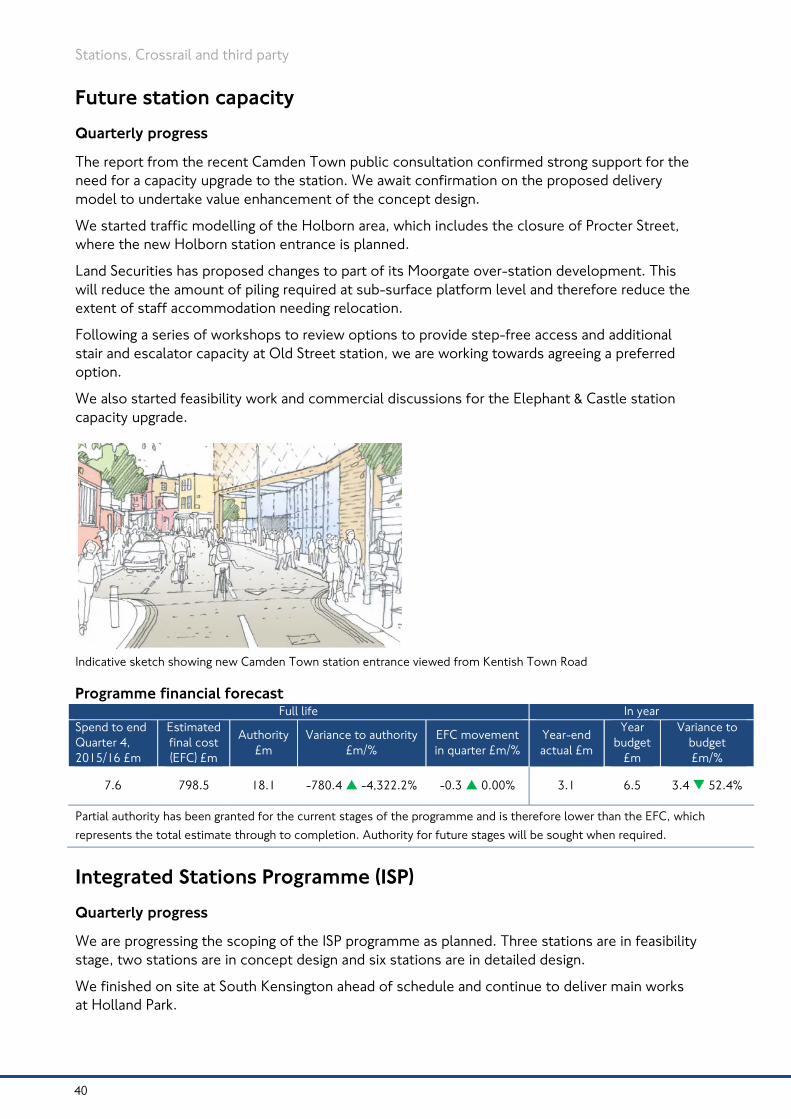
Stations, Crossrail and third party
Future station capacity
Quarterly progress
The report from the recent Camden Town public consultation confirmed strong support for the need for a capacity upgrade to the station. We await confirmation on the proposed delivery model to undertake value enhancement of the concept design.
We started traffic modelling of the Holborn area, which includes the closure of Procter Street, where the new Holborn station entrance is planned.
Land Securities has proposed changes to part of its Moorgate over-station development. This will reduce the amount of piling required at sub-surface platform level and therefore reduce the extent of staff accommodation needing relocation.
Following a series of workshops to review options to provide step-free access and additional stair and escalator capacity at Old Street station, we are working towards agreeing a preferred option.
We also started feasibility work and commercial discussions for the Elephant & Castle station capacity upgrade.
Indicative sketch showing new Camden Town station entrance viewed from Kentish Town Road
Programme financial forecast Full life In year
Spend to end Quarter 4, 2015/16 £m
Estimated final cost (EFC) £m
Authority £m
Variance to authority £m/%
EFC movement in quarter £m/%
Year-end actual £m
Year budget
£m
Variance to budget £m/%
7.6 798.5 18.1 -780.4 -4,322.2% -0.3 0.00% 3.1 6.5 3.4 52.4%
Partial authority has been granted for the current stages of the programme and is therefore lower than the EFC, which represents the total estimate through to completion. Authority for future stages will be sought when required.
Integrated Stations Programme (ISP)
Quarterly progress
We are progressing the scoping of the ISP programme as planned. Three stations are in feasibility stage, two stations are in concept design and six stations are in detailed design.
We finished on site at South Kensington ahead of schedule and continue to deliver main works at Holland Park.
40

Stations, Crossrail and third party
The bottom of the lift shaft at Holland Park
Programme milestones forecast
Milestone Current plan date
Actual/ forecast
date RAG Commentary
Forecast change
from Q3 (days)
Finish on site – South Kensington
30-May-16 22-Feb-16 Complete 52
Programme financial forecast Full life In year
Spend to end Quarter 4, 2015/16 £m
Estimated final cost (EFC) £m
Authority £m
Variance to authority
£m/%
EFC movement in quarter £m/%
Year-end actual £m
Year budget
£m
Variance to budget £m/%
117.2 333.1 333.1 - - 22.4 26.0 3.6 13.8%
London Underground lifts and escalators
Quarterly progress
We re-opened Tufnell Park station to customers on 4 March 2016 after completing works earlier than scheduled. We replaced two lifts with more energy efficient ones, contributing towards TfL’s commitment to reduce the carbon footprint of Tube stations. The new lifts take customers to the Northern line more quickly than the old lifts. We used the station closure to refurbish the ticket hall with an extra ticket gate, automatic wider gate and an improved customer information area.
The refurbishment of the two Walthamstow escalators was successfully completed, on time and below budget. The impact of the consecutive escalator closures at this major terminus was substantially reduced by making use of the station closure for track works, working longer and additional shifts, and a major change in operating practice, allowing the single ‘running’ escalator to be reversed and used in the ‘down’ direction during the morning peak.
The first two ‘Mod2+’ escalator refurbishments at Bermondsey and Canary Wharf were completed under the new contract strategy covering the fleet of escalators built for the Jubilee line extension. The strategy was developed during 2015 to increase the residual life of the fleet at the end of the contract in December 2018, while reducing levels of both planned and unplanned service disruption.
41

Stations, Crossrail and third party
Other escalator refurbishments were successfully completed at Angel (the last of the three long escalators), King’s Cross and Canada Water. We started the refurbishment of four individual escalators (Canary Wharf, Bermondsey, Green Park and West Ham), two step-free lifts at London Bridge and the two primary lifts at Holland Park. At Holland Park, the station was closed for the lift and station upgrade works to be delivered together, making considerable savings.
We have listened to our stakeholders and will be carrying out the repair of two lifts at Caledonian Road station one after another to ensure the station remains open to customers throughout the works.
The new lifts at Tufnell Park station
Programme milestones forecast
Milestone Current plan date
Actual/ forecast
date RAG Commentary
Forecast change
from Q3 (days)
Angel station – bring into use escalator 4
22-Feb-16 16-Feb-16 Complete -7
Tufnell Park station – bring into use lift 2
22-Mar-16 04-Mar-16 Complete -21
Elephant & Castle station – bring into use lift 6
30-Mar-16 07-Mar-16 Complete -52
Walthamstow station – return to service escalator 3
01-Apr-16 11-Mar-16 Complete -
Tufnell Park station – bring into use lift 1
05-Apr-16 04-Mar-16 Complete -21
Canada Water station – bring into use escalator 8
07-Apr-16 12-Mar-16 Complete 3
King’s Cross station – return to service escalator 7
30-May-16 23-Feb-16 Complete 7
Completion and consent to operate report approved – Elephant & Castle lift 1 return to service
05-Jul-16 04-May-16 34
42

Stations, Crossrail and third party
Programme financial forecast Full life In year
Spend to end Quarter 4, 2015/16 £m
Estimated final cost (EFC) £m
Authority £m
Variance to authority
£m/%
EFC movement in quarter £m/%
Year-end actual £m
Year budget
£m
Variance to budget £m/%
325.3 1,053.4 772.9 -280.5 -36.3% -98.4 -10.3% 44.3 55.3 11.0 19.8%
Partial authority has been granted for the current stages of the programme and is therefore lower than the EFC, which represents the total estimate through to completion. Authority for future stages will be sought when required.
The reduction against budget is mainly due to the review of the lifts and escalators workbank, resulting in postponing some works to meet operational requirements.
London Underground Crossrail works
Overview
The Crossrail network (renamed the Elizabeth line during Quarter 4) will be operational from 2018, connecting Reading and Heathrow in the west to Shenfield and Abbey Wood in the east. We are supporting Crossrail by facilitating the design and build to ensure successful handover into operations and maintenance of the five stations of Bond Street, Tottenham Court Road, Farringdon, Liverpool Street and Whitechapel.
Quarterly progress
We completed the Bond Street station operations room (SOR) ticket hall enabling works and interim SOR on schedule. We also completed enabling works ahead of schedule on the Griffiths House to Royal Oak Crossrail cable project.
The Crossrail handover strategy and plan document, incorporating LUs requirements, was approved by Crossrail Limited (CRL) and LU, with sign-off by the CRL Chief Executive. This key document sets out the framework for CRL’s handover of the central section stations to LU.
Bond Street station interim station operations room
Programme milestones forecast
Milestone Current plan date
Actual/ forecast
date RAG Commentary
Forecast change
from Q3 (days)
LU support complete for Crossrail trial running stations (central section)
28-Feb-19 31-Dec-18 -
43
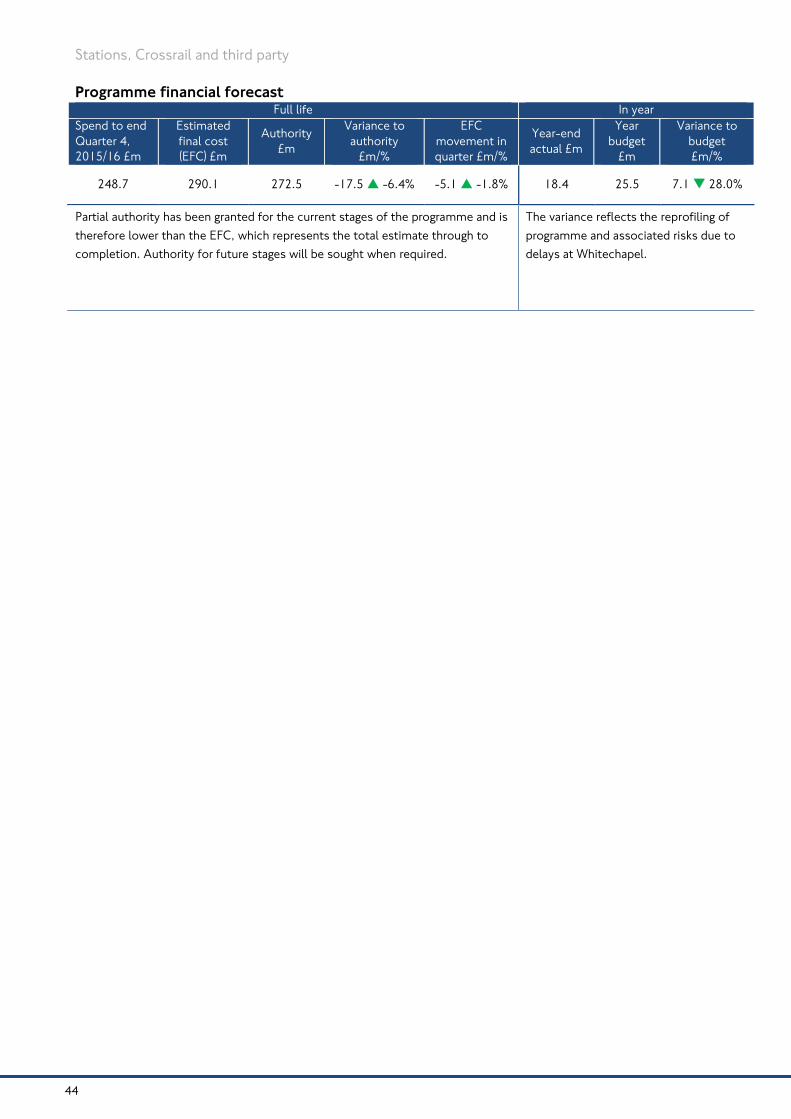
Stations, Crossrail and third party
Programme financial forecast Full life In year
Spend to end Quarter 4, 2015/16 £m
Estimated final cost (EFC) £m
Authority £m
Variance to authority
£m/%
EFC movement in quarter £m/%
Year-end actual £m
Year budget
£m
Variance to budget £m/%
248.7 290.1 272.5 -17.5 -6.4% -5.1 -1.8% 18.4 25.5 7.1 28.0%
Partial authority has been granted for the current stages of the programme and is therefore lower than the EFC, which represents the total estimate through to completion. Authority for future stages will be sought when required.
The variance reflects the reprofiling of programme and associated risks due to delays at Whitechapel.
44

London Rail capacity and growth Overview
The London Rail (LR) capacity and growth programme will help boost capacity, ease overcrowding and grow the network while improving customer service and reliability. Projects include a series of works that consist of lengthening trains across the London Overground network to increase capacity by 25 per cent and improve accessibility at key stations. Following commencement of the West Anglia inner service in 2015, work to improve the stations along this route is underway. The Gospel Oak to Barking line will be electrified with the current two-car diesel trains replaced by four-car electric trains, boosting capacity by 90 per cent. This will allow the line to reach the Barking Riverside Opportunity Area.
Other deliverables include double-tracking of the remaining single-tracked section of the DLR network, improvements to DLR vehicles to maximise use of space, and the procurement of additional DLR trains to meet demand in the Royal Docks. Added to this will be double-tracking key sections of the Tramlink network between Croydon and Wimbledon, and the procurement of six extra trams.
London Overground capacity improvement
Quarterly progress
We continue working towards finalising the planned improvements to the Willesden train maintenance depot and associated sidings, along with other important infrastructure changes that are required to support the additional capacity on the network and completion.
We achieved the final signalling commissioning stage at the ‘C’ sidings at the Wembley European Freight Operations Centre, allowing full hand back of the infrastructure to Network Rail.
At the New Cross Gate depot we completed the security fencing at the rear of the maintenance building. Pending lighting installation, we also completed the drivers’ walkway between Silwood sidings and the depot.
Work is nearing completion at Willesden train depot
45

London Rail capacity and growth
Programme financial forecast Full life In year
Spend to end Quarter 4, 2015/16 £m
Estimated final cost (EFC) £m
Authority £m
Variance to authority
£m/%
EFC movement in quarter £m/%
Year-end actual £m
Year budget
£m
Variance to budget £m/%
166.4 182.8 174.7 -8.1 -4.6% 0.1 0.1% 31.0 32.9 1.9 5.8%
The EFC increase is a result of commercial issues on a number of contracts. Commercial discussions with the suppliers are being held and one of the contracts is in adjudication.
London Overground Station Capacity Programme (LOSTAT)
Quarterly progress
We are making significant progress to the transformation of the entrance to South Tottenham station, which includes the installation of two new lifts and improvements to the staff accommodation facility. We installed a new gateline and canopy and the station re-opened to customers post quarter end in April 2016.
New gateline at South Tottenham station
Programme milestones forecast
Milestone Current plan date
Actual/ forecast
date RAG Commentary
Forecast change
from Q3 (days)
Start on site at West Hampstead station
07-Jan-17 07-Jan-17 -
Start on site at Hackney Central station
31-Mar-17 31-Mar-17 -
46

London Rail capacity and growth
47
Programme financial forecast Full life In year
Spend to end Quarter 4, 2015/16 £m
Estimated final cost (EFC) £m
Authority £m
Variance to authority
£m/%
EFC movement in quarter £m/%
Year-end actual £m
Year budget
£m
Variance to budget £m/%
17.4 38.9 29.3 -9.6 -32.9% -4.7 -13.7% 5.0 16.5 11.5 69.5%
Partial authority has been granted for the current stages of the project and is therefore lower than the EFC, which represents the total estimate through to completion. Authority for future stages will be sought when required.
The EFC increase in Quarter 4 represents increased costs for West Hampstead and Hackney Central schemes following market condition changes since partial authority was approved. Full authority submission will be sought once final positions on accounts are known.
Revised programme of work at West Hampstead, Dalston Kingsland and other stations resulted in spend being reallocated to 2016/17.
Trams Wimbledon line enhancement
Overview
The tram enhancement work at Wimbledon is vital to increase the capacity of London’s tram network on this busy service. When complete in 2016, our customers will benefit from a more frequent service with four new trams across the Wimbledon to West Croydon branch. The tram network has experienced rapid growth in customer numbers since it opened in 2000 – from 18.5 million customers in its first year of operation to more than 32 million in 2014/15 – and demand on the tram network is forecast to increase to around 60 million by 2030.
Quarterly progress
All of the four new trams are in full passenger service, which allowed an increased service from eight to 12 trams per hour along the busy route from Wimbledon to Croydon to start on 4 April 2016.
Platform 10b at Wimbledon station
Significant quarterly milestones movement
Milestone description Current plan date
Q4 forecast
date RAG Movement commentary
Forecast change
from Q3 (days)
Wimbledon platform 10b in service
31-Mar-16 26-Jan-16 Complete
Platform 10b was successfully brought into passenger service on 26 January 2016, following early commissioning of the Thales signalling system.
65

London Rail capacity and growth
48
Programme financial forecast Full life In year
Spend to end Quarter 4, 2015/16 £m
Estimated final cost (EFC) £m
Authority £m
Variance to authority
£m/%
EFC movement in quarter £m/%
Year-end actual £m
Year budget
£m
Variance to budget £m/%
30.0 30.0 30.0 - - 11.1 9.4 -1.7 -18.6%
Barking Riverside extension
Overview
The Barking Riverside extension project, funded by TfL and Barking Riverside Ltd (BRL), will deliver a new rail line and station to serve the development site. Services from Barking will run along the existing London/Tilbury/Southend Railway line for three kilometres and then branch off on a new extension for 1.5km from Renwick Road overbridge to the new terminus station.
Quarterly progress
We entered into a funding agreement and a land and works agreement with BRL, which were signed in early March 2016. BRL is a new joint venture between the Greater London Authority (GLA) and London & Quadrant (L&Q) New Homes.
We submitted our application for a Transport and Works Act Order (TWAO) to the Secretary of State for Transport on 31 March 2016. If approved, construction of the 4.5km extension of the Gospel Oak to Barking line could start in late 2017, with train services starting in 2021.
The decision to apply for the TWAO follows a public consultation in December 2015. This was the third consultation on the scheme, providing detailed land use, location of site compounds and construction traffic. Previous consultations in autumn 2014 and spring 2015 looked at support for the principle of the scheme and possible route alignments respectively. Responses to both consultations showed overwhelming support.
Indicative image of the proposed new Barking Riverside station

London Rail capacity and growth
Programme milestones forecast
Milestone Currentplan date
Actual/ forecast
date RAG Commentary
Forecast change
from Q3 (days)
Submission of Transport and Works Act Order (TWAO) application
15-Mar-16 31-Mar-16
There was a delay in completion of the Land and Works Agreements following the need to reflect clauses added at a late date in the Environmental Statement.
-16
Significant quarterly milestones movement
Milestone description Current plan date
Q4 forecast
date RAG Movement commentary
Forecast change
from Q3 (days)
Issue of main works ITT for all construction works
30-Nov-17 30-Nov-17 The plan dates have been re-baselined in accordance with the dates agreed in the Funding Agreement with Barking Riverside Ltd.
-213
Approval of TWAO 30-Oct-17 30-Oct-17 -153
Award of main works contract and commencement of delivery on site
30-Mar-18 30-Mar-18 -166
Commencement of passenger services to Barking Riverside
31-Mar-21 31-Mar-21 -105
Programme financial forecast Full life In year
Spend to end Quarter 4, 2015/16 £m
Estimated final cost (EFC) £m
Authority £m
Variance to authority
£m/%
EFC movement in quarter £m/%
Year-end actual
£m
Year budget
£m
Variance to budget £m/%
4.5 263.2 263.2 - - 4.5 1.5 -3.0 -202.9%
Full authority of £263.2m was approved by the Finance and Policy Committee on 16 February 2016 and noted by the Board on 2 March 2016.
On Network Stations Improvement Programme
Overview
The Rail for London On Network Stations Improvement Programme (RfL ONSIP) covers works at 22 stations to be served by Crossrail services, which are outside the scope of the Network Rail delivered Crossrail Anglia project functional enhancements. This programme ensures step-free access is provided across the entire route and reduces variances in appearance between these existing stations and the new central London stations to generate a ‘family of stations’ and improve the customer experience.
Quarterly progress
Improvement works at the 11 stations on the eastern section have started in a phased approach and will conclude in 2017. The works include significant external station renovations, new architectural internal fit-out and installation of gatelines to also increase station security. The extent of works varies at each location and is complementary with the Crossrail Anglia works that Network Rail will complete.
49

London Rail capacity and growth
While refurbishing the ticket halls to improve the customer experience, we are also seeking to create a unified identity for stations along the route. Furthermore, much improved station entrances will be provided at Ilford and Romford to improve access for the increasing number of customers who will use the Crossrail route. We will also provide refreshed platform furniture, including benches, waiting shelters, windscreens and bike stores where required, at each station.
Buckingham Group Ltd completed intrusive surveys to assess the condition of station buildings and substantially completed development of detailed designs at Manor Park, Seven Kings and Ilford. We issued the invitation to tender for the second package of station improvement works at Chadwell Heath, Brentwood and Gidea Park on schedule on 18 March 2016. Together with the Chief Executive Officer of Crossrail, Andrew Wolstenholme OBE, we delivered a successful briefing to the London Borough of Havering on the proposals for Romford which will tie into the borough’s urban realm scheme. The proposal was agreed, creating an opportunity to make a real impact at Romford station for customers and residents.
In addition to station refurbishments, we will install 17 lifts at the seven stations that otherwise would not have step-free access along the Crossrail route, ensuring all Crossrail stations are accessible from street to platform. In the eastern section these stations include Seven Kings, Maryland and Manor Park; the contract for the Guide to Rail Investment Process (GRIP) Stages 5-8 of these works (detailed design, construction test and commission, hand back and close-out) was awarded to Hochtief in March 2016, with works to complete by late 2017. The works will be undertaken in a series of possessions during the next 18 months, and with critical demolition and temporary footbridge possessions identified for September 2016.
The proposed improvements to the Romford southern entrance will improve accessibility, safety for customers and residents, aesthetic appearance, and facilitate ease of transition between transport modes
Programme milestones forecast
Milestone Current plan date
Actual/ forecast
date RAG Commentary
Forecast change
from Q3 (days)
Great Eastern – station improvement commence on site
04-Jan-16 04-Jan-16 Complete -
Great Eastern – step-free access lift scheme commence on site
28-May-16 28-May-16 -
Great Eastern – step-free access lift scheme finish on site
21-May-17 21-May-17 -
Great Eastern – station improvement finish on site
31-May-17 31-May-17 -
Great Western – station improvement commence on site
31-Jan-18 31-Jan-18 -
50

London Rail capacity and growth
Milestone Current plan date
Actual/ forecast
date RAG Commentary
Forecast change
from Q3 (days)
Great Western – step-free access lift scheme commence on site
31-Jan-18 31-Jan-18 -
Great Western – station improvement finish on site
30-Nov-19 30-Nov-19 -
Great Western – step-free access lift scheme finish on site
30-Nov-19 30-Nov-19 -
Programme financial forecast Full life In year
Spend to end Quarter 4, 2015/16 £m
Estimated final cost (EFC) £m
Authority £m
Variance to authority
£m/%
EFC movement in quarter £m/%
Year-end actual £m
Year budget
£m
Variance to budget £m/%
7.5 93.6 93.6 - - 5.6 8.0 2.4 29.9%
Crossrail rolling stock programme
Overview
This programme will deliver the design and construction of 65 Class 345 rolling stock and a dedicated depot and stabling facilities at Old Oak Common.
Quarterly progress
The production programme for the new Class 345 rolling stock has stabilised and the first train is scheduled to complete and start type testing in Derby at the end of May 2016, Old Dalby testing in August 2016, and on network testing from November 2016. Components for the second train are on the assembly line.
Bombardier Transportation (BT) has declared a delay to the on-train European Train Control System (ETCS) signalling equipment, which it attributes to the 2015 European Commission (EC) Directive to fit updated ETCS to trains entering service after 31 December 2017. ETCS is required to operate Crossrail Stage 2 services (Heathrow to Paddington) from May 2018. Although not delaying the start of Crossrail Stage 2 services, BT’s ETCS development, test and passenger-service approvals programme now runs to April 2018 and activities are focused on reintroducing contingency to the schedule, focusing on the testing and approvals process. Stage 2 Crossrail services (from April 2017) and Stage 3 Crossrail services (from December 2018) are not affected.
Construction of the main operations, maintenance and control building at Old Oak Common (OOC) is progressing well with roofing and cladding complete, floor slabs and pits well advanced and mechanical and electrical fit-out underway. Completion of the first section of the depot remains on schedule for May 2017.
BT took occupation of the Network Rail land at the eastern end of the depot (where it connects to the network) as planned in January 2016 and started advance drainage works in that area in preparation for constructing the automatic train inspection and washing plant. As required by the DfT, part of that land will be used until February 2018 to provide a contingent second rail exit from the adjacent First Great Western depot while NR undertakes track remodelling in the area. Construction work at the OOC depot is being restaged as necessary to accommodate this and mitigate delay to depot completion dates.
51

London Rail capacity and growth
Fit-out of driving cab sub-assemblies prior to bolting to car First assembled carriage mounted on its bogies
Programme milestones forecast
Milestone Currentplan date
Actual/ forecast
date RAG Commentary
Forecast change
from Q3 (days)
Commence unit testing at Derby
27-May-16 27-May-16
The plan date has been revised from 9 March 2016 following re-baselining of the first unit programme to address incorrect material scheduling in some areas. This is not expected to impact on train deliveries.
-32
Complete operations, maintenance and control building ground floor concrete slab
31-Jul-16 06-Jul-16 -
Reduced length unit (RLU) eight-car trains available for Stage 1 Crossrail services
01-May-17 25-Apr-17 -
Sectional completion (contractual) – depot Section A
21-May-17 21-May-17 -
Sectional completion (contractual) – depot Section B
13-Oct-17 13-Oct-17 -
Full length unit (FLU) 12-car trains available for Stage 1 Crossrail services
15-Apr-18 30-Mar-18 -
Sectional completion (contractual) – depot Section C
20-May-18 20-May-18 -
52

London Rail capacity and growth
Programme financial forecast Full life In year
Spend to end Quarter 4, 2015/16 £m
Estimated final cost (EFC) £m
Authority £m
Variance to authority
£m/%
EFC movement in quarter £m/%
Year-end actual £m
Year budget
£m
Variance to budget £m/%
215.4 1,090.5 1,090.5 - 3.3 0.3% 122.3 154.0 31.7 20.6%
The EFC and authority, which were previously reported as £1,093.8m, have both decreased to £1,090.5m as a result of the separation of the Liverpool Street platform works project from the Crossrail rolling stock programme owing to the discrete nature of the activities, timelines and procurement of each.
The in year variance relates to the production reprofiling of the ‘mock-up train’ and body car(s) due to design changes.
53

Crossrail Crossrail Limited (CRL)
Quarterly progress
Crossrail remains on time and within the funding envelope of £14.8bn. Overall, the project is approaching 75 per cent complete. Circa £300m was spent in Quarter 4, at the end of which there is more than a 30 per cent chance that some of the £600m TfL contingency funding may be needed.
Crossrail’s central section construction programme is focused on fitting out the tunnels, shafts and portals. Crucial milestones were met during Quarter 4 including the first stage of a sequence of staged handovers at Whitechapel and Liverpool Street stations, which will allow the systemwide main works team to start installing track in the Whitechapel tunnels later in 2016.
Progress is being made against all our production targets with platform secondary lining more than 80 per cent complete, first stage concrete in the running tunnels approaching 100 per cent complete, platform construction more than 65 per cent complete, more than 20 per cent of track has been laid and the westbound section between Plumstead and Victoria Dock Portals is complete, and platform edge screen brackets and trusses installation to allow handover to the systemwide contract is 60 per cent complete.
The £2.3bn modernisation of the existing rail network for Crossrail being undertaken by Network Rail is more than 60 per cent complete. Following the successful completion of the Easter 2016 works, focus has turned to the works required on Crossrail’s eastern route in preparation for Stage 1 services commencing in May 2017. Stage 1 is the progressive introduction of the new Crossrail rolling stock (Class 345) on the route between Shenfield and Liverpool Street.
The Office of Rail and Road has confirmed a derogation to permit use of an enhanced train protection warning system between Paddington and Heathrow Airport junction until December 2019.
Crossrail’s innovative automated drilling machine
54

Crossrail
Crossrail key milestones forecast Milestones Baseline
early date Baseline late date
Actual/ forecast RAG Commentary
Completed Q4 2015/2016
Handover east and westbound running tunnels Victoria Dock Portal to Stepney Green
30-Nov-15 25-Jan-16 09-Mar-16 Complete
Both running tunnels were handed over to the systemwide contractor in Q4. Handover of this section was delayed due to completion works at the Limmo site running late. There is no overall impact on the Crossrail critical path from the delayed handover dates.
Scheduled 2015/2016 Nine urban realm principal station consents obtained for central section
11-Nov-15 04-Feb-16 31-Dec-16 The remaining consents are still being progressed. There is no impact on the critical path.
Seven over-site development agreements signed by 31 March 16
30-Mar-16 23-Jun-16 31-Aug-16
TfL has signed three development agreements (Bond Street eastern ticket hall, Tottenham Court Road eastern and western ticket halls). The remainder is forecast for signature in August 2016. There is no impact on the critical path caused by the delay.
RAG key used for Crossrail Master Operational Handover Schedule, version 1
*Float is calculated as the difference between the baseline early date and the baseline late date
Greater than or equal to 70% of float* remaining
Less than 70% of float remaining
Less than 30% of float remaining
55
Business change and technology
Fit for the Future – Stations ................................... 57Information and Communication Technology Transformation (ICTT) ............................................ 58Customer experience – FTP Phase 3, 4 and 5 ..... 60
56

Business change and technology Fit for the Future – Stations
Overview
The objective of the programme is to change the way that London Underground stations work to deliver improved customer service at a lower cost.
Extensive training, as well as process improvements supported by technology, is allowing staff to be more visible and available for customers.
Quarterly progress
We are delivering the programme in three phases.
In Phase A, we appointed 97 area managers to lead the change.
Phase B addressed the customer service transformation, which included ticket hall changes, customer service training and the provision of mobile devices to all station staff. By the end of Quarter 4, approximately 4,900 staff had attended a five-day customer service training course.
In Phase C, we launched the Fit for the Future – Stations operating model on 6 February 2016 at 23 pilot stations including King’s Cross. This was followed by a network-wide switchover on 3 April 2016, improving processes throughout the operational organisation across all LU stations.
Since Sunday 3 April, the network has been operated by staff working in their new roles, empowered by a range of processes and technology improvements to support both customer service and the running of the stations.
We have seen a network-wide increase in staff helpfulness scores recorded in the Staff and Information Surveys conducted following the switchover to the new operating model.
The iPad-based station logbook is part of a suite of new mobile applications available to all station staff upon switchover to the new operating model in April 2016
57

Business change and technology
Programme milestones forecast
Milestone Current plan date
Actual/ forecast
date RAG Commentary
Forecast change
from Q3 (days)
All station staff formally contracted and notified of final working location
18-Dec-15 05-Feb-16 Complete
The distribution of letters and contracts to staff were delayed while trade union consultation on the final aspects of the operating model was concluded.
-28
All relevant ticket offices converted to passenger operated machine suites
22-Jan-16 15-Jan-16 Complete 7
New station operating model go live
07-Mar-16 06-Feb-16 Complete 1
All planned customer service training completed
08-Apr-16 31-Mar-16 Complete -1
Programme financial forecast Full life In year
Spend to end Quarter 4, 2015/16 £m
Estimated final cost (EFC) £m
Authority £m
Variance to authority
£m/%
EFC movement in quarter £m/%
Year-end actual £m
Year budget
£m
Variance to budget £m/%
90.0 127.0 127.6 0.6 0.5% 4.7 3.6% 51.2 67.0 15.8 23.6%
We undertook a cost and benefits review during Quarter 4, which resulted in a reduction of the implementation costs. This reduction relates to the release of programme risk, and efficiencies on enabling projects such as built environment, uniforms, communications and engagement through project delivery savings.
The forecast underspend is driven by built environment savings and rephasing of some training courses into 2016/17.
Information and Communication Technology Transformation (ICTT)
Overview
This programme will ensure that information and communication technology capabilities are in place to underpin delivery of LU and LR strategic priorities. Its focus is on operationally critical and safety-related systems, as opposed to enterprise management systems. In addition, it acts as a key enabler for several other programmes, as well as delivering upgraded capability and/or reducing the cost of ownership for particular information and communications systems.
Quarterly progress
Our deployment of mobile devices to staff progresses as planned. We issued more than 4,900 station staff with personal devices and the deployment rate continues to meet the needs of the Fit for the Future – Stations programme and asset maintenance teams. Staff time savings from using mobile applications, instead of traditional systems, are estimated in the tens of thousands of hours each year.
Our preparations to enhance customer information provision at stations on Sub-Surface lines and to significantly increase our capability to view station CCTV images centrally progressed in accordance with plans.
58

Business change and technology
We also started testing in below-ground environments, the updated radio communications technology that the Home Office plans to deploy for use by emergency services personnel.
Staff will be more visible and have the latest technology to help
Significantly late milestones
Milestone description Current plan date
Variance to budget
(days) Variance commentary
Stage gate 5 – business go live (stations) 07-Feb-16 -236 Delivery timescales for the workforce planning project have been affected by unforeseen difficulties integrating new software with existing software.
Programme financial forecast Full life In year
Spend to end Quarter 4, 2015/16 £m
Estimated final cost (EFC) £m
Authority £m
Variance to authority
£m/%
EFC movement in quarter £m/%
Year-end actual £m
Year budget
£m
Variance to budget £m/%
44.3 63.0 54.0 -9.0 -16.6% -2.1 -3.5% 5.2 8.2 3.0 36.3%
Partial authority has been granted for the current stages of the programme and is therefore lower than the EFC, which represents the total estimate through to completion. Authority of £1.7m was granted in Quarter 4 and will be sought for future stages when required. The EFC increased in Quarter 4 with the inclusion of £2m for future application development work, for which seed funding of £130,000 was granted in Quarter 4.
59

Business change and technology
Customer experience – FTP Phase 3, 4 and 5
Overview
The Future Ticketing Programme (FTP) identifies opportunities for TfL to make life more convenient for our customers while reducing the costs associated with collecting fares revenue. FTP is made up of the following phases:
Phases 1 and 2 developed card readers and back office systems to allow pay as you go (PAYG) travel on all services using contactless payment (credit and debit) cards (CPCs).
Phases 3, 4 and 5 will introduce a range of further benefits for Oyster and contactless customers, including a new mobile ticketing app and improved online sales and refund processes. The programme will also implement Monday to Sunday capping for Oyster customers, as an alternative to purchasing a weekly Travelcard or Bus & Tram Pass, providing the same benefits currently available to CPC users.
Quarterly progress
On Phase 3, design and development work continues to future proof the back office system for CPC.
On Phase 4, our in-house team and contractors started design and testing of the faster delivery of travel products to all gatelines. We also started design and testing on the mobile ticketing app.
Programme milestones forecast
Milestone Current plan date
Actual/ forecast
date RAG Commentary
Forecast change from
Q3 (days) Launch of Phase 1 of the ticketing app 22-Dec-16 22-Dec-16 -
Availability of weekly capping for Oyster customers
22-Dec-17 22-Dec-17 -
Programme financial forecast Full life In year
Spend to end Quarter 4, 2015/16 £m
Estimated final cost (EFC) £m
Authority £m
Variance to authority
£m/%
EFC movement in quarter £m/%
Year-end actual £m
Year budget
£m
Variance to budget £m/%
6.9 44.3 44.3 - 1.5 3.3% 5.6 8.4 2.9 34.0%
The EFC decrease in Quarter 4 relates to the Phase 3 project resources forecast, which was previously overstated and amended as part of the reforecasting process. The EFC and authority are now aligned.
60

Surface Transport
Assets Portfolio ...................................................... 62Asset Capital Programme (ACP) .................................................. 62Hammersmith Flyover strengthening ......................................... 63Safety Camera Replacement Programme .................................. 64Silvertown Tunnel project ............................................................ 65
Major Highway Enhancements Portfolio .............. 68Elephant and Castle northern roundabout ............................... 68Better Junctions core programme .............................................. 69Cycle Superhighways programme ............................................... 71North-South Cycle Superhighway............................................... 74East-West Cycle Superhighway ................................................... 75
Borough Cycling Infrastructure ............................ 76Cycling Mini-Hollands ................................................................... 76Central London Grid ...................................................................... 77Cycling Quietways ......................................................................... 79
Network Performance and Safety Portfolio .......... 81Bus Priority Delivery Portfolio ..................................................... 81Road space management SCOOT ............................................... 83Surface Intelligent Transport System (SITS) .............................. 84
Operations and Environment Portfolio ................. 85London Road User Charging (LRUC) and Traffic Enforcement Notice Processing (TENP) Contract Re-let Project ................... 85Ultra Low Emission Zone.............................................................. 86Cycle hire re-let ............................................................................. 88New Routemaster .......................................................................... 89
61

Assets
Surface Transport Assets Portfolio The coordinated asset maintenance, renewal and improvement activities we deliver to maximise customer satisfaction, minimise whole life costs and enable our 10 principal transport outcomes to be delivered.
Asset Capital Programme (ACP)
Overview
The ACP is a business-as-usual rolling programme of planned works that maintains, renews and improves Surface Transport’s assets. The ACP covers a range of assets including carriageways, footways, bridges, tunnels, lighting, traffic signals and technology, bus shelters and bus stations.
Quarterly progress
We have delivered broadly in line with targets, with variances on some asset outputs reflecting in year pressures and opportunities, for example, carriageway output was increased to offset some lighting under-delivery. These variances have been used to adjust the 2016/17 and 2017/18 programmes to maintain levels of service and ‘state of good repair’ targets.
Our delivery in Quarter 4 included more than 201,000 square metres of carriageway resurfacing. Locations treated included the A24 Clapham Common South, A10 Great Cambridge Road, A21 Farnborough Common and A41 Watford Way. In addition, we re-laid more than 46,000 square metres of footway at various locations including at A30 Staines Road, A23 Streatham High Road and A201 Blackfriars Road to Union Street. We completed tunnel refurbishment works on Blackwall Tunnel (northbound and southbound) and structural repairs on Marylebone Road subway, A102 Westcombe Hill footbridge and Dog Lane retaining wall. Other improvements included the replacement of more than 900 conventional luminaires with energy efficient LEDs and the replacement of 6.1km of vehicle restraint barriers.
Replaced lighting luminaires and columns in Trinity Road
62
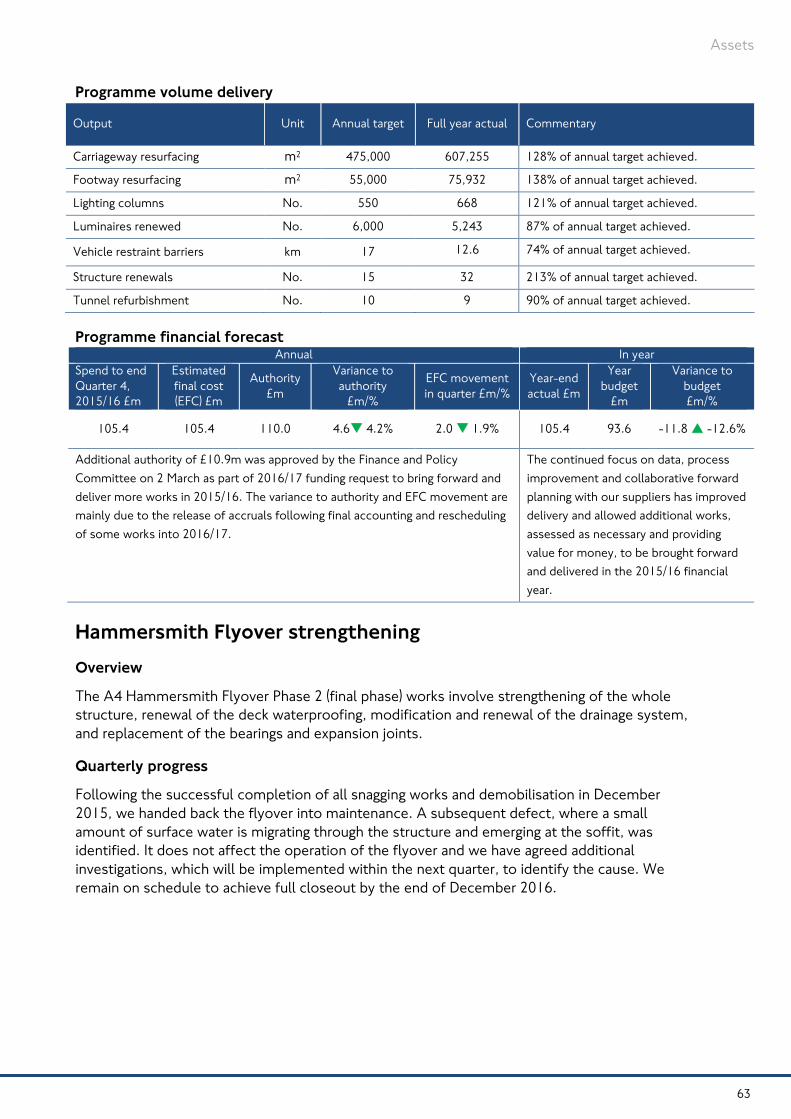
Assets
Programme volume delivery
Output Unit Annual target Full year actual Commentary
Carriageway resurfacing m2 475,000 607,255 128% of annual target achieved.
Footway resurfacing m2 55,000 75,932 138% of annual target achieved.
Lighting columns No. 550 668 121% of annual target achieved.
Luminaires renewed No. 6,000 5,243 87% of annual target achieved.
Vehicle restraint barriers km 17 12.6 74% of annual target achieved.
Structure renewals No. 15 32 213% of annual target achieved.
Tunnel refurbishment No. 10 9 90% of annual target achieved.
Programme financial forecast Annual In year
Spend to end Quarter 4, 2015/16 £m
Estimated final cost (EFC) £m
Authority £m
Variance to authority
£m/%
EFC movement in quarter £m/%
Year-end actual £m
Year budget
£m
Variance to budget £m/%
105.4 105.4 110.0 4.6 4.2% 2.0 1.9% 105.4 93.6 -11.8 -12.6%
Additional authority of £10.9m was approved by the Finance and Policy Committee on 2 March as part of 2016/17 funding request to bring forward and deliver more works in 2015/16. The variance to authority and EFC movement are mainly due to the release of accruals following final accounting and rescheduling of some works into 2016/17.
The continued focus on data, process improvement and collaborative forward planning with our suppliers has improved delivery and allowed additional works, assessed as necessary and providing value for money, to be brought forward and delivered in the 2015/16 financial year.
Hammersmith Flyover strengthening
Overview
The A4 Hammersmith Flyover Phase 2 (final phase) works involve strengthening of the whole structure, renewal of the deck waterproofing, modification and renewal of the drainage system, and replacement of the bearings and expansion joints.
Quarterly progress
Following the successful completion of all snagging works and demobilisation in December 2015, we handed back the flyover into maintenance. A subsequent defect, where a small amount of surface water is migrating through the structure and emerging at the soffit, was identified. It does not affect the operation of the flyover and we have agreed additional investigations, which will be implemented within the next quarter, to identify the cause. We remain on schedule to achieve full closeout by the end of December 2016.
63

Assets
The Hammersmith Flyover
Programme milestones forecast
Milestone Current plan date
Actual/ forecast
date RAG Commentary
Forecast change
from Q3 (days)
Finish on site 31-Mar-16 08-Mar-16 Complete -37
Project close completed 31-Mar-17 31-Dec-16 -
Programme financial forecast Full life In year
Spend to end Quarter 4, 2015/16 £m
Estimated final cost (EFC) £m
Authority £m
Variance to authority
£m/%
EFC movement in quarter £m/%
Year-end actual £m
Year budget
£m
Variance to budget £m/%
89.7 91.1 101.1 10.0 9.9% - 20.3 30.4 10.1 33.2%
The target price was agreed with the contractor in March 2016, resulting in additional savings being realised after the 2016/17 budget and the EFC was set and a lower full life spend to end at Quarter 4 than at Quarter 3.
The variance is driven by a change in risk profile as key risks did not fully materialise. Additionally, savings have arisen from a reduction in resource levels sooner than forecast and an agreement of a lower than expected target price.
Safety Camera Replacement Programme
Overview
The programme’s core objective is to maintain the existing road safety benefits provided by cameras by replacing life-expired wet film with digital units. Research shows that cameras can help to reduce the number of people killed or seriously injured (KSI) by as much as 58 per cent. The digital cameras will provide additional benefits over wet film, such as supporting the enforcement of speed limits through green traffic lights, helping to further improve safety at junctions.
64

Assets
Quarterly progress
We replaced 361 of 403 spot speed cameras and 217 of 243 red light wet film cameras with digital units. The plan remains on target to replace the remaining cameras by October 2016.
The first of four average speed corridor trials on the A40 went live on 26 October 2015 and is now being enforced by the Metropolitan Police Service. The A316 is planned to go live in late spring 2016. The A406 corridor works, which we are progressing in collaboration with several other major TfL schemes, is expected to go live in summer 2016. The A2 will follow after a programme of road safety measures are implemented in early summer 2016, which will also help reduce KSIs, improve driver behaviour and improve journey time reliability on these corridors.
Twin spot speed cameras enforcing both carriageways in Croydon
Programme milestones forecast
Milestone Current plandate
Actual/ forecast
date RAG Commentary
Forecast change
from Q3 (days)
Project close approved at Surface Board
31-Mar-17 31-Mar-17 -
Programme financial forecast Full life In year
Spend to end Quarter 4, 2015/16 £m
Estimated final cost (EFC) £m
Authority £m
Variance to authority
£m/%
EFC movement in quarter £m/%
Year-end actual £m
Year budget
£m
Variance to budget £m/%
29.7 35.4 36.6 1.2 3.3% 1.2 3.3% 16.0 19.7 3.7 18.7%
Silvertown Tunnel project
Overview
The Silvertown Tunnel project will deliver a 1.4km twin-bore road tunnel, under the Thames, with connections to Silvertown in the north and the Greenwich Peninsula in the south. The tunnel generally follows the route of the Emirates Air Line cable car.
65

Assets
The tunnel will provide additional capacity and resilience to the road network in this area and relieve congestion through the Blackwall Tunnel. User charges will be introduced at both tunnels to help manage traffic demand and pay for the new one, which will provide improved connectivity and support the growth expected in east and southeast London.
Quarterly progress
In February 2016, approval to proceed with the project was granted by the Board. This approval included the overall budget for TfL delivery costs and land acquisitions, and for the application of a Development Consent Order (DCO). The application is to provide all the necessary powers and consents to construct, operate and maintain the Silvertown Tunnel.
In early March 2016, we submitted draft documents for the DCO to the Planning Inspectorate for early review and comment. Production of the final version of the documents is complete. We submitted the DCO application post quarter end on 29 April 2016, together with a detailed consultation report, which was made available to the public on 12 May.
We are making good progress with the host London Boroughs of Greenwich, Newham and Tower Hamlets and certain landowners on the production of Statements of Common Ground (SoCG). These statements, while not required for the DCO application, will provide essential evidence to the Planning Inspectorate on the evolution of the project (taking into account issues raised during the public consultation which finished at the end of November 2015).
We continued procurement work in parallel with the DCO application. The Prior Information Notice (PIN) was published on 9 March 2016 and an Industry Day was held post quarter end on 13 May 2016. This engagement session was attended by over 130 delegates representing 80 contractors, designers and finance organisations. The publication of the Official Journal of the European Union (OJEU) contract notice and pre-qualification questionnaire (PQQ) was paused to allow for a Mayoral review and we now expect to issue the OJEU in autumn 2016 and the invitation to negotiate in spring 2017.
Silvertown Tunnel – approach to Greenwich Portal on A102
66
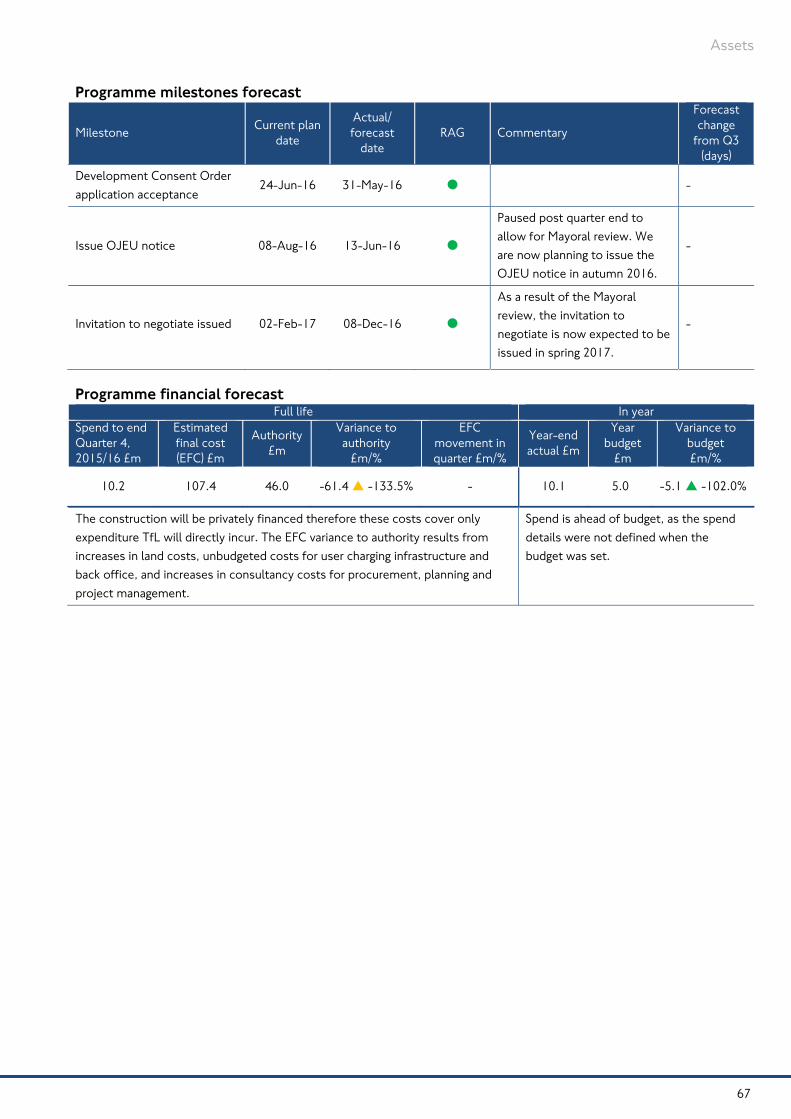
Assets
67
Programme milestones forecast
Milestone Current plandate
Actual/ forecast
date RAG Commentary
Forecast change
from Q3 (days)
Development Consent Order application acceptance
24-Jun-16 31-May-16 -
Issue OJEU notice 08-Aug-16 13-Jun-16
Paused post quarter end to allow for Mayoral review. We are now planning to issue the OJEU notice in autumn 2016.
-
Invitation to negotiate issued 02-Feb-17 08-Dec-16 -
Programme financial forecast Full life In year
Spend to end Quarter 4, 2015/16 £m
Estimated final cost (EFC) £m
Authority £m
Variance to authority
£m/%
EFC movement in quarter £m/%
Year-end actual £m
Year budget
£m
Variance to budget £m/%
10.2 107.4 46.0 -61.4 -133.5% - 10.1 5.0 -5.1 -102.0%
The construction will be privately financed therefore these costs cover only expenditure TfL will directly incur.The EFC variance to authority results from increases in land costs, unbudgeted costs for user charging infrastructure and back office, and increases in consultancy costs for procurement, planning and project management.
Spend is ahead of budget, as the spend details were not defined when the budget was set.
As a result of the Mayoral review, the invitation to negotiate is now expected to be issued in spring 2017.

Major Highway Enhancements Portfolio Unlocking developments creating homes and jobs, improving urban realm, protecting vulnerable road users, tackling congestion, and delivering the Mayor’s Vision for Cycling by getting more people cycling, more safely, more often.
Transforming streets and places As part of the Road Modernisation Plan, substantial investment will continue in transformational projects designed to radically improve living and travelling conditions. Londoners can look forward to safer, greener and more attractive streets and town centres, as well as safer conditions for cyclists and pedestrians.
Elephant and Castle northern roundabout
Overview
The main focus of the Elephant and Castle northern roundabout project is to improve safety for road users and create a new and accessible public space. The £25m overhaul of the roundabout has been designed to significantly upgrade the facilities for pedestrians, cyclists and drivers by converting the roundabout into a peninsula and the road network around it into a two-way traffic system.
Quarterly progress
Following the configuration switch from a roundabout to two-way traffic in December 2015, we completed the new highway layout, opened all segregated cycle lanes and new surface level pedestrian crossing facilities. The new public space on the new peninsula is nearly complete, with new trees, grass and benches being completed in May 2016.
The new layout at Elephant and Castle
68

Major highways enhancements
Programme milestones forecast
Milestone Current plandate
Actual/ forecast
date RAG Commentary
Forecast change
from Q3 (days)
Completion of Phase 1 urban realm works
20-Jul-16 30-Apr-16 -
Milestone Current plan date
Actual/ forecast
date RAG Commentary
Forecast change
from Q3 (days)
Completion of highway construction works (for Phase 1)
27-Jun-17 04-Apr-16 -
Stage 6 project close certificate issued
31-Mar-21 31-Mar-21 -
Programme financial forecast Full life In year
Spend to end Quarter 4, 2015/16 £m
Estimated final cost (EFC) £m
Authority £m
Variance to authority
£m/%
EFC movement in quarter £m/%
Year-end actual £m
Year budget
£m
Variance to budget £m/%
13.7 24.4 24.4 - - 12.4 13.5 1.1 8.4%
Better Junctions
Overview
We are committed to making London’s busiest junctions safer and more attractive for cyclists and other vulnerable road users. The Better Junctions programme is focused on making substantial improvements at 33 locations, including some of the most intimidating and high profile junctions and gyratories in London. Of the 33 Better Junctions sites, 13 are being treated as ‘core’ Better Junctions schemes, 10 are larger schemes being delivered as standalone projects, and 10 will be delivered through the Cycle Superhighways programme.
Better Junctions core programme
Quarterly progress
The main works are progressing well at Stockwell Cross. We have completed around 50 per cent of the main construction works and all planned utility works are complete. We plan to complete the signal commissioning for both junctions and return them to two-way operation by mid May 2016, which will reduce disruption in and around the area. The overall scheme remains on schedule for completion by December 2016 once the urban realm works are complete.
At Oval Triangle junction, all cycle facilities are fully operational. We started construction of the urban realm on 1 March 2016 and the works were complete at the end of April 2016. The bespoke statue will be installed later in 2016.
The main construction works started as planned at Archway gyratory on 29 February 2016. The Archway urban realm detailed design is being developed by our London Highways Alliance Contract (LoHAC) contractor. High definition ground penetration surveys have been completed. Low impact works, which include the installation of temporary traffic signals and the removal of
69

Major highways enhancements
existing trees, were completed in February 2016. Existing traffic islands have been removed at the junctions of Tollhouse Way/Archway Road and St John’s Way/Archway Road. Drainage works on Highgate Hill and carriageway reconstruction and installation of the kerbline on Tollhouse Way have been undertaken. The overall scheme will complete by March 2017.
We produced the Westminster Bridge South public consultation report and published it on 18 March 2016. As well as redesigning the junction, we are planning to introduce segregated cycle lanes on Westminster Bridge. Construction is expected to start in early 2017.
For Lambeth Bridge (north) and Lambeth Bridge (south) projects, the public consultation has been postponed to later in the year to allow more time to find a solution that meets the needs of all road users. We are also further analysing a possible interim solution to make improvements that we could potentially begin later in 2016.
The public consultation for Hammersmith gyratory took place between 2 February and 15 March 2016. The consultation response report is currently being produced and we hope to publish in summer 2016 confirming a way ahead.
Cycle facilities are fully operational at Oval
Programme milestones forecast
Milestone Currentplan date
Actual/ forecast
date RAG Commentary
Forecast change
from Q3 (days)
Archway gyratory – start of works on site
15-Mar-16 01-Feb-16 Complete 14
Oval Triangle – construction complete
31-Mar-16 23-Mar-16 Complete -20
Programme financial forecast Full life In year
Spend to end Quarter 4, 2015/16 £m
Estimated final cost (EFC) £m
Authority £m
Variance to authority
£m/%
EFC movement in quarter £m/%
Year-end actual £m
Year budget
£m
Variance to budget £m/%
27.3 61.1 46.2 -14.9 -32.3% - 10.5 20.3 9.8 48.2%
70

Major highways enhancements
The authority covers the feasibility, concept design and detailed design costs of all projects up to the end of 2016, along with the delivery of Oval, Archway and Stockwell. Authority has increased from £30.4m at Quarter 3 for Stockwell gyratory (£5.4m authority) and Archway (£10.4m). Further authority will be sought in stages as project designs are completed.
Reprioritisation across the programme led to some spend being deferred to later years.
Cycle Superhighways
Overview
Cycle Superhighways (CS) provide safer, fast and continuous bike routes running into, and across, central London along recognised commuter routes. By the end of May 2016, the four existing Cycle Superhighways will have been upgraded and four new routes completed.
Cycle Superhighways programme
Quarterly progress
Construction is progressing to plan on a number of routes and construction is planned on several others.
CS1 construction works were substantially completed by Easter 2016. Post quarter end, we completed the snagging along the whole route and it is now open and being used by cyclists.
CS2 upgrade construction works continued throughout the quarter. Post quarter end, the resurfacing was completed and the full route was opened to cyclists at the end of April 2016.
At Churchyard Row we completed another site-specific upgrade to the existing CS7: Merton to the City route. The Clapham Common Southside and Clapham High Street schemes remain in concept design until late summer 2016 and we expect to start construction in spring 2017.
We started construction, which is now approximately 75 per cent complete, to upgrade the junction at Chelsea Bridge on CS8: Wandsworth to Westminster. Carriageway resurfacing of the junction is currently taking place with works to be completed in full by June 2016.
CS11: Brent Cross to Baker Street consultation (including Swiss Cottage) completed in March 2016. We are analysing the responses and hope to release results in summer 2016. We will continue further discussions with key stakeholders to find a scheme that meets the needs of all road users and stakeholders.
Consultation also completed on Phases 2 of North-South Cycle Superhighway and East-West Cycle Superhighway in March 2016. As with CS11, we are analysing the responses and expect to release the consultation response reports later in 2016.
71

Major highways enhancements
Apex junction
Programme milestones forecast
Milestone Current plandate
Actual/ forecast date
RAG Commentary
Forecast change from Q3 (days)
CS11 (Phase 1) start of public consultation
01-Feb-16 01-Feb-16 Complete -
CS5 (extension) start of detailed design
01-Mar-17 01-Mar-17 -
CS5 (extension) Stage 6 project close certificate issued
18-Dec-18 25-Sept-18 -
Stage 6 close: CS4 Phase 3 (London Bridge to Tower Bridge)
22-Jun-19 30-Mar-19 -
Significant quarterly milestones movement
Milestone description Current plan date
Q4 forecast
date RAG Movement commentary
Forecast change
from Q3 (days)
CS4 start of detailed design 21-Aug-17 01-May-17
CS4 Phase 1 modelling is combined with the London Borough of Southwark’s Lower Road gyratory removal scheme, for which the modelling showed unacceptable bus journey times, which also impacted negatively on CS4 designs. Detailed design is delayed while mitigations are sought and the milestone plan date was revised from 23 February 2016.
-151
72

Major highways enhancements
Programme financial forecast Full life In year
Spend to end Quarter 4, 2015/16 £m
Estimated final cost (EFC) £m
Authority £m
Variance to authority
£m/%
EFC movement in quarter £m/%
Year-end actual £m
Year budget
£m
Variance to budget £m/%
89.1 152.9 102.9 -50.0 -48.6% - 43.0 47.9 4.9 10.2%
Future routes not yet authorised (Routes 4, 5 extension and 11). The variance is due to some rephasing across the programme. The junctions to be upgraded on CS3, CS7 and CS8 were reprioritised to ensure safety critical upgrades were undertaken.
73

Major highways enhancements
North-South Cycle Superhighway
Quarterly progress
Work proceeded well on construction of the North-South Cycle Superhighway and a large section of the route opened in April 2016. A new section of segregated cycle track opened on 24 March 2016 from Meymott Street to Upper Ground, which is just south of Blackfriars Bridge, providing open track from St George’s Road to the end of Upper Ground. Works north of Blackfriars Bridge in the City of London sections completed on 28 April 2016.
Resurfacing on Blackfriars Road was completed on 22 March 2016 and on Blackfriars Bridge and Blackfriars Junction post quarter end. The westbound slip road from Blackfriars to Victoria Embankment was closed permanently to vehicles and re-opened to cyclists only at the end of April 2016. Works on the eastbound slip road, which were being closely coordinated with the East-West Cycle Superhighway works, became two-way at the end of April 2016.
Blackfriars Road following resurfacing
Programme financial forecast Full life In year
Spend to end Quarter 4, 2015/16 £m
Estimated final cost (EFC) £m
Authority £m
Variance to authority
£m/%
EFC movement in quarter £m/%
Year-end actual £m
Year budget
£m
Variance to budget £m/%
14.1 17.5 17.5 - - 11.4 11.3 -0.1 -0.5%
74
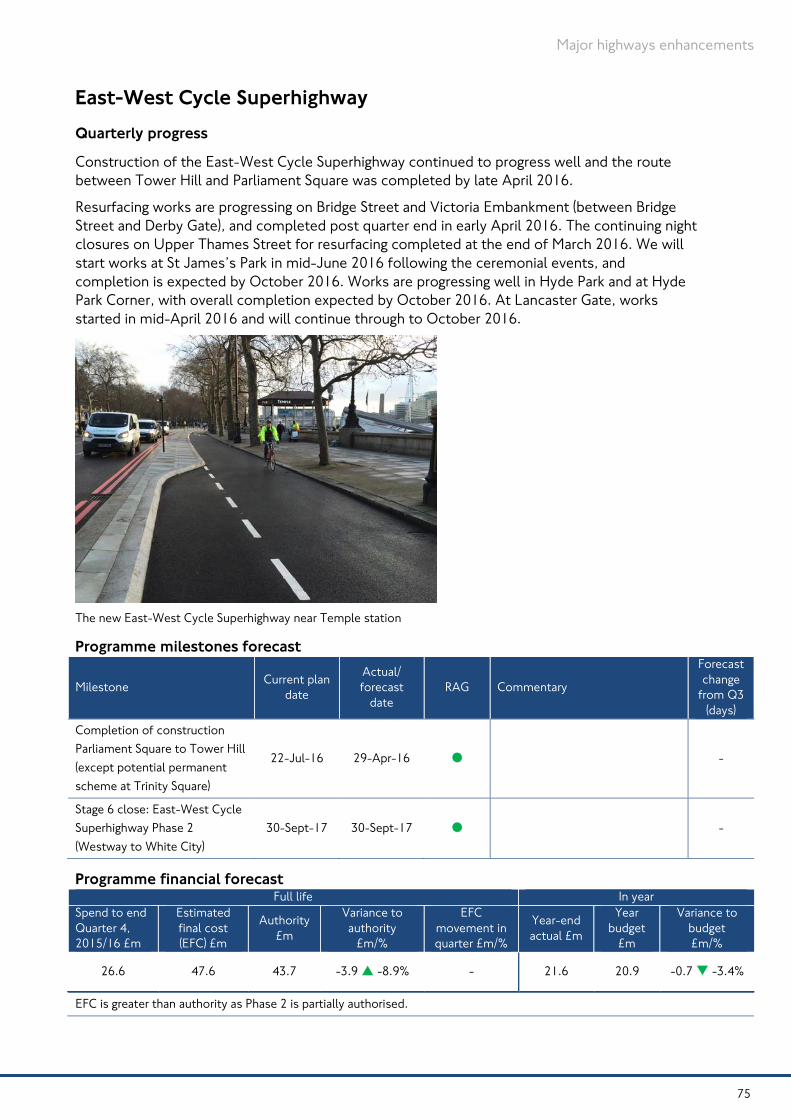
Major highways enhancements
East-West Cycle Superhighway
Quarterly progress
Construction of the East-West Cycle Superhighway continued to progress well and the route between Tower Hill and Parliament Square was completed by late April 2016.
Resurfacing works are progressing on Bridge Street and Victoria Embankment (between Bridge Street and Derby Gate), and completed post quarter end in early April 2016. The continuing night closures on Upper Thames Street for resurfacing completed at the end of March 2016. We will start works at St James’s Park in mid-June 2016 following the ceremonial events, and completion is expected by October 2016. Works are progressing well in Hyde Park and at Hyde Park Corner, with overall completion expected by October 2016. At Lancaster Gate, works started in mid-April 2016 and will continue through to October 2016.
The new East-West Cycle Superhighway near Temple station
Programme milestones forecast
Milestone Current plan date
Actual/ forecast
date RAG Commentary
Forecast change
from Q3 (days)
Completion of construction Parliament Square to Tower Hill (except potential permanent scheme at Trinity Square)
22-Jul-16 29-Apr-16 -
Stage 6 close: East-West Cycle Superhighway Phase 2 (Westway to White City)
30-Sept-17 30-Sept-17 -
Programme financial forecast Full life In year
Spend to end Quarter 4, 2015/16 £m
Estimated final cost (EFC) £m
Authority £m
Variance to authority
£m/%
EFC movement in quarter £m/%
Year-end actual £m
Year budget
£m
Variance to budget £m/%
26.6 47.6 43.7 -3.9 -8.9% - 21.6 20.9 -0.7 -3.4%
EFC is greater than authority as Phase 2 is partially authorised.
75

Borough Cycling Infrastructure Key cycling programmes, carried out with support of the London boroughs, which will directly contribute towards the objectives set out in the Mayor’s Vision for Cycling.
Cycling Mini-Hollands
Quarterly progress
Work continues in the three outer London boroughs of Enfield, Kingston and Waltham Forest to transform the town centres into cycling friendly places to live and travel around. Of the 101 schemes (96 infrastructure and five supporting measures), 49 per cent of designs have been submitted by the boroughs, and consultation has started on 21 per cent of schemes. Eight schemes are currently on site and under construction. Waltham Forest completed two schemes in Quarter 4: a pedestrian/cycle bridge by Lea Bridge Road and a cycle hub. Construction also started on the four kilometres of segregated cycle route on Lea Bridge Road and at Blackhorse Village. Construction continues on the Meridian Water to Enfield Town Quietway in Enfield and the Portsmouth Road segregated cycle track in Kingston is due to complete in July 2016.
Maintaining bus journey times in these busy outer London town centres while delivering meaningful change in conditions for cycling and walking remains challenging. The Lea Bridge Road scheme was approved at the Road Space Performance Group post quarter end on 22 April 2016.
Completed scheme at Pembroke Road/Orford Road in the London Borough of Waltham Forest
Programme milestones forecast
Milestone Current plan date
Actual/ forecast
date RAG Commentary
Forecast change
from Q3 (days)
Construction complete of first Mini-Holland scheme in Kingston
30-Nov-16 30-Oct-16 -
76

Borough cycling infrastructure
Programme financial forecast Full life In year
Spend to end Quarter 4, 2015/16 £m
Estimated final cost (EFC) £m
Authority £m
Variance to authority
£m/%
EFC movement in quarter £m/%
Year-end actual £m
Year budget
£m
Variance to budget £m/%
15.7 100.0 27.6 -72.4 -262.8% - 12.5 25.4 12.9 50.7%
Approval was given for £25.17m at the December 2014 Surface Board for the value of the programme in 2015/16. Further authority for the next tranche of design and construction spend will be sought in September 2016.
Expenditure reprofiling following review of programme and available resources. There was £2.6m of slippage in Kingston as no bids were received for main construction contracts.
Central London Grid
Overview
The Central London Grid is a dense mesh of Quietway and Superhighway-style cycle routes in central London designed to break down barriers to cycling. It spans 11 central London boroughs and involves the Royal Parks and Canal & River Trust as delivery partners.
Quarterly progress
Construction momentum has increased, with 44 of the 134 (increased from 125 in Quarter 3, owing to long links in Southwark being broken into smaller chunks for delivery) schemes either complete or under construction. This represents 22 per cent of the circa 85km of core grid network of Quietway links. A further 23 per cent has completed consultation.
We have received designs for 113 of the 134 schemes, and 106 schemes (circa 80 per cent) are approved for construction. We estimate that more than 60km of the core grid network will be complete by December 2016.
A completed Quietways scheme at Tower Bridge Road in the London Borough of Southwark
77

Borough cycling infrastructure
Programme milestones forecast
Milestone Current plandate
Actual/ forecast date RAG Commentary
Forecast change
from Q3 (days)
Phase 2 delivery completion 27-Feb-16 27-Feb-16 Complete -28
Phase 3 approval to commence construction
15-Mar-16 15-Mar-16 Complete
Some Phase 3 schemes were brought forward for early delivery under Phase 2 project authority when some Phase 2 schemes started construction in 2015 later than first planned due to unforeseen complexities. To keep within funding limits the remainder of the Phase 3 schemes were delivered later than originally planned and the milestone plan date has been revised from 30 May 2015 accordingly.
-
Phase 3 delivery completion 31-Dec-16 31-Dec-16 -
Stage D programme close certificate issued
30-Sept-17 30-Sept-17 -
Significant quarterly milestones movement
Milestone description Current plan date
Q4 forecast
date RAG Movement commentary
Forecast change
from Q3 (days)
Phase 3 design completion 31-Mar-16 31-Mar-16 Complete
The submission of designs for the final four Grid schemes (Hackney, Islington and two in Lambeth) have been delayed due to resourcing and links/dependencies with other programmes. This does not impact the forecast delivery completion dates for these schemes.
-122
Programme financial forecast Full life In year
Spend to end Quarter 4, 2015/16 £m
Estimated final cost (EFC) £m
Authority £m
Variance to authority
£m/%
EFC movement in quarter £m/%
Year-end actual £m
Year budget
£m
Variance to budget £m/%
11.7 54.4 16.7 -37.7 -225.7% -0.4 -0.7% 8.1 26.2 18.1 69.0%
An increase in project authority for the next stage of the programme will be sought at the July 2016 Surface Board, when updated costs will have been agreed with delivery partners.
Expenditure has been reprofiled as a result of continuing stakeholder consultation and reflects the latest delivery programme.
78

Borough cycling infrastructure
Cycling Quietways
Overview
The Quietways programme will provide a pan-London network of high quality cycle routes that will be clearly signed for easy use. Linking key destinations, they will include sections through parks, along waterways and tree-lined streets and will provide an alternative to cycling on busy main roads. They are being designed to appeal to new or inexperienced cyclists or those wishing to travel at a more leisurely pace, and so are considered vital to meeting the Mayoral cycling trip targets. The Quietways are being delivered in partnership with the London boroughs, Royal Parks and the Canal & River Trust.
Quarterly progress
Construction continues on the Quietway 1 (Q1) – Waterloo to Greenwich and Quietway 2 (Q2) – Bloomsbury to Walthamstow. Q1 is nearing completion and Q2, which was realigned at the request of the previous Cycling Commissioner, will be substantially complete in November 2016.
The flagship scheme at Millwall football ground, a new cycling and walking link using formally dormant Network Rail land, opened to the public post quarter end on 15 April 2016. The first Quietways directional signage has been installed on the Southwark section. In Brent, Quietway 3 – Regent’s Park to Gladstone Park is progressing well and is expected to complete in May 2016.Construction continues on Quietway 6 – Aldgate to Hainault in the London Boroughs of Redbridge and Newham. Construction on the remaining four Quietways in Phase 1 will continue throughout 2016.
Phase 2 of the Quietways programme, comprising 30 routes and three large interventions, has been batched into three sub-tranches to allow for timely delivery. Broadly, 2.1 schemes are located more in central London and 2.2 and 2.3 are further out so that a network is built up from the centre outwards. Phase 2 is progressing well, with designs received for schemes on three of the 13 Phase 2.1 routes. Route rides have taken place on two of the nine 2.2 routes.
Completed Q1 schemes: Millwall football ground (left) and Tabard Street in Southwark (right)
Programme milestones forecast
Milestone Currentplan date
Actual/ forecast
date RAG Commentary
Forecast change
from Q3 (days)
79

Borough cycling infrastructure
Completion of first two routes 31-Dec-16 30-Nov-16 -
Milestone Current plan date
Actual/ forecast
date RAG Commentary
Forecast change
from Q3 (days)
Stage D programme close certificate issued
31-Mar-19 31-Mar-19 -
Programme financial forecast Full life In year
Spend to end Quarter 4, 2015/16 £m
Estimated final cost (EFC) £m
Authority £m
Variance to authority
£m/%
EFC movement in quarter £m/%
Year-end actual £m
Year budget
£m
Variance to budget £m/%
12.7 121.7 42.7 -79.0 -185.0% - 11.0 32.6 21.6 66.4%
Following a review by the Independent Investment Programme Advisory Group (IIPAG) in which no critical issues were raised, Surface Board granted approval in November 2015 for an additional £28.04m project authority to fund the construction of Q3 to Q7 plus some early work on Phase 2 routes.
Reprofiling of the next tranche of Quietway routes into later years, and some redesigning of current schemes, as a result of continuing stakeholder consultation.
80

Network Performance and Safety Portfolio Maximising the performance of the existing network for all users: improving safety, journey time reliability, bus reliability and supporting freight.
Bus network performance These schemes will improve bus journey time and reliability across London.
Bus Priority Delivery Portfolio
Overview
The 2015/16 programme includes implementation of 72 bus priority schemes on the Transport for London Road Network (TLRN) and borough roads. This programme prioritises the delivery (subject to consultation and feasibility outcomes) of 66 Road Modernisation Plan (RMP) bus mitigation schemes to ease, as far as possible, the permanent impacts along the bus corridors most affected by the RMP. This includes delivery of six bus priority schemes and development of future schemes for the 2016/17 programme.
Quarterly progress
The Bus Priority Delivery Portfolio has progressed significantly in Quarter 4. The annual target of 72 schemes in the 2015/16 financial year has been exceeded, with 77 schemes completed in total. Queenstown Road scheme was delivered in January 2016 and is showing savings of up to 1.5 minutes in each direction. Camden Road scheme was delivered in March 2016.
Phase 2 construction works completed on schedule at Brentfield Road, despite encountering a number of challenging and unexpected road conditions. Remaining signal installation works continue as planned and are expected to complete by the end of May 2016. Detailed design continues for the Loampit Vale scheme, with construction starting early in the 2016/17 financial year and completion expected in August 2016.
The 2016/17 programme was endorsed at Surface Board on 15 March 2016. The baselined 138 bus priority 2016/17 schemes will be presented to Surface Board in July 2016, with a proposal for more that could be delivered in 2016/17 with additional resources.
Removal of one of four redundant fuel tanks and construction activities in progress at the Brentfield Road scheme
81

Network performance and safety
Programme milestones forecast
Milestone Currentplan date
Actual/ forecast
date RAG Commentary
Forecast change
from Q3 (days)
2016/17 programme approved
31-Mar-16 15-Mar-16 Complete 16
Stage 5 – reliability pilot schemes on TLRN completed
31-Mar-16 27-May-16
The Brentfield Road scheme was due to be implemented in October 2015, however, the traffic management of the Neasden Super Scheme has taken precedence over the Brentfield Road scheme, which is in close proximity. We are working collaboratively with the London Borough of Brent in delivering its Neasden scheme to better use road space and minimise disruption to road users.
-
Stage D programme close certificate issued
31-Mar-21 31-Mar-21 -
Programme financial forecast Annual In year
Spend to end Quarter 4, 2015/16 £m
Estimated final cost (EFC) £m
Authority £m
Variance to authority
£m/%
EFC movement in quarter £m/%
Year-end actual £m
Year budget
£m
Variance to budget £m/%
8.0 8.0 11.9 3.9 32.8% -0.5 -6.7% 8.0 18.1 10.1 55.8%
Surface Board approved £8.08m of additional project authority in July 2015, giving an in year project authority of £11.9m.
Expenditure has been reprofiled due to some savings from feasibility and design being picked up by other programmes.
82

Network performance and safety
Road network performance By investing in equipment to help us monitor and respond to traffic, we can improve the capacity of the road network.
Road space management SCOOT
Quarterly progress
We continue working to achieve the next milestone for ‘900 sites available for enabling (cumulative)’ ahead of the 28 July 2016 plan date. Enabling is a key deliverable which means the unit is ready to activate.
On-street installation of SCOOT detection equipment
Programme milestones forecast
Milestone Current plandate
Actual/ forecast
date RAG Commentary
Forecast change
from Q3 (days)
A total of 900 sites available for enabling (cumulative)
28-Jul-16 02-Jun-16 -28
A total of 900 sites enabled (cumulative)
28-Oct-16 02-Sep-16 -28
A total of 1,200 sites available for enabling (cumulative)
30-Jun-17 05-May-17 -
A total of 1,200 sites enabled (cumulative)
29-Sept-17 04-Aug-17 -
A total of 1,500 sites available for enabling (cumulative)
29-Jun-18 29-Mar-18 -
Enabling completed for 1,500 sites (cumulative) (Annex B: 2018)
30-Sept-18 31-Aug-18 -
Stage 3D certificate issued (portfolio close stage)
31-Dec-18 30-Nov-18 -
83

Network performance and safety
Programme financial forecast Full life In year
Spend to end Quarter 4, 2015/16 £m
Estimated final cost (EFC) £m
Authority £m
Variance to authority
£m/%
EFC movement in quarter £m/%
Year-end actual £m
Year budget
£m
Variance to budget £m/%
19.7 34.2 34.2 - - 7.9 6.0 -1.9 -31.4%
Surface Intelligent Transport System (SITS)
Overview
SITS, once implemented, will replace a number of existing systems in an integrated way and is expected to result in a significant reduction in traffic delays. It will release more capacity from the road network and allocate this according to policy. It will invest in new sensors to collect more information than is currently possible, provide new methods of data sharing and storage, and allow new systems to access and use information.
Quarterly progress
Following our work in Quarter 3 to start writing and then review the requirements, we have concluded the review. This has resulted in further updates on quality and consistency, which will complete in Quarter 1 ready for a final review ahead of the start of the procurement process.
We finalised the draft of the procurement strategy for an Integrated Assurance Review (IAR), which started in late February 2016, and started work on the skeleton contract terms and conditions and core commercial topic areas (such as intellectual property rights and contract delivery/transition positions).
Programme milestones forecast
Milestone Current plan date
Actual/ forecast
date RAG Commentary
Forecast change
from Q3 (days)
Roll out of LondonWorks completed
21-Oct-16 29-Jul-16 -
Procurement commenced 25-Feb-17 31-Dec-16 -
Programme financial forecast Full life In year
Spend to end Quarter 4, 2015/16 £m
Estimated final cost (EFC) £m
Authority £m
Variance to authority £m/%
EFC movement in quarter £m/%
Year-end actual £m
Year budget
£m
Variance to budget £m/%
3.7 133.6 5.8 -127.8 -2,203.4% - 2.1 2.6 0.5 20.0%
The project authority increase to £5.8m was approved by the Board in September 2015 to allow the programme to release an OJEU notice in July 2016. We are requesting project authority in stages.
84

Operations and Environment Portfolio This portfolio directly supports Surface Transport’s service delivery through contract re-let and business transformation, delivering improvements to air quality, the natural environment, reducing CO2 and the impacts of noise.
London Road User Charging (LRUC) and Traffic Enforcement Notice Processing (TENP) Contract Re-let Project The re-let of contracts for Traffic Enforcement Notice Processing (TENP) (from June 2015) and London Road User Charging (LRUC) (from May 16) to consolidate and simplify the services after the expiry of the current contracts, which includes extension of the current LRUC contract to align the two service contracts.
Quarterly progress
Capita completed the LRUC system development and configuration and started service proving of its solution. Owing to the volume of defects identified during service proving, Capita now forecasts to complete this in mid 19 June 2016. Within this phase of testing, we need to be assured that Capita is able to meet the performance requirements for both the back office and web elements of the solution. System integration testing of the LRUC web service continues and is forecast to complete by early July 2016. Delivery of the LRUC web for the go-live remains challenging owing to the volume of defects that are being identified as the web interfaces with the Capita solution.Owing to system performance issues and the late LRUC web delivery, the LRUC solution is forecast to go live by 1 August 2016. We have agreed a remedy programme delivery plan with Capita to achieve the revised go-live date and have extended the contracts with the existing supply chain to ensure the current LRUC service is not impacted.
Congestion Charging (CC) signage
Programme milestones forecast
Milestone Current plandate
Actual/ forecast
date RAG Commentary
Forecast change
from Q3 (days)
CC/Low Emission Zone system development and configuration complete
28-Aug-15 17-Mar-16 Complete
The milestone was delayed following critical system development and testing issues.
-24
85
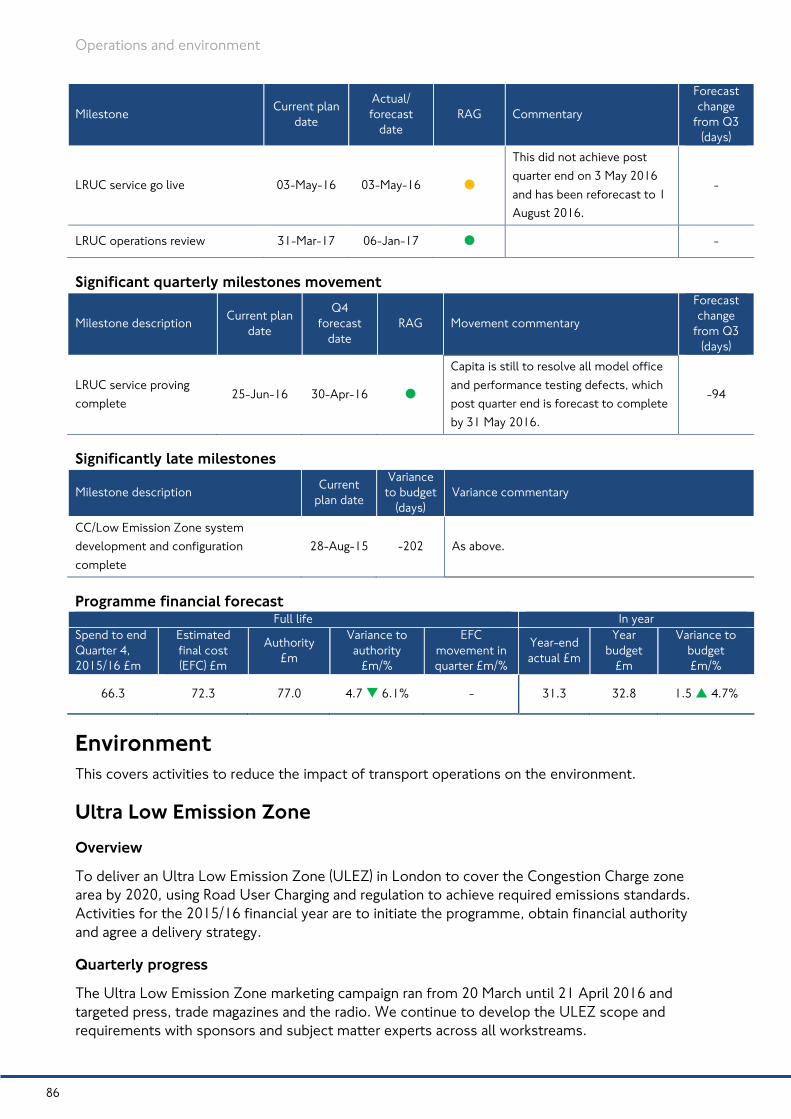
Operations and environment
Milestone Current plan date
Actual/ forecast
date RAG Commentary
Forecast change
from Q3 (days)
LRUC service go live 03-May-16 03-May-16
This did not achieve post quarter end on 3 May 2016 and has been reforecast to 1 August 2016.
-
LRUC operations review 31-Mar-17 06-Jan-17 -
Significant quarterly milestones movement
Milestone description Current plan date
Q4 forecast
date RAG Movement commentary
Forecast change
from Q3 (days)
LRUC service proving complete
25-Jun-16 30-Apr-16
Capita is still to resolve all model office and performance testing defects, which post quarter end is forecast to complete by 31 May 2016.
-94
Significantly late milestones
Milestone description Current plan date
Variance to budget
(days) Variance commentary
CC/Low Emission Zone system development and configuration complete
28-Aug-15 -202 As above.
Programme financial forecast Full life In year
Spend to end Quarter 4, 2015/16 £m
Estimated final cost (EFC) £m
Authority £m
Variance to authority
£m/%
EFC movement in quarter £m/%
Year-end actual £m
Year budget
£m
Variance to budget £m/%
66.3 72.3 77.0 4.7 6.1% - 31.3 32.8 1.5 4.7%
Environment This covers activities to reduce the impact of transport operations on the environment.
Ultra Low Emission Zone
Overview
To deliver an Ultra Low Emission Zone (ULEZ) in London to cover the Congestion Charge zone area by 2020, using Road User Charging and regulation to achieve required emissions standards. Activities for the 2015/16 financial year are to initiate the programme, obtain financial authority and agree a delivery strategy.
Quarterly progress
The Ultra Low Emission Zone marketing campaign ran from 20 March until 21 April 2016 and targeted press, trade magazines and the radio. We continue to develop the ULEZ scope and requirements with sponsors and subject matter experts across all workstreams.
86

Operations and environment
On 30 March 2016, following approval at Surface Board, we issued an OJEU invitation for applicants to tender for the installation framework to deliver a rapid charge point network in London. We held initial discussions with the DfT to begin to finalise the road signage needed to operate the scheme, which is planned to start in 2020.
The ULEZ Programme Board agreed delivery targets to develop delivery options for the introduction of the taxi ‘top up’ grant and delicensing scheme early in 2017.
Proposed Ultra Low Emission Zone
Programme milestones forecast
Milestone Current plandate
Actual/ forecast
date RAG Commentary
Forecast change
from Q3 (days)
Submit application to TfL Board for project authority
17-Dec-15 17-Dec-15 Complete -
Scheme live 07-Sept-20 07-Sept-20 -
Programme financial forecast Full life In year
Spend to end Quarter 4, 2015/16 £m
Estimated final cost (EFC) £m
Authority £m
Variance to authority
£m/%
EFC movement in quarter £m/%
Year-end actual £m
Year budget
£m
Variance to budget £m/%
2.1 422.0 12.0 -410.0 -3,416.7% - 2.6 1.2 -1.4 -116.7%
Initial authority was granted by the Board in December 2015.
Cycle hire Re-letting the cycle hire contract to deliver an improved customer proposition, operating model and supply chain, ultimately leading to integration of the cycle hire back office with Oyster/contactless payment card back office systems.
87

Operations and environment
Cycle hire re-let
Quarterly progress
Procurement authority was approved by the Board in December 2015 to integrate some of the cycle hire services into the revenue collection contract (RCC) with Cubic Transportation Systems. We also secured the rights to a perpetual licence for the intellectual property rights in the scheme hardware from Public Bike Service Company (PBSC).
We worked with Serco (the incumbent) and Cubic to develop a plan to disaggregate the current services at contract transition, defining the interface specifications between the various services and identifying which services can be transferred early to reduce risk, including those which will in future be provided by us via existing service channels.
The invitation to participate (ITP) for the bike supply and maintenance contract completed in January 2016. Two bids were received, evaluated and led to a five-week period of competitive dialogue. We published the invitation to supply (ITS) as planned post quarter end on 5 April 2016.
We are undertaking a review of the cost plan against the initial project authority in preparation for a procurement authority request in July 2016 for most other elements of the project.
A Santander Cycles maintenance van
Programme milestones forecast
Milestone Current plan date
Actual/ forecast
date RAG Commentary
Forecast change
from Q3 (days)
Invitation to submit 28-Apr-16 31-Mar-16 -
Transition into service 30-Aug-17 30-Aug-17 -
System go live 31-Dec-18 31-Dec-18 - Project completion and handover certificate approved 30-Jun-19 30-Apr-19 -
Programme financial forecast Full life In year
Spend to end Quarter 4, 2015/16 £m
Estimated final cost (EFC) £m
Authority £m
Variance to authority
£m/%
EFC movement in quarter £m/%
Year-end actual £m
Year budget
£m
Variance to budget £m/%
8.4 51.8 51.8 - - 6.2 10.2 4.0 39.2%
88

Operations and environment
Bus operations Although much of the on-going renewal of the bus fleet is carried out as part of the bus contract and tendering process, there are cases where we look to deliver additional improvements, for example, investment in the New Routemaster (NRM) and making the existing fleet cleaner and greener.
New Routemaster
Quarterly progress
We have delivered 743 NRM buses into service by the end of Quarter 4 following the successful conversion of routes 168, 68, 3 and 59. A total of 21 routes are using NRM buses, which increases the total number of Euro VI engine vehicles in service to 477.
A New Routemaster on Westminster Bridge
Programme milestones forecast
Milestone Current plan date
Actual/ forecast
date RAG Commentary
Forecast change
from Q3 (days)
Delivery of 600 buses into service
31-Oct-15 31-Oct-15 Complete -
Delivery of 800 buses into service
31-Jul-16 31-Jul-16 -
Programme financial forecast Full life In year
Spend to end Quarter 4, 2015/16 £m
Estimated final cost (EFC) £m
Authority £m
Variance to authority
£m/%
EFC movement in quarter £m/%
Year-end actual £m
Year budget
£m
Variance to budget £m/%
270.0 346.7 346.7 - -62.2 -20.6% 104.3 110.0 5.7 5.2%
Additional authority of £62.2m was approved by the Board on 3 February 2016 for the purchase of up to 195 additional New Routemasters. The EFC, which include the cost of the prototypes, has increased accordingly.
The year-end actual is less than budget as a result of delivery schedule reprofiled to spread deliveries more evenly into London giving TfL greater ability to absorb the new buses into the fleet.
89

Operations and environment
Financial Performance
Northern Line Extension tunnel boring
87
Financial Performance
Northern line extension tunnel boring machine at the manufacturing facility in Creusot, France

91
Financial performance Over the full year, investment expenditure was £169m lower than budget, a variance of five per cent. Project costs of £552m have been rephased to future years (offset by an overprogramming provision of £384m), offset by £50m of net cost increases.
Table 1: Investment programme financials, 2015/16
TfL Group Year to date Full year 2015/16
£m Actual Budget Variance to budget
Quarter 3 forecast
Variance to budget
London Underground (1,309) (1,375) 66 (1,287) (22)
London Rail (including TfL Rail) (233) (301) 68 (284) 51
Surface Transport (700) (722) 22 (707) 6
Shared Services (Corporate) (537) (550) 13 (578) 41
Total Investment Programme (2,780) (2,948) 169 (2,856) 76
Table 2: Investment Programme causal analysis, full year variance to budget, 2015/16
Tfl Group (£m)
Full year variance to budget
Acceleration 12
Cost increases (116)
Cost decreases 66
Overprogramming (384)
Rephasing 552
Contingency 21
Reclassification (14)
Other 31
Total variance 169

Financial performance
92
LU Investment Programme (IP) expenditure was £66m lower than budget for the year. This was predominantly due to £178m of project rephasing offset by cost increases of £112m. Rephasing includes:
£113m on Four Lines Modernisation driven by the Automatic Train Control (ATC)programme reflecting the alignment to the new ATC signalling contractor's schedule postcontract award, alignment of the associated enabling works and design delays which haveslowed down procurement
£54m in non-capital programmes with rephasing across a number of projects including Fit forthe Future – Stations, Predict & Prevent programme, and ICTT
£47m relating to infrastructure renewals including Sub-Surface line (SSL) power upgrade, LUlifts and escalators, plant strategy, and Legacy train renewals
£33m relating to Metropolitan line extension due to delays in the transition of deliveryobligations from Hertfordshire County Council to TfL
£16m within stations comprising an underspend of £31m, including Vauxhall, AssetDevelopment and the Stations Work Improvement programme, offset by £15m acceleratedspend on property compensation and acquisition on Bank station where the TWAO wassecured earlier than anticipated
£13m within World Class Capacity including minor delays on the Victoria line upgrade
Project rephasing was partly offset by the release of the £224m overprogramming provision
In addition, there were cost increases of £112m including:
£64m from the Metropolitan line extension, which we will now deliver
£38m for the Northern line upgrade programme due to the re-assessment of the scoperequired to deliver the agreed benefits
LR/TfL Rail capital expenditure was £68m lower than budget for the year. This was largely due to the following reductions:
£35m rephased expenditure in TfL Rail mainly due to rolling stock milestone re-profiled
£35m delayed spend across LO including delayed station works, lower spend on renewalsand enhancements, reprofiled Gospel to Barking electrification project and delay in awardingWest Anglia station works contract
£19m DLR costs rephased due to rebranding costs, Your Railway and Customer Experienceproject slippage including Blackwall stairs, remotely operated vehicle canopies, Limehouseescalator and East India urban realm, plus other smaller variances across the area
Project rephasing was partly offset by the release an overprogramming provision of £8m
The delayed expenditure was partly offset by £14m increase due to operating expenditurereclassified as capital.
Surface Transport gross IP expenditure was £22 million lower than budget. The £154m underspend was almost exactly offset by the level of overprogramming (£152m). Therefore the majority of the variance was the unused management contingency (£21m).

Financial performance
93
Net future year scheduling of £112million:
Borough cycling schemes had £53m rescheduled into future years for London Cycling Grid, Quietways and Mini-Holland projects were rebaselined allowing additional time to design routes and schemes in order to ensure optimal cycling outcomes
£15m rephasing on Surface Transport’s four road-over-rail bridge renewal projects, due toNetwork Rail possession and design approval issues
Bus Priority schemes – £10m variance due largely to construction plans slipping into2016/17 on a number of schemes as a result of continuing stakeholder engagement
£10m slippage on the Better Junctions programme, including Westminster Bridge (south) which was delayed to allow for further consultation with stakeholders, plus reprioritisation
across the programme. Spend has been deferred to later years
Other re-phasing included £6m on New Routemaster as a result of the production schedulebeing reprofiled to spread deliveries more evenly into London, which gives us an improvedability to absorb the new buses into the fleet. £3m was deferred on Woolwich Ferry Phase 2upon selection of the favoured option to procure two vessels. There was also a reprofiling of£4m on the Safety Camera Replacement programme, which will complete in 2016/17
The above items were partially offset by £12m of accelerated spend on the Asset CapitalProgramme, bringing forward funds from 2016/17 to deliver additional works
As well as £21m of unused management contingency, there were cost reductions of £40macross a range of different projects. The key material items being: £14m of unutilised riskbudgets upon completion of major asset renewal project, namely Hammersmith Flyover,Fore Street Tunnel, Chiswick Bridge and Woodlands Retaining Wall
Shared services capital expenditure is £13m lower than budget for the full year. The main spend was for the purchase of Earls Court joint venture loan notes. Over the full year, expenditure is £13m under budget, largely a result of project rephasing including End User Computing, Stratford Hub and the Future Ticketing project. In addition, £6m of project contingency is no longer required. This rephasing and cost reduction has been partly offset by £4m for the purchase of hardware for the Data Consolidation project, supporting Oyster and Contactless ticketing systems.
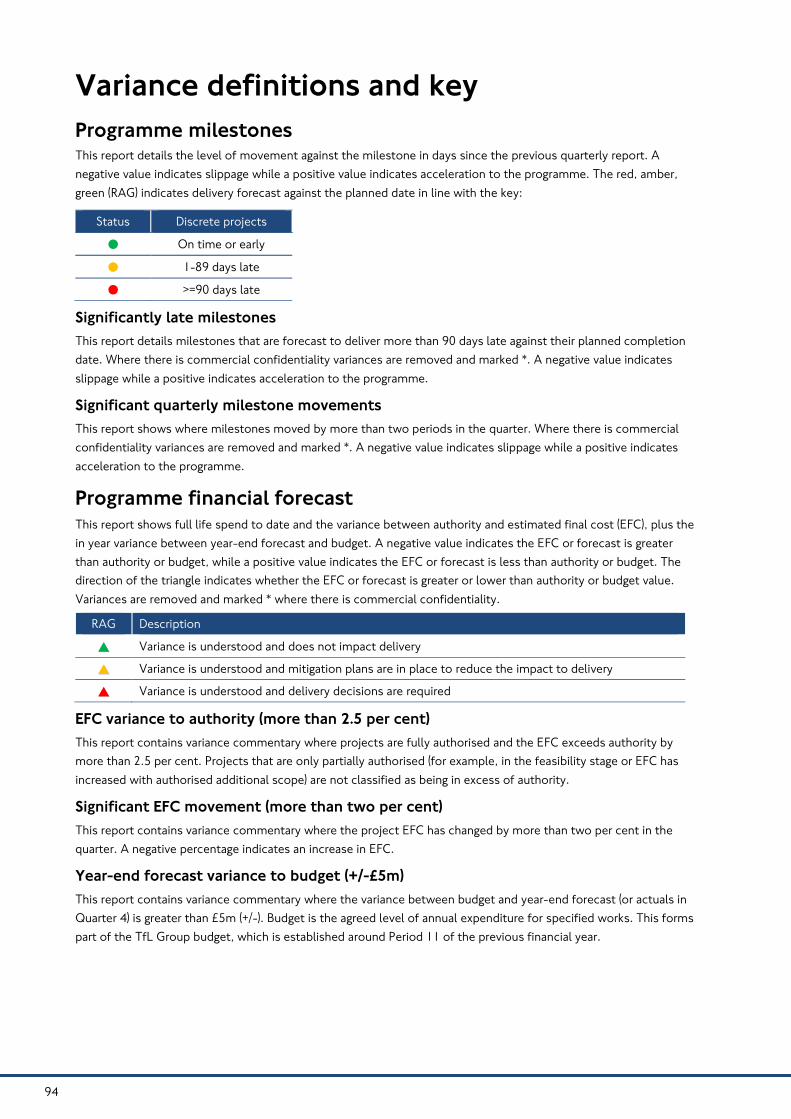
Variance definitions and key Programme milestones This report details the level of movement against the milestone in days since the previous quarterly report. A negative value indicates slippage while a positive value indicates acceleration to the programme. The red, amber, green (RAG) indicates delivery forecast against the planned date in line with the key:
Status Discrete projects
On time or early
1-89 days late
>=90 days late
Significantly late milestones This report details milestones that are forecast to deliver more than 90 days late against their planned completion date. Where there is commercial confidentiality variances are removed and marked *. A negative value indicates slippage while a positive indicates acceleration to the programme.
Significant quarterly milestone movements This report shows where milestones moved by more than two periods in the quarter. Where there is commercial confidentiality variances are removed and marked *. A negative value indicates slippage while a positive indicates acceleration to the programme.
Programme financial forecast This report shows full life spend to date and the variance between authority and estimated final cost (EFC), plus the in year variance between year-end forecast and budget. A negative value indicates the EFC or forecast is greater than authority or budget, while a positive value indicates the EFC or forecast is less than authority or budget. The direction of the triangle indicates whether the EFC or forecast is greater or lower than authority or budget value. Variances are removed and marked * where there is commercial confidentiality.
RAG Description
Variance is understood and does not impact delivery
Variance is understood and mitigation plans are in place to reduce the impact to delivery
Variance is understood and delivery decisions are required
EFC variance to authority (more than 2.5 per cent) This report contains variance commentary where projects are fully authorised and the EFC exceeds authority by more than 2.5 per cent. Projects that are only partially authorised (for example, in the feasibility stage or EFC has increased with authorised additional scope) are not classified as being in excess of authority.
Significant EFC movement (more than two per cent) This report contains variance commentary where the project EFC has changed by more than two per cent in the quarter. A negative percentage indicates an increase in EFC.
Year-end forecast variance to budget (+/-£5m) This report contains variance commentary where the variance between budget and year-end forecast (or actuals in Quarter 4) is greater than £5m (+/-). Budget is the agreed level of annual expenditure for specified works. This forms part of the TfL Group budget, which is established around Period 11 of the previous financial year.
94