Quart YSTAC - NASA · Quart YSTAC NORTHEAST :RADIO 2018-08-06T16:22:23+00:00Z. QUARTERLY REPORT OF...
29
Quart YSTAC NORTHEAST :RADIO https://ntrs.nasa.gov/search.jsp?R=19710024085 2018-09-13T04:51:17+00:00Z
Transcript of Quart YSTAC - NASA · Quart YSTAC NORTHEAST :RADIO 2018-08-06T16:22:23+00:00Z. QUARTERLY REPORT OF...

Quart
YSTAC
NORTHEAST :RADIO
https://ntrs.nasa.gov/search.jsp?R=19710024085 2018-09-13T04:51:17+00:00Z

QUARTERLY REPORT
OF THE
HAYSTACK OBSERVATORY
NORTHEAST RADIO OBSERVATORY CORPORATION
1 5 A p r i l 1971
Operated under A g r e e m e n t w i t h
MASSACHUSETTS I N S T I T U T E OF TECrnOLOGY
ACKNOWLEDGMENT
The programs i n r ad io astronomy a r e conducted w i t h support from
tYie TJat i o n a l Science Foundat i on under Grants GP-16918 and GP-25865.
The p l a n e t a r y r a d a r i n v e s t i g a t i o n s a r e supported under Grant
"'r;? 22-174-003 from t h e National Aeronautics and Space Administrat ion.
Radar s t u d i e s of t h e moon a r e conducted under Contract
MAS 9-7830 wi th NASA Manned Spacecraf t Center, Houston, Texas.

ABSTRACT
During t h i s quazter, radar a,stronomy observations occupied Ha.ystack f o r 101 hours a.s a,gainst 1171 hours f o r ra,dio as t ronow and 390 i n maintenance and improvement.
Of pa.rticula,r i n t e r e s t a r e observations of quasax 3C279 using VLBI techniques which make it appear t h a t components of t h i s object a.re separa t i~ ig a t 10 times the speed of l i g h t . This s t a , r t l ing r e s u l t i s the subject cf considerable speculat ion a.s t o possible expla,na,tions .
The topographic contour ma.pping of the moon using the Haystack-Westford radar interferometer has produced the highest resolut ion r e su l t s ye t ob t a i ced (80 - 210 meters between contours) . Analysis of the r e s u l t so f a r h a s emphasized the area, a,round c r a t e r s Alphonsus, Arzachel and Ptolemaeus, t h e f l oo r s of which a re a,t markedly d i f f e r en t l eve l s .
Reduction of 5 years of high accuracy Venus ranging da,ta has yielded a. good measure of the large-scale equa tor ia l topogra,phy of thak p lane t . Va.ri- a t ions over a height i n t e rva l of 5 k m have been found, which cor re la te welL with the observed gross va r i a t i on of the 3.8-cm rada,r cross sect ion.

NORTHEAST M D I O OBSERVATORY CORPORATION
A nonprofit corporation of educational and research institutions formed in June 1967 to continue the planning initiated by the Cambridge Radio Observatory Committee for an advanced radio and radar research facil- ity. In March 1969, by agreement with MIT and Lincoln Laboratory, i ts interest was extended to the existing Haystack Research Facility to seek means of increasing i t s availability for research. Since July 1970, NEROC has directed the research at Haystack and has had the pr imary role in arranging for support.
NEROC Institutions
Boston Uni~iersit y Brandeis University Brown University Dartmouth College Harvard University Massachusetts Institute of Technology Polytechnic Institute of Brooklyn Smithsonian Astrophysical Observatory State University of New York at Buffalo State University of New York at Stony Brook University of Massachusetts University of New Hampshire Yale University
Officers
Chairman Vice Chairman Vice Chairman (Haystack) Executive Director Engineering Director Director, Haystack Obs. Treasurer Secretary
Jerome B. Wiesner Edward M. Purcel l - William M. Irvine Edward Lille y Herbert G. Weiss Paul B. Sebring Paul V. Cusick Joel Grlen
Haystack Observatory Office
'$Alan H. Barrett , MIT "William A. Dent, University of Massachusetts 7 William M. Irvine, University of Massachusetts
7':' Edward Lilley, Harvard University Francis H. McGrory, MIT
*'M. Littleton Meeks, MIT, Sec'y, Scientific Committee 7 Joel Orlen, MIT '$Gordon H. Pettengill, MIT, Chmn, Scientific Committee
7':' Paul B. Sebring, MIT, Chairman :'; Irwin I. Shapiro, MIT
McAllister Hull, State University of New York at Buffalo
'I: Scientific Committee
7 Executive Committee

CONTENTS
Abstract
Northeast Ra,dio Observatory Corporation
I. Introduction
11. Radio Astronomy
A. Summa,ry of Programs
B. Accounts of Selected Programs
C. Radiometric Instrumentation
111. Radar Astronomy
A. Lunar Topography
B. Venus a,nd Mercury
C. Planning of Man Obsewa,tions
D. Ra,dar Instrumentation
REFERENCES
APPENDIX - Publications for Janua.ry-March 1971
iii

I. INTRODUCTION
The period of time covered by t h e present Qua.rterly Report (1 Ja,nua.ry - 3 1 Ma,rch 1971) sa,w t h e Pla,netary Ra,dar Box on t h e antenna, from 1-15 Ja.nxa.ry and a,ga.in from 8 February t o 12 Ma,rch. A t o t a l of 101 hours was spent i n ra.da.r observat ions, a.s compa.red t o 1171 i n ra,dio astronomy and 390 i n n;s.ln-he- na.nce and improvement. The ra.da,r usa.ge would hame been higher excep"c~"o a. motor f a . i lure i n t h e t r a n s m i t t e r cooling system, which precluded a number c>f planned ra.da.r ob s erva.tions .
It seems fa , i r t o sa,y a.t t h i s po in t tha,t t h e adminis t ra t ive procedure; f o r opera.tion of t h e Haystack Observatory by NEROC a r e working wel l . The pressure f o r observing time, p a r t i c u l a r l y when c e r t a i n por t ions of t h e Galaxy axe i n view, has been increa.sing, with consequent exerc ise of t h e rnecha.nis-n f o r processing these reques ts . This mecha,nism i s t h e r e s p o n s i b i l i t y of the Ha,ysta,ck S c i e n t i f i c Advisory Committee (HAYSAC), and normally r e s u l t s i n -\:e1.37 l i t t l e delay i n a,ccomodating t h e experimenter 's needs.
11. RADIO ASTRONOMY
A . Summa,ry of Programs
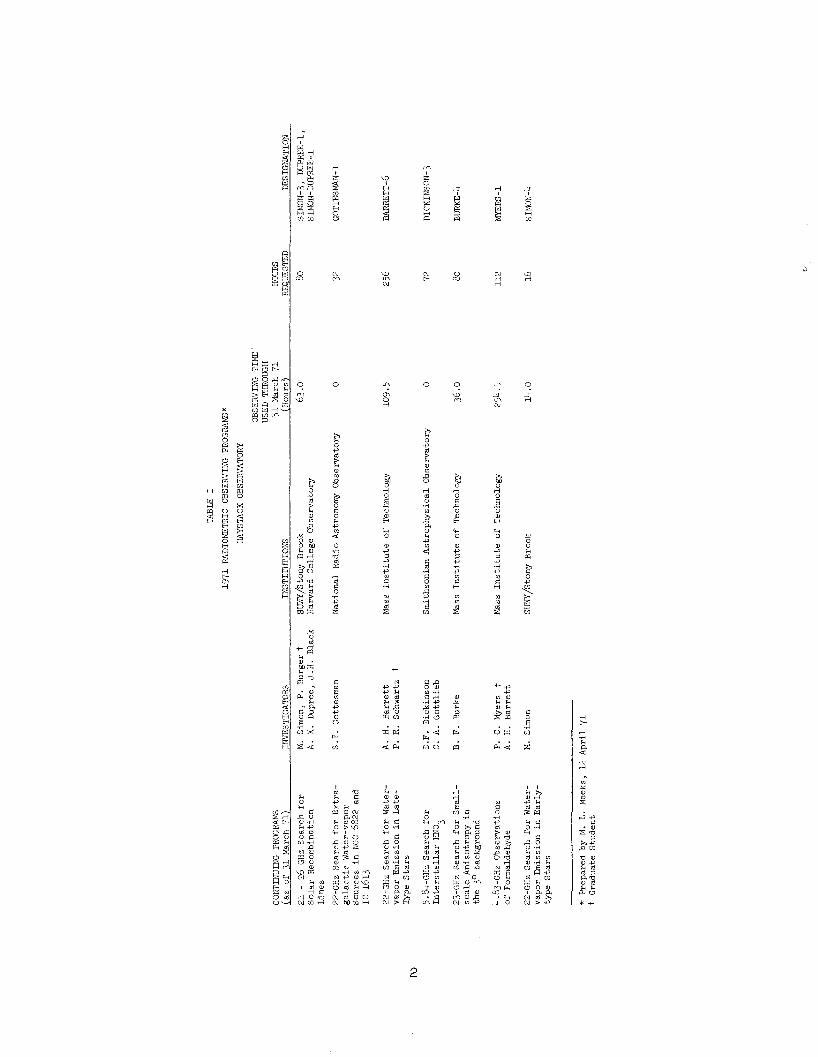
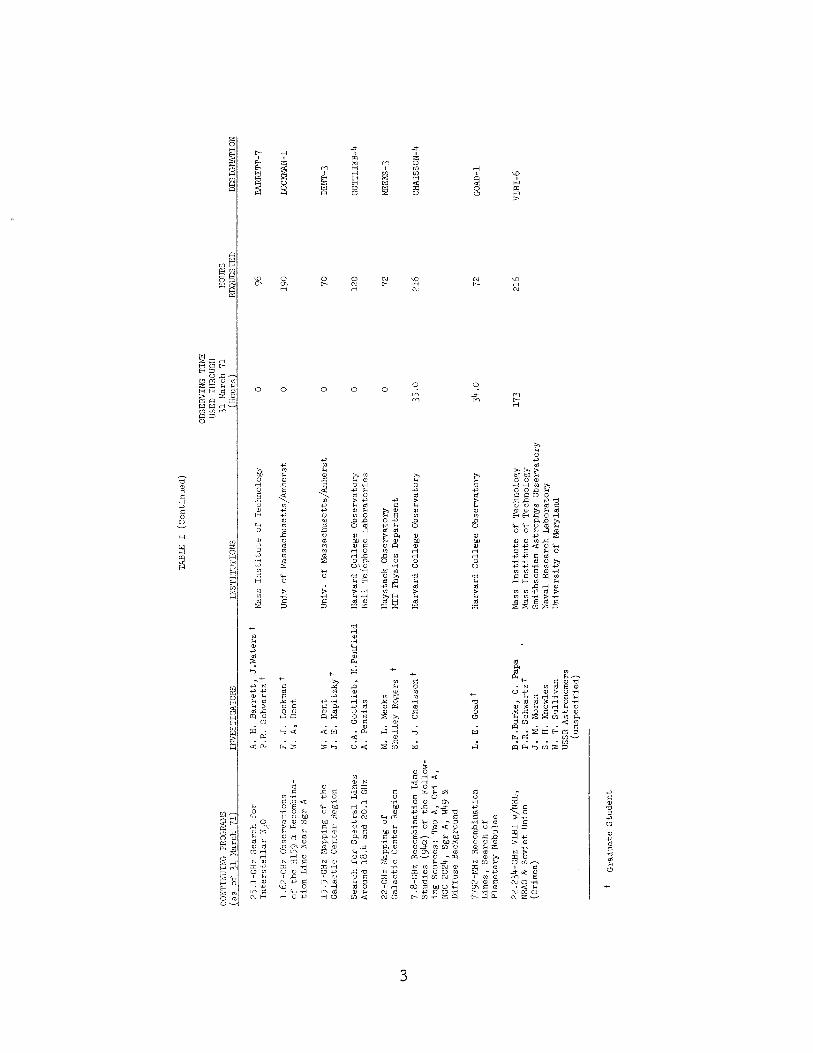
During t h e f i r s t qua,rter of 1971, Ha,ystack Observa,tory received twelve new proposa,ls f o r observing programs. Ten of t h e new programs involve spectr8. l l i n e observa,tions o r sea,rches f o r new molecu1a.r t r a n s i t i o n s . I n a.dditiou?, t eg programs a,re continuing over from 1970, and s i x more progra,ms, begun i n 1970, were completed during t h e f i r s t qua,rter of 1971. A l l of t hese progra,!ns a,:re surnrna.rized i n Table I, which includes t h e names of inves t iga . tors , t h e i r r e spec t ive i n s t i t u t i o n s , t h e cumula.tive a,mount of observing time used, and the amount of time requested. Table I i s divided i n t o Continuing Pr0gra.m~ and. Completed Programs.
E . Accounts of Se lec ted Programs
We ha,ve chosen a, few rep resen ta t ive programs from Table I i n order t o present a, somewha.t more d e t a i l e d a,ccount of t h e reseaxch conducted a-t Ha,yxzack 0bserva.tor-y during t h e l a s t qua r t e r . These sketches, ed i t ed from the exper i - menters ' notes , axe organized under t h e following hea,dings : Spectra.l-Line Programs , Continuum Programs, and VLBI Progra,ms . I n a,ddition, t h e 0bserva.tory ha.s improved t h e poin t ing p rec i s ion of t h e te lescope by means of a, more s.ccura,te ca.libra.tion of t h e instrumenta,l e r r o r s ; we include a.n axcount of t h i s sysi;en upgra.ding i n t h e sec t ion on Continuum Pr0gra.m~.
CO
I'ITIN
UIN
G P
R0G
RA
I.E
las
of
31
Mar
ch
71
)
21
- 2
6 G
Hz
Se
arc
h f
or
So
lar
Rec
om
bin
atio
n
Lin
es
22-G
Hz
Searc
h f
or
Ex
tra
- g
ala
cti
c W
ater
-vap
or
So
urc
es
in
NG
C 6822
and
IC
1
61
3
19
71
RA
DIO
hBTR
IC
OB
SER
VIN
G
PRO
GR
AbS
*
HA
YST
ACK
O
BSE
RV
ATO
RY
OB
SER
VIN
G
TIM
E '
USE
D
THRO
UG
H
31
Mar
ch 7
1
HOURS
IN
VEST
IGA
TO
RS
INST
ITL
ITIO
NS
(Ho
urs
) R
EQU
ESTE
D
DES
IGIW
TIO
N
M.
Sim
on,
P.
Bu
rger
t
3U
NY
/~to
n~
Bro
ok
63
.0
80
SIN
ON
-3,
DU
PRE
E-1
, A
. K
. D
up
ree,
J.
H.
Bla
ck
Har
var
d
Co
lleg
e
Ob
serv
ato
ry
SIM
ON
-DU
PRE
E-1
S.T
. G
ott
esm
an
Na
tio
na
l R
adio
Ast
ronom
y
Ob
serv
ato
ry
0
32
GO
TTES
MA
N-1
22-G
Hz
Searc
h f
or
Wat
er-
A.
H.
Ba
rre
tt
Mas
s In
sti
tute
of
Tec
hn
olo
gy
v
ap
or
Em
issi
on
in
Late
- P
. R
. S
chw
artz
t
Typ
e S
tars
5.8
4-~
Hz
Se
arc
h f
or
D.F
. D
ick
inso
n
Inte
rste
lla
r H
NO
3
C.
A.
Go
ttli
eb
23-G
Hz
Searc
h f
or
Sm
all
- B
. F
. B
urk
e s
ca
le A
nis
otr
op
y i
n
the
3O
b
ack
gro
un
d
4.8
3-
~~
2
Ob
serv
ati
on
s P
. C
. !(
ye
n
1 of
Form
aldeh
yde
A.
H.
Ba
rre
tt
22-G
Hz
Searc
h f
or
Wat
er-
M.
Sim
on
vap
or
Em
issi
on
in
Ea
rly
- ty
pe
Sta
rs
Sm
ith
son
ian
Ast
rop
hy
sic
al
Ob
serv
ato
ry
0
Mas
s In
sti
tute
of
Tec
hn
olo
gy
3
6.0
Mas
s In
sti
tute
of
Tec
hn
olo
gy
25
4.5
SU
NY
/S~
O~
~
Bro
ok
11
2
MYER
S -1
* P
rep
ared
by
M
. L
. M
eeks
, 1
2 A
pri
l 7
1
t G
rad
uat
e S
tud
en
t
TAB
LE I
(Co
nti
nu
ed
)
OB
SER
VIN
G
TIM
E U
SED
TH
ROU
GH
C
ON
TII.
IIIII.
IG PROGRAPB
31
bla
rch
71
H
OU
RS
ias
of
31
Mar
ch
71
) IN
VE
STIG
AT
OR
S IP
IST
ITU
TIO
NS
ours
) R
EQU
ESTE
D
DE
SIG
NA
TIO
N
25.1
-GH
z S
ea
rch
fo
r In
ters
tell
ar
N20
A' H' B
arre
ttj
J'W
ate
rs
Pla
ss
Ins
titu
te o
f T
ech
no
log
y
P.R
. S
chw
artz
t
1.
62
-~
~~
O
bse
rva
tio
ns
F. J
. L
ockm
an f
of
the
H15
9 a
Rec
ombi
na-
W. A
, D
ent
tio
n L
ine
Nea
r S
gr
A
15.5
-GH
z M
appi
ng o
f th
e
W.
A.
Den
t G
ala
cti
c C
en
ter
Reg
ion
J
. E
. K
ap
itz
ky
i
Uni
v o
f ~
as
sa
ch
us
ett
s/~
mh
ers
t 0
1
90
LO
CK
bIA
N-I
Un
iv.
of
hk
ssa
ch
use
tts/
~m
he
rst
0
Se
arc
h f
or
Sp
ec
tra
l L
ine
s C
.A.
Go
ttli
eb
, H
.Pe
nfi
eld
H
arv
ard
C
oll
eg
e
Ob
serv
ato
ry
Aro
und
18
.4 a
nd
2
0.1
GH
z A
. P
en
zia
s B
ell
Tel
eph
on
e L
ab
ora
tori
es
22-G
Hz
Hap
pin
g
of
M.
L.
Mee
ks
Hay
stac
k
Ob
serv
ato
ry
Ga
lac
tic
Ce
nte
r R
egio
n
Sh
ell
ey
Ro
ger
s t
hET
P
hy
sic
s D
epar
tmen
t
7.8-
GH
z R
eco
mb
inat
ion
L
ine
E.
J.
hai
is
son t
S
tud
ies
(9
b)
of
the
Fo
llo
w-
ing
So
urc
es:
T
au A
, O
ri
A,
NG
C 2
02
4,
Sg
r A
, W
49
&
Dif
fuse
B
ack
gro
un
d
7792
-MH
z R
eco
mb
inat
ion
L
. E
. ~
oa
dt
L
ine
s,
Se
arc
h o
f P
lan
eta
ry N
ebu
lae
Har
var
d
Co
lle
ge
O
bse
rva
tory
3
5.0
2
16
C
HA
ISSO
N-4
Har
var
d
Co
lle
ge
Ob
serv
ato
ry
22.2
34-G
Hz
VL
BI
w/N
RL
, B
.F.B
urk
e,
C.
Pap
a M
ass
Ins
titu
te
of
Tec
hn
olo
gy
NR
AO
& S
ov
iet
Un
ion
P
.R.
Sc
hw
art
zt
hlas
s In
sti
tute
o
f T
ech
no
log
y
(Cri
mea
) J.
M.
Mor
an
Sm
ith
son
ian
Ast
rop
hy
s O
bse
rva
tory
S
. H
. K
now
les
Nav
al
Re
sea
rch
La
bo
rato
ry
W.
T.
Su
lliv
an
U
niv
ers
ity
o
f M
ary
lan
d
USS
R
Ast
ron
om
ers
(un
spe
cif
ied
)
Gra
du
ate
S
tud
en
t

TABLE I (continued)
OBSERVING. TIIB
USED THROUGH
CONTINUING PROGRAMS
31 March 71
HOURS
(as of 31 March 71)
INVESTIGATORS
INSTITUTIONS
(Hours)
REQUESTED
DESIGNATION
2 $8-cm Mapping of Active
J. Aarons, R.M. Straka,
AF Cambridge Research Laboratory
9.0
Solar Regions
D. W. Richards
8- &
15-GHz Monitoring
W. A
. Dent
of Quasars &
Peculiar
Galaxies
23-GHz Awnonia Transitions,
J. R. Dickel
A Search of Jupiter
M. L. Meeks
23-GHz Ammonia Transitions,
M. L. !-leeks
A Search for Galactic
J. R. Dickel
Sources
~.O-GHZ
Recombination
E. J
. Chaisson t
Line Measurements
(94c
r)
in the Cygnus X Region
Univ of ~assachusetts/~mherst
295.5
50/month
DENT-1
University of Illinois Observatory
0 Haystack Observatory
Haystack Observatory
0 University of Illinois Observatory
Harvard College Observatory
t Graduate student

TA
BU
I
(Co
nti
nu
ed)
TOTA
L O
BSER
VTN
G
TIb
E
PRO
GRA
MS
CO
I-PU
TE
D
SIN
CE
PR
ER
AM
IN
ITIA
TIO
N
1 J
an
-
31
Mar
7
1
INV
EST
IGA
TO
RS
INST
ITU
TIO
NS*
(H
OU
RS
)
7. ~
J+
-GH
Z M
easu
rem
ents
w
/21
0-f
t G
old
sto
ne
ante
nn
a to
det
erm
ine
the
s
tru
ctu
re
and
sp
ec
tra
of
ex
tra
- g
ala
cti
c
sou
rce
s
77%
-FM
z H
eliu
m R
ecom
bi-
na
tio
n
Lin
es
(9
4~
4,
hll7
ob
serv
ati
on
s
15-G
Hz
&la
ppin
g o
f W
este
rho
ut
So
urc
es
(6
<O
o)
8.0-
GH
z R
eco
mb
inat
ion
L
ine
Mea
sure
men
ts (94a),
A
Su
rvey
101-
GH
z O
zone
E
mis
sio
n
fro
m t
he
Atm
osp
her
e,
A S
ea
rch
22
.36
-~
~z
R
eco
mb
inat
ion
L
ine
Mea
sure
men
ts
(66
a)
M.H
. C
ohen
D.
Ja
un
cey
K
.I.
Kel
lerm
an
M.A
. G
ord
on
J.A
. B
all
E
.J.
Ch
ais
son
t
E.J
. C
ha
isso
nt
J.A
. B
all
A
.E.
Lil
ley
J.
Ru
dzk
i t
J.W
. W
ater
s t
D.H
. S
tae
lin
D.
Ces
arsk
y t
Ca
lifo
rnia
In
sti
tute
of
Tec
hn
olo
gy
C
orn
ell
Un
ive
rsit
y
Na
tio
na
l R
adio
Ast
ronom
y
Ob
serv
ato
ry
Har
var
d
Co
lleg
e O
bse
rvat
ory
Na
tio
na
l R
adio
Ast
ronom
y
Ob
serv
ato
ry
Har
var
d
Co
lleg
e O
bse
rvat
ory
Har
var
d C
oll
ege
Ob
serv
ato
ry
Mas
sach
use
tts
Ins
titu
te o
f T
ech
no
log
y
I
Har
var
d C
oll
ege,
Ob
selv
ato
ry
* A
ffil
iati
on
s a
t t
he
tim
e o
f th
e p
rog
ram
t G
rad
uat
e S
tud
en
t

I ................................. /....-.. " .................. . - .... . ......... I.."... .".... ... I
0 10 2 0 3 0
RADIAL VELOCITY SCALE (km sec-1)
i l- RESOLUTION
FREQUENCY ( M H z )
FIGURE 1. Recombination line emission observed toward ~ 4 9 at Haystack Observatory. Upper curve: ~g4a. Lower set of curves: individual Gaussian profiles for (a) ~94a, (b) ~egka, (c) ~1486. A T as shown is approximately 5 standard deviations. The negative basefgne feature on the high frequency side of the spectrum, as well as the increased fluctuations at the edges, ar,e instrumental in origin. The dotted line below each set of profiles represents the residuals after the fitted data have been subtracted.

1. Spectral-Line Progra.ms
Er i c Cha.isson Ha.rva.rd College Observatory
Observa,tion of a.n Unidentif ied Recombinaption Line i n W49
The 94a recombination l i n e s of hydrogen and helium were o'oserved i n :be d i r e c t i o n of the continuum source ~ 4 9 A , along with the 1486 t r a n s i t i s ? of hydrogen. I n add i t ion t o these s p e c t r a l f e a t u r e s , shown i n Figure 1, zn ai- i d e n t i f i e d f e a t u r e , l abe led ( a ) , was found. Subsequent observat ions ~ r z t ' r t he NRAO 140-foot te lescope of a d i f f e r e n t s e t of a recombination l i n e s 12 t h i s source a l s o showed t h e un iden t i f i ed f e a t u r e and thus confirmed t b e z f i i s indeed a recombination l i n e .
The width of the un iden t i f i ed fea. ture suggests tha.t it i.s not carboi? 12 with a ra.dia.1 v e l o c i t y of 73 km/sec, and t h e p o s s i b i l i t y tha.t i t represents helium with a, ra.dia.1 v e l o c i t y of 43 km/sec ca.n be ru led out by the fa.ilui-e tc de tec t t h e corresponding ~ 9 4 a t r a ,ns i t ion . I f t h e l i n e r e s u l t s from hydrogen recombination, then a. ra.dia.1 v e l o c i t y of -80 t o -90 km/sec would be required.. Alterna. t ively, t h e fea.ture could represent a.n element l i g h t e r than normal helium, with the sa.me ra.dia.1 v e l o c i t y a.s tha.t g iv ing r i s e t o t h e H93a and He93a emission (about 8 km/sec) , On the mass sca.le t h i s f e a t u r e would correspond t o 2.2 (1.0.2, -0.1) a.tomic mass u n i t s (a,mu).
I f t he mass i s i n f a c t 2 amu, the more l i k e l y source species would be molecu1a.r hydrogen ra. tber t1ia.n a.tomic deuterium because t h e I.a.tter would Lmpijr t h e a.lmost p roh ib i t ive ly l a r g e a.bunda.nce ra . t io of about 2 percent re la . t ive t o hydrogen.
Er i c Cha,isson Ha.nra,rd College 0bserva.tory
Confirma,tion of a Recombina.tion Line from a.n H I Region
The exis tence of a narrow recombinaption l i n e fea , ture , a t t r ibuta.b. le t o hydrogen i n t h e H I region nea.r NGC 2024, has been v e r i f i e d by observa.tior_s of t h e ~ 9 4 a t r a n s i t i o n . Recently Ba,ll -- e t a.1: observing t h i s source w i t l n t?.ie NRAO 140-foot te lescope , found wha,t a.ppeared t o be H157a recombination za.dia- t i o n with the sa.me ra.dia.1 v e l o c i t y as t h a t of the na.rrow carbon-line :rea.ture, Figure 2 shows t h e superimposed spec t ra of H94a emission from t h e H I 1 an2 H I regions (1a.rge and. sma.11 crosses , respect ive ly) . I f t h e H I emission a.nd the na,rrow c94a emission a.re a.ssunied t o haxe the sa,me ra.dia.1 v e l o c i t y , then "ce observed frequency d i f f e rence corresponds t o a, mass of l l , 9 (+0.8, -0.7) a,m~l; confirming tha , t t h e t r a ,ns i t ion cg4a i s indeed due t o ca,rbon 12.
The f r a c t i o n of ionized hydrogen i n t h e H I cloud on the b a s i s of these measurements i s (3.2 1 2.5) x lo-* i n good a.greement with t h e value obta.ined by B a l l e t a.1 P --

Gl m rl .d .d ~p cd r n q a O E r n a .d m .d .d m G E + m c d o a a , 3 'o'
k 8- 0 0 Hrd
k H k 0 . X c o 3 cd m v ' o ' -Ps $2 2
% T d 9 m - P . 0 C X G l ? 3 .d
-PCU E a n * . d o k C U r d - P l ' k
a, 9-P m u , . G T d 0 m 3 * 0 G S 3 O Z P m m d a, .d rl d rl 3 - m .d cd cd W H . d - P G I X P r i . d W W G 0 = r h O A G ' ? G E . d o 3 0 -d k .d O\d U2 O G X G l . r i

2 . Continuum Programs
Ha,ystack Observatory, NEROC
Improved Pointing Cal ibra t ion of t h e Ha,ystack Antenna.
Last yea.r a, s e r i e s of measurements was ma.de of sources with a, preei.selu\r- known pos i t ion i n order t o obta,in an improved c a l i b r a t i o n of t h e inst,rurrel~ta.l point ing e r r o r s of the Hagsta,ck antenna. The measurements were made a:t 1 5 . 5 GHz on t h e f o l l o r i n g sources: 3 ~ 8 4 , 3C273, 3C279, 3 ~ 3 4 5 , a,nd 3~380, Pa.rkes 2203-18, and J u p i t e r . We ma.de 103 individual determina.ti0n.s of' pointing e r r o r s on 6 d i f f e r e n t da.ys, 24 hours pe r da,y, sprea,d over a,]? ir:"crval of 2 weeks. The method of l e a s t squares was used t o f i t the ax i s a.iig:~mer^t and collima,tion e r r o r s , a s wel l a.s e l eva t ion e r r o r s r esu l t ing from graxi-ta- t ionally-induced e la . s t i c de f lec t ion of t h e r e f l e c t o r . These data. were ~ ~ c r i t o prepare a, correc t ion ta,ble f o r t h e a,utoma.tic telescope-pointing conpl~ter . The rms residua, l e r r o r s i n t h e posi t ions of the ca,libra,tion sources a . f t e r a,pplying t h e correc t ion t a b l e ( including re f rac t ion) were 7 arcseconds i n e levat ion a,nd 6.5 a.rcseconds i n projec ted a.zimuth (azimuth times t h e c o s i r e of t h e eleva,tion) .
The new t a b l e of correc t ions has been entered i n t h e opera,tional g c i ~ i i n g progra.m, and we ha,ve confirmed t h e r e s u l t i n g a.ccuracy by measuring the posi t ions of the in tense water-vapor emission sources i n W3 a,nd ~ 4 9 ,
3 . Very Long Ba,seline Interferometry (vLBI)
Hagstack Obsema,tory, NEROC; Godda'rd Space F l i g h t Center; J e t Propulsion Labora.tory ; Universi ty of Ma,ryland
Gravita.tiona,l Deflection of Ra.dio Waves
Goldstone-Hagsta.ck i n t e r f erometric obsema,tions ma.de four months a,ra,r:: describe ra,pid va.ria,tions i n t h e f i n e s t r u c t u r e of t h e quasars 36279 a.nd. 36273. Most notably, t h e sepa.ra.tion of the n u l l s i n t h e fringe-a.mplitudie curve f o r 3C279 (see Hagsta.ck Qua,rterly Report, 15 Ja,nua,ry 71, Figure 1) increased ma.rkedly between October 1970 and Februa,ry 1971. In terpre ted LI! terms of a, two-point source model and t h e op t i ca l ly - in fe r red red s h i f t , t he ra, te of d i f f e r e n t i a l proper motion corresponds t o a.n a,ppa,rent speed about 1-C times t h a t of l i g h t . A number of poss ib le mecha.nisms t h a t might give r i s e t o such a,n a.ppa.rent speed a r e under considera.tion; severa l appea,r pla.usib2.e bu t no d e f i n i t i v e choice can be ma.de on t h e b a s i s of present evidence. Tk.e 3C273 da.ta, a l s o show a s h i f t i n t h e pos i t ion and sharp change i n the deptk: of the minimum i n t h e f r i n g e a.mplitude curve ( ~ u a r t e r l ~ Report, 1 5 J a n 71, Figure 2) between October and Februa.ry. The a,nalysis of these curves i n terns of t h e poss ib le changes i n br ightness d i s t r i b u t i o n t h a t could give r i s e tc: them i s s t i l l under study.
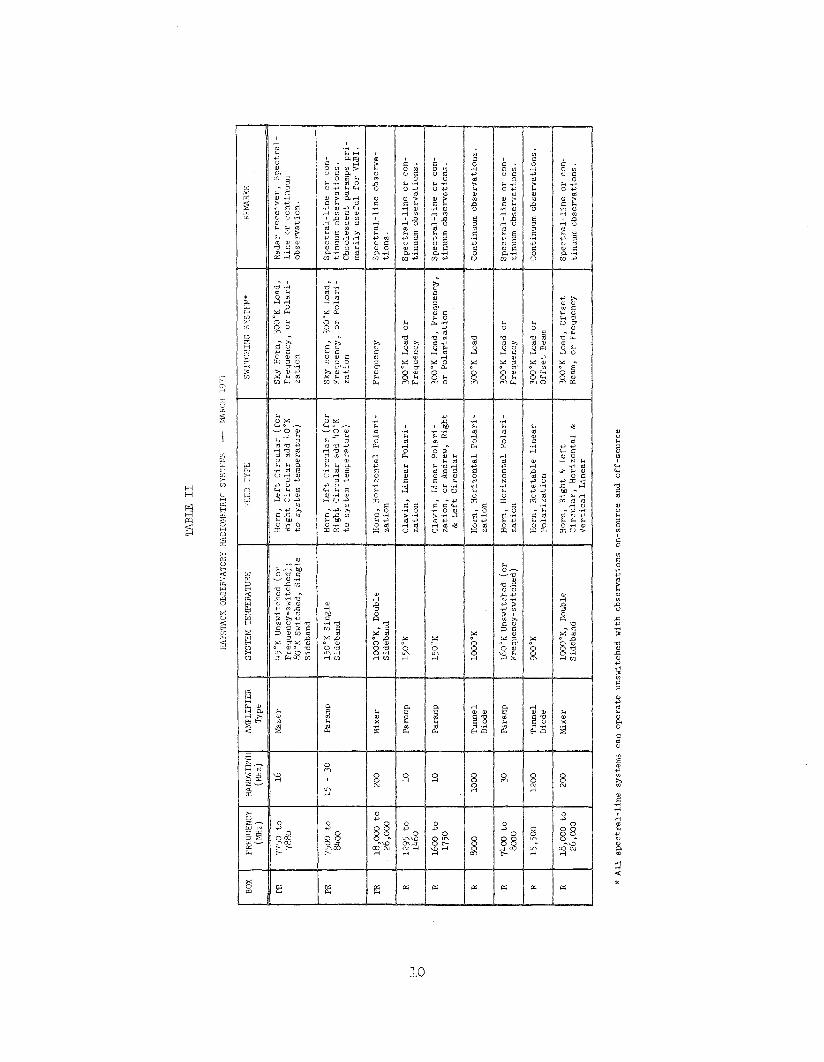
TABLE I1
HAYSTACK OBSER'IAlORY RADIOMETRIc SYSTIiE - I~YIRCI! 1971
Ho
rn,
Rig
ht
&
Le
ft
300°
K L
oad
, O
ffse
t
*A
ll
sp
ec
tra
l-li
ne
sy
stem
s ca
n o
pe
rate
un
swit
ched
wit
h o
bse
rva
tio
ns
on
-so
urc
e an
d o
ff-s
ou
rce

C . Radiometric Instrumenta,tion
Table I1 provides an updated l i s t i n g of radiometric systems a,vaiiable a , t Haystack, from which it i s c l e a r t h a t some well-chosen a.dditions of tip-to-d.a,te equipment would be very b e n e f i c i a l . I n t h e following subsections, we cover eva.lua.tion and improvements of some e x i s t i n g systems, progress i n the devel .0~- ment of a new K-band MASER and l i s t some proposa.1~ f o r a,dditions and/or improvements.
1. Eva,lua.t i on and Improvement of Exis t ing Sys tems
a,. Refurbished X-band Pa.ra,mps
A. number of ex i s t ing X-band pa,ra.metric a,mplifiers ha.ve been refurbished and eva,lua.ted f o r frequency covera,ge i n the region 7500 t o 8400 MHz. The Ha,ystack X-band maser i s r e s t r i c t e d t o a, range of 7750 t o 7800 MElz, and a number of V I B I a,nd spect ra , l - l ine experiments have been proposed outsi.de orf" t h i s range. These severa l nitrogen-cooled paramps were designed f o r space communica,tion purposes over 1 0 years a.go a,nd must be considered nea.rly obsclete .. They w i l l , however, provide system temperatures of the order of 150°K b u t may la,ck the s t a b i l i t y required f o r c r i t i c a l continuum o r spec t ra l - l ine mea.sure- ments. These u n i t s axe inten.ded only f o r in ter im frequency coverage u : ~ t , i l . . funds a,re a,va.ilable t o acquire more modern equipment.
b . Spec t ra l Line Processing System
1nvestiga.tion of a, bandpass s t a , b i l i t y problem i n the new d i g i t a l eorrela. tor spect ra , l l i n e system has l e d t o a, ma.jor modification of t h e frequency ccnverter u n i t . This u n i t was designed t o t rans la . te the frequency band t o be ana,lysed from a, band centered a.t 37.5 MHz t o a, video band located between zero freql~eney and one-ha,lf t h e digi ta .1 correla.tor sampling frequency. As now modified, the converter t rans la , tes the ba,nd t o be analyzed t o a, band located between one- ha.lf the sample frequency and t h e sa,mpling frequency i t s e l f . The sampling process, i n e f f e c t , a l i a s e s t h e s i g n a l t o t h e o r i g i n a l video band. me changes simplify the converter u n i t and el iminate a,s wel l c e r t a i n mixer feed-throc.gh problems i n the converter which h a ~ e ca.used bandpass i n s t a b i l i t i e s .
Bandwidths which can now be processed by the system a,re 20 MHz, 6.67 IMEz, 2.0 MHz, 667 kHz, 220 H z , 66.7 kHz, and 20 kHz. After a sma.11 correla. tor modification, a.dditiona.1 bandwidths of 6.67 kHz and 2.0 kHz w i l l be a.va,ilable.
c . Problems with t h e X-band ( ~ a d a . r ) Maser as a. Spec t ra l Line Ra.diometer
Bandpass Changes with Antenna Motion
Some change of the masert s bandpass shape with antenna eleva,tion arigle might be expected because of changing gra ,v i ta t ional fo rces . We were surpr ised ,
however, to find large changes (= 1%) with antenna azimuth angle. Figure 3 shows the difference between successive "noise" spectra both taken at a fixed 236" azimuth, while Figure 4 shows the difference between a noise spectrum taken at 226" azimuth and an earlier spectrum at 236". The 10-degree azimuth change produced a 1°K peak-to-peak baseline ripple! Following the 226"-a,zimuth data, alother spectrum was taken at the original 236" position and compa.red agajnst the earlier observa.tion, yielding the difference spectrum in Figure 5. Here +,he time between signal and comparison runs is about 14 minutes, but no signtficant ripple is seen.
The most likely explanation of the observed bandpass change is that the rotation of the maser produces a change in the direction of the terrestrial magietic field in the ruby structure which affects the maser characteristics. The effect of this problem can be minimized by tasking compa,rison runs offset in right ascension from the source position calcula.ted so tha,t the antenna tracks the same azimuth and elevation for both the comparison and signal runs.
2. K-band MASER Development
A11 of the major components of the K-band MASER, with minor exceptions, are now ordered, and the Haystack machine shop has completed 80% of the compo- nents within its capability. Modification of the coil-winding machine in order to rind the MASER superconducting magnets is also complete.
As shop time permits, we a,re constructing a full-scale d m y of the MASER using reel or, where necessary, substitute parts. Such a dummy helps to reveal areas of mechanical conflict that are difficult to visualize from drawings.
Drawings of the micro-strip transmission lines are in the final stage of checking before being submitted for bids. The next major drafting task centers on the room temperature flange. This flange must provide for microwave, cryogenic and electrical access to the MASER, and its fabrication is one of the last ma.jor ta,sks remaining in the project.
The designer, Dr. Sigfrid Yngvesson of University of Massachusetts/Amherst , con~inues to monitor the detailed design and construction work centered at Hays tack.

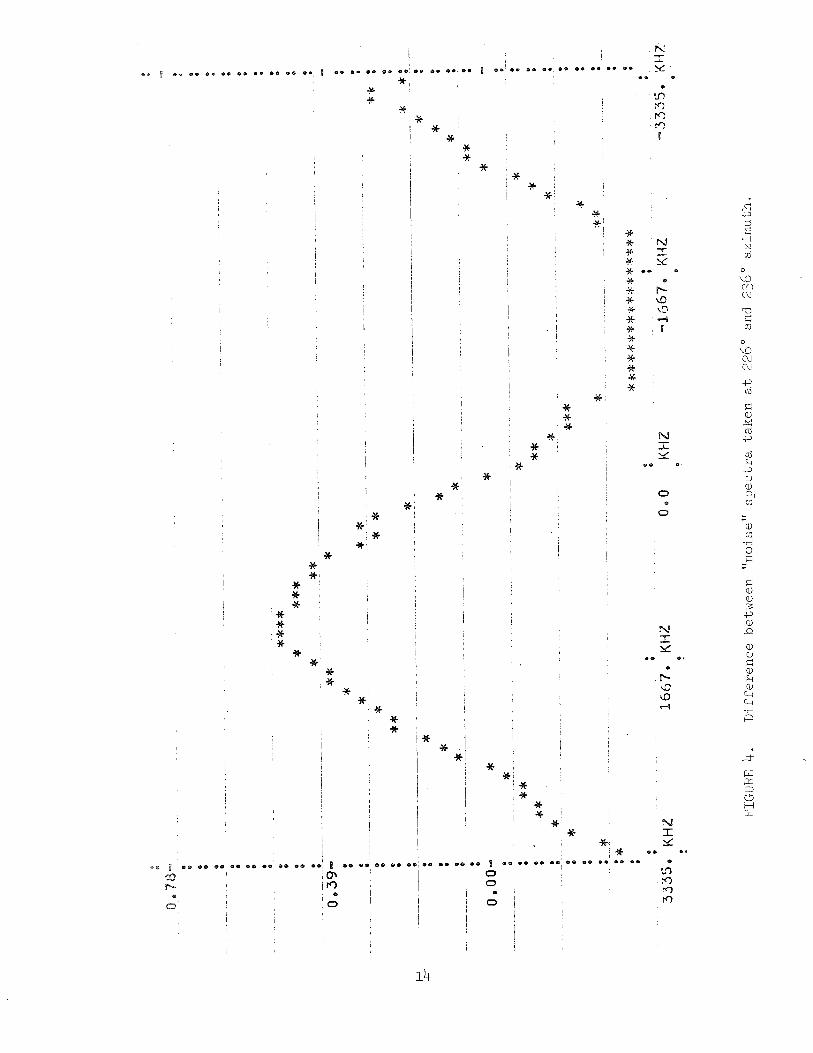


FIGURE 6. Radar topography f o r the Arzachel-Alphonsus -Hubiwn region.

111. RADAR ASTRONOMY
A . Lunar Topography
Reduction of the mea.surements made i n December and January a r e revealing a phase s t a b i l i t y t h a t i s uniformly b e t t e r than 10" m s , equivalent t o a loder l i m i t on the precis ion of the measured topography of 210 meters a,t 45" seleno- graphic from the mean center of the lunar disk, and improving t o 80 m a t 15" selenographic. The probable reasons f o r t h i s l a rge improvement [see Llunar QPR No. 8, 1 5 Sept 701 a re the improved lunar ephemeris, more precise pos t - observa,tion processing, and snow cover of the i n t e r s i t e phase reference zas les , providing them with a more constant ambient temperature.
Results
The topography of the Ptolemaeus-Alphonsus-Arzachel area ( ~ i g u r e 6) has been examined i n some d e t a i l . The o r i g ina l , radar-derived datum f o r the r e sn l t s shown i n Figure 5 has not received f i n a l ca l ibra t ion; thus, the datum shown was chosen t o maximize agreement of the average topography with t h a t o r LAC 77 ( ~ e f e r e n c e 1). The radar depths ( r i m t o f l oo r ) of the c r a t e r s i n Figure 6 a r e i n good agreement with some of the (shadow derived) values marked on UUC 17: e . g . f o r Arzachel (3900 m) and Alphonsus (3000 m) , but a r e somewhat smaller f o r Ptolemaeus (1800 m) . The l a t t e r discrepancy appears t o a r i s e from a large-scale surface tilt i n the LAC char t t h a t i s not confirmed by the radar measurements.
The radar measurements show t h a t por t ion of the f l o o r of Mare Nu.biwn t o the west of Alphonsus t o be qui te l eve l , with a mean r i s e of l e s s than 330 m over 150-km east-west o r 100-km north-south. Other more recent ra.dar obser~ra- t ions , now a t an intermediate stage of processing, e s s en t i a l l y reproduce these r e s u l t s . The l e v e l chara.cter of the radar-derived topography f o r the mare f l o o r lends confidence t o the r e su l t s , s ince e r ro rs fo r tu i tous ly yie lding such a, near-level mare f l o o r seem unlikely.
I f , on the ba s i s of the radar r e su l t s , the large-scale slope shown i n the LAC map i s assumed t o be a r t i f i c i a l , then the f l o o r of Ptolemaeus on the LAC ma.p no longer slopes by 600 m toward the northeast and i t s depth i s i n b e t t e r a.greement with the radar value. Even more i n t e r e s t i ng i s the s e t of three d i f f e r en t absolute elevations f o r the f l oo r s of the c r a t e r s Pto1ema.e~~ (1500 m), Alphonsus (1200 m) and Arzachel (300 m) . Each shows a f a i r l y l e v e l f l oo r with some increase i n the e levat ion tows-rd the south r i m . The cen t r a l ridges i n Alphonsus and Arzachel a r e p la in ly i n evidence. The t r ue heights of t h e i r c en t r a l pea.ks, however, a re undoubtedly g r ea t e r than indicated by the ra.da,r values since tlie l a . t t e r represent a weighted mean (ra.ther than a peak) e1eva.- t i o n i n a 1 x 2-km resolved area of the surface .

If It i s a.ssumed thah a l l t h r e e a r e impact c r a t e r s , then t h e primordia.1 depths should be i n opposi te order t o those p resen t ly observed - t h a t i s , Ptolema.ems would be t h e deepest , followed by Alphonsus and then Arza.che1. Howard a.nd Masursky ( ~ e f e r e n c e 2) be l i eve , on the o ther hand, tha.t Alphonsus ma.y 'be of volca.nic ra,ther than impact o r ig in ; i n any event, t he f l o o r of Ptolemaeus has been flooded s ince the or ig ina , l event . A reason then ma,y be sorigbt f o r the d i f ference i n t h e flooded l e v e l s of Alphonsus, whose f l o o r i s a.t a.~pro:x.irna.tely the l e v e l of Mare Hubium, and Ptolema.eus, a t l e a s t 300 m higher
Also of releva.nce a r e t h e recent gravimetric mea.surements of Ptolemaeus (13eference 3 ) . It was found by Got t l ieb e t a 1 t h a t a negative g rav i t a t iona , l a.noma.ly e x i s t s over the cra, ter , compared t o the upland areas t o the e a s t . The nega.tive a.noma.1~ i s measurable a t an a l t i t u d e of 14,000 m . , i n s p i t e of t h e 300-r;r eleva, t ion of the cra. ter f l o o r above Mare Nubium. There a r e severa,l poss ib le expla.na.tions, a,mong which a r e t h a t e i t h e r the uplands acre not i n i s c s t a t i c equil ibrium themselves b u t r a t h e r represent a,n excess of ma,ss forced abc-ve the equil ibrium l e v e l ; o r tha.t t he i n f i l l materia.1 i n Ptolemaeus con- s i s t s of low-density rock ( ra , ther than the volca.nic basa. l t genera l ly be l ieved t o form the mare surfaces) which f a i l e d t o reach i s o s t a t i c equil ibrium f o r a.ny of seve ra l p o t e n t i a l l y v a l i d reasons. A t h i r d p o s s i b i l i t y , t h a t the re ha.s been subsidence of the ma.re/crater a r e a with respect t o the uplands, i s no t supported by a.ny observed f a u l t l i n e s .
B, Venus and Mercury
There were essent ia . l ly no planetaery rada r observa.tions during the period 15 Janua,ry 1971 through 1 Apr i l 1971. An unfavorable super ior conjunction of T~Tercury was i n t e n t i o n a l l y passed by and the few scheduled Venus observa.tions (with one exception) were l o s t because of equipment d i f f i c u l t i e s . The major problem was the f a i l u r e of the t r ansmi t t e r cooling pump motor discussed below which el iminated two weeks of scheduled p lanetary ra.dar observations.
2 . Large- sca le Venus Topography
Reduction of short-pulse ranging data,, accumulated from both Haystack and Arecibo over the pas t 5 years , has d isc losed l a rge - sca le equa to r i a l topography ox Venus extending v e r t i c a l l y over about 5 km. Simultaneous measurements from the tvo s i t e s agree t o b e t t e r than a microsecond (150 m ) , lending confidence t o the r e s u l t s . Fur ther corroborat ion t o the topographic i n t e r p r e t a t i o n of the &served res idua l s i s the high degree of c o r r e l a t i o n between them and the gross v a r i a t i o n i n the 3.8-cm radar cross sec t ion . This c o r r e l a t i o n would be e x p e c ~ e d i f the chief cont r ibut ion t o t h e observed cross-sectional variation were d i f f e r i n g amounts of atmospheric a t t enua t ion as the e levat ion of the surYace r e f l e c t i n g region changed.

3 . Small-scale Venus Topogra,phy
Analysis of small-scale Venus topogra.phy continues bu t cannot be defini- t i v e u n t i l t h e ephemeris i s s u f f i c i e n t l y improved t o provide a common ba.sS.s f o r combining t h e ind iv idua l topography p r o f i l e s . A l l of t h e ava i l ab le 1367, 1969, a,nd 1970-71 observat ions s u i t a b l e f o r topographic ana,lysis have beer1 ind iv idua .11~ run using t h e least-squa,res model - f i t t ing program describe? i.n t h e 1 5 Ja.nua,ry 1971 Hagsta.ck Quarter ly Report. This pr0gra.m has beein recent]-y r e f ined t o a.llow a, f i t over a r e s t r i c t e d depth on t h e p lane t , empha.sizing measurements of t h e "leading edgeq'.
4 . Observing Plan f o r Mercury
During A p r i l 1971, Mercury presents a.n extremely fa,vorable i n f e r i o r con- junct ion f o r ra,da,r observat ions. Closest approach occurs on 23 April., when t h e p lane t i s .568 AU a,way. A t t h a t t ime, t h e pa th l o s s w i l l be comparabLe with previous conjunctions i n May 1969 and June 1968 when it was p o s s i l ~ l e t o ob ta in some p re1 imina . r~ measurements of topography from ranging da.ta. The rada,r system s e n s i t i v i t y should be s l i g h t l y b e t t e r t h i s A p r i l tha,n ill t h e e a r l i e r observa,tions. Pa.th l o s s i s wi th in 1 db of minimum from 16 April. 1 May 1971, and an in t ens ive s e r i e s of Mercury observat ions has beerr s~he?~-~l .ed . during t h i s period. During these observat ions, t h e major emphasis w i l l be on dela,y-doppler observat ions f o r t h e purpose of es t imat ing topography and sca . t te r ing law. Mercury presents a more d i f f i c u l t observing problem than Venus: because of i t s f a s t e r r o t a t i o n , a given a r e a remasins i n view a. rela ,- t i v e l y s h o r t t ime.
The a.pparent rota , t ion r a t e of Mercury during t h i s period i s typica.l.ly 6 . 8 " pe r day, corresponding t o a limb-to-limb frequency spread of 350 32, A surface po in t passes through the subradar region act a, r a t e of 0.28' per hour; t he corresponding doppler displacement i s 0.87 Hz pe r hour. 'Inus t he in tegra . t ion time f o r a na,rrow f i l t e r window observing a given 1ongi'i;ude region on t h e p lane t i s l imi t ed , unless provis ion i s made t o t r a c k t h e region in. both delay and frequency. A one-degree-wide region i n t h e d i r e c t i o n of -Lhe appa.reurt ro ta , t ion equa.tor i s resolved by a f i l t e r ba,ndwidth of 3 Hz.
Topogra,phy measurements of t h e type used on Venus using r e so lu t ion F i l delay and frequency t o develop a he ight p r o f i l e along t h e apparent rota . t ion equator a r e poss ib le . The delay of t h e ea . r l i e s t r e t u r n a t each frequency is compa.red with a t h e o r e t i c a . 1 1 ~ predic ted delay f o r a reference spherTca.1 ta.rget. The cu r ren t ly implemented ve r s ion of t h i s technique uses a least-squa.res fit i n a.mplitude a.nd de lay between t h e s i g n a l a,t each frequency and a, Ha.gfors sca . t te r ing model. The procedures a r e being modified t o a.llow doppler t r ack ing a s t h e subradax poin t moves.

C. Planning of Mars Observations
A hoped-for e a r l y attempt t o observe Mars i n l a t e February and ea.rly March was prevented by t h e t r a n s m i t t e r pump f a i l u r e discussed below. Most of tke e f f o r t t h i s quar t e r has been spent i n checking out new da ta reduction proceciures (see Sect ion D, below) and i n scheduling t h e summer's observations sc as t o maximize the usefulness of t h e da ta obtained wi th in the necessary cons t ra in t s on observing time. I n add i t ion t o securing uninterrupted coverage of Piartian topogra.phy between l a t i t u d e l i m i t s -11° and -24", obskmations w i l l be t i x e d t o take advantage of seve ra l "closure points". These observations a r e taken a t se l ec ted times when p rec i se ly t h e same subradar point t r a j e c t o r y i s t r aced on t h e p lanetary surface a,t widely separated po in t s on the o r b i t s of e a r t h and Mars. I n t h i s way, the systematic e f f e c t s of topography may be eonpletely el iminated ( f o r those po in t s ) from t h e so lu t ion f o r o rb i t a , l para,rreters.
D . Radar Instrumentat ion
1. Hardware
The scheduled on-s i t e t e s t i n g of a matched p a i r of improved high-power t r ansmi t t e r k lys t rons , Type V A - 9 4 9 ~ ~ , wi th lengthened c o l l e c t o r s and modified cathodes, was precluded by a,n accident t o one of t h e tubes a,t t he f ac to ry . We, the re fo re , proceeded t o eva.lua,te a s ing le V A - 9 4 9 ~ ~ ( ~ / h 22) with an exis-kLr,g v A - 9 4 9 ~ ~ (s/N 1 3 ) . The only ser ious problem was a higher body current than had been observed during e a r l i e r t e s t i n g a t t h e f a c t o r y . A s l i g h t re- duetion i n f i lament vol tage (0.5 v ) , a s suggested by the manufacturer, elimina- t e d t h i s problem a.t no cos t t o performance. We plan t o continue opera t ion us ing the mismatched p a i r (i . e . , with only one improved klys t ron) during the -4prll/blay PR Box "up" per iod . A 340-kw power l e v e l seems assured - a s ign i - f i c a n t iqrovement a s compared t o the recent p a s t .
A temporary setback occurred i n l a t e February when the 100-hp wound-rotor e l e c t r i c motor tha.t dr ives the t r a n s m i t t e r cooling pump f a i l e d . Severa l schecule5. Venus and e a r l y Mars observations had t o be canceled while the motor was rewound.
2 . Computer Programs
a,. Venus and Mercury
hlririg t h i s period an inves t iga t ion was undertaken of an excess "sampling noise" problem i n the part ial-decode ranging system. A s e r i e s of long noise run,s hinted t h a t t h e observed v a r i a t i o n of noise power with frequency was r e l a t e d t o d i g i t a l t runca t ion i n both t h e hardware (decoder) and t h e software ( r ea l - t ime processing program). More recent t e s t s ind ica te t h a t the observed effec-t a.iso depends on the l e v e l of the s i g n a l input (presumably as a r e s u l t

of f u r t h e r t runca t ion when running a t low l e v e l s ) . The b u i l t - i n t runcazion t o avoid overflows i n the computer processing pr0gra.m can be eliminaJ:ed, i f necessary, by c u t t i n g back t o 4 b i t s i n t h e A/D converter (from 7 b i t s pltis s ign) and by a, modificat ion t o t h e processing progra,m. This modificaLior can be made without a, s a , c r i f i ce i n dela,y covera,ge f o r most of the foreseeable opera t ing modes.
The pa.rtia,l-decode ranging pr0gra.m has been modified f o r the 1971 T.la,rs opposi t ion ra.da,r observa,tions. The requirements f o r t h i s pr0gra.m were: 1) t h a t it provide dela,y-sa.mpling in terva , l s a,s f i n e a,s 3 psec withou-i cobereat summing of code i n t e r v a . 1 ~ ~ and 2) t h a t it provide f o r spect ra , l a.nalysis c i b , few a,utoma,tica,lly se lec ted delag sa,mples centered on t h e peak of the ilieobereni;ly summed delay p r o f i l e . The use of e f f i c i e n t progra,mming techniques has per-. mit ted a sampling window of 120 psec i n t h e case of 5 psec sa,mples, and 4.2 psec f o r 3 psec samples. (24 and 14 delay sa,mples, respect ive ly , out of the 30 sa,mples ava i l ab le from the hardware decoder.)
c . Ephemeris and Point ing System
There has been a, continuing improvement i n our ephemeris p red ic t ion a . ~ d point ing system progra,ms, h ighl ighted by t h e following: 1) a, new versi.cn of the Hagstack Moon Libra t ion Progra,m (namd MLIB-4) has been w r i t t e n wliiek f e a t u r e s improved a.ccuracy i n t h e predic ted values of l a , t i tude and 1ongitl:de of the subra.dar point and of p o s i t i o n angles of the moon's l i b r a t i o n a x i s . This improvement r e s u l t s from inc lus ion of the e f f e c t s of both t h e moon's physica.1 and opt ica , l l i b ra , t ions . Calcula,tion shows t h a t a displacement e r r o r of up t o 1 km i n t h e l o c a t i o n of t h e surface nea,r the limb of the moon eou1,d r e s u l t from neglec t ing physica l l ib ra , t ion . 2) a genera l program f o r the conversion of LASER "ranging" da.ta, with a format s u i t a k l e f o r use i n t h e Planetary Ephemeris Program (PEP) has been completed a,nd used with LASEE: ranging da,ta, on t h e moon obta.ined by McDonald Observa,tory, September -- December 1969. These da,ta, w i l l be used i n the PEP program t o generate a x improved lunar ephemeris.

REFERENCES
I. LAC77,LunarAeronau t i ca lChar t s e r i e s , A i r F o r c e Chart and Information Center, S t . Louis, May 1963.
2 , K . A . Howard and H. Masursky, " ~ e o l o ~ i c Map of t h e Ptolemaeus Quadrangle of t h e ~ o o n , " U. S. Geological Survey (1968).
3 s P, Gott l ieb , P. M. Muller, W. J. Sjogren, and W. R. Wollenhaupt, " ~ u n a r Gravity over Large Cra ters from Apollo 12 Tracking ~ a t a , " Science 168, 477-479 (24 Apr i l 1970).
1 ; J , A . B a , l l , D . Cesarsky,A.K.Dupree ,L. Go ldberg ,A .E .L i l l ey , "Detection and Iden t i f i ca , t ion of Recombina.tion Lines from a.n H I Region," Astrophys. J. Le t t e r s 162 (1970).
APPENDIX
Publica,tions f o r January - March 1971
5 Sea,rch f o r the 211,, - J = 2 Excited Sta,te of OH i n W3 2
J . A . Ba,ll, C.A. Gott l ieb, M.L. Meeks, H.E. Ra.dford Astrophys. J . & (1 January 1971)
Gravita,tiona.l Constant: Experimental Bound on i t s Time Variation
1.1. Sha,piro, W.B. Smith, M.E. Ash, G.H. Pet teng i l l , R.P. Ingalls Phys. Rev. Le t te r s 26, 27 (1971) .