Quantitative Research - CPRsouth · Qualitative Quantitative Non-numerical data Numerical data...
28
Quantitative Research Dr. Christoph Stork Thursday 10 December 2009
-
Upload
nguyencong -
Category
Documents
-
view
221 -
download
0
Transcript of Quantitative Research - CPRsouth · Qualitative Quantitative Non-numerical data Numerical data...

Quantitative ResearchDr. Christoph Stork
Thursday 10 December 2009

Qualitative Quantitative
Non-numerical data Numerical data
In-depth understanding of human behaviour (why and how)
Representative figures(what where and when)
Focus group discussions, key informant interviews, ethnographic story-telling,
content analysis...
Primary Data collection: Surveys, automated recording (stock exchange)
demand side data
Secondary data analysis: cross-section, ime series, panel data
supply side or demand side data
Selection of respondents purposefully Random Sampling
Evidence through reasonEvidence through rejecting hypothesis
with a specific confidence.
The whole picture: Quant and Qual
Thursday 10 December 2009

How Rural is rural?
Thursday 10 December 2009

Example EA Classification
Thursday 10 December 2009

Electricity, Mobile Reception, Fixed-lines
in EA
Thursday 10 December 2009

Partly paved, partly dirt...semi-formal
urban
Thursday 10 December 2009

Quick way to get a feel for the topic and the EA
Thursday 10 December 2009

Primary Data Collection (Surveys)
Sampling, sample frame, sample size, weights, questionnaire design and question design
Representative of something...businesses, Indians, women, handicapped...
Thursday 10 December 2009

RIA 2007/8 household survey Survey Charateristics
Target PopulationAll households excluding institutional households such as army barracks, prisons and hospitals. All individuals 16 years or older.
Domains 1 = national levelTabulation groups Major Urban, Other Urban , Rural
OversamplingMajor Urban 40%Other Urban 30%Rural 30%
Clustering Enumerator Areas (EA) from national Census
None Response Random substitutionSample Frame Census sample from from NSOConfidence Level 95%
Design Factor 2Absolute precision (margin of relative error) 5%
P 0.5, for maximum sample sizeMinimum Sample Size 768
Thursday 10 December 2009

Representativeness
Known selection probability
Sample frame:
Household surveys: censusBusiness Survey: business registry, Ministry of finance, Census (informal businesses)
Secondary sample-frames: listings
Tertiary Sample-frames: Example in Household to select a household member randomly: List of all elegible household members, Kish Table, random number generators.
Thursday 10 December 2009

Thursday 10 December 2009

Thursday 10 December 2009

Sample Size
Desired level of accuracy typically confidence level of 95%
Absolute precision (relative margin of error) typically 5%.
Population proportion P conservatively would be 0.5 (yields the largest sample size)
n =Za p(1− p)
Cp
⎛
⎝⎜⎞
⎠⎟
2
n = 1.96 0.5(1− 0.5)0.05
⎛
⎝⎜⎞
⎠⎟
2
= 384
Thursday 10 December 2009

HHw = household weight
INDw = Individual weight 16+
PHH = Household Selection Probability
PEA = EA Selection Probability
PI = Individual Selection Probability
�
HHw = DW * 1PHH * PEA
�
INDw = DW * 1PHH *PEA *PI
�
PHH = NHHEA
�
PEA = m * HHEA
HHSTRATA
�
PI = 1HHm16+
Thursday 10 December 2009

National representative results for the BOP?
PPS Sample EAs
List all households in EA and Classify into BOP or not
Simple Randomly select from BOP households from List
Minimum sample size per country:
384 national only
768 national and rural / urban Times number of provinces, if representative for each province
Thursday 10 December 2009

Secondary Data analysis example: individuals 16+ that own a mobile phone or active Sim Card
!"#$%&
'$#(%&
)(#!%&
)!#*%&
*'#)%&
)+#*%&
,-./012345&
6-478&9:;2</&
=/05;-->&
?50/@5&
,/@5&
Thursday 10 December 2009
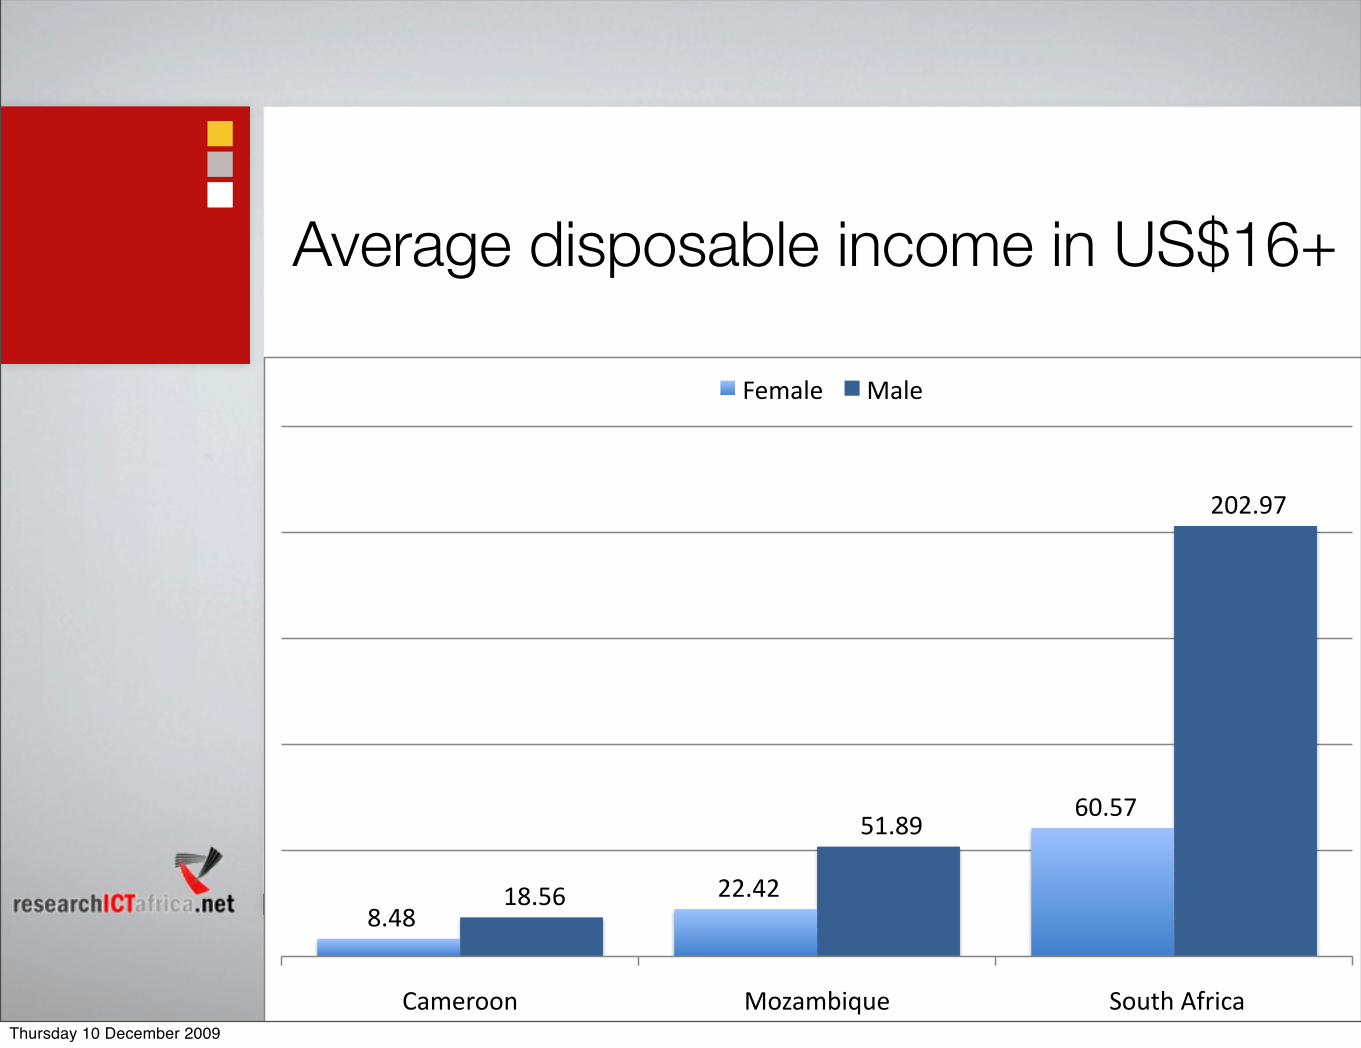
Average disposable income in US$16+
!"#$"!!!%%#$%!!
!&'#()!!
!*"#(&!!
!(*#"+!!
!%'%#+)!!
,-./0112! 314-.5678/! !918:;!<=06>-!
?/.-@/! 3-@/!
Thursday 10 December 2009
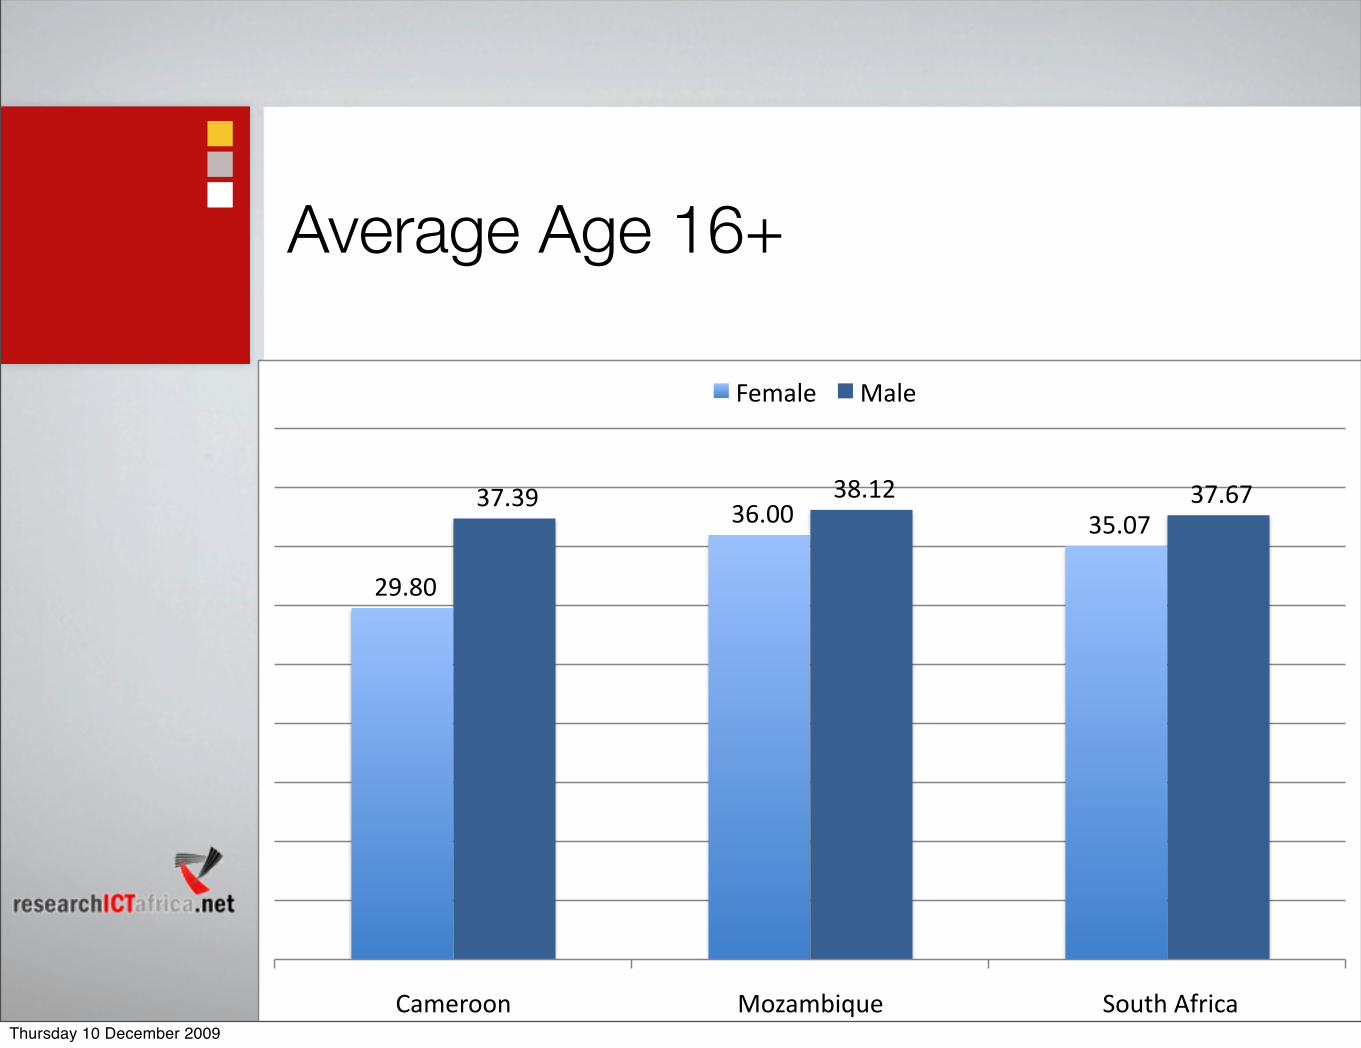
Average Age 16+
!"#$%&!!
!'($&&!! !')$&*!!!'*$'#!! !'%$+"!! !'*$(*!!
,-./0112! 314-.5678/! !918:;!<=06>-!
?/.-@/! 3-@/!
Thursday 10 December 2009
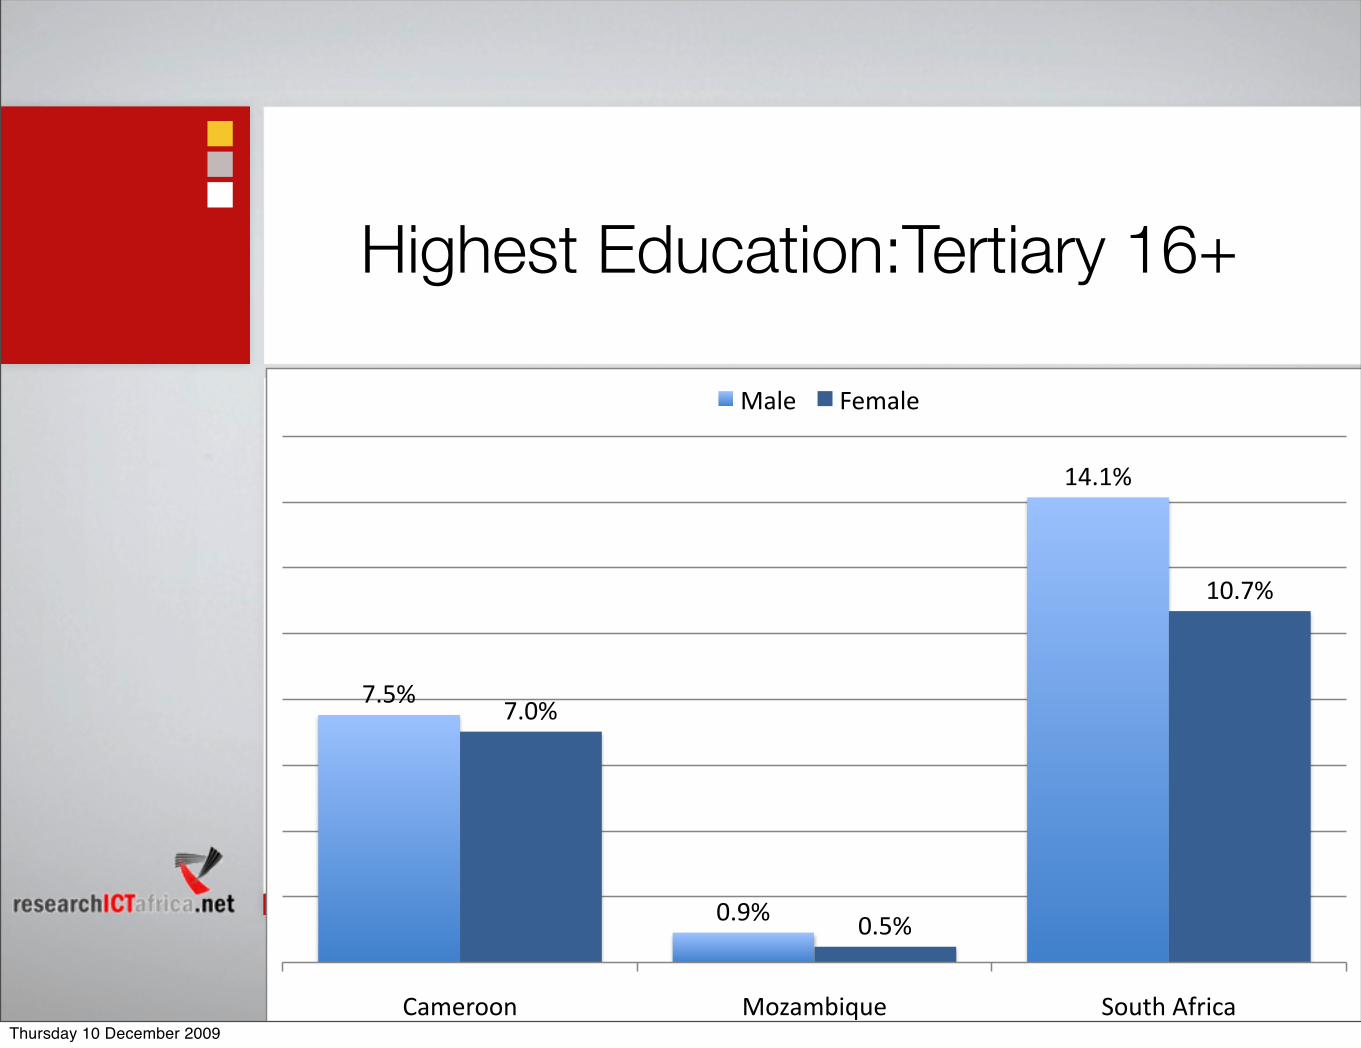
Highest Education:Tertiary 16+
!"#$%
&"'$%
()"($%
!"&$%
&"#$%
(&"!$%
*+,-.//0% 1/2+,3456-% 7/689%:;.4<+%
1+=-% >-,+=-%
Thursday 10 December 2009

Two-sample Wilcoxon rank-sum (Mann-Whitney) test - Prob > |z|
How confident are you: How confident are you: How confident are you: How confident are you: How confident are you: How confident are you: How confident are you: How confident are you:
Two-sample Wilcoxon rank-sum (Mann-Whitney) test - Prob > |z|
using a search engine to find information on the Internet
using e-mail to communicate with others
downloading and installing software onto a computer
identifying the cause for computer problems
understanding text written in English
typing a letter or CV on the computer
participate in an online discussion forum on a topic of your interest
making a call over the Internet
Benin 0.0679 0.0227 0.0015 0.0201 0.1886 0.0204 0.1268 0.0243
Botswana 0.0517 0.0647 0.001 0.1512 0.0338 0.0298 0.1475 0.3198
Burkina Faso 0.2235 0.7676 0.9622 0.2148 0.6915 0.3663 0.5399 0.205
Cameroon 0.0002 0.106 0.0002 0.0014 0.0491 0.0067 0.0116 0.0238
Cote d Ivoire 0.0352 0.7975 0.3917 0.8607 0.7829 0.9675 0.3364 0.9651
Ethiopia 0.0152 0.0429 0.0021 0.0053 0.0643 0.0183 0.0001 0.0043
Ghana 0.0039 0.0028 0.002 0.011 0.0033 0.0084 0.0632 0.1154
Kenya 0.1058 0.0665 0.0145 0.0624 0.2576 0.0908 0.0442 0.1073
Mozambique 0.0759 0.0634 0.0301 0.0387 0.092 0.1422 0.231 0.0238
Namibia 0.0034 0.0045 0.0005 0.0003 0.0012 0.0229 0.0004 0.0035
Nigeria 0 0 0 0.0003 0.0016 0.01 0.0088 0.0475
South Africa 0.0072 0.0057 0 0.0001 0.0067 0.0043 0.0063 0.0985
Uganda 0.087 0.1257 0.7256 0.0481 0.0578 0.1364 0.6342 0.5014
Thursday 10 December 2009
�
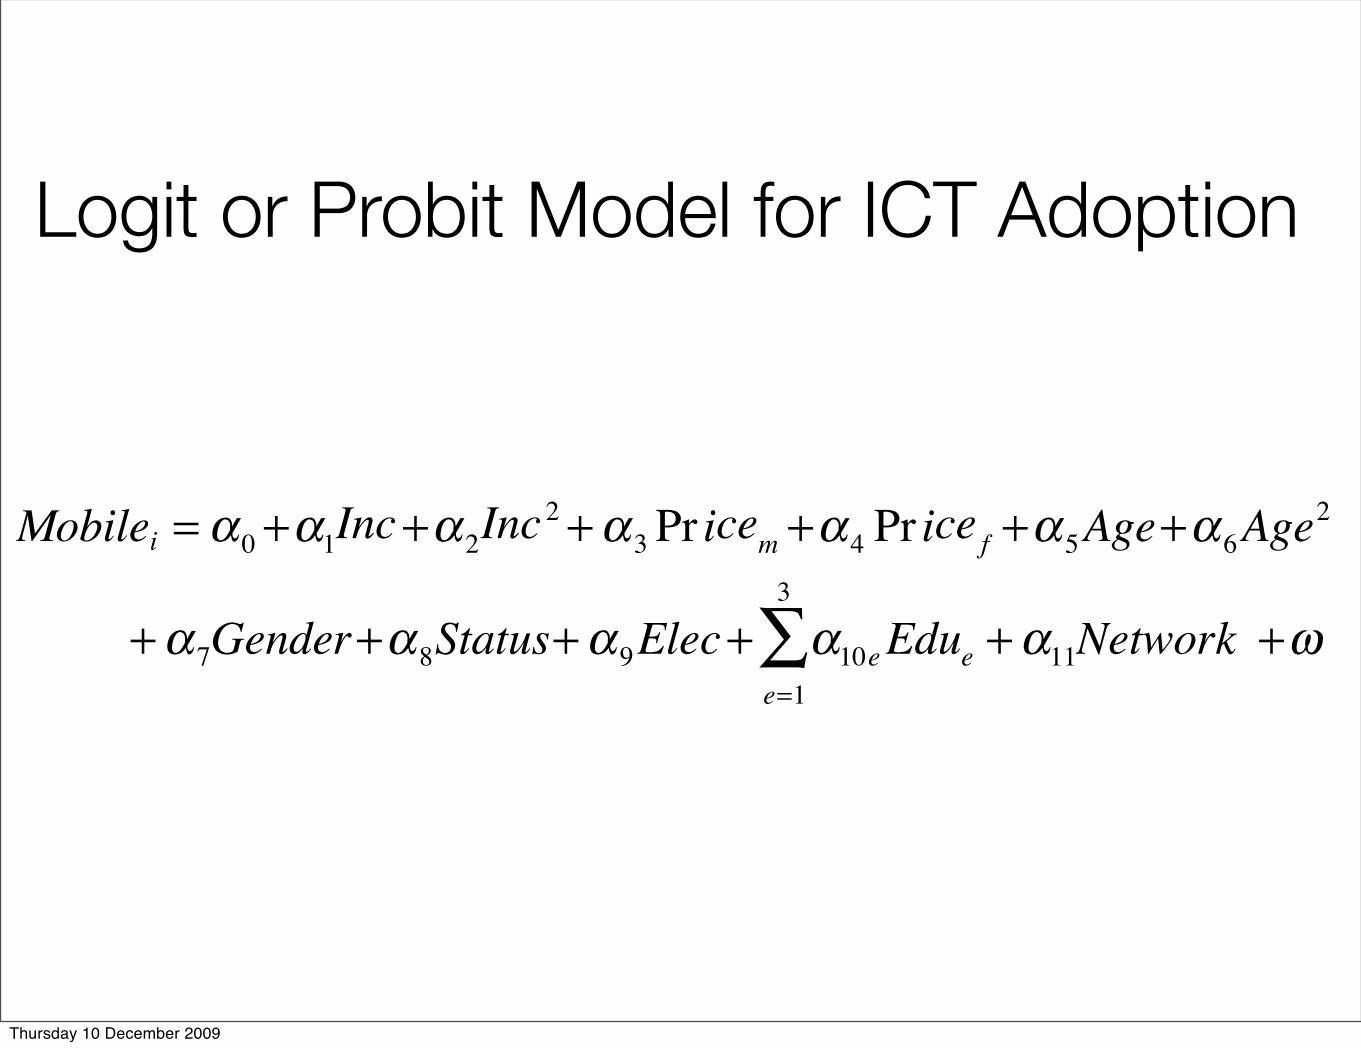
Mobilei = α0 +α1Inc+α2Inc2 + α3 Pr icem +α4 Pr ice f +α5Age+α6Age
2
+ α7Gender+α8Status+ α9Elec+ α10eEduee=1
3
∑ + α11Network +ω
Logit or Probit Model for ICT Adoption
Thursday 10 December 2009

Probit regression Number of obs = 1230 Wald chi2(6) = 194.38 Prob > chi2 = 0.0000Log pseudolikelihood = -648.59545 Pseudo R2 = 0.1980
------------------------------------------------------------------------------ | Robust
m_1re | Coef. Std. Err. z P>|z| [95% Conf. Interval]-------------+---------------------------------------------------------------- iincomeus | .0030115 .0004944 6.09 0.000 .0020424 .0039806 Teritiary | 2.401994 .2427257 9.90 0.000 1.926261 2.877728 Secondary | 1.519771 .1809192 8.40 0.000 1.165176 1.874366 Primary | .7379503 .1757915 4.20 0.000 .3934054 1.082495 female | .3044066 .1001704 3.04 0.002 .1080763 .5007369 c_7 | .0073583 .003994 1.84 0.065 -.0004697 .0151863 _cons | -2.073208 .2499079 -8.30 0.000 -2.563019 -1.583398------------------------------------------------------------------------------
Note: 0 failures and 1 success completely determined.
Cameroon
Thursday 10 December 2009

Probit regression Number of obs = 1128 Wald chi2(6) = 94.92 Prob > chi2 = 0.0000Log pseudolikelihood = -534.92596 Pseudo R2 = 0.1687
------------------------------------------------------------------------------ | Robust
m_1re | Coef. Std. Err. z P>|z| [95% Conf. Interval]-------------+---------------------------------------------------------------- iincomeus | .008232 .0031504 2.61 0.009 .0020574 .0144067 Teritiary | 3.194845 .4692621 6.81 0.000 2.275108 4.114582 Secondary | 1.205537 .2380523 5.06 0.000 .7389632 1.672111 Primary | .7314167 .1577807 4.64 0.000 .4221722 1.040661 female | .6654595 .143776 4.63 0.000 .3836638 .9472552 c_7 | -.0015514 .0049448 -0.31 0.754 -.0112429 .0081402 _cons | -1.411324 .2343641 -6.02 0.000 -1.87067 -.9519793------------------------------------------------------------------------------
Note: 0 failures and 8 successes completely determined.
Mozambique
Thursday 10 December 2009

Probit regression Number of obs = 1760 Wald chi2(6) = 160.45 Prob > chi2 = 0.0000Log pseudolikelihood = -980.16994 Pseudo R2 = 0.1611
------------------------------------------------------------------------------ | Robust
m_1re | Coef. Std. Err. z P>|z| [95% Conf. Interval]-------------+---------------------------------------------------------------- iincomeus | .0023268 .0003987 5.84 0.000 .0015453 .0031082 Teritiary | 1.206233 .2353331 5.13 0.000 .7449881 1.667477 Secondary | .6712455 .1780839 3.77 0.000 .3222074 1.020283 Primary | .1876848 .1759168 1.07 0.286 -.1571057 .5324753 female | .4281095 .0838309 5.11 0.000 .2638039 .592415 c_7 | -.0126379 .0024616 -5.13 0.000 -.0174625 -.0078133 _cons | -.2840044 .2165149 -1.31 0.190 -.7083657 .140357------------------------------------------------------------------------------
Note: 0 failures and 37 successes completely determined.
South Africa
Thursday 10 December 2009

Topic Dependent Variable Methodology Application
AdoptionFixed Line in HH
Mobile Phone PossessionInternet User (Yes/No)
Logit and ProbitIncome barriersSkills barriers
Demand Elasticity
Expenditure for mobile or fixed LineWTP for mobile of fixed line
OLSIncome elasticityUsage barriers
Digital Poverty
Digital Poverty Index (Barrantes) Ordinal Logit &PorbitIdentify obstacles to
digital wealth
Gender
Fixed Line in HHMobile Phone Possession
Internet User (Yes/No)Expenditure for mobile or fixed Line
WTP for mobile of fixed line
Mean Rank Comparison (Mann-U,
Kruskal-Wallis)Logit & Probit,
OLSOrdinal Logit &Porbit
Nominal Logit & Probit
Obstacles to gender equality in access
and usage
e-Skills
e-Skills index: Using a search engine to find information,
using e-mail to communicate, downloading and installing software, identifying the cause for computer
problems, typing a letter or CV on the computer, participate in an online
discussion forum, making a call over the Internet.
Ordinal Logit &Porbit
Link between e-skills and
employabilityHow to measure e-skills for indicator
frameworks
Thursday 10 December 2009

Revealed preferences: Observed actual behaviour
Stated preference: State behaviour following a change or for a particular situation (contingent valuation)
Willingness and Ability to Pay (WTP)
!Thursday 10 December 2009

Thursday 10 December 2009

Questions please...
Thursday 10 December 2009


![Numerical Integration and Differentiation Quantitative ... · Numerical Integration and Di erentiation Quantitative Macroeconomics [Econ 5725] Raul Santaeul alia-Llopis Washington](https://static.fdocuments.us/doc/165x107/5b68494a7f8b9a6f778c9014/numerical-integration-and-differentiation-quantitative-numerical-integration.jpg)