
Quantitative assessment of pressure sore … assessment of pressure sore generation and healing...
10
99 JRRD JRRD Volume 47, Number 2, 2010 Pages 99–108 Journal of Rehabilitation Research & Development Quantitative assessment of pressure sore generation and healing through numerical analysis of high-frequency ultrasound images Sahar Moghimi, MS; 1 Mohammad Hossein Miran Baygi, PhD; 1* Giti Torkaman, PhD; 2 Ali Mahloojifar, PhD 1 Departments of 1 Electrical Engineering and 2 Physical Therapy, Tarbiat Modares University, Tehran, Iran Abstract—This article focuses on the development of a method to quantitatively assess the healing process of artificially induced pressure sores using high-frequency (20 MHz) ultrasound images. We induced sores in guinea pigs and monitored pre- defined regions on days 3, 7, 14, and 21 after sore generation. We extracted relevant parameters regarding the tissue echographic structure and attenuation properties. We examined tissue healing by defining a healing function that used the extracted parameters. We verified the significance of the extracted features by using analysis of variance and multiple comparison tests. The features displayed ascending/descending behavior during wound genera- tion and reverse behavior during healing. We optimized the parameters of our healing function by using a pattern search method. We tested the efficiency of the optimized values by cal- culating the healing function value on assessment days and then comparing these results with the expected pattern of changes in the tissue conditions after removing the applied pressure. The results of this study suggest that the methodology developed may be a viable tool for quantitative assessment of pressure sores dur- ing their early generation as well as during healing stages. Key words: feature extraction, guinea pigs, healing function, high-frequency ultrasound, image processing, numerical analy- sis, pattern search method, pressure sores, sonographic assess- ment, wound healing. INTRODUCTION Developing a reproducible method for wound heal- ing assessment has proven to be a complicated task. Although treatment effectiveness can be evaluated by monitoring of the healing process [1], such evaluation requires accurate techniques for assessing the treatment results. The most popular assessment tools among clini- cians consist of an acetate sheet and a nonallergic liquid for measuring the wound perimeter and volume [2]. The major part of the healing process occurs in the deep tissue layers not visible to the naked eye, and nonde- structive monitoring of the process was impossible until about two decades ago. This issue becomes more signifi- cant when dealing with pressure sores, specific wounds that occur when unrelieved pressure causes ischemia, which if prolonged can lead to the development of necrotic tissue and pressure sore formation [3]. Pressure sores are notably different from acute wounds in that they can develop either superficially or from within the deep tissue, depending on the nature of the surface loading [4]. Conse- quently, the detection of early pressure sore signs remains challenging. This is a major problem for patients with impaired mobility or a reduced ability to sense injury. Therefore, skin of suspicious regions must be checked daily for signs of erythema or redness. However, deep tis- sue damage is not visually recognizable until the pressure Abbreviations: ASM = angular second moment, CON = con- trast, COR = correlation, CT = computed tomography, HFU = high-frequency ultrasound, MF = muscle fascia, MFS = modi- fied fractal signature, MRI = magnetic resonance imaging, PSM = pattern search method, ROI = region of interest. * Address all correspondence to Mohammad Hossein Miran Baygi, PhD; PO Box 14115-349, Department of Electrical Engineering, Tarbiat Modares University, Tehran, Iran; +98-21-82884331, ext 4509; fax: +98-21-82884325. Email: [email protected] DOI:10.1682/JRRD.2009.04.0045
Transcript of Quantitative assessment of pressure sore … assessment of pressure sore generation and healing...

99
JRRDJRRD Volume 47, Number 2, 2010
Pages 99–108
Journal of Rehabil itation Research & Development
Quantitative assessment of pressure sore generation and healing through numerical analysis of high-frequency ultrasound images
Sahar Moghimi, MS;1 Mohammad Hossein Miran Baygi, PhD;1* Giti Torkaman, PhD;2 Ali Mahloojifar, PhD1
Departments of 1Electrical Engineering and 2Physical Therapy, Tarbiat Modares University, Tehran, Iran
Abstract—This article focuses on the development of a method to quantitatively assess the healing process of artificially induced pressure sores using high-frequency (20 MHz) ultrasound images. We induced sores in guinea pigs and monitored pre-defined regions on days 3, 7, 14, and 21 after sore generation. We extracted relevant parameters regarding the tissue echographic structure and attenuation properties. We examined tissue healing by defining a healing function that used the extracted parameters. We verified the significance of the extracted features by using analysis of variance and multiple comparison tests. The features displayed ascending/descending behavior during wound genera-tion and reverse behavior during healing. We optimized the parameters of our healing function by using a pattern search method. We tested the efficiency of the optimized values by cal-culating the healing function value on assessment days and then comparing these results with the expected pattern of changes in the tissue conditions after removing the applied pressure. The results of this study suggest that the methodology developed may be a viable tool for quantitative assessment of pressure sores dur-ing their early generation as well as during healing stages.
Key words: feature extraction, guinea pigs, healing function, high-frequency ultrasound, image processing, numerical analy-sis, pattern search method, pressure sores, sonographic assess-ment, wound healing.
INTRODUCTION
Developing a reproducible method for wound heal-ing assessment has proven to be a complicated task. Although treatment effectiveness can be evaluated by monitoring of the healing process [1], such evaluation requires accurate techniques for assessing the treatment
results. The most popular assessment tools among clini-cians consist of an acetate sheet and a nonallergic liquid for measuring the wound perimeter and volume [2].
The major part of the healing process occurs in the deep tissue layers not visible to the naked eye, and nonde-structive monitoring of the process was impossible until about two decades ago. This issue becomes more signifi-cant when dealing with pressure sores, specific wounds that occur when unrelieved pressure causes ischemia, which if prolonged can lead to the development of necrotic tissue and pressure sore formation [3]. Pressure sores are notably different from acute wounds in that they can develop either superficially or from within the deep tissue, depending on the nature of the surface loading [4]. Conse-quently, the detection of early pressure sore signs remains challenging. This is a major problem for patients with impaired mobility or a reduced ability to sense injury. Therefore, skin of suspicious regions must be checked daily for signs of erythema or redness. However, deep tis-sue damage is not visually recognizable until the pressure
Abbreviations: ASM = angular second moment, CON = con-trast, COR = correlation, CT = computed tomography, HFU = high-frequency ultrasound, MF = muscle fascia, MFS = modi-fied fractal signature, MRI = magnetic resonance imaging, PSM = pattern search method, ROI = region of interest.*Address all correspondence to Mohammad Hossein Miran Baygi, PhD; PO Box 14115-349, Department of Electrical Engineering, Tarbiat Modares University, Tehran, Iran; +98-21-82884331, ext 4509; fax: +98-21-82884325.�Email: [email protected]:10.1682/JRRD.2009.04.0045
100
JRRD, Volume 47, Number 2, 2010
sores reach advanced stages. The risk of such complica-tions may be reduced with use of a cost-effective monitor-ing device along with a quantitative assessment strategy.
Imaging techniques such as photography, computed tomography (CT), and magnetic resonance imaging (MRI) can be used to assess pressure sores, although some draw-backs in using these techniques make them not very suit-able candidates for the purpose of this research.Photography does not detect the full extent of tissue dam-age in cases where the tissue is undermined [4]. CT and MRI are expensive and cannot be employed by individual dermatologists in small offices and/or clinics [5]. In addi-tion, CT and MRI have problems related to the use of harmful X-rays, injected dyes, magnetic fields, and delays in final report generation [5].
High-frequency ultrasound (HFU) is an alternative method for evaluating wounds, including burn scars, sur-gery wounds, and pressure ulcers, and has been shown to be comparable or better at wound assessment than the aforementioned methods [5–11]. Rippon et al. used artifi-cially induced acute wounds in pigs to demonstrate that HFU and histology are comparable in their ability to reveal the dominant wound healing phenomena (e.g., wound depth, eschar/blood clot depth, collagen accumulation, and granulation tissue depth) [7]. They reported nonhomoge-neous echogenic areas within the wound corresponding to the blood clots. They also observed echo-poor regions of early granulation tissue and related that to the low echoge-nicity of cellular infiltrate. Echogenic collagen was visual-ized as granulation matured. Since HFU allows sequential tissue monitoring, these previous authors suggested that it could be used to discriminate between healing and non-healing chronic wounds, allowing for investigation of deep tissues without tissue biopsy [8]. Dyson et al. discussed that the wound region may be more effectively measured by HFU than photography [9]. Wendelken et al. monitored wound dimensions by filling the wound cavity with a ster-ile wound mapping gel and covering it with film dressing. They measured dimensions using a software package [5]. Using HFU to detect the early stages of pressure ulcer gen-eration revealed that subdermal tissue and skin edema could be identified before any clinical or skin breakdown signs were seen [11]. Changes in tissue regularity and homogeneity during the healing process have also been observed using HFU [7–9,12–13].
However, quantitative measurements for monitoring the above healing parameters with HFU are limited. These measurements include the cooccurrence matrix, explained in detail by Theodoridis and Koutroumbas [14]
and used to analyze the echographic structures of skin and liver tissues [12,15–17], and randomly weighted fre-quency components of the intensity values, used to calcu-late the frequency band energy in the region of interest (ROI) as a measure of echogenicity [13].
The objective of our study was to develop a quantita-tive approach for HFU wound analysis that did not require the user to have prior knowledge in interpreting the results. By using 20 MHz B-mode HFU to identify changes of pressure sores during the generation/healingprocess, one may be able to extract parameters from the tissue texture and echogenicity and extend the numerical method for the assessment of tissue status.
MATERIALS AND METHODS
SubjectsWe maintained 36 healthy male albino guinea pigs (4–
6 months old, 400–450 g; Dunkin-Hartley, Pasteur Institute of Iran; Tehran, Iran) in special cages under controlled con-ditions according to the experimental guidelines of Tarbiat Modares University (Tehran, Iran). Animals had unlimited access to food until 12 hours before anesthesia and pressure application. We prepared anesthesia using a mixture of xylazine (20 mg/mL) and ketamine hydrochloride (100 mg/mL; 1–8 cc, injection of 1 cc/kg) [18].
ProcedureTo generate pressure sores, we developed a computer-
controlled surface pressure delivery system in which pres-sure was uniformly applied to a 0.75 cm-diameter disk. We used a proportional-integral-derivative controller (Control of Biological Systems Laboratory, Amir Kabir Univer-sity; Tehran, Iran) to minimize the difference between the desired and applied loads. A user could monitor the applied pressure throughout the wound generation sessions. The ability of the system to produce pressure sores was previ-ously established based on histological analyses [19].
We kept the load constant at 400 ± 5 g (mean ± stan-dard deviation) for 5 hours over the trochanter region of the animal hind limb. We then monitored the same region over 21 days (measurements taken on days 3, 7, 14, and 21 after pressure sore generation) by using a 20 MHz B-mode HFU scanner (DUB_USB taberna pro medicum; Lune-burg, Germany) in a controlled environment. The HFU scanner could monitor up to an ~8 mm-depth of tissue, but we reduced the size of the imaging window as we observed no significant echographic structure below the
101
MOGHIMI et al. Pressure sore healing through HFU
muscle fascia (MF). We marked the scan region on the skin of each animal to avoid confusion concerning probe head positioning. This enabled us to preserve the angle between the probe head and body line.
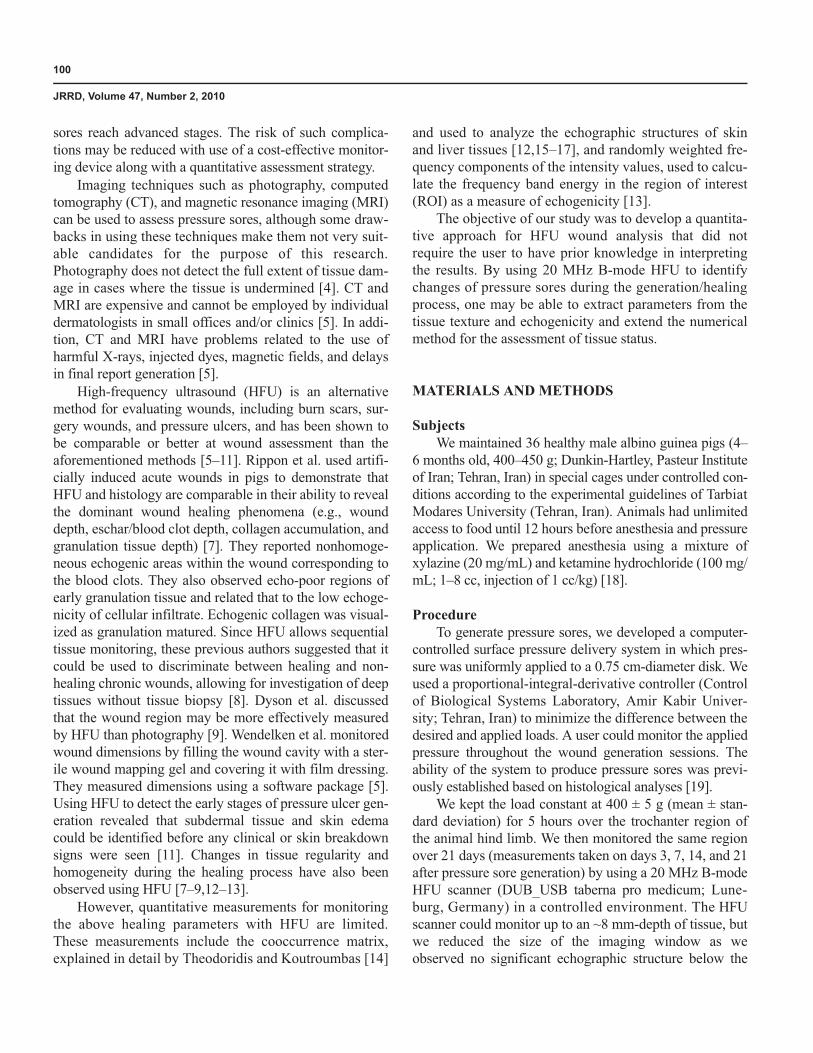
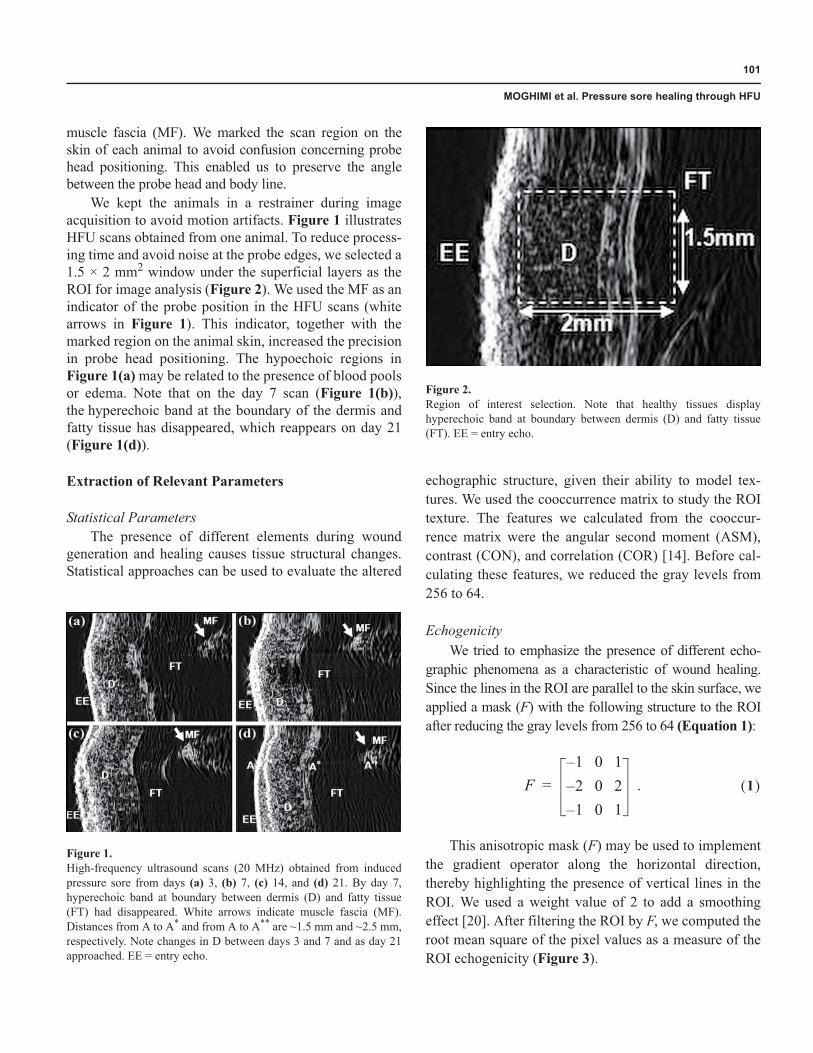
We kept the animals in a restrainer during image acquisition to avoid motion artifacts. Figure 1 illustrates HFU scans obtained from one animal. To reduce process-ing time and avoid noise at the probe edges, we selected a 1.5 × 2 mm2 window under the superficial layers as the ROI for image analysis (Figure 2). We used the MF as an indicator of the probe position in the HFU scans (white arrows in Figure 1). This indicator, together with the marked region on the animal skin, increased the precision in probe head positioning. The hypoechoic regions in Figure 1(a) may be related to the presence of blood pools or edema. Note that on the day 7 scan (Figure 1(b)),the hyperechoic band at the boundary of the dermis and fatty tissue has disappeared, which reappears on day 21 (Figure 1(d)).
Extraction of Relevant Parameters
Statistical ParametersThe presence of different elements during wound
generation and healing causes tissue structural changes. Statistical approaches can be used to evaluate the altered
echographic structure, given their ability to model tex-tures. We used the cooccurrence matrix to study the ROI texture. The features we calculated from the cooccur-rence matrix were the angular second moment (ASM), contrast (CON), and correlation (COR) [14]. Before cal-culating these features, we reduced the gray levels from 256 to 64.
EchogenicityWe tried to emphasize the presence of different echo-
graphic phenomena as a characteristic of wound healing. Since the lines in the ROI are parallel to the skin surface, we applied a mask (F) with the following structure to the ROI after reducing the gray levels from 256 to 64 (Equation 1):
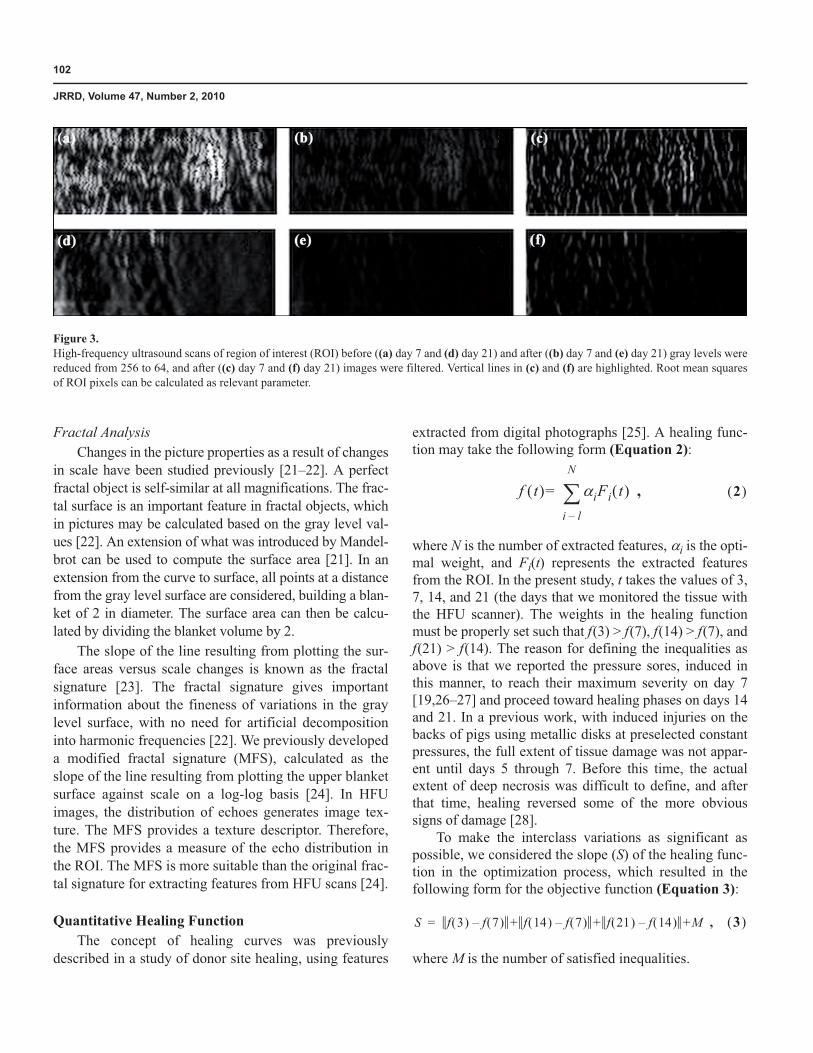
This anisotropic mask (F) may be used to implement the gradient operator along the horizontal direction, thereby highlighting the presence of vertical lines in the ROI. We used a weight value of 2 to add a smoothing effect [20]. After filtering the ROI by F, we computed the root mean square of the pixel values as a measure of the ROI echogenicity (Figure 3).
Figure 1.High-frequency ultrasound scans (20 MHz) obtained from induced pressure sore from days (a) 3, (b) 7, (c) 14, and (d) 21. By day 7, hyperechoic band at boundary between dermis (D) and fatty tissue (FT) had disappeared. White arrows indicate muscle fascia (MF). Distances from A to A* and from A to A** are ~1.5 mm and ~2.5 mm, respectively. Note changes in D between days 3 and 7 and as day 21 approached. EE = entry echo.
Figure 2.Region of interest selection. Note that healthy tissues display hyperechoic band at boundary between dermis (D) and fatty tissue (FT). EE = entry echo.
F1 0 1–2– 0 21– 0 1
.= 1� �
102
JRRD, Volume 47, Number 2, 2010
Fractal AnalysisChanges in the picture properties as a result of changes
in scale have been studied previously [21–22]. A perfect fractal object is self-similar at all magnifications. The frac-tal surface is an important feature in fractal objects, which in pictures may be calculated based on the gray level val-ues [22]. An extension of what was introduced by Mandel-brot can be used to compute the surface area [21]. In an extension from the curve to surface, all points at a distance from the gray level surface are considered, building a blan-ket of 2 in diameter. The surface area can then be calcu-lated by dividing the blanket volume by 2.
The slope of the line resulting from plotting the sur-face areas versus scale changes is known as the fractal signature [23]. The fractal signature gives important information about the fineness of variations in the gray level surface, with no need for artificial decomposition into harmonic frequencies [22]. We previously developed a modified fractal signature (MFS), calculated as the slope of the line resulting from plotting the upper blanket surface against scale on a log-log basis [24]. In HFU images, the distribution of echoes generates image tex-ture. The MFS provides a texture descriptor. Therefore, the MFS provides a measure of the echo distribution in the ROI. The MFS is more suitable than the original frac-tal signature for extracting features from HFU scans [24].
Quantitative Healing FunctionThe concept of healing curves was previously
described in a study of donor site healing, using features
extracted from digital photographs [25]. A healing func-tion may take the following form (Equation 2):
where N is the number of extracted features, �i is the opti-mal weight, and Fi(t) represents the extracted features from the ROI. In the present study, t takes the values of 3, 7, 14, and 21 (the days that we monitored the tissue with the HFU scanner). The weights in the healing function must be properly set such that f(3) > f(7), f(14) > f(7), and f(21) > f(14). The reason for defining the inequalities as above is that we reported the pressure sores, induced in this manner, to reach their maximum severity on day 7 [19,26–27] and proceed toward healing phases on days 14 and 21. In a previous work, with induced injuries on the backs of pigs using metallic disks at preselected constant pressures, the full extent of tissue damage was not appar-ent until days 5 through 7. Before this time, the actual extent of deep necrosis was difficult to define, and after that time, healing reversed some of the more obvious signs of damage [28].
To make the interclass variations as significant as possible, we considered the slope (S) of the healing func-tion in the optimization process, which resulted in the following form for the objective function (Equation 3):
where M is the number of satisfied inequalities.
Figure 3.High-frequency ultrasound scans of region of interest (ROI) before ((a) day 7 and (d) day 21) and after ((b) day 7 and (e) day 21) gray levels were reduced from 256 to 64, and after ((c) day 7 and (f) day 21) images were filtered. Vertical lines in (c) and (f) are highlighted. Root mean squares of ROI pixels can be calculated as relevant parameter.
f t� � �iFi t� � ,i l–
N
�= 2� �
S f 3� � f 7� �– + f 14� � f 7� �– + f 21� � f 14� �– +M , 3� �=

103
MOGHIMI et al. Pressure sore healing through HFU
Since the healing function is not differentiable, wecannot use methods based on derivative calculations.Therefore, we used the pattern search method (PSM) for optimization [29–34]. By the correct selection of optimi-zation parameters, PSM avoids the formation of local maxima. The PSM is simple to implement and does not require any explicit derivative estimates [33]. The general form of a PSM is as follows [34]. At each step k a current iterate xk and a set Dk of vectors identify the search direc-tions. Usually, the set Dk is the same for all iterations. There is also another dominant parameter, the step-length �k. For each direction, dk Dk, x+ = xk + �kdk, and f(x+) is exam-ined. If a dk exists such that f(x+) < f(xk), then xk + 1 = x+
and �k + 1 = �k�k with �k �1; otherwise, xk + 1 = xk and �k + 1 = k�k with k < 1.
Performance EvaluationWe adopted the Leave One Out technique, which is
mainly used to evaluate the performance of classifiers, to validate the healing function [14]. At each step, we left out 1 of the 36 samples for testing purposes and calcu-lated the optimal weights for the features extracted from the remaining 35 samples. We defined the performance of the healing function by its ability to fulfill the inequali-ties for the test sample.
RESULTS
Figure 4 illustrates changes in the mean value of the features from days 3 to 21. These features demonstrate significant changes during the generation and healing processes, with an ascending/descending behavior from day 3 to day 7 and a reverse behavior from day 7 to day 21. Based on this behavior, the extracted features from the ROI are relevant to the procedures under study and therefore are good features for developing the healing function.
The Table displays the significance of the features as determined by the analysis of variance and multiple com-parison tests. The confidence interval indicated that the means on days 3 and 21 were not statistically different, since the interval included zero.
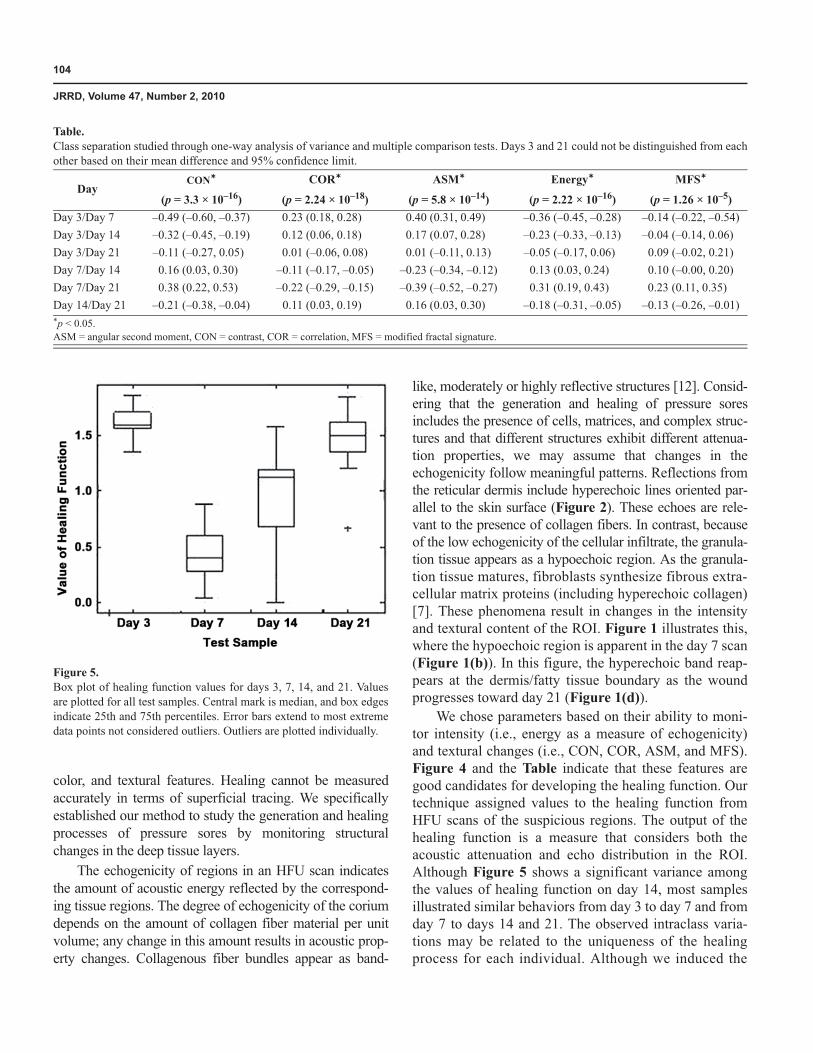
Figure 5 shows the values of the healing function for different samples. The outputs of the healing function in test samples decreased from day 3 to day 7 and increased from day 7 to days 14 and 21.
DISCUSSION
Wound analysis has previously been performed by monitoring changes in the wound surface, depth, superficial
�
Figure 4.Mean normalized value ± standard deviation of extracted features. ASM = angular second moment, CON = contrast, COR = correlation, D3 = day 3, D7 = day 7, D14 = day 14, D21 = day 21, MFS = modified fractal signature.
104
JRRD, Volume 47, Number 2, 2010
color, and textural features. Healing cannot be measured accurately in terms of superficial tracing. We specifically established our method to study the generation and healing processes of pressure sores by monitoring structural changes in the deep tissue layers.
The echogenicity of regions in an HFU scan indicates the amount of acoustic energy reflected by the correspond-ing tissue regions. The degree of echogenicity of the corium depends on the amount of collagen fiber material per unit volume; any change in this amount results in acoustic prop-erty changes. Collagenous fiber bundles appear as band-
like, moderately or highly reflective structures [12]. Consid-ering that the generation and healing of pressure sores includes the presence of cells, matrices, and complex struc-tures and that different structures exhibit different attenua-tion properties, we may assume that changes in the echogenicity follow meaningful patterns. Reflections from the reticular dermis include hyperechoic lines oriented par-allel to the skin surface (Figure 2). These echoes are rele-vant to the presence of collagen fibers. In contrast, because of the low echogenicity of the cellular infiltrate, the granula-tion tissue appears as a hypoechoic region. As the granula-tion tissue matures, fibroblasts synthesize fibrous extra-cellular matrix proteins (including hyperechoic collagen) [7]. These phenomena result in changes in the intensity and textural content of the ROI. Figure 1 illustrates this, where the hypoechoic region is apparent in the day 7 scan (Figure 1(b)). In this figure, the hyperechoic band reap-pears at the dermis/fatty tissue boundary as the wound progresses toward day 21 (Figure 1(d)).
We chose parameters based on their ability to moni-tor intensity (i.e., energy as a measure of echogenicity) and textural changes (i.e., CON, COR, ASM, and MFS). Figure 4 and the Table indicate that these features are good candidates for developing the healing function. Our technique assigned values to the healing function from HFU scans of the suspicious regions. The output of the healing function is a measure that considers both the acoustic attenuation and echo distribution in the ROI. Although Figure 5 shows a significant variance among the values of healing function on day 14, most samples illustrated similar behaviors from day 3 to day 7 and from day 7 to days 14 and 21. The observed intraclass varia-tions may be related to the uniqueness of the healingprocess for each individual. Although we induced the
Table.Class separation studied through one-way analysis of variance and multiple comparison tests. Days 3 and 21 could not be distinguished from each other based on their mean difference and 95% confidence limit.
DayCON* COR* ASM* Energy* MFS*
(p = 3.3 × 10⁻¹⁶) (p = 2.24 × 10⁻¹⁸) (p = 5.8 × 10⁻¹⁴) (p = 2.22 × 10⁻¹⁶) (p = 1.26 × 10⁻⁵)Day 3/Day 7 –0.49 (–0.60, –0.37) 0.23 (0.18, 0.28) 0.40 (0.31, 0.49) –0.36 (–0.45, –0.28) –0.14 (–0.22, –0.54)Day 3/Day 14 –0.32 (–0.45, –0.19) 0.12 (0.06, 0.18) 0.17 (0.07, 0.28) –0.23 (–0.33, –0.13) –0.04 (–0.14, 0.06)Day 3/Day 21 –0.11 (–0.27, 0.05) 0.01 (–0.06, 0.08) 0.01 (–0.11, 0.13) –0.05 (–0.17, 0.06) 0.09 (–0.02, 0.21)Day 7/Day 14 0.16 (0.03, 0.30) –0.11 (–0.17, –0.05) –0.23 (–0.34, –0.12) 0.13 (0.03, 0.24) 0.10 (–0.00, 0.20)Day 7/Day 21 0.38 (0.22, 0.53) –0.22 (–0.29, –0.15) –0.39 (–0.52, –0.27) 0.31 (0.19, 0.43) 0.23 (0.11, 0.35)Day 14/Day 21 –0.21 (–0.38, –0.04) 0.11 (0.03, 0.19) 0.16 (0.03, 0.30) –0.18 (–0.31, –0.05) –0.13 (–0.26, –0.01)*p < 0.05.ASM = angular second moment, CON = contrast, COR = correlation, MFS = modified fractal signature.
Figure 5.Box plot of healing function values for days 3, 7, 14, and 21. Values are plotted for all test samples. Central mark is median, and box edges indicate 25th and 75th percentiles. Error bars extend to most extreme data points not considered outliers. Outliers are plotted individually.
105
MOGHIMI et al. Pressure sore healing through HFU
pressure sores under the same conditions for all samples, we cannot expect equal damage, wound severity, or heal-ing time courses.
The healing function was able to follow the expected pattern through proper selection of its weights. This means that the inequalities introduced to optimize the weights of the healing function were fulfilled. As wounds progress through the healing phases, their structure and features gradually resemble those of healthy tissue. Because the HFU scan of day 3 monitored the ROI before the tissue reached its severity peak, it is reasonable to expect the extracted features of day 21 to be similar to those of day 3, which may be considered a sign of effec-tive wound tissue healing.
The healing function in Figure 5 displayed descend-ing behavior from day 3 to day 7 and ascending behavior from day 7 to day 21. The ascending behavior implied sore healing in the tissue. Thus, the healing function may be expected to remain at its descending behavior if the wound does not experience signs of healing. Rippon et al. suggested that since HFU scanning allows sequential tis-sue monitoring, it could be used to discriminate between healing and nonhealing chronic wounds [8].
Since our results show that every two successive points of the healing function fulfilled the inequality, we should also consider the relative behavior of tissue with respect to the prior monitoring point. In clinical applica-tions, skin regions do not necessarily have to be moni-tored based on the intervals used in this research.
Our study has several limitations. The proposed heal-ing function provides only a relative assessment of heal-ing, and we can make no decision about the tissue condition through a single monitoring of the skin region. Given the ethical considerations of small animal use, our hypothesis could not be tested on more severe or nonheal-ing sores. Considering that the wounds were not severe and that changes in the tissue had to become significant enough to affect the value of the healing function, we could not adopt smaller intervals. More generalized stud-ies are needed to provide clinicians with optimum moni-toring intervals. While very long monitoring intervals can miss important changes in tissue structure, daily scans are neither practical nor very comfortable for patients. There-fore, this issue must be carefully considered. Histological studies should be performed to confirm the findings of this study. A correlation study between the healing histo-logical factors and values of the introduced healing func-tion is necessary to validate the feasibility of our proposed
method. Considering the size of available probes and the dimensions of real pressure sores, taking scans from dif-ferent regions may be helpful. In this case, healing may be studied simultaneously in different regions.
We manually selected the ROIs from the midsections of the obtained images. This was not problematic in the present study, since we marked the monitored region on the body of the animal and took precautions when posi-tioning the probe head. However, drawing conclusions about sore generation or healing cannot be valid unless we are certain about monitoring the exact same region in dif-ferent sessions. Future research on human skin should consider that skin marking may not be possible and that probe positioning may pose real challenges in clinical studies.
The smallest interval that the healing function needs to correctly detect tissue changes serves as the resolution. A higher resolution for the healing function is desirable, especially for clinical applications.
CONCLUSIONS
In this research, we obtained HFU scans from artifi-cially induced pressure sores on days 3, 7, 14, and 21. Changes in the healing function suggest the potential of this method for evaluating the healing process of pressure sores. The results also suggest that the healing function may be capable of showing the rate of healing, as demon-strated by the higher values for the ROIs in day 21 com-pared with day 14.
Further studies involving validation of our results by histological studies are planned for the near future.
ACKNOWLEDGMENTS
Author Contributions:Study concept and design: S. Moghimi, M. H. Miran Baygi.Acquisition of data: S. Moghimi, G . Torkaman.Analysis and interpretation of data: S. Moghimi.Drafting of manuscript: S. Moghimi.Critical revision of manuscript for important intellectual content:M. H. Miran Baygi, G . Torkaman, A. Mahloojifar.Statistical analysis: S. Moghimi.Administrative, technical, or material support: M. H. Miran Baygi, G. Torkaman, A. Mahloojifar.Study supervision: M. H. Miran Baygi.Financial Disclosures: The authors have declared that no competing interests exist.

106
JRRD, Volume 47, Number 2, 2010
Funding/Support: This material is the result of work supported with resources and the use of facilities at the Tarbiat Modares University, Tehran, Iran.Additional Contributions: We would like to thank Professors Eugene Billiot and Ehsanollah Kabir for their valuable advice and comments.Institutional Review: The Ethical Commission of Tarbiat Modares University, Tehran, Iran, approved this study.
REFERENCES
1. Agache PG , Humbert P. Measuring the skin: Non-invasive investigations, physiology, normal constants. New York (NY): Springer; 2004.
2. Rovee DT, Maibach HI. The epidermis in wound healing. Boca Raton (FL): CRC Press; 2004. p. 125–40.
3. Salcido R, Fisher SB, Donofrio JC, Bieschke M, Knapp C, Liang R, LeGrand EK, Carney JM. An animal model and computer-controlled surface pressure delivery system for the production of pressure ulcers. J Rehabil Res Dev. 1995;32(2):149–61. [PMID: 7562655]
4. Bader DL. Pressure ulcer research: Current and future per-spectives. New York (NY): Springer; 2005.�DOI:10.1007/3-540-28804-X
5. Wendelken ME, Markowitz L, Patel M, Alvarez OM. Objective, noninvasive wound assessment using B-mode ultrasonography. Wounds. 2003;15(11):351–60.
6. Forster FK, Oledrud JE, Riederer-Henderson MA, Holmes AW. Ultrasonic assessment of skin and surgical wounds uti-lizing backscatter acoustic techniques to estimate attenua-tion. Ultrasound Med Biol. 1990;16(1):43–53.�[PMID: 2181763]�DOI:10.1016/0301-5629(90)90085-Q
7. Rippon MG , Springett K, Walmsley R, Patrick K, Millson S. Ultrasound assessment of skin and wound tissue: Compari-son with histology. Skin Res Technol. 1998;4(3):147–54.�DOI:10.1111/j.1600-0846.1998.tb00101.x
8. Rippon MG , Springett K, Walmsley R. Ultrasound evalua-tion of acute experimental and chronic clinical wounds.Skin Res Technol. 1999;5(4):228–36.�DOI:10.1111/j.1600-0846.1999.tb00135.x
9. Dyson M, Moodley S, Verjee L, Verling W, Weinman J, Wil-son P. Wound healing assessment using 20 MHz ultrasound and photography. Skin Res Technol. 2003;9(2):116–21.�[PMID: 12709129]�DOI:10.1034/j.1600-0846.2003.00020.x
10. Du YC, Lin CM, Chen YF, Chen CL, Chen T. Implementa-tion of a burn scar assessment system by ultrasound tech-niques. Proceedings of the 28th Annual International Conference of the IEEE; 2006 Aug 30–Sep 3; New York, NY. New York (NY): IEEE; 2006. p. 2328–31.
11. Quintavalle PR, Lyder CH, Mertz PJ, Phillips-Jones C, Dyson M. Use of high-resolution, high-frequency diagnos-tic ultrasound to investigate the pathogenesis of pressure ulcer development. Adv Skin Wound Care. 2006;19(9): 498–505. [PMID: 17132955]�DOI:10.1097/00129334-200611000-00010
12. Altmeyer P, El Gammal S, Hoffmann K. Ultrasound in der-matology. Berlin (Germany): Springer-Verlag; 1992.
13. Prabhakara S. Acoustic imaging of bruises. [thesis]. Atlanta (GA): Georgia Institute of Technology; 2006.
14. Theodoridis S, Koutroumbas K. Pattern recognition. 2nd ed. San Diego (CA): Academic Press; 2003.
15. Valckx FM, Thijssen JM. Characterization of echographic image texture by cooccurrence matrix parameters. Ultra-sound Med Biol. 1997;23(4):559–71. [PMID: 9232765]�DOI:10.1016/S0301-5629(97)00041-0
16. Vogt M, Ermert H, El Gammal S, Kaspar K, Hoffmann K, Altmeyer P. Structural analysis of the skin using high fre-quency, broadband ultrasound in the range from 30 to 140 MHz. Proceedings of the 1998 IEEE International Ultra-sonics Symposium; 1998 Oct 5–8; Sendai, Japan. New York (NY): IEEE; 1998. p.1685–88.
17. Yeh WC, Jeng YM, Li CH, Lee PH, Li PC. Liver fatty change classification using 25 MHz high frequency ultra-sound. Proceedings of the 2004 IEEE International Ultra-sonics, Ferroelectrics, and Frequency Control Joint 50th Anniversary Conference; 2004 Aug 24–27; Montreal, Canada. New York (NY): IEEE; 2004. p. 2169–72.
18. Brown M, Gogia PP, Sinacore DR, Menton DN. High-voltage galvanic stimulation on wound healing in guinea pigs: Longer-term effects. Arch Phys Med Rehabil. 1995;76(12):1134–37. [PMID: 8540790]�DOI:10.1016/S0003-9993(95)80122-7
19. Torkaman G , Sharafi AA, Fallah A, Katoozian HR. Biome-chanical and histological studies of experimental pressure sores in guinea pigs. Proceedings of the 10th International Conference on Biomedical Engineering; 2000 Dec 6–9; Singapore. p. 463–69.
20. Gonzalez RC, Woods RE. Digital image processing. 2nd ed. Upper Saddle River (NJ): Prentice-Hall; 2002. p. 125–41.
21. Mandelbrot BB. The fractal geometry of nature. San Fran-cisco (CA): W. H. Freeman; 1982.
22. Peleg S, Naor J, Hartley R, Avnir D. Multiple resolution texture analysis and classification. IEEE Trans Pattern Anal Mach Intell. 1984;6(4):518–22.�DOI:10.1109/TPAMI.1984.4767557
23. Lekshmi S, Revathy K, Prabhakaran Nayar SR. Galaxy classification using fractal signature. Astron Astrophys. 2003;405(3):1163–67. DOI:10.1051/0004-6361:20030541
24. Moghimi S, Miran Baygi MH, Torkaman G , Mahloojifar A. Assessment of artificially induced pressure sores using a
107
MOGHIMI et al. Pressure sore healing through HFU
modified fractal analysis. J Appl Sci. 2009;9(8):1544–49.�DOI:10.3923/jas.2009.1544.1549
25. Bon FX, Briand E, Guichard S, Couturaud B, Revol M, Servant JM, Dubertret L. Quantitative and kinetic evolu-tion of wound healing through image analysis. IEEE Trans Med Imaging. 2000;19(7):767–72. [PMID: 11055792]�DOI:10.1109/42.875206
26. Daniel RK, Priest DL, Wheatley DC. Etiologic factors in pressure sores: An experimental model. Arch Phys Med Rehabil. 1981;62(10):492–98. [PMID: 7305643]
27. Sugama J, Sanada H, Nakatani T, Nagakawa T, Inagaki M. Pressure-induced ischemic wound healing with bacterial inoculation in the rat. Wounds. 2005;17(7):157–68.
28. Hansen GL, Sparrow EM, Kokate JY, Leland KJ, Iaizzo PA. Wound status evaluation using color image processing. IEEE Trans Med Imaging. 1997;16(1):78–86.�[PMID: 9050410]�DOI:10.1109/42.552057
29. Momma M, Bennett KP. A pattern search method for model selection of support vector machine. Proceedings of the SIAM International Conference on Data Mining; 2002 Apr 11–13; Arlington, VA. Philadelphia (PA): Society for Industrial and Applied Mathematics; 2002.
30. Lange-Nielsen T, Lance GM. A pattern search algorithm for feedback-control system parameter optimization. IEEE Trans Comput. 1972;C-21(11):1222–27.�DOI:10.1109/T-C.1972.223481
31. Kolda TG , Lewis RM, Torczon V. Optimization by direct search: New perspectives on some classical and modern methods. SIAM Review. 2003;45(3):385–482.�DOI:10.1137/S003614450242889
32. Alhajri MF, El-Hawary ME. Pattern search optimization applied to convex and non-convex economic dispatch. Pro-ceedings of the IEEE International Conference on Systems, Man and Cybernetics; 2007 Oct 7–10; Montreal, Canada. New York (NY): IEEE. p. 2674–78.
33. Bianco S, Gasparini F, Russo A, Schettini R. A new method for RGB to XYZ transformation based on pattern search optimization. IEEE Trans Consum Electron. 2007; 53(3):1020–28. DOI:10.1109/TCE.2007.4341581
34. Lewis RM, Torczon V. Pattern search methods for linearly constrained minimization. SIAM J Optim. 2000;10(3): 917–41. DOI:10.1137/S1052623497331373
Submitted for publication April 12, 2009. Accepted in revised form December 3, 2009.