Quality of Financial Reporting: measuring qualitative characteristics
41
1 NiCE Working Paper 09-108 April 2009 Quality of Financial Reporting: measuring qualitative characteristics Ferdy van Beest Geert Braam Suzanne Boelens Nijmegen Center for Economics (NiCE) Institute for Management Research Radboud University Nijmegen P.O. Box 9108, 6500 HK Nijmegen, The Netherlands http://www.ru.nl/nice/workingpapers
Transcript of Quality of Financial Reporting: measuring qualitative characteristics

1
NiCE Working Paper 09-108
April 2009
Quality of Financial Reporting: measuring
qualitative characteristics
Ferdy van Beest
Geert Braam
Suzanne Boelens
Nijmegen Center for Economics (NiCE)
Institute for Management Research
Radboud University Nijmegen
P.O. Box 9108, 6500 HK Nijmegen, The Netherlands
http://www.ru.nl/nice/workingpapers

2
Abstract
We construct a compound measurement tool to comprehensively assess the quality of
financial reporting in terms of the underlying fundamental qualitative characteristics (i.e.
relevance and faithful representation) and the enhancing qualitative characteristics (i.e.
understandability, comparability, verifiability and timeliness) as defined in ‘An improved
Conceptual Framework for Financial Reporting’ of the FASB and the IASB (2008). The
operationalization of these qualitative characteristics results in a 21-item index. Using
231 annual reports from companies listed at US, UK, and Dutch stock markets in 2005
and 2007, we test our compound measurement tool on internal validity, inter-rater
reliability (Krippendorff’s alpha) and internal consistency (Cronbach’s alpha). Our
findings suggest that the measurement tool used in this study is a valid and reliable
approach to assess the quality of financial reports. The measurement tool contributes to
improving the quality assessment of financial reporting information, fulfilling a request
from both the FASB and the IASB (2008) to make the qualitative characteristics
operationally measurable.
Direct correspondence to Geert Braam, Department of Economics, Nijmegen School of
Management, Radboud University Nijmegen, P.O. Box 9108, 6500 HK Nijmegen, The
Netherlands. E-mail: [email protected]. Phone # +31(0)24-3613086.
3
1. Introduction
The primary objective of financial reporting is to provide high-quality financial reporting
information concerning economic entities, primarily financial in nature, useful for
economic decision making (FASB, 1999; IASB, 2008). Providing high quality financial
reporting information is important because it will positively influence capital providers
and other stakeholders in making investment, credit, and similar resource allocation
decisions enhancing overall market efficiency (IASB, 2006; IASB, 2008).
Although both the FASB and IASB stress the importance of high-quality financial
reports, one of the key problems found in prior literature is how to operationalize and
measure this quality. Because of its context-specificity, an empirical assessment of
financial reporting quality inevitably includes preferences among a myriad of constituents
(Dechow and Dichev, 2002; Schipper and Vincent, 2003; Botosan, 2004; Daske and
Gebhardt, 2006). Since different user groups will have dissimilar preferences, perceived
quality will deviate among constituents. In addition, the users within a user group may
also perceive the usefulness of similar information differently given its context. As a
result of this context and user-specificity, measuring quality directly seems problematic
(Botosan, 2004). Consequently, many researchers measure the quality of financial
reporting indirectly by focusing on attributes that are believed to influence quality of
financial reports, such as earnings management, financial restatements, and timeliness
(e.g. Barth et al., 2008; Schipper & Vincent, 2003; Cohen et al., 2004).
Despite a considerable interest in the effectiveness of accounting standards on the
quality of financial reporting, empirical literature emerged that offers contradictory
findings about the questions to what extent accounting standards contribute to the
decision usefulness of financial reporting information. Prior empirical studies
investigating the influence US GAAP and IFRS have on the quality of financial reports
show positive, insignificant and negative differential effects (Barth et al., 2008; Van der
Meulen et al., 2007; Barth et al., 2006; Bartov et al., 2005; Psaros & Trotman, 2004;
Amir et al., 1993; Ashbaugh and Olsson, 2002). Barth et al. (2006), for instance, find that
US firms reveal higher accounting quality than IAS firms, whereas Leuz (2003)
demonstrates insignificant differences in bid-ask spread between IAS and US firms.

4
Psaros and Trotman (2004), however, show results in favor of more principles-based
accounting standards.
One explanation for these inconsistent results is that the indirect measures used in
the empirical analyses focus on specific attributes of financial reporting information that
are expected to influence the quality of financial reporting, such as earnings management,
financial restatements, and timeliness (e.g. Barth et al., 2008; Schipper & Vincent, 2003;
Cohen et al., 2004; Nichols & Wahlen, 2004). However, none of these measurement
methods enables a comprehensive assessment of financial reporting quality including all
qualitative characteristics as defined in the Exposure Draft ‘An improved Conceptual
Framework for Financial Reporting’ [ED] of the FASB and the IASB (IASB, 2008). Inter
alia, earnings management detection tools highlight the importance of earnings quality
rather than financial reporting quality as overarching objective (Krishnan & Parsons,
2008; Burgstahler et al., 2006; Healy & Wahlen, 1999). Earnings quality is defined as
“the degree to which reported earnings capture economic reality, in order to appropriately
assess a company’s financial performance” (Krishnan & Parsons, 2008). However,
financial reporting quality is a broader concept that not only refers to financial
information, but also to disclosures, and other non-financial information useful for
decision making included in the report. Therefore, in the ED both the FASB and the
IASB (2008) explicitly express their desirability of constructing a comprehensive
measurement tool to assess the quality of financial reporting considering all dimensions
of decision usefulness. Hence, this measurement tool considers all the qualitative
characteristics because these characteristics determine the decision usefulness of financial
reporting information (IASB, 2008).
The primary aim of the present study is to contribute to improving measurement
of financial reporting quality. For this reason we operationalize the financial reporting
quality in terms of the fundamental characteristics (i.e. relevance and faithful
representation) and the enhancing qualitative characteristics (i.e. understandability,
comparability, verifiability and timeliness) as defined in the ED (IASB, 2008). A 21-item
index constructed allows us to examine to what extent financial reports meet each of the
qualitative characteristics separately and in combination. We use 231 annual reports from
companies listed at US, UK, and Dutch stock markets in 2005 and 2007 to test the
5
internal validity, inter-rater and internal consistency reliability of this compound
measurement tool. Our results show that the measurement tool assesses the quality of
financial reporting in a valid and reliable way.
Our study contributes to the literature in several ways. First, we construct a
comprehensive measurement tool to assess the quality of financial reporting, based on the
qualitative characteristics, as requested for by the FASB and IASB in the 2008 ED. As a
consequence, we update prior research on the assessment of qualitative characteristics,
e.g. Jonas and Blanchet (2000). Moreover, with this measurement tool we overcome
validity and reliability issues related to prior measurement methods such as earnings
management detection tools and value relevance models.
The remainder of this paper is organized as follows. In section two we review the
literature on financial reporting quality assessment tools. Thereafter, we develop our
more comprehensive measurement tools. In section four we empirically test the validity
and reliability of this measurement tool. Finally, we draw conclusions and discuss
implications of our study.
2. Literature overview of measurement methods to assess the quality of financial
reporting
In 2002, the IASB and the FASB showed their commitment towards developing a
common set of high-quality accounting standards, which could be used worldwide. As a
consequence of the joint project to converge the more principles-based IFRS and the
more rules-based US GAAP, both boards agreed to develop new joint Conceptual
Framework, which includes the objectives of financial reporting and the underlying
qualitative characteristics on which accounting standards ought to be based. In May 2008,
the FASB and the IASB therefore published an exposure draft of ‘An improved
Conceptual Framework for Financial Reporting’ [ED] (IASB, 2008; FASB, 2008a). This
Conceptual Framework represents the foundations of the accounting standards. “The
application of objectives and qualitative characteristics should lead to high-quality
accounting standards, which in turn should lead to high-quality financial reporting
information that is useful for decision making” (FASB, 1999; IASB, 2008). Furthermore,
the conceptual framework ought to contribute to decision making of constituents, when
6
transactions or events occur for which no accounting standards are available (yet).
According to the ED, providing decision-useful information is the primary objective of
financial reporting. Decision-useful information is defined as “information about the
reporting entity that is useful to present and potential equity investors, lenders and other
creditors in making decisions in their capacity as capital providers” (IASB, 2008: 12). In
line with the ED and recent literature, we define financial reporting quality in terms of
decision usefulness (e.g. Beuselinck & Manigart, 2007; Jonas & Blanchet, 2000;
McDaniel et al., 2002).
To assess the quality of financial reporting, various measurement methods have
been used. Table 1 provides a non-exhaustive classification of types of methods most
widely used in prior literature to assess financial reporting quality, i.e. accrual models,
value relevance models, research focusing on specific elements in the annual report, and
methods operationalizing the qualitative characteristics1.
TABLE 1 ABOUT HERE
Accrual and value relevance model focus on earnings quality measurement. Accrual
models are used to measure the extent of earnings management under current rules and
legislation. These models assume that managers use discretionary accruals, i.e. accruals
over which the manager can exert some control, to manage earnings (Healy & Wahlen,
1999; Dechow et al., 1995). Earnings management is assumed to negatively influence the
quality of financial reporting by reducing its decision usefulness (e.g. Brown, 1999; Van
Tendeloo & Vanstraelen, 2005). The main advantages of using discretionary accruals to
measure earnings management is that it can be calculated based on the information in the
annual report. In addition, when using regression models it is possible to examine the
effect of company characteristics on the extent of earnings management (Healy &
Wahlen 1999; Dechow et al. 1995). Moreover, this type of research is replicable. The
main difficulty when using accrual models, however, is how to distinguish between
discretionary and non-discretionary accruals (Healy & Wahlen, 1999). Furthermore, it is
1 Examples of measurement tools used in prior research which are outside the scope of this paper are Leuz
(2003) who uses bid-ask spread and trading volume as proxies of information asymmetry to measure
financial reporting quality, and Roychowdhury (2006), whos uses real activity manipulation to measure the
extent of earnings management.

7
only an indirect proxy of earnings quality, excluding non-financial information.
Therefore, conclusions concerning the quality of financial reporting information based on
accrual models do not provide direct and comprehensive evidence concerning the quality
of financial reporting information and its dimensions of decision usefulness (Healy &
Wahlen, 1999).
Value relevance models measure the quality of financial reporting information by
focusing on the associations between accounting figures and stock-market reactions (e.g.
Barth et al., 2001; Choi et al., 1997; Nichols & Wahlen, 2004). The stock price is
assumed to represent the market value of the firm, while accounting figures represent
firm value based on accounting procedures. When both concepts are (strongly)
correlated, i.e. changes in accounting information correspond to changes in market value
of the firm, it is assumed that earnings information provides relevant and reliable
information (Nichols & Wahlen, 2004). This method is also used to examine earnings
persistence, predictive ability, and variability, as elements of earnings quality (Schipper
& Vincent, 2003; Francis et al., 2004). The focus of value relevance literature on
relevance and faithful representation (reliability) is consistent with the ED, as these
notions are defined as the fundamental qualitative characteristics. However, this literature
does not distinguish between relevance and reliability, i.e. does not explicitly show
whether or not tradeoffs have been made when constructing accounting figures. In
addition, the stock market may not be completely efficient. As a consequence, stock
prices may not represent the market value of the firm completely accurate (Nichols &
Wahlen, 2004).
Accrual models and value relevance literature focus on information disclosed in
financial statements to assess the financial reporting quality (e.g. Healy & Wahlen, 1999;
Dechow et al., 1995; Barth et al., 2001; Choi et al., 1997; Nichols & Wahlen, 2004;
Leuz, 2003). However, a comprehensive measurement tool of financial reporting quality
would at least include the complete annual report, including both financial and non-
financial information. The third realm of research focuses on assessment tools that
measure the quality of specific elements of the annual report in depth and includes both
financial and non-financial information. It evaluates the influence of presenting specific
information in the annual report on the decisions made by the users. For instance, Hirst et
8
al. (2004) put emphasis on the use of fair value accounting and financial reporting
quality. Gearemynck and Willekens (2003) examine the relationship between the
auditor’s report and decision usefulness of financial reporting information. Beretta and
Bozzolan (2004) focus on the quality of internal control and risk disclosure information,
while Cohen et al. (2004) highlights the relationship between corporate governance
mechanisms and financial reporting quality. However, research that focuses on a specific
element in the annual report has a partial focus, and thus does not provide a
comprehensive overview of total financial reporting quality.
Methods that operationalize the qualitative characteristics aim to assess the quality
of different dimensions of information simultaneously to determine the decision
usefulness of financial reporting information. Jonas & Blanchet (2000), Lee et al. (2002)
and McDaniel et al. (2002) develop questions referring to the separate qualitative
characteristics in order to assess information quality. Although their research indicates
that qualitative characteristics can be made operational, their operationalizations are
based on the current frameworks of the FASB (1980) and the IASB (1989) rather than on
the new ED (2008). Therefore, some inconsistencies compared to the ED may exist. In
addition, some of these operationalizations are not complete and focus solely on
relevance and faithful representation (McDaniel et al., 2002). Although
understandability, comparability, and timeliness are perceived to be less important than
relevance and faithful representation, for a comprehensive assessment it remains
important to include them in the analysis. In addition, the complete annual report has to
be taken into account since financial reporting refers to both financial and non-financial
information.
In conclusion, accrual models and value relevance literature only focus on
information disclosed in financial statements to assess the financial reporting quality (e.g.
Healy & Wahlen, 1999; Dechow et al., 1995; Barth et al., 2001; Choi et al., 1997;
Nichols & Wahlen, 2004; Leuz, 2003). Research papers focusing on specific elements in
the annual report include both financial and non-financial information, but are not able to
assess financial reporting quality comprehensively (e.g. Hirst et al., 2004; Gearemynck &
Willekens, 2003; Beretta & Bozzolan, 2004; Cohen et al., 2004). This study develops and
tests a compound tool to comprehensively assess the quality of financial and non-
9
financial reporting information in the annual report considering all dimensions of
decision usefulness as defined in the ED.
3. Measurement of the quality of financial reporting in terms of the qualitative
characteristics
3.1 Operationalization of the qualitative characteristics
To construct a measurement tool, we use prior literature which defines financial reporting
quality in terms of the fundamental and enhancing qualitative characteristics underlying
decision usefulness as defined in the ED (IASB, 2008). The fundamental qualitative
characteristics (i.e. relevance and faithful representation) are most important and
determine the content of financial reporting information. The enhancing qualitative
characteristics (i.e. understandability, comparability, verifiability and timeliness) can
improve decision usefulness when the fundamental qualitative characteristics are
established. However, they cannot determine financial reporting quality on their own
(IASB, 2008).
Except for timeliness, each of the qualitative characteristics in the ED is measured
using the multiple items that refer to the sub notions of the qualitative characteristics. To
assure the internal validity of these items, the quality measures are based on prior
empirical literature. We use a five point rating scales to assess the scores on the items.
Appendix A provides an overview of the 21 measured items used to operationalize the
fundamental and enhancing qualitative characteristic. This appendix also includes the
measurement scales used to assess the value of the distinct items. Subsequently, we
compute a standardized outcome for the qualitative characteristics relevance, faithful
representation, understandability and comparability by adding the scores on the related
items and dividing by the total number of items.
Relevance
Relevance is referred to as the capability “of making a difference in the decisions made
by users in their capacity as capital providers” (IASB, 2008: 35). Drawing on prior
literature, relevance is operationalized using four items referring to predictive and
confirmatory value. As discussed earlier, researchers tend to focus on earnings quality
instead of on financial reporting quality. This definition is limited in scope because it
10
neglects non-financial information and it excludes ‘future’ financial information already
available to the users of the annual report, for example on future transactions (Jonas &
Blanchet, 2000; Nichols & Wahlen, 2004). In order to improve the comprehensiveness of
the quality assessing measurement tool, this study will consider a broader perspective on
predictive value including both financial and non-financial information.
Many researchers have operationalized predictive value as the ability of past
earnings to predict future earnings (e.g. Francis et al., 2004; Lipe, 1990; Schipper &
Vincent, 2003). Predictive value explicitly refers to information on the firm’s ability to
generate future cash flows: “information about an economic phenomenon has predictive
value if it has value as an input to predictive processes used by capital providers to form
their own expectations about the future” (IASB, 2008: 36). We consider predictive value
as most important indicator of relevance in terms of decision usefulness and measure
predictive value using three items. The first item measures the extent to which annual
reports provide forward-looking statements. The forward-looking statement usually
describes management’s expectations for future years of the company. For capital
providers and other users of the annual report this information is relevant since
management has access to private information to produce a forecast that is not available
to other stakeholders (Bartov & Mohanram, 2004) [R1].
The second item measures to what extent the annual reports discloses information
in terms of business opportunities and risks. Jonas and Blanchet (2000) refer to the
complementation of financial information by non-financial information, when referring to
predictive value, and the knowledge that can be obtained of business opportunities and
risks, since it provides insight into possible future scenarios for the company [R2].
The third item measures company’s use of fair value. Prior literature usually
refers to the use of fair value versus historical cost when discussing the predictive value
of financial reporting information (e.g. Barth et al., 2001; Hirst et al., 2004; McDaniel et
al. 2002; Schipper & Vincent, 2003; Schipper, 2003). It is often claimed that fair value
accounting provides more relevant information than historical cost because it represents
the current value of assets, instead of the purchase price (inter alia Maines & Wahlen,
2006; Schipper & Vincent, 2003). In addition, both the FASB and IASB are currently
considering new standards to allow more fair value accounting to increase the relevance

11
of financial reporting information, since they consider fair value as one of most important
methods to increase relevance (Barth et al., 2001) [R3].2
In addition to predictive value, confirmatory value contributes to the relevance of
financial reporting information. Information has confirmatory value “if it confirms or
changes past (or present) expectations based on previous evaluations” (IASB, 2008: 36).
Jonas and Blanchet (2000) argue that if the information in the annual report provides
feedback to the users of the annual report about previous transactions or events, this will
help them to confirm or change their expectations [R4]. Especially the financial
statements and the ‘Management, Discussion & Analysis’ (MD&A) section of the annual
report will be reviewed in order to gain insight into the confirmatory value of the
information. These sections generally provide information with confirmatory value
(Jonas & Blanchet, 2000).
Faithful representation
Faithful representation is the second fundamental qualitative characteristic as elaborated
in the ED. To faithfully represent economic phenomena that information purports to
represent, annual reports must be complete, neutral, and free from material error (IASB,
2008: 36). Economic phenomena represented in the annual report are “economic
resources and obligations and the transactions and other events and circumstances that
change them” (IASB, 2006: 48). Consistent with prior literature, faithful representation is
measured using five items referring to neutrality, completeness, freedom from material
error, and verifiability (Dechow et al., 1996; McMullen, 1996; Beasley, 1996; Rezaee,
2003; Cohen et al., 2004; Sloan, 2001; Jonas & Blanchet, 2000; Maines & Wahlen, 2006;
Gaeremynck & Willekens, 2003; Kim et al., 2007; Willekens, 2008). 3
2 Jonas and Blanchet (2000: 360) include one additional item referring to relevance and predictive value:
“When identifying unusual or nonrecurring items for disclosure, are both gains and losses given equal
importance?” This question is not included in the measurement tool since the second item referring to the
relationship between financial and non-financial information already incorporates disclosures of unusual or
nonrecurring items. Additionally, whether they are given equal importance is in our opinion more closely
related to neutrality, a sub notion of faithful representation, than to predictive value.
3 Note that the ED distinguishes verifiability as a separate enhancing qualitative characteristic.
“Verifiability is a quality of information that helps assure users that information faithfully represents

12
Botosan (2004) argues that it is difficult to measure faithful representation directly
by only assessing the annual report, since information about the actual economic
phenomenon is necessary to assure faithful representation. According to Maines and
Wahlen (2006), however, estimates and assumptions that closely correspond to the
underlying economic constructs the standards pursue can enhance faithful representation.
Therefore, we focus on items in the annual report that increase the probability of
faithfully represented information. These items do not always directly refer to the US
GAAP or IFRS, yet they provide an indirect proxy of faithful representation of financial
reporting information prepared in accordance with certain accounting standards.
The first proxy refers to the issue ‘free from bias’. An annual report can never be
completely free from bias, since economic phenomena presented in annual reports are
frequently measured under conditions of uncertainty. Many estimates and assumptions
are included in the annual report. Although complete lack of bias cannot be achieved, a
certain level of accuracy is necessary for financial reporting information to be decision
useful (IASB, 2008). Therefore, it is important to examine the argumentation provided
for the different estimates and assumptions made in the annual report (Jonas & Blanchet,
2000). If valid arguments are provided for the assumptions and estimates made, they are
likely to represent the economic phenomena without bias [F1].
In addition, valid and well-grounded arguments provided for the accounting
principles used increase the likelihood that preparers fully understand the measurement
method. This will reduce the possibility of unintentional material errors in their financial
report (Jonas & Blanchet, 2000; Maines & Wahlen; 2006). Moreover, when the selected
accounting principles are clearly described and well-founded, it increases the probability
to reach consensus and to detect misstatements for the user of the financial report as well
as for the auditor [F2].
economic phenomena that it purports to represent. Verifiability implies that different knowledgeable users
of financial reporting information reach general consensus, although not necessarily complete agreement”
(IASB, 2008; 39). Since the aim of the measurement tool is to assess each of the qualitative characteristics
and verifiability directly refers to the assessment of faithful representation, verifiability is included in the
measurement tool as a sub notion of this fundamental qualitative characteristic This view is supported by
the preliminary views on an improved conceptual framework for financial reporting (IASB, 2006) and the
concept statements of the FASB (1980), which both include verifiability as a sub notion of faithful
representation.

13
The third sub notion of faithful representation, neutrality, is defined as “the
absence of bias intended to attain a predetermined result or to induce a particular
behaviour. Neutral information does not colour the image it communicates to influence
behaviour in a particular direction” (IASB, 2008: 37). As Jonas and Blanchet (2000: 362)
state: “neutrality is about objectivity and balance”. Neutrality refers to the intent of the
preparer; the preparer should strive for an objective presentation of events rather than
focusing solely on the positive events that occur without mentioning negative events
[F3].
The fourth construct to measure faithful representation refers to the unqualified
auditor’s report. Various researchers examined the impact of an audit and the auditors’
report on the economic value of the firm (e.g. Gaeremynck & Willekens, 2003; Kim et
al., 2007; Willekens, 2008). These researchers concluded that the auditors’ report adds
value to financial reporting information by providing reasonable assurance about the
degree to which the annual report represents economic phenomena faithfully. Maines and
Wahlen (2006) even argue that an unqualified audit report is a necessary condition to
perceive the financial reporting information as reliable or faithfully represented [F4].
Finally, an increasingly important consideration in the annual report related to
faithful representation is the corporate governance statement. 4
Corporate governance can
be defined as the mechanisms by which a business enterprise, organised in a limited
liability corporate form, is directed and controlled. Several researchers examine the
association between financial reporting quality and corporate governance, internal
control, earnings manipulations and fraud, and find that poor governance and internal
controls reduce the quality of financial reporting (e.g. Dechow et al., 1996; McMullen,
1996; Beasley, 1996; Rezaee, 2003). Apparently, corporate governance information adds
value to capital providers. More specifically, corporate governance information increases
the probability of faithfully represented information (Sloan, 2001; Holland, 1999) [F5]. 5
4 Items not directly referring to US GAAP or IFRS are F4 and F5. F4 refers to auditing standards, whereas
F5 refers to national corporate governance codes. However, a close link exists between auditing standards,
national corporate governance codes and information prepared in accordance with US GAAP and IFRS.
5 Jonas and Blanchet (2000) include an additional question referring to faithful representation which is not
included in our measurement tool. This question refers to the intentions of management: “To what extent
does the company enter into (or modify) transactions in order to achieve a specific accounting result?”
14
Understandability
The first enhancing qualitative characteristic, understandability, will increase when
information is classified, characterized, and presented clearly and concisely.
Understandability is referred to, when the quality of information enables users to
comprehend their meaning (IASB, 2008). Understandability is measured using five items
that emphasize the transparency and clearness of the information presented in annual
reports (Jonas & Blanchet, 2000; Iu & Clowes, 2004; Courtis, 2005; IASB, 2006).
First, classified and characterized information refers to how well-organized the
information in the annual report is presented. If the annual report is well-organized it is
easier to understand where to search for specific information (Jonas & Blanchet, 2000)
[U1]. Furthermore, disclosure information, and in particular the notes to the balance sheet
and income statement, may be valuable in terms of explaining and providing more insight
into earnings figures (Beretta & Bozzolan, 2004). Especially narrative explanations help
to increase the understandability of information (IASB, 2006; Iu & Clowes, 2004) [U2].
Additionally, the presence of tabular or graphic formats may improve
understandability by clarifying relationships and ensuring conciseness (IASB, 2006;
Jonas & Blanchet, 2000) [U3]. Moreover, if the preparer of the annual report combines
words and sentences that are easy to understand, the reader will be more likely to
understand the content as well (Courtis, 2005). If technical jargon is unavoidable, for
instance industry related jargon, an explanation in a glossary may increase the
understandability of the information [U4, U5].
Comparability
A second enhancing qualitative characteristic is comparability, which “is the quality of
information that enables users to identify similarities in and differences between two sets
of economic phenomena” (IASB, 2008: 39). In other words, similar situations should be
(Jonas & Blanchet, 2000: 362). As Botosan (2004) states, it is difficult to ensure faithful representation
since insider information is lacking. For this reason we are not able to answer this question and the question
is not included in the measurement tool. However, the item referring to corporate governance provides
some insight in the efforts of management to ensure honest accounting procedures and results.

15
presented the same, while different situations should be presented differently6.
Comparability is measured using six items that focus on consistency. Four items refer to
the consistency in use of the same accounting policies and procedures from period to
period within a company (Jonas & Blanchet, 2000; Vincent & Schipper, 2003;
Beuselinck & Manigart, 2007; Cole et al., 2007). Two items are used to measure the
comparability in a single period across companies (Cleary, 1999; Jonas & Blanchet,
2000; Cole et al., 2007; Beuselick & Manigart, 2007; IASB, 2008).
Comparability includes consistency. “Consistency refers to the use of the same
accounting policies and procedures, either from period to period within an entity or in a
single period across entities” (IASB, 2008: 39). According to the ED, companies should
strive for comparability by means of consistency. Jonas and Blanchet (2000)
operationalize consistency by referring to coping with change and uncertainty. New
information, rules or regulation generally cause companies to change their estimates,
judgements, and accounting policies. For instance, if new information is available which
encourages a revision of the expected lifetime of a certain asset, this may result in a
change of estimate. In addition, many EU-listed companies changed from local GAAP to
IFRS in 2005, as a result of new rules and legislation. In terms of consistency it is
important that these companies explain how these changes affect previous results [C1,
C2]. The comparability of earnings figures is important in the evaluation of the firm’s
performance over time (IASB, 2006; Cole et al., 2007). If a company changes its
estimates, judgements, or accounting policies it may adjust previous years’ earnings
figures in order to visualize the impact of the change on previous results [C3].
Additionally, since consistency refers to using the same accounting procedures
every year, this year’s figures should be comparable to previous years’ figures (IASB,
2008). When a company provides an overview in which they compare the results of
different years, even when no changes in estimates, judgements, or accounting policies
occurred, this will improve the comparability of financial reporting information [C4].
6 A difference exists between comparability and uniformity. Some authors argue that uniformity is an
indicator of comparability (e.g. Cole et al., 2007). However, the ED explicitly states that comparability is
not similar to uniformity. If companies pursuit uniformity, not only similar things look alike but also
different things look alike. This is not the purpose of the IASB and FASB, since uniformity could lead to
surface comparability (Schipper, 2003).

16
Comparability not only refers to the consistency of the use of accounting
procedures by a single company, it also refers to comparability between different
companies (IASB, 2008). When assessing the comparability of annual reports of different
companies, the accounting policies used, the structure of the annual report, and the
explanation of transactions and other events are of special importance (Jonas & Blanchet,
2000) [C5]. In addition, ratios and index numbers can be useful when comparing
companies’ performance [C6].
Timeliness
The final enhancing qualitative characteristic defined in the ED is timeliness. “Timeliness
means having information available to decision makers before it loses its capacity to
influence decisions” (IASB, 2008: 40). Timeliness refers to the time it takes to reveal the
information and is related to decision usefulness in general (IASB, 2008). When
examining the quality of information in annual reports, timeliness is measured using the
natural logarithm of amount of days between year end and the signature on the auditors’
report after year end is calculated. Based on the natural logarithm of this amount of days,
each company received a score between 1 and 5.
3.2 Assessment of financial reporting quality
To assess the quality of financial reporting we first computed standardized scores on the
fundamental and enhancing qualitative characteristics. The standardized score of the
fundamental qualitative characteristics relevance and faithful representation is calculated
by adding the standardized scores of relevance and faithful representation, divided by 2.
Hence, both fundamental qualitative characteristics are weighted equally. The same
procedure is performed for the enhancing qualitative characteristics. This process results
in a score between 1 and 5 for all qualitative characteristics: 1 indicating a poor score,
while an outcome of 5 implies excellence.
The quality of financial reporting is measured by including both the scores on the
fundamental and enhancing qualitative characteristics. Since the ED considers the
fundamental qualitative characteristics most important in relation to financial reporting
quality, we have weighted the scores on the fundamental qualitative characteristics higher
17
than the scores on the enhancing qualitative characteristics. For robustness purposes, we
examined the impact of the relative weights on the regression results (see Table 6, panel
C). In addition, the quality of financial reporting is also measured using only the scores
on the fundamental qualitative characteristics.
Table 2 provides an overview of the scores on each of the 21 operational items.
TABLE 2 ABOUT HERE
4. Validity and reliability checks
4.1 Sample and statistical analysis
To test the 21-item index quality assessment tool on internal validity and inter-rater and
internal consistency reliability we use a sample of 231 annual reports from companies
that were quoted on US, UK, and Dutch stock exchanges in 2005 and 2007. The first set
of observations includes annual reports of the year 2005, because companies within the
European Union were first mandatory to comply with IFRS in 2005. For 2005, 120
observations were made; i.e. we randomly selected 40 US, 40 UK and 40 Dutch listed
companies. For 2007, 111 observations were made. No data was available for 9 of the
120 companies selected in 2005, because these companies were delisted from the stock
exchange prior to 2008 or did not publish their annual report of 2007 prior to our data
collection.
We selected companies listed in the US, the UK and the Netherlands because all
three countries selected have a strong legal system and enforcement environment (e.g. La
Porta at al., 1998; La Porta et al., 2000; Ball et al. 2000, Leuz et al., 2003; Nobes &
Parker, 2006). The selected US-listed companies comply with US GAAP, while the
annual reports of companies selected from the UK and the Netherlands have to comply
with IFRS. We selected companies from two ‘IFRS countries’ with fairly similar
institutional systems to control for cross-country differences in financial reporting
quality, which are likely to remain after IFRS adoption as a result of differences in
institutional settings (Soderstrom & Sun, 2007; Nobes & Parker, 2006; Burgstahler et al.,
2006; Leuz et al., 2003; Camfferman & Cooke, 2002; LaPorta et al., 1998).
Companies complying with IFRS publish a commercial annual report. US GAAP
annual reports are published in two forms: Form 10-K for domestic-listed companies and

18
Form 20-F for foreign private issuers, or cross-listed companies (SEC, 2008). This
research takes all three forms of the annual report into account. If in the annual report
references are made to other documents, like the corporate governance report, these
documents are also considered in order to determine financial reporting quality. Non-
financial information that is not included in the annual report or not specifically referred
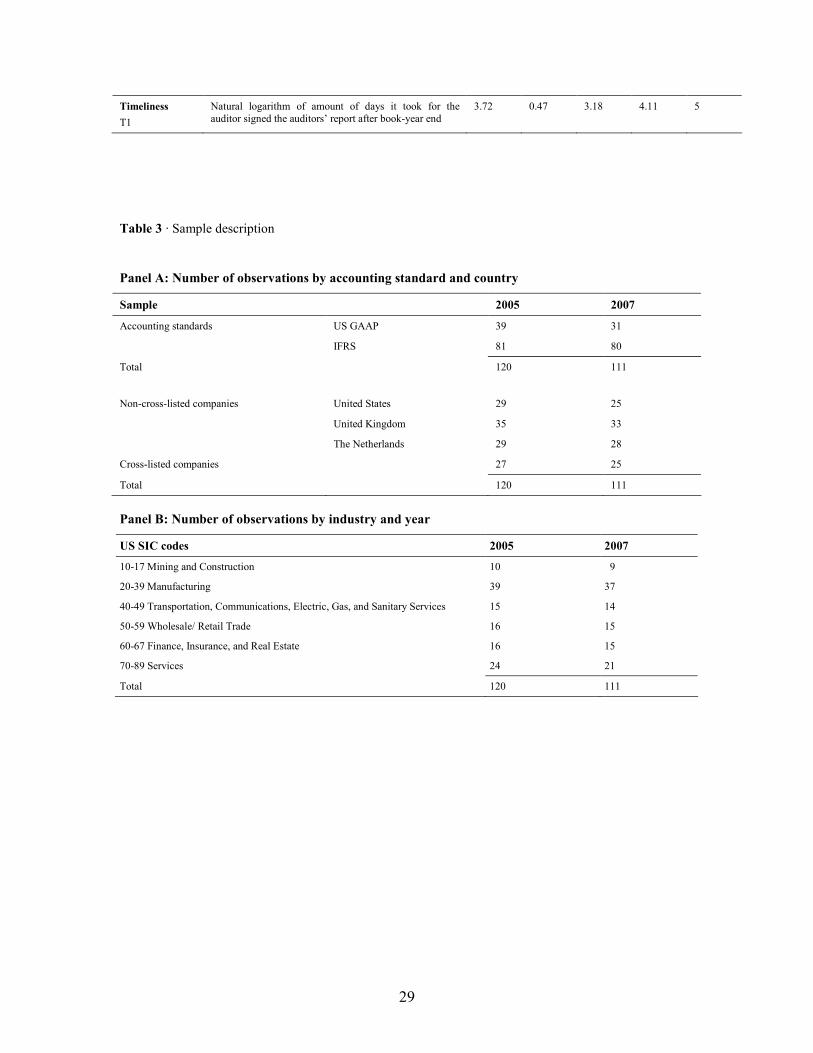
to is beyond the scope of this research. Table 3 provides an overview of the annual
reports included in the sample.
TABLE 3 ABOUT HERE
4.2 Empirical checks on quality assessment validity and reliability
4.2.1 Validity checks
To assure the construct validity of the quality measures, the measures are based on prior
literature. To test the measurement tool’s internal validity we compared our results with
prior empirical results; we examine whether the influence of several factors on the
financial reporting quality is consistent with empirical findings in prior research. For our
study in particular, we assessed the influence of the accounting standards used, a
country’s legal and institutional environment, industry effects, company size and leverage
and year on the quality of the selected companies’ annual reports.
Table 4 presents the descriptive statistics for quality of financial reports related to
accounting standards and country. These results suggest that US GAAP provide higher
financial reporting quality than IFRS for both quality measures. In addition, the results
show an increase in total financial reporting quality between 2005 and 2007 for both US
GAAP and IFRS annual reports. To test whether these quality differences are significant,
we conducted OLS regressions. Before explaining the results of the OLS regression
analysis, the model was tested on linearity, homoscedasticity, multicollinearity and
normally distributed data. The scatter plots of the residuals show a random array of dots,
indicating linearity and homoscedasticity. Table 5 shows that the variance inflation factor
(VIF) was smaller than 2 for each of the variables in each of the regression models,
which indicates the absence of multicollinearity. Finally, all variables were normally
distributed.
19
TABLE 4 AND 5 ABOUT HERE
Table 6, panel A and B present the regression results to test whether the influence of
several factors described on the on financial reporting quality is consistent with empirical
findings in prior research. Consistent with results in prior literature (Bartov et al., 2005;
Leuz, 2003; Leuz et al., 2003; Amir et al., 1993; Ashbaugh & Olsson, 2002), the results
in both panels show no significant differential influence of the accounting standards on
accounting quality. In addition, the results in panels A and B reveal a significant
influence of the variables company size, country, industry and year on the quality of
financial reporting (Burgstahler et al., 2006; Tarca, 2004; Leuz et al., 2003). Consistent
with prior empirical findings, these findings demonstrate a positive influence of company
size on the quality of financial reporting. Furthermore, the results show an association
between country, type of industry and financial reporting quality (Burgstahler at al.,
2006; Leuz et al., 2003; Soderstrom & Sun, 2007; LaPorta et al., 1998). Finally, our
results reveal that the quality of financial reporting is increasing over time. In addition,
we performed a robustness analysis to examine the influence of the proportion of the
fundamental to the enhancing qualitative characteristics. Table 6 panel C shows that the
results are robust for different weightings of both fundamental and enhancing qualitative
characteristics (Bennett et al., 2006).
TABLE 6 ABOUT HERE
When measuring financial reporting quality exclusively in terms of the fundamental
qualitative characteristics relevance and faithful representation, the findings in Table 4
suggest that US GAAP annual reports provide information that more faithfully represents
economic phenomena than IFRS annual reports. On the other hand, IFRS annual reports
provide more relevant information than US GAAP annual reports. To test whether these
quality differences are significant, Table 7 shows that the influence of US GAAP and
IFRS on the underlying qualitative characteristics differs significantly. Inter alia, Panel A
of Table 7 shows that the quality scores on relevance are higher in the IFRS annual
reports than in the US GAAP annual reports, whereas panel B shows that the quality
scores on faithful representation are higher in the US GAAP annual reports than in the
IFRS annual reports. Consistent with prior literature, these results suggest that annual

20
reports prepared in accordance with IFRS offer more relevant information (Maines &
Wahlen, 2006; Bennett et al., 2006; Benston et al., 2006; Psaros & Trotman, 2004;
Schipper & Vincent, 2003), whereas US GAAP annual reports provide information that
more faithfully represents economic phenomena (Alexander & Jermakowicz, 2006;
Nelson, 2003). Consistent with prior findings, and in combination with the results in
Table 6 these findings suggest that the differential effects of IFRS and US GAAP on the
relevance of annual reports are neutralized by the opposite differential effects of these
accounting standards on the faithful representation of annual reports.
TABLE 7 ABOUT HERE
4.2.2 Reliability checks
All qualitative characteristics were measured by two independent raters. This was
necessary, because raters need judgement when assessing financial reporting quality
based on the qualitative characteristics and a lack of inside information may cause
problems when interpreting and quantifying the qualitative characteristics (Botosan,
2004). To test the inter-rater reliability, the inter-rater reliability coefficient
Krippendorff’s alpha was calculated. This reliability statistic is rooted in content analysis
and is applicable to various circumstances, including the use of ordinal data and small
sample sizes (Krippendorff, 1980). The value for the Krippendorff’s alpha was 0.79
which is above the required 0.70. This suggests that the quality scores are reliable, i.e.
agreement between the coders about their quality estimations made. To test the internal
reliability of the measurement scales we used Cronbach’s alpha. Based on the
adjustments suggested by Bernardi (1994), Table 8 panels A and B show that the
Cronbach’s alpha is sufficiently high to ensure reliable results.
5. Conclusion and discussion
The aim of our study was to develop and test a compound measurement tool to
comprehensively assess the quality of financial reports. Therefore we constructed a 21-
item index in order to comprehensively measure the quality of financial reporting in
terms of the underlying fundamental and enhancing qualitative characteristics as defined
in the ED (IASB, 2008). Comprehensive assessment of the quality of financial reports is
important as it may improve users’ quality of economic decision making and enhance
21
overall market efficiency (IASB, 2006; IASB, 2008), thereby reducing the cost of capital
for companies.
To assure the construct validity of the measurement tool developed, the quality
measures were strongly based on prior empirical literature. In addition, the empirical
results show that that the influence of several variables such as accounting standards,
legal system and enforcement environment, firm size and industry on the financial
reporting quality is consistent with empirical findings in prior research using other quality
assessment tools. Our empirical findings support the idea that the compound
measurement tool used in this study is a valid approach to assess the quality of financial
reports. Additional analysis demonstrates that the quality assessment is robust for the
influence of different weightings of both fundamental and enhancing qualitative
characteristics. To assess the reliability of the 21-item index, we test our results for both
inter-rater reliability (using Krippendorff’s alpha) and internal consistency reliability
(using Cronbach’s alpha). Both results are sufficiently high to ensure reliable results.
The comprehensive measurement tool constructed, however, has several
limitations relating to validity and reliability. Consistent with the definition of quality of
financial reporting, i.e. decision usefulness (IASB, 2008), its validity should be
established by comparing our measured results to the decision usefulness of financial
reporting as perceived by stakeholders such as equity providers or lenders. In addition,
comparing the results of our comprehensive measurement tool with the results of other
quality assessment tools using the same sample may increase insight into the validity and
reliability of financial reporting quality assessment tools. Finally, the reader should bear
in mind that the study is based on a relatively small sample. Future research, using larger
samples, may provide additional insights into the external validity of our results. Such
insights may also help to create deeper understanding concerning the assessment of the
quality of financial reporting.

22
References
-Alexander, D. & Jermakowicz, E. (2006). True and Fair View of the Principles/Rules
Debate. Abacus, 42(2), 132-164.
- Amir, E., Harris, T. & Venuti, E.K. (1993). A Comparison of the Value-Relevance of
U.S. Versus Non-U.S. GAAP Accounting Measures Using Form 20-F Reconciliations.
Journal of Accounting Research, 31, 230-264 (Supplement).
- Ashbaugh, H. & Olsson, P. (2002). An Exploratory Study of the Valuation Properties of
Cross-Listed Firms’ IAS and U.S. GAAP Earnings and Book Values. The Accounting
Review 77(1), 107–27.
- Ball, R., Kothari, S. & Robin, A. (2000). The effect of international institutional factors
on properties of accounting earnings. Journal of Accounting and Economics, 29, 1-51.
- Barth, M., Beaver, W. & Landsman, W. (2001). The relevance of the value relevance
literature for financial accounting standard setting: another view. Journal of Accounting
and Economics, 31, 77-104.
- Barth, M., Landsman, W., Lang, M. & Williams, C. (2006). Accounting Quality:
International Accounting Standards and US GAAP. Working paper series.
- Barth, M., Landsman, W. & Lang, M. (2008). International Accounting Standards and
Accounting Quality. Journal of Accounting Research, 46(3), 467-498.
- Bartov, E., Goldberg, S. & Kim, M. (2005). Comparative value relevance among
German, U.S., and international accounting standards: A German stock market
perspective. Journal of Accounting, Auditing and Finance, 20(2), 95-119.
- Bartov, E. & Mohanram, P. (2004). Private information, earnings manipulations, and
executive stock-option exercises. The Accounting Review, 79(4), 889-1010.
- Beasley, M. (1996). An empirical analysis of the relation between board of director
compensation and financial statement fraud. The Accounting Review, 71(4), 443-466.
- Bennett, B., Bradbury, M. & Prangnell, H. (2006). Rules, Principles and Judgments in
Accounting Standards. Abacus, 42(2), 189-204.
- Benston, G., Bromwich, M. & Wagenhofer, A. (2006). Principles- Versus Rules-Based
Accounting Standards: The FASB’s Standard Setting Strategy. Abacus, 42(2), 165-188.
- Beretta, S. & Bozzolan, S. (2004). A framework for the analysis of firm risk
communication. The International Journal of Accounting, 39, 265-288.
- Bernandi, R. (1994). Validating research results when Cronbach’s alpha is below .70: A
methodological procedure. Educational and Psychological Measurement, 54(3), 766-775.

23
- Beuselinck, C. & Manigart, S. (2007). Financial Reporting Quality in Private Equity
Backed Companies: The Impact of Ownership Concentration. Small Business Economics,
29, 261-274.
- Botosan, C. (2004). Discussion of a framework for the analysis of risk communication.
The International Journal of Accounting, 39, 289-295.
- Burgstahler, D., Hail, L. & Leuz, C. (2006). The Importance of Reporting Incentives:
Earnings Management in European Private and Public Firms. The Accounting Review,
81(5), 983-1016.
- Camfferman, K. & Cooke, T.E. (2002). An analysis of disclosure in the annual reports
of U.K. and Dutch companies. Journal of International Accounting Research, 1, 3-30.
- Choi, B., D.W. Collins & W.B. Johnson (1997), Valuation Implications of Reliability
Differences: The Case of Nonpension Postretirement Obligations, The Accounting
Review 72(3): 351-383.
- Cleary, S. (1999). The Relationship between Firm Investment and Financial Status.
Journal of Finance, 54(2), pp. 673-692.
- Cohen, J., Krishnamorthy, G. & Wright, A. (2004). The corporate governance mosaic
and financial reporting quality. Journal of Accounting Literature, 23, 87-152.
- Cole, V., Branson, J. & Breesch, D. (2007). A review of the different methods developed
to measure the comparability of financial statements, Working paper series.
- Courtis, J. (1995). Readability of annual reports: Western versus Asian evidence.
Accounting, Auditing and Accountability Journal, 8(2), 4-17.
- Daske, H. & Gebhardt, G. (2006). Internation Financial Reporting Standards and
Experts’ Perceptions of Disclosure Quality. Abacus, 42(3-4), 461-498.
- Dechow, P.M., Sloan, R.G. & Sweeney, A.P. (1996). Causes and consequences of
earnings manipulation: An analysis of firms subject to enforcement actions by the SEC.
Contemporary Accounting Research, 13(1), 1-36.
- Dechow, P.M., Sloan, R.G. and Sweeny, A.P. (1995), Detecting earnings management,
The Accounting review, 70(2): 193-225.
- Dechow, P. & Dichev, I. (2002). The Quality of Accruals and Earnings: The Role of
Accrual Estimation Errors. The Accounting Review, 77, 35-59 (Supplement).
- Eisinga, R., Scheepers, P. & Van Snippenburg, L. (1991). The standardized effect of a
compound of dummy variables or polynomial terms. Quality and Quantity, 25(4), 103-
114.

24
- FASB (1980). Statement of Financial Accounting Concepts No. 2., Qualitative
Characteristics of Accounting Information. Norwalk.
- FASB (1999). International standard setting: a vision for the future. Norwalk.
- FASB (2008). Financial Accounting Series, Statement of Financial Accounting
Standards No. 1570-100: Exposure Draft on an Improved Conceptual Framework for
Financial Reporting. Norwalk.
- FASB. Convergence with the IASB. Available at:
http://www.fasb.org/intl/convergence_iasb.shtml (accessed July 12 2008).
- FASB. Completed/Past Agenda Projects. Available at:
http://www.fasb.org/project/completed_past_projects.shtml (accessed July 13 2008).
- FASB. Principles-Based Approach to Standard Setting. Available at:
http://72.3.243.42/project/principles-based_approach.shtml (accessed February 12 2008).
- FASB. Completing the February 2006 Memorandum of Understanding: A progress
report and timetable for completion September 2008. Available at:
http://72.3.243.42/intl/MOU_09-11-08.pdf (accessed February 17 2008).
- Francis, J., LaFond, R., Olsson, P. & Schipper, K. (2004). Cost of Equity and Earnings
Attributes. The Accounting Review, 79(4), 967-1010.
- Gaeremynck, A. & Willekens, M. (2003). The Endogenous Relationship between
Audit-Report Type and Business Termination: Evidence on Private Firms in a Non-
Litigious Environment. Accounting and Business Research, 33(1), 65-79.
- Healy, P. & Wahlen, J. (1999). A review of the earnings managment literature and its
implications for standard settings. Accounting Horizons, 13(4), 365-383.
- Hirst, D., Hopkins, P. & Wahlen, J. (2004). Fair Values, Income Measurement, and
Bank Analysts’ Risk and Valuation Judgments. The Accounting Review, 79(2), 453-472.
- Holland, J. (1999). Financial Reporting, Private Disclosure and the Corporate
Governance Role of Financial Institutions. Journal of Management and Governance,
3(2), 161-187.
- Holthausen, R.W. & Watts, R.L. (2001). The relevance of value-relevance literature for
financial accounting standard setting. Journal of Accounting and Economics, 31, 3-75.
- IASB (1989). Framework for the Preparation and Presentation of Financial Statements.
London.
- IASB (2008). Exposure Draft on an improved Conceptual Framework for Financial
Reporting: The Objective of Financial Reporting and Qualitative Characteristics of
Decision-useful Financial Reporting Information. London.
25
- Iu, J. & Clowes, C. (2004). Evaluating a measure of content quality for accounting
narratives (with an empirical application to narratives from Australia, Hong Kong, and
the United States). Working paper series.
- Jonas, G. & Blanchet, J. (2000). Assessing Quality of Financial Reporting. Accounting
Horizons, 14(3), 353-363.
- Kim, J., Simunic, D., Stein, M. & Yi, C.H. (2007). Voluntary Audits and the Cost of
Debt Capital for Privately Held Firms: Korean Evidence. Working paper series.
- Krippendorff, K. (1980) Content Analysis: An Introduction to its Methodology. (Beverly
Hills CA: Sage).
- Krishnan, G. & Parsons, L. (2008). Getting to the Bottom Line: An Exploration of
Gender and Earnings Quality. Journal of Business Ethics, 78(1), 65-76.
- La Porta, R., Lopez-de-Silanes, F., Shleifer, A. & Vishny, R. (1998). Law and Finance.
Journal of Political Economy, 106(6), 1113-1155.
- La Porta, R., Lopez-de-Silanes, F., Shleifer, A. & Vishny, R. (2000). Investor protection
and corporate governance. Journal of Finance and Economics, 58, 3-27.
- Lee, Y.W., Strong, D.M., Kahn, B.K. & Wang, R.Y. (2002). AIMQ: a methodology for
information quality assessment. Information and Management, 40, 133-146
- Leuz, C. (2003). IAS Versus U.S. GAAP: Information Asymmetry-Based on Evidence
from Germany’s New Market. Journal of Accounting Research, 41(9), 445-472.
- Leuz, C. (2003). IAS Versus U.S. GAAP: Information Asymmetry-Based on Evidence
from Germany’s New Market. Journal of Accounting Research, 41(9), 445-472
- Leuz, C., Nanda, D. & Wysocki, P.D. (2003). Earnings management and investor
protection: An international comparison. Journal of Financial Economics, 69, pp. 505-
527.
- Lipe, R. (1990). The relation between stock returns and accounting earnings given
alternative information. The Accounting Review, 65, 49-71.
- Maines, L. & Wahlen, J. (2006). The Nature of Accounting Information Reliability:
Inferences from Archival and Experimental Research. Accounting Horizons, 20(4), 399-
425.
- McDaniel, L., Martin, R. & Maines, L. (2002). Evaluating Financial Reporting Quality:
the Effects of Financial Expertise vs. Financial Literacy. The Accounting Review, 77,
139-167 (Supplement).
- McMullen, D. (1996). Audit committee performance: An investigation of the
consequences associated with audit committees. Auditing, 15(1), 87-103.

26
- Nelson, M. (2003). Behavioral Evidence on the Effects of Principles- and Rules-Based
Standards. Accounting Horizons, 17(1), 91-104.
- Nichols, D. & Wahlen, J. (2004). How Do Earnings Numbers Relate to Stock Returns?
A Review of Classic Accounting Research with Updated Evidence. Accounting Horizons,
18(4), 263-286.
- Nobes, C. & Parker, R. (2006). Comparative International Accounting. Harlow:
Prentice Hall/Financial Times.
- Psaros, J. & Trotman, K. (2004). The Impact of the Type of Accounting Standards on
Preparers’ Judgments. Abacus, 40(1), 76-93.
- Remus, W. (1986). Graduate students as surrogates for managers in experiments on
business decision making. Journal of Business Research, 14, 19-25.
- Rezaee, Z. (2003). High-quality financial reporting: The six-legged stool. Strategic
Finance, 84(8), 26-30.
- Schipper, K. (2003). Commentary: Principles-Based Accounting Standards. Accounting
Horizons, 17(1), 61-72.
- Schipper, K. & Vincent, L. (2003). Earnings Quality, Accounting Horizons, 17, 97-110
(Supplement).
- SEC, Acceptance from Foreign Private Issuers of Financial Statements Prepared in
Accordance with International Financial Reporting Standards Without Reconciliation to
U.S. GAAP. Available at: http://www.sec.gov/rules/final/2007/33-8879.pdf24-05-2008
(accessed 24 May 2008).
- Sloan, R. (2001). Financial accounting and corporate governance: a discussion. Journal
of Accounting and Economics, 32, 335-347.
- Soderstrom, N. & Sun, K. (2007). IFRS Adoption and Accounting Quality: A Review.
European Accounting Review, 16(4), 675-702.
- Tarca, A. (2004). International Convergence of Accounting Practices: Choosing
between IAS and US GAAP. Journal of International Financial Management and
Accounting, 15(1), 60-91.
- Van der Meulen, S., Gaeremynck, A. & Willekens, M. (2007). Attribute differences
between U.S. GAAP and IFRS earnings: An exploratory study. The international Journal
of Accounting, 42, 123-142.
- Willekens, M. (2008). Effects of external auditing in privately held companies:
Empirical evidence from Belgium. Working paper series.

27
Tables
Table 1 · Overview of measurement tool to assess the quality of financial reporting used in prior research
Accrual models Value relevance
literature
Specific elements in
annual report
Qualitative
characteristics
Method Examines the level of
earnings management as a
proxy for earnings quality
Examines the relationship
between stock returns and
earnings figures in order to measure the relevance and
reliability of financial
reporting information
Examines specific elements
in the annual report in depth,
f.i. by conducting an experiment
Examines the level of
decision usefulness of
financial reporting information by
operationalizing the
qualitative characteristics
Advantages Relatively easy to measure Focus on financial reporting quality
Focus on financial reporting quality
Relatively easy to collect data in order to measure
earnings management Provides insight into the economic value of earnings
figures
Direct measure of financial reporting quality
Direct measure of financial reporting quality
Disadvantages Focus on earnings quality Focus on earnings quality Focus only on selected
elements
Indirect measure of financial
reporting quality
Indirect measure of financial
reporting quality
Difficult to measure
In general, difficult to
operationalize causing measurement difficulties
Difficult to estimate discretionary accruals
No insight is provided in the tradeoffs between relevance
and reliability
Authors e.g. Jones, 1999; Healy &
Wahlen, 1999; Dechow et
al., 1995
e.g. Barth et al., 2001; Choi
et al., 1997; Nichols &
Wahlen, 2004; Nelson, 1996
e.g. Hirst et al., 2004;;
Beretta & Bozzolan, 2004;
Cohen et al., 2004
e.g. Schipper & Vincent,
2003; Van der Meulen, et
al., 2007; Barth et al., 2006

28
Table 2 · Operational measures utilized for the qualitative characteristics
Qualitative
characteristics
Items Mean Std.
Dev.
Mini-
mum
Median Maxi-
mum
Relevance
R1 The annual reports discloses forward-looking information 2.97 0.84 1 3 5
R2 The annual reports discloses information in terms of business opportunities and risks
3.68 0.54 1 4 5
R3 The company uses fair value as measurement basis 2.17 0.38 1 2 3
R4 The annual report provides feedback information on how various market events and significant transactions
affected the company?
3.69 0.64 2 4 5
Relevance total score 3.13 0. 39 2.25 3.25 4.25
Faithful representation
F1 The annual report explains the assumptions and estimates
made clearly
3.87 0.39 2 4 5
F2 The annual report explains the choice of accounting principles clearly
3.94 0.41 2 4 5
F3 The annual report highlights the positive and negative
events in a balanced way when discussing the annual results
3.04 0.75 1 3 5
F4 The annual report includes an unqualified auditor’s report 4.26 0.49 2 4 5
F5 The annual report extensively discloses information on corporate governance issues
4.12 0.78 2 4 5
Faithful representation total score 3.84 0.32 3.0 3.8 4.4
Understandability
U1 The annual report is a well organized 3.90 0.59 2 4 5
U2 The notes to the balance sheet and the income statement are clear
3.71 0.54 2 4 5
U3 Graphs and tables clarify the information presented 3.86 1.20 2 4 5
U4 The use of language and technical jargon is easy to follow in the annual report
3.88 0.56 2 4 5
U5 The annual report included a comprehensive glossary 2.08 1.46 1 2 5
Understandability total score 3.48 0.47 2.4 3.4 4.6
Comparability
C1 The notes to changes in accounting policies explain the
implications of the change
3.70 0.64 2 4 5
C2 The notes to revisions in accounting estimates and judgments explain the implications of the revision
3.46 0.67 2 3 5
C3 The company’s previous accounting period’s figures are
adjusted for the effect of the implementation of a change in accounting policy or revisions in accounting estimates
3.69 0.56 2 4 5
C4 The results of current accounting period are compared
with results in previous accounting periods
3.23 0.79 2 3 5
C5 Information in the annual report is comparable to
information provided by other organizations
3.93 0.74 2 4 5
C6 The annual report presents financial index numbers and ratios
3.07 1.06 1 3 5
Comparability total score 3.51 0.42 2 3.5 4.5
29
Timeliness
T1
Natural logarithm of amount of days it took for the
auditor signed the auditors’ report after book-year end
3.72 0.47 3.18 4.11 5
Table 3 · Sample description
Panel A: Number of observations by accounting standard and country
Sample 2005 2007
Accounting standards US GAAP 39 31
IFRS 81 80
Total
120 111
Non-cross-listed companies United States 29 25
United Kingdom 35 33
The Netherlands 29 28
Cross-listed companies 27 25
Total 120 111
Panel B: Number of observations by industry and year
US SIC codes 2005 2007
10-17 Mining and Construction 10 9
20-39 Manufacturing 39 37
40-49 Transportation, Communications, Electric, Gas, and Sanitary Services 15 14
50-59 Wholesale/ Retail Trade 16 15
60-67 Finance, Insurance, and Real Estate 16 15
70-89 Services 24 21
Total 120 111

30
Table 4 · Financial reporting quality scores classified by accounting standards and year
Quality measure Accounting
standard
Year n Mean Std.
dev.
10th
Pctl
Median 90th Pctl
US GAAP 2005 39 3.47 0.21 3.13 3.51 3.68 Total quality FECQ
2007 31 3.58 0.21 3.35 3.56 3.83
IFRS 2005 81 3.46 0.19 3.21 3.47 3.68
2007 80 3.57 0.23 3.25 3.55 3.84
US GAAP 2005 39 3.47 0.21 3.18 3.50 3.73 Total quality FCQ
2007 31 3.59 0.26 3.24 3.60 3.94
IFRS 2005 81 3.44 0.21 3.16 3.42 3.70
2007 80 3.50 0.26 3.18 3.50 3.85
Relevance US GAAP 2005 39 2.87 0.35 2.50 2.75 3.25
2007 31 3.09 0.44 2.50 3.00 3.75
IFRS 2005 81 3.18 0.36 2.75 3.25 3.50
2007 80 3.21 0.36 2.75 3.25 3.50
US GAAP 2005 39 4.07 0.03 3.80 4.00 4.40 Faithful representation
2007 31 4.09 0.21 3.80 4.20 4.40
IFRS 2005 81 3.69 0.29 3.24 3.80 4.00
2007 80 3.80 0.29 3.40 3.80 4.20
Total quality FEQCt represents the total quality score of financial reporting based on both the scores on the fundamental and
enhancing qualitative characteristics in year t. Total quality FQCt is the total quality score of financial reporting based on the
scores on the fundamental qualitative characteristics relevance and faithful representation in year t. Relevancet is the scores on the
fundamental qualitative characteristics relevance in year t. Faithful representationt is the scores on the fundamental qualitative
characteristics faithful representation in year t.

31
Table 5 · Pearson correlation matrix and variation inflation factors
Variable Total
quality
FEQC
Acc.
standards
Country Size Industry Leverage Year VIFs
Total quality
FEQC
1
Acc. standards 0.017 -1 1.247
Countrya 0.094 0.780*** 1 1.174
Size 0.199 *** -0.127 ** -0.056 1 1.386
Industrya 0.255 *** -0.039 -0.054 -0.033 1 1.020
Leverage 0.244 *** -0.117 * -0.103 0.221 *** 0.170** 1 1.353
Year 0.251 *** -0.050 -0.018 0.030 0.003 0.002 1 1.012
*, **, *** Denotes significance at the 10%, 5% and 1% levels, respectively (two-tailed).
Total quality FEQC represents the total quality score of financial reporting based on both the scores on the fundamental and
enhancing qualitative characteristics. Acc. Standards represents a dummy variable (0 if companies prepare their annual report in
accordance with IFRS, and 1 if companies prepare their annual report in accordance with US GAAP). Country is a compound
dummy variable (US is the reference country). Size is the natural logarithm of total assets. Industry is compound variable of
industry dummies (SIC 10-17: Mining Construction is the industry of reference). Leverage is the ratio of long-term debt over
common equity. Year is a dummy variable (2005 = 0; 2007 = 1). VIF is the variance inflation factor. For each of the variables in
each of the regression models the VIF was smaller than 2 for, which indicates the absence of multicollinearity. a For both the country and industry dummies a compound dummy variable is constructed to estimate their combined effects on
financial reporting quality. Because the compound variables substitute each of the dummy variables including their powers and
their estimated coefficient exactly (Eisinga et al., 1991), both unstandardized coefficients equal 1. As a consequence, the table
shows the standardized coefficients for both the country and industry variable.

32
Table 6 · Quality of Financial reporting: IFRS versus US GAAP
Panel A: Quality of financial reporting based on the fundamental and enhancing qualitative characteristics
Total quality FEQCt = β0 + β1 Acc. Standards t + β2 Country + β3 Industry + β4 Sizet + β5 Leverage t (+ β6 Year) + εt
Variables Model 1 · 2005 a Model 2 · 2007 a Model 3 · Total sample a
Constant 3.526 (0.094) *** 3.291 (0.114) *** 3.410 (0.083) ***
Acc. Standards -0.128 (0.049) 0.130 (0.560) -0.066 (0.045)
Country 0.480 (0.247) *** 0.309 (0.358) *** 0.230 (0.413) **
Industry 0.282 (0.300) *** 0.258 (0.300) *** 0.238 (0.254) ***
Size 0.020 (0.009) ** 0.015 (0.012) * 0.020 (0.007) ***
Leverage 0.004 (0.002) 0.009 (0.003) *** 0.006 (0.002) **
Year 0.104 (0.025) ***
F-statistic 6.176 *** 7.716 *** 10.262 ***
Adj. R2 21,3% 26.9% 21.6%
Panel B: Quality of financial reporting based on the fundamental qualitative characteristics
Total quality FQCt = β0 + β1 Acc. Standardst + β2 Country + β3 Industry + β4 Sizet + β5 Leveraget (+ β6 Year) + ε t
Variables Model 1 · 2005 Model 2 · 2007 Model 3 · Total sample
Constant 3.556 (0.111) *** 3.137 (0.1311) *** 3.385 (0.099) ***
Acc. Standards -0.108 (0.060) 0.238 (0.066) * -0.024 (0.053)
Country 0.434 (0.304) *** 0.369 (0.307) *** 0.209 (0.476) **
Industry 0.273 (.0321) *** 0.294 (0.291) *** 0.240 (0.263) ***
Size 0.015 (0.010) * 0.018 (0.014) * 0.020 (0.009) **
Leverage 0.003 (0.003) 0.007 (0.003) * 0.004 (0.002)
Year 0.080 (0.029) ***
F-statistic 4.377 *** 8.321 *** 7.436 ***
Adj. R2 19.1% 28.4% 20.0%

33
Table 6 · Continued
Panel C: Robustness check for the quality of financial reporting based on the fundamental and enhancing qualitative
characteristics 2005 and 2007
Total Quality FEQC = β0 + β1 Acc.standards + β2 Country + β3 Industry + β4 Size + β5 Leverage + + β6 Year + ε1
Variables
FQC,EQC
Model 1 · 0.50:0.50 a Model 2 · 0.67:0.33a Model 3 · 0.75:0.25 a Model 4 · 0.80:0.20 a
Constant 3.248 (0.096) *** 3.410 (0.083) *** 3.404 (0.086) *** 3.400 (0.088) ***
Acc.
standards
-0.087 (0.042) * -0.066 (0.045) -0.056 (0.047) -0.049 (0.048)
Country 0.239 (0.368) *** 0.230 (0.413) *** 0.225 (0.435) ** 0.222 (0.448) **
Industry 0.230 (0.258) *** 0.238 (0.254) *** 0.240 (0.254) *** 0.241 (0.255) ***
Size 0.020 (0.007) *** 0.020 (0.007) *** 0.020 (0.008) *** 0.020 (0.008) **
Leverage 0.006 (0.002) *** 0.006 (0.002) *** 0.005 (0.002) ** 0.005 (0.002) **
Year 0.116 (0.025) *** 0.104 (0.025) *** 0.098 (0.026) *** 0.094 (0.027) ***
F-statistic 11.457 *** 10.262 *** 9.528 *** 9.078 ***
Adj. R2 23.5% 21.6% 20.3% 19.6%
*, **, *** Denotes significance at the 10%, 5% and 1% levels, respectively (two-tailed).
The table displays estimated coefficients and t-values from an OLS model of financial reporting quality. Total quality FEQCt
represents the total quality score of financial reporting based on both the scores on the fundamental and enhancing qualitative
characteristics in year t. Total quality FQCt is the total quality score of financial reporting based on the scores on the fundamental
qualitative characteristics relevance and faithful representation in year t. FQC and EOC represent respectively the scores on the
fundamental and enhancing qualitative characteristics. Acc. Standards represents a dummy variable (0 if companies prepare their
annual report in accordance with IFRS, and 1 if companies prepare their annual report in accordance with US GAAP). Country is a
compound dummy variable (US is the reference country). Industry is compound variable of industry dummies (SIC 10-17: Mining
Construction is the industry of reference). Sizet is the natural logarithm of total assets in year t. Leveraget is the ratio of long-term
debt over common equity in year t. Year is a dummy variable (2005 = 0; 2007 = 1). a In panel A the proportion of scores on the fundamental qualitative characteristics to the enhancing qualitative characteristics is
2:1 (0,67:0,33). In panel C the ratios representing the proportion of the fundamental versus enhancing qualitative characteristics in
the measure for total quality FEQC range between 1:1 (0,50:0,50) and 4:1 (0,80:0,20).

34
Table 7 · Quality of the fundamental qualitative characteristics relevance and faithful representation: IFRS versus US
GAAP
Panel A: Relevance: IFRS versus US GAAP
Relevance t = β0 + β1 Acc. Standards t + β2 Country + β3 Industry + β4 Sizet + β5 Leverage t (+ β6 Year) + εt
Variables Model 1 · 2005 a Model 2 · 2007 a Model 3 · Total sample a
Constant 3.309 (0.177) *** 2.541 (0.215) *** 3.009 (0.141) ***
Acc. Standards -0.275 (0.069) *** -0.194 (0.125) ** -0.145 (0.062) **
Country 0.157 (0.549 * 0.443 (0.325) *** 0.131 (0.562) *
Industry 0.170 (0.520) * 0.258 (0.345) *** 0.153 (0.404) **
Size -0.007 (0.018) 0.028 (0.021) 0.012 (0.014)
Leverage 0.013 (0.005) ** 0.009 (0.005) 0.010 (0.004) **
Year 0.087 (0.047) *
F-statistic 6.108 *** 5.769 *** 6.609 ***
Adj. R2 21.1% 21.6% 18.5%
Panel B: Faithful representation: IFRS versus US GAAP
Faithful representationt = β0 + β1 Acc. Standardst + β2 Country + β3 Industry + β4 Sizet + β5 Leveraget (+ β6 Year) + ε t
Variables Model 1 · 2005 Model 2 · 2007 Model 3 · Total sample
Constant 3.802 (0.144) *** 3.732 (0.149) *** 3.761 (0.119) ***
Acc. Standards 0.060 (0.081) ** 0.282 (0.055) ** 0.097 (0.066) **
Country 0.536 (0.213) *** 0.218 (0.391) *** 0.406 (0.233) ***
Industry 0.323 (0.222) *** 0.221 (0.376) ** 0.225 (0.257) ***
Size 0.037 (0.013) ** 0.008 (0.015) 0.027 (0.010) **
Leverage -0.008 (0.004) ** 0.004 (0.004) -0.003 (0.003)
Year 0.074 (0.034) **
F-statistic 21.534 *** 11.083 *** 21.817 ***
Adj. R2 46.3% 34.5% 36.9%
*, **, *** Denotes significance at the 10%, 5% and 1% levels, respectively (two-tailed).
Relevance and faithful representation represent the quality score on the fundamental qualitative characteristics relevance and
faithful representation. Acc. Standards represents a dummy variable (0 if companies prepare their annual report in accordance with
IFRS, and 1 if companies prepare their annual report in accordance with US GAAP). Country is a compound dummy variable (US
is the reference country). Industry is compound variable of industry dummies (SIC 10-17: Mining Construction is the industry of
reference). Size is the natural logarithm of total assets. Leverage is the ratio of long-term debt over common equity. Year is a
dummy variable (2005 = 0; 2007 = 1). Year is a dummy variable (2005 = 0; 2007 = 1).

35
Table 8 · Quality of the fundamental qualitative characteristics relevance and faithful: Internal consistency
Panel A: Relevance: Internal consistency
Relevance = β0 + β1 Acc. Standards + β2 Country + β3 Industry + β4 Size + β5 Leverage + β6 Year + ε1
Variablesa Model 1 Model 2 Model 3 Model 4
Cronbach’s alpha 0.74 0.64 0.48 0.46
Sum N 65 102 224 231
Constant 3.309 (0.197) *** 2.805 (0.177) *** 2.811 (0.106) *** 3.009 (0.141) ***
Acc. Standards -0.362 (0.107) *** -0.323 (0.094) *** -0.188 (0.057) *** -0.145 (0.062) **
Country 0.110 (0.541) -0.044 (0.091) 0.084 (0.055) 0.131 (0.562) *
Industry 0.074 (0.572) * 0.078 (0.092) 0.132 (0.062) ** 0.153 (0.404) **
Size 0.004 (0.018) 0.045 (0.020) ** 0.043 (0.013) *** 0.012 (0.014)
Leverage 0.009 (0.005) * 0.003 (0.007) 0.004 (0.004) 0.010 (0.004) **
Year 0.179 (1.979) * 0.110 (0.080) 0.071 (0.048) 0.087 (0.047) *
F-statistic 4.883 *** 4.763 *** 5.790 *** 6.609 ***
Adj. R2 27.1% 23.1% 19.4% 18.5%
Panel B: Faithful representation: Internal consistency
Faithful representation = β0 + β1 Acc. Standards + β2 Country + β3 Industry + β4 Size + β5 Leverage + β6 Year + ε1
Variablesa Model 1 Model 2 Model 3 Model 4
Cronbach’s alpha 0.75 0.52 0.44 0.40
Sum N 46 107 158 231
Constant 3.803 (0.141) *** 3.299 (0.121) *** 3.283 (0.103) *** 3.761 (0.119) ***
Acc. Standards 0.146 (0.076) * 0.314 (0.066) *** 0.274 (0.051) *** 0.097 (0.066) ***
Country 0.431 (0.378) *** -0.037 (0.060) -0.072 (0.052) 0.406 (0.233) **
Industry 0.266 (0.409) *** 0.209 (0.081) ** 0.214 (0.066) *** 0.225 (0.257) ***
Size 0.034 (0.013) *** 0.045 (0.015) *** 0.046 (0.012) *** 0.027 (0.010) ***
Leverage -0.003 (0.004) -0.006 (0.004) -0.003 (0.003) -0.003 (0.003)
Year 0.047 (0.493) 0.114 (0.055) ** 0.106 (0.044) ** 0.074 (0.034) *
F-statistic 17.862 *** 11.281 *** 16.846 *** 21.817 ***
Adj. R2 43.9% 37.7% 37.2% 36.9%
*, **, *** Denotes significance at the 10%, 5% and 1% levels, respectively (two-tailed).
The table displays estimated coefficients and t-values from an OLS model of financial reporting quality.
Relevance and faithful representation represent the quality score on the fundamental qualitative characteristics relevance and
faithful representation. Acc. Standards represents a dummy variable (0 if companies prepare their annual report in
accordance with IFRS, and 1 if companies prepare their annual report in accordance with US GAAP). Country is a
compound dummy variable (US is the reference country). Industry is compound variable of industry dummies (SIC 10-17:
Mining Construction is the industry of reference). Size is the natural logarithm of total assets. Leverage is the ratio of long-
term debt over common equity. Year is a dummy variable (2005 = 0; 2007 = 1). a The sample was divided in 4 groups based on the absolute differences on the ‘relevance scale’. The first group includes all
companies which had the highest scores on each of the variables referring to relevance etc., while Model 4 represents the
whole sample.

Appendix A Overview of the measures used to operationalize the fundamental and enhancing qualitative characteristic (including the
measurement scales)
Relevance
Question no. Question Operationalization Concept Literature
R1 To what extent does the
presence of the forward-
looking statement help
forming expectations and
predictions concerning the
future of the company?
1 = No forward-looking information
2 = Forward-looking information not an apart subsection
3 = Apart subsection
4 = Extensive predictions
5 = Extensive predictions useful for making expectation
Predictive value e.g. McDaniel et al.,
2002; Jonas and
Blanchet, 2000; Bartov
and Mohanram, 2004
R2 To what extent does the
presence of non-financial
information in terms of
business opportunities and
risks complement the
financial information?
1 = No non-financial information
2 = Little non-financial information, no useful for forming
expectations
3 = Useful non-financial information
4 = Useful non-financial information, helpful for developing
expectations
5 = Non-financial information presents additional
information which helps developing expectations
Predictive value e.g. Jonas and Blanchet,
2000; Nichols and
Wahlen, 2004
R3
To what extent does the
company use fair value
instead of historical cost
1 = Only HC
2 = Most HC
3 = Balance FV/HC
4 = Most FV
5 = Only FV
Predictive value e.g. Schipper and
Vincent, 2003;
McDaniel et al., 2002;
Barth et al., 2001;
Schipper, 2003
R4 To what extent do the
reported results provide
feedback to users of the
annual report as to how
various market events and
significant transactions
affected the company?
1 = No feedback
2 = Little feedback on the past
3 = Feedback is present
4 = Feedback helps understanding how events and
transactions influenced the company
5 = Comprehensive feedback
Confirmatory
value
e.g. Jonas and Blanchet,
2000

37
Faithful representation
Question no. Question Operationalization Concept Literature
F1 To what extent are valid
arguments provided to
support the decision for
certain assumptions and
estimates in the annual
report?
1 = Only described estimations
2 = General explanation
3 = Specific explanation of estimations
4 = Specific explanation, formulas explained etc.
5 = Comprehensive argumentation
Verifiability e.g. Jonas and Blanchet,
2000; Maines and
Wahlen, 2004
F2 To what extent does the
company base its choice for
certain accounting principles
on valid arguments?
1 = Changes not explained
2 = Minimum explanation
3 = Explained why
4 = Explained why + consequences
5 = No changes or comprehensive explanation
Verification e.g. Jonas and Blanchet,
2000; Maines and
Wahlen, 2004
F3 To what extent does the
company, in the discussion of
the annual results, highlight
the positive events as well as
the negative events?
1 = Negative events only mentioned in footnotes
2 = Emphasize on positive events
3 = Emphasize on positive events, but negative events are
mentioned; no negative events occurred
4 = Balance pos/neg events
5 = Impact of pos/neg events is also explained
Neutrality e.g. Dechow et al.,
1996; McMullen, 1996;
Beasley, 1996; Razaee,
2003; Cohen et al.,
2004; Sloan, 2001
F4 Which type of auditors’
report is included in the
annual report?
1 = Adverse opinion
2 = Disclaimer of opinion
3 = Qualified opinion
4 = Unqualified opinion: Financial figures
5 = Unqualified opinion: Financial figures + internal control
Free from
material error,
verification,
neutrality, and
completeness
e.g. Maines and
Wahlen, 2006;
Gaeremynck and
Willekens, 2003; Kim
et al., 2007; Willekens,
2008
F5 To what extent does the
company provide information
on corporate governance?
1 = No description CG
2 = Information on CG limited, not in apart subsection
3 = Apart subsection
4 = Extra attention paid to information concerning CG
5 = Comprehensive description of CG
Completeness,
verifiability, and
free from
material error
e.g. Jonas and Blanchet,
2000
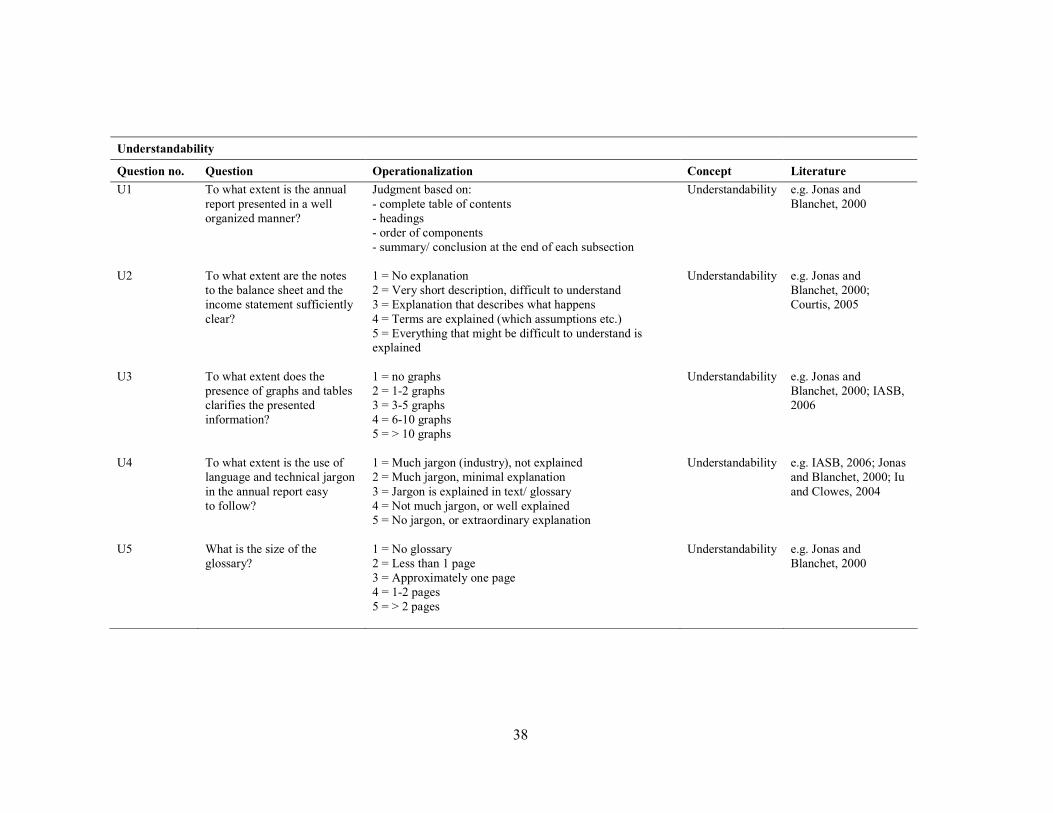
38
Understandability
Question no. Question Operationalization Concept Literature
U1 To what extent is the annual
report presented in a well
organized manner?
Judgment based on:
- complete table of contents
- headings
- order of components
- summary/ conclusion at the end of each subsection
Understandability e.g. Jonas and
Blanchet, 2000
U2 To what extent are the notes
to the balance sheet and the
income statement sufficiently
clear?
1 = No explanation
2 = Very short description, difficult to understand
3 = Explanation that describes what happens
4 = Terms are explained (which assumptions etc.)
5 = Everything that might be difficult to understand is
explained
Understandability e.g. Jonas and
Blanchet, 2000;
Courtis, 2005
U3 To what extent does the
presence of graphs and tables
clarifies the presented
information?
1 = no graphs
2 = 1-2 graphs
3 = 3-5 graphs
4 = 6-10 graphs
5 = > 10 graphs
Understandability e.g. Jonas and
Blanchet, 2000; IASB,
2006
U4 To what extent is the use of
language and technical jargon
in the annual report easy
to follow?
1 = Much jargon (industry), not explained
2 = Much jargon, minimal explanation
3 = Jargon is explained in text/ glossary
4 = Not much jargon, or well explained
5 = No jargon, or extraordinary explanation
Understandability e.g. IASB, 2006; Jonas
and Blanchet, 2000; Iu
and Clowes, 2004
U5 What is the size of the
glossary?
1 = No glossary
2 = Less than 1 page
3 = Approximately one page
4 = 1-2 pages
5 = > 2 pages
Understandability e.g. Jonas and
Blanchet, 2000
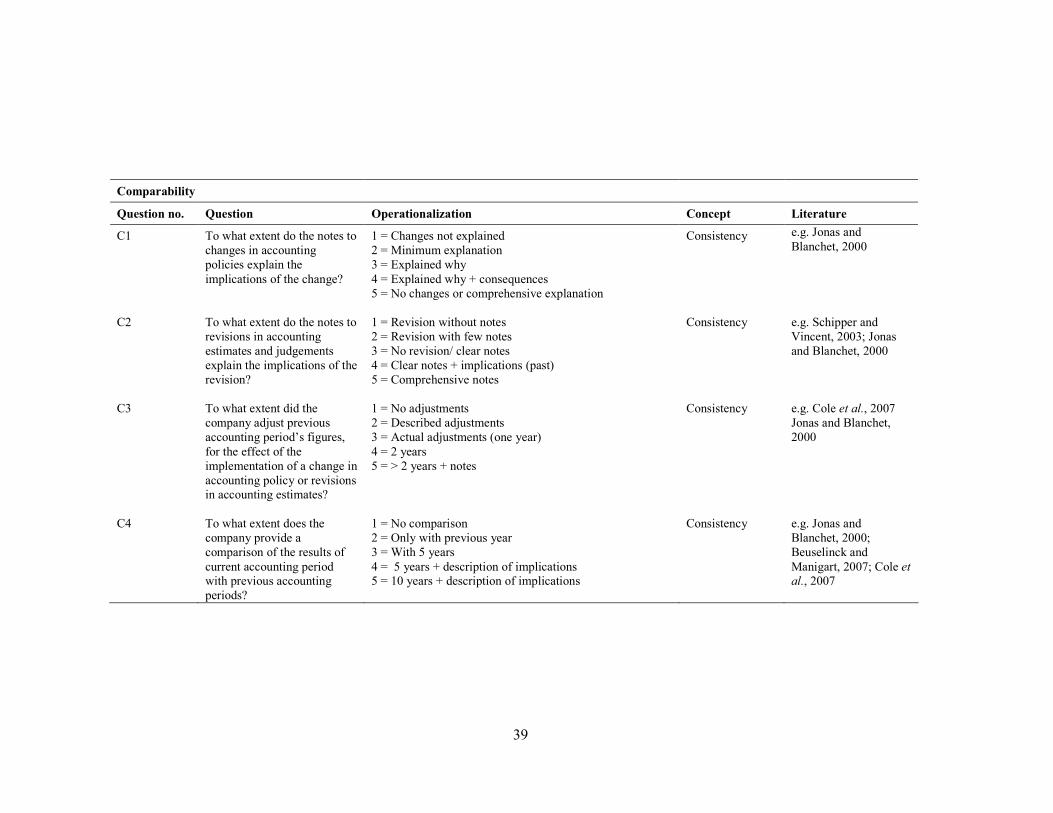
39
Comparability
Question no. Question Operationalization Concept Literature
C1 To what extent do the notes to
changes in accounting
policies explain the
implications of the change?
1 = Changes not explained
2 = Minimum explanation
3 = Explained why
4 = Explained why + consequences
5 = No changes or comprehensive explanation
Consistency e.g. Jonas and
Blanchet, 2000
C2 To what extent do the notes to
revisions in accounting
estimates and judgements
explain the implications of the
revision?
1 = Revision without notes
2 = Revision with few notes
3 = No revision/ clear notes
4 = Clear notes + implications (past)
5 = Comprehensive notes
Consistency e.g. Schipper and
Vincent, 2003; Jonas
and Blanchet, 2000
C3 To what extent did the
company adjust previous
accounting period’s figures,
for the effect of the
implementation of a change in
accounting policy or revisions
in accounting estimates?
1 = No adjustments
2 = Described adjustments
3 = Actual adjustments (one year)
4 = 2 years
5 = > 2 years + notes
Consistency e.g. Cole et al., 2007
Jonas and Blanchet,
2000
C4 To what extent does the
company provide a
comparison of the results of
current accounting period
with previous accounting
periods?
1 = No comparison
2 = Only with previous year
3 = With 5 years
4 = 5 years + description of implications
5 = 10 years + description of implications
Consistency e.g. Jonas and
Blanchet, 2000;
Beuselinck and
Manigart, 2007; Cole et
al., 2007

40
C5 To what extent is the
information in the annual
report comparable to
information provided by other
organizations?
Judgment based on:
- accounting policies
- structure
- explanation of events
In other words: an overall conclusion of
comparability compared to annual reports of
other organizations
Comparability e.g. IASB, 2008; Jonas
and Blanchet, 2000;
Cole et al., 2007;
Beuselick and
Manigart, 2007
C6
To what extent does the
company presents financial
index numbers and ratios in
the annual report?
1 = No ratios
2 = 1-2 ratios
3 = 3-5 ratios
4 = 6-10 ratios
5 = > 10 ratios
Comparability e.g. Cleary, 1999
Timeliness
Question no. Question Operationalization Concept Literature
T1 How many days did it take for
the auditor to sign the
auditors’ report after book-
year end?
Natural logarithm of amount of days
1 = 1-1.99
2 = 2-2.99
3 = 3-3.99
4 = 4-4.99
5 = 5-5.99
Timeliness e.g IASB, 2008

41