Quality Metrics: An OTC Perspective
29
Metrics: A Generic and OTC Perspective FDA/PQRI Conference October 2015 Paul Weninger, Perrigo
Transcript of Quality Metrics: An OTC Perspective

Metrics: A Generic and OTC Perspective FDA/PQRI Conference
October 2015 Paul Weninger, Perrigo
Agenda
• Brief Perrigo Overview • Continuous Improvement Journey • Internal Use of Metrics • Generic OTC Perspective • Questions
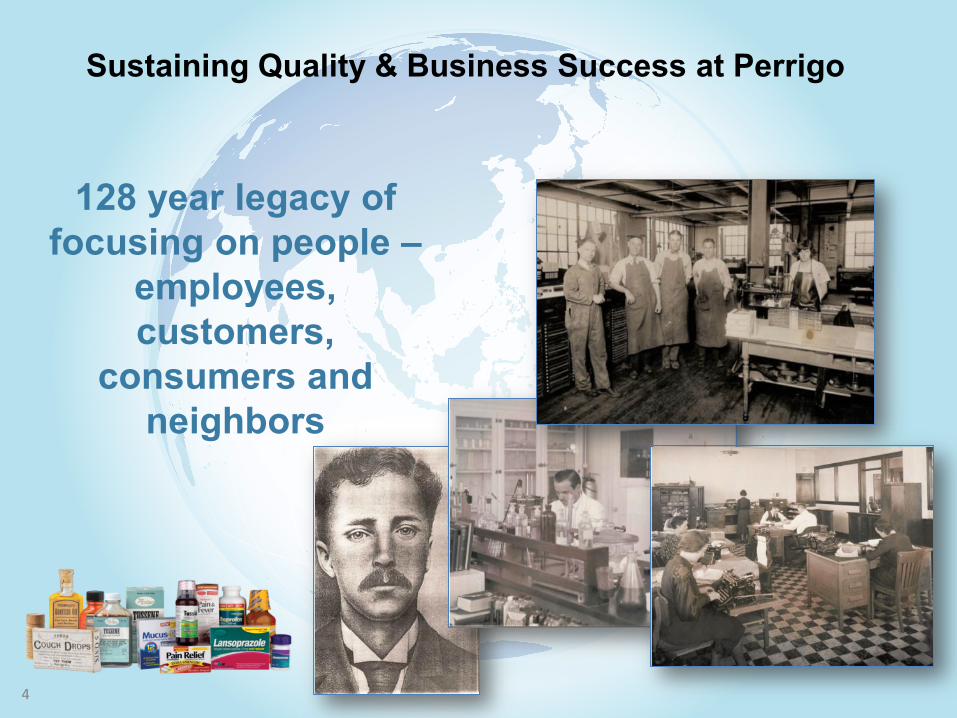
Sustaining Quality & Business Success at Perrigo
128 year legacy of focusing on people –
employees, customers,
consumers and neighbors
4
4
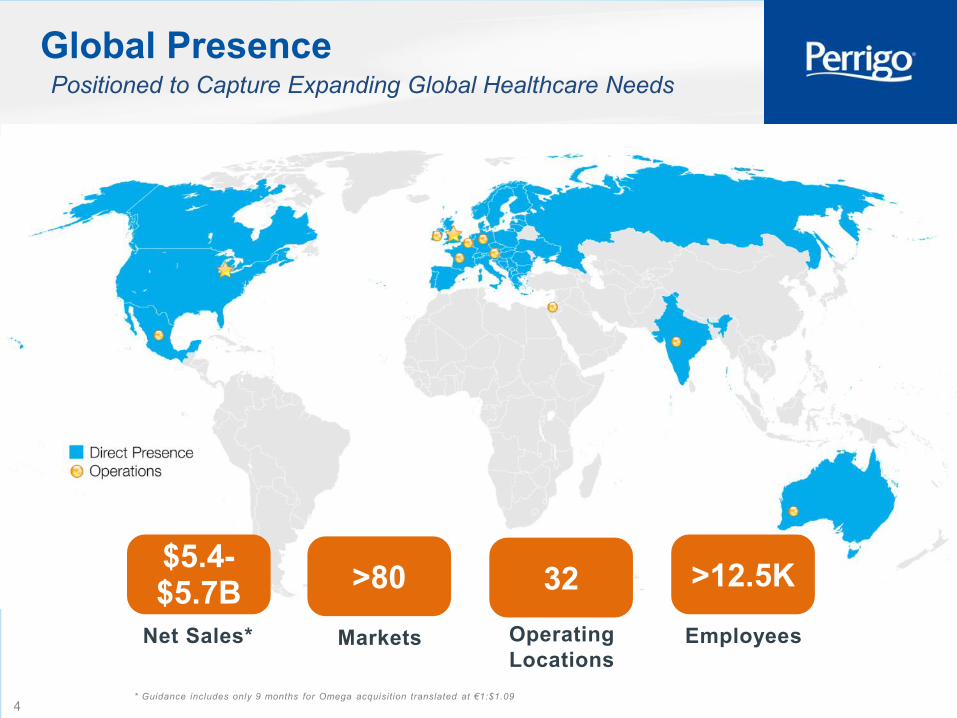
Net Sales*
$5.4-$5.7B
Employees
>12.5K
Global Presence Positioned to Capture Expanding Global Healthcare Needs
Markets
>80 Operating Locations
32
* Guidance includes only 9 months for Omega acquisition translated at €1:$1.09
5
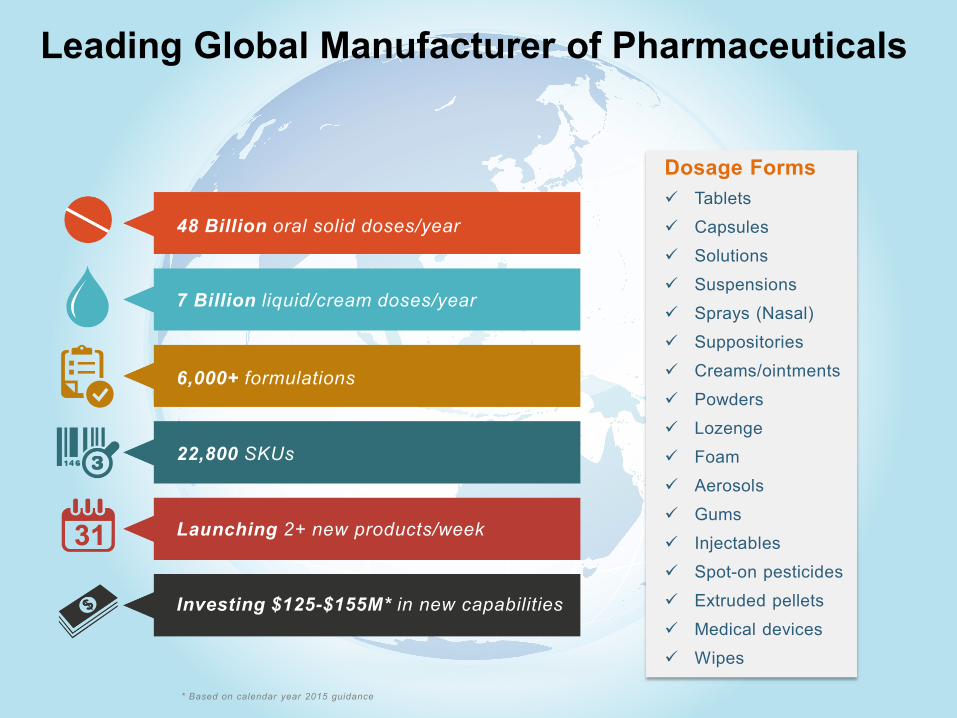
Tablets
Capsules
Solutions
Suspensions
Sprays (Nasal)
Suppositories
Creams/ointments
Powders
Lozenge
Foam
Aerosols
Gums
Injectables
Spot-on pesticides
Extruded pellets
Medical devices
Wipes
Dosage Forms
48 Billion oral solid doses/year
7 Billion liquid/cream doses/year
6,000+ formulations
22,800 SKUs
Launching 2+ new products/week
Investing $125-$155M* in new capabilities
* Based on calendar year 2015 guidance
Leading Global Manufacturer of Pharmaceuticals
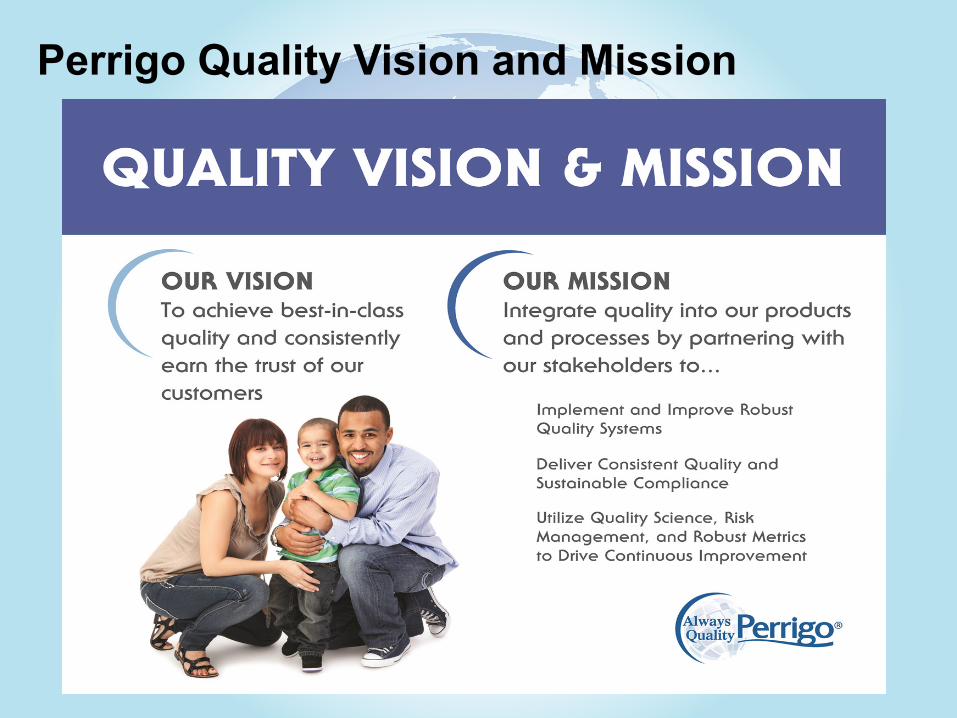
Perrigo Quality Vision and Mission
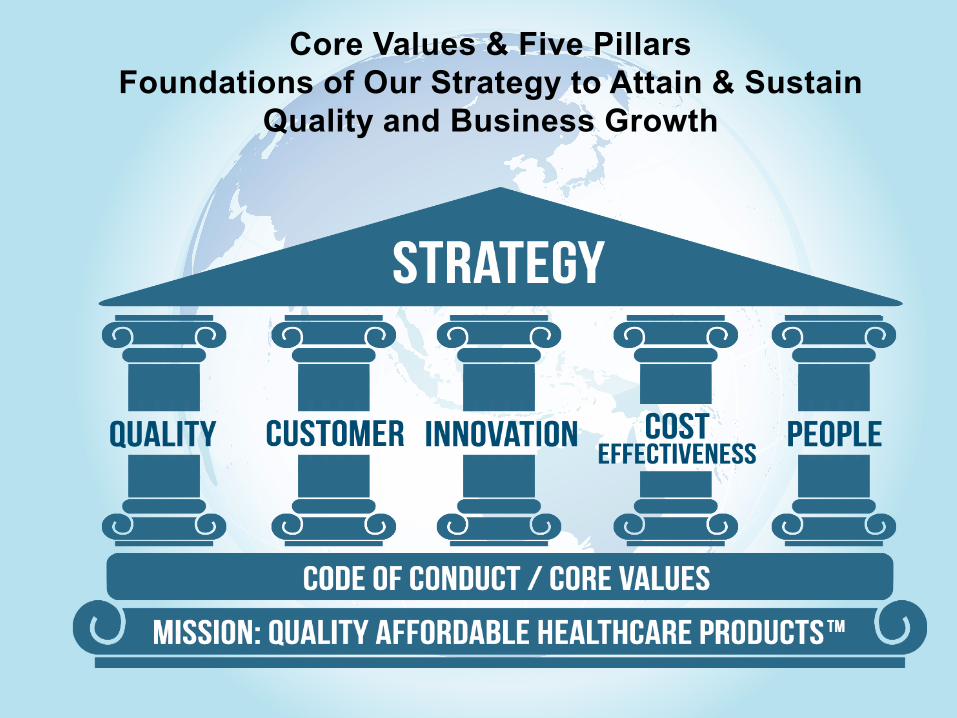
Core Values & Five Pillars Foundations of Our Strategy to Attain & Sustain
Quality and Business Growth
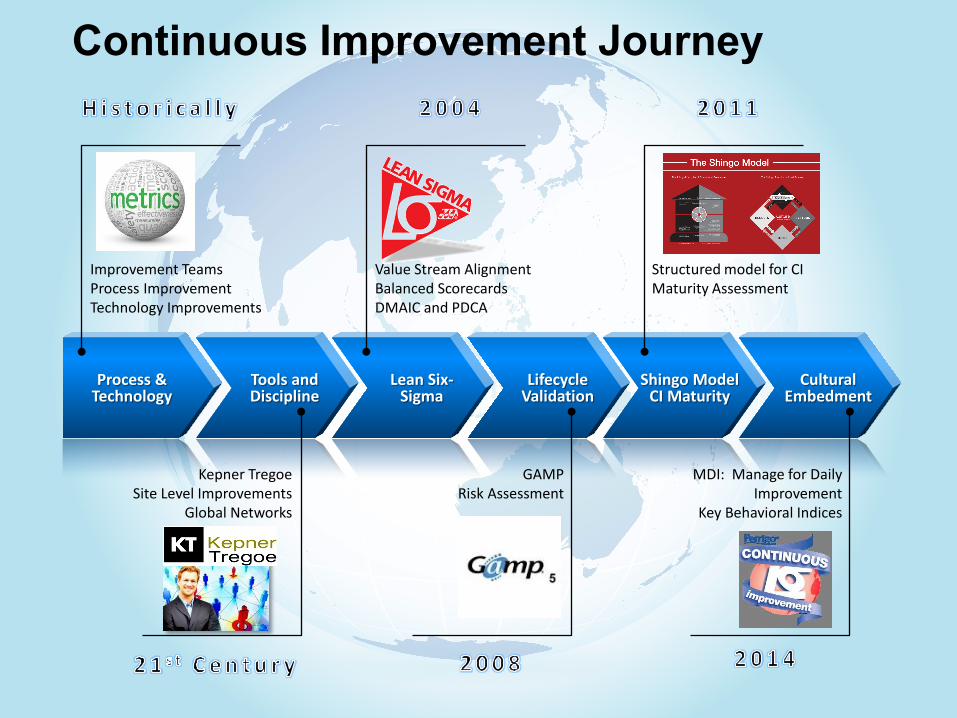
Continuous Improvement Journey
Process & Technology
Tools and Discipline
Lean Six-Sigma
Lifecycle Validation
Shingo Model CI Maturity
Cultural Embedment
Value Stream Alignment Balanced Scorecards DMAIC and PDCA
Structured model for CI Maturity Assessment
Kepner Tregoe Site Level Improvements
Global Networks
GAMP Risk Assessment
MDI: Manage for Daily Improvement
Key Behavioral Indices
Improvement Teams Process Improvement Technology Improvements
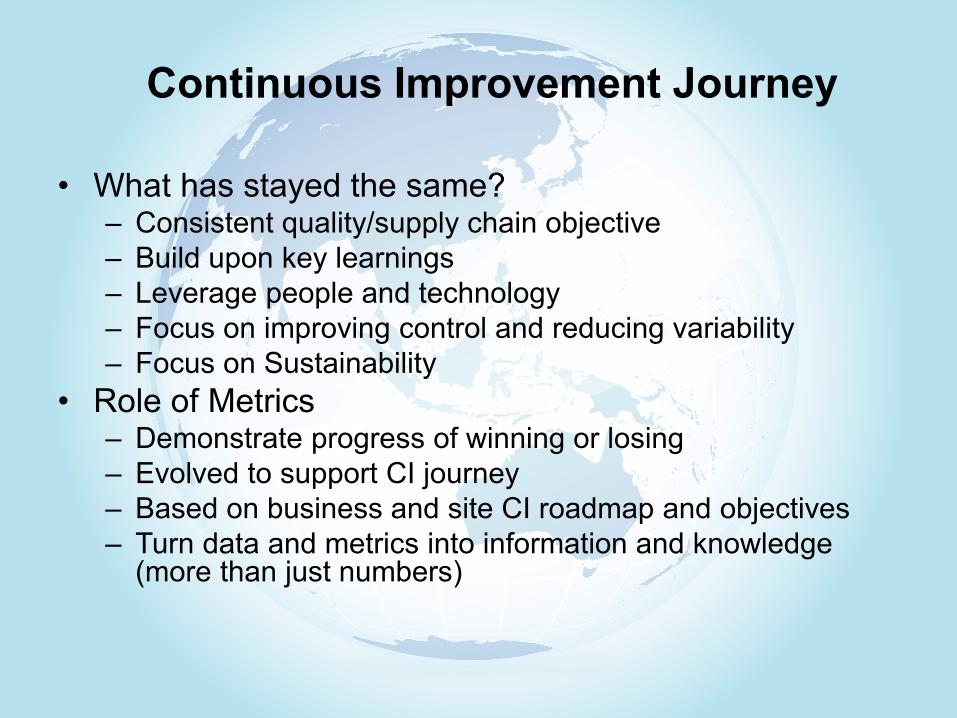
• What has stayed the same? – Consistent quality/supply chain objective – Build upon key learnings – Leverage people and technology – Focus on improving control and reducing variability – Focus on Sustainability
• Role of Metrics – Demonstrate progress of winning or losing – Evolved to support CI journey – Based on business and site CI roadmap and objectives – Turn data and metrics into information and knowledge
(more than just numbers)
Continuous Improvement Journey
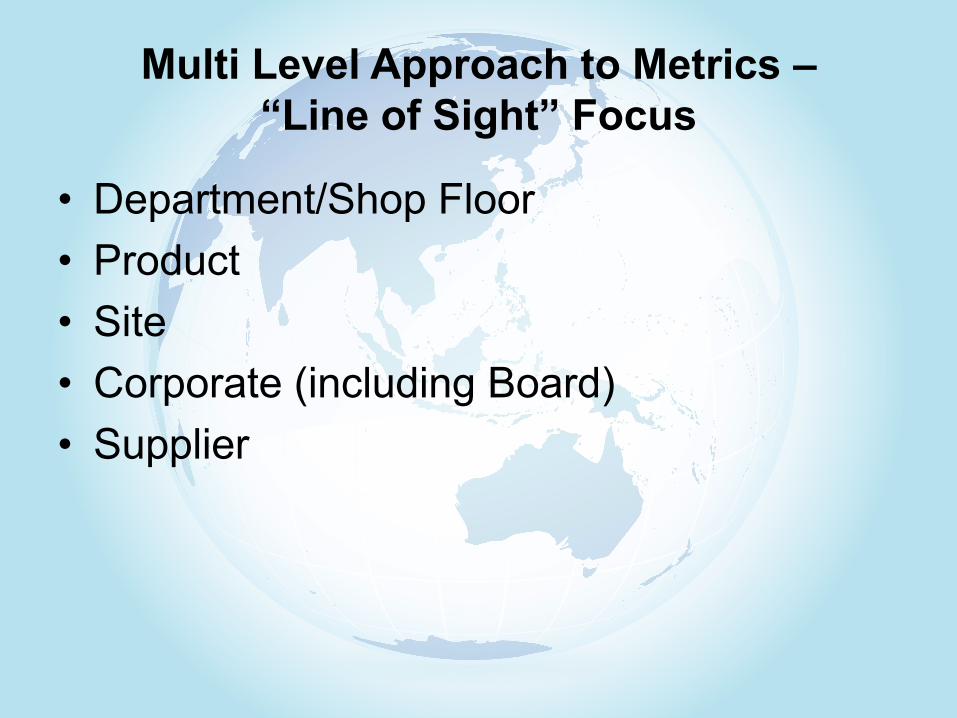
Multi Level Approach to Metrics – “Line of Sight” Focus
• Department/Shop Floor • Product • Site • Corporate (including Board) • Supplier
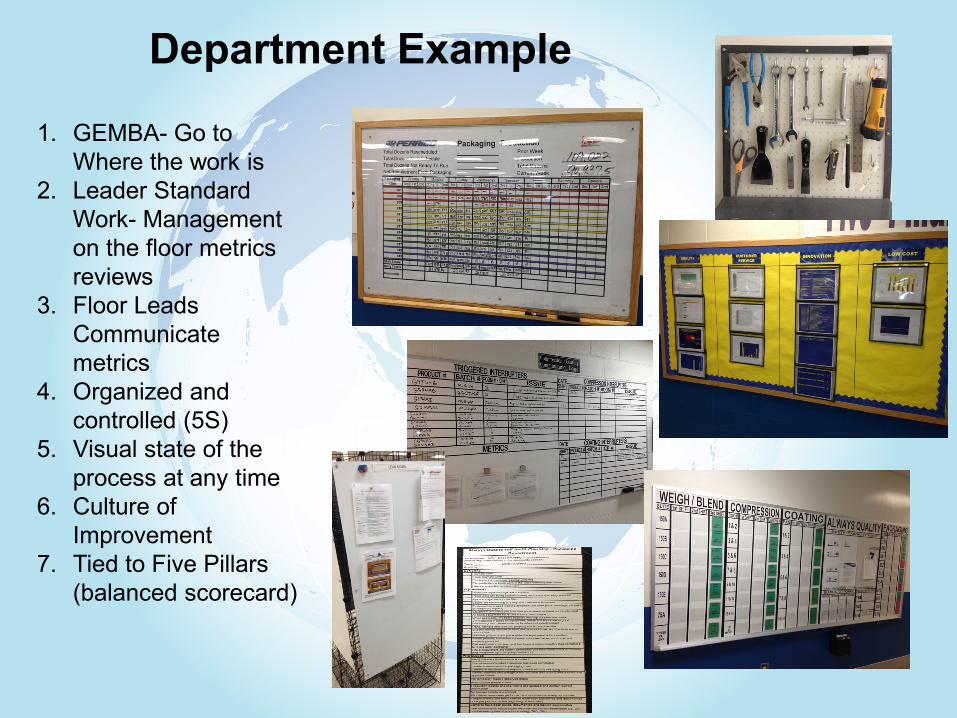
Department Example
1. GEMBA- Go to Where the work is
2. Leader Standard Work- Management on the floor metrics reviews
3. Floor Leads Communicate metrics
4. Organized and controlled (5S)
5. Visual state of the process at any time
6. Culture of Improvement
7. Tied to Five Pillars (balanced scorecard)
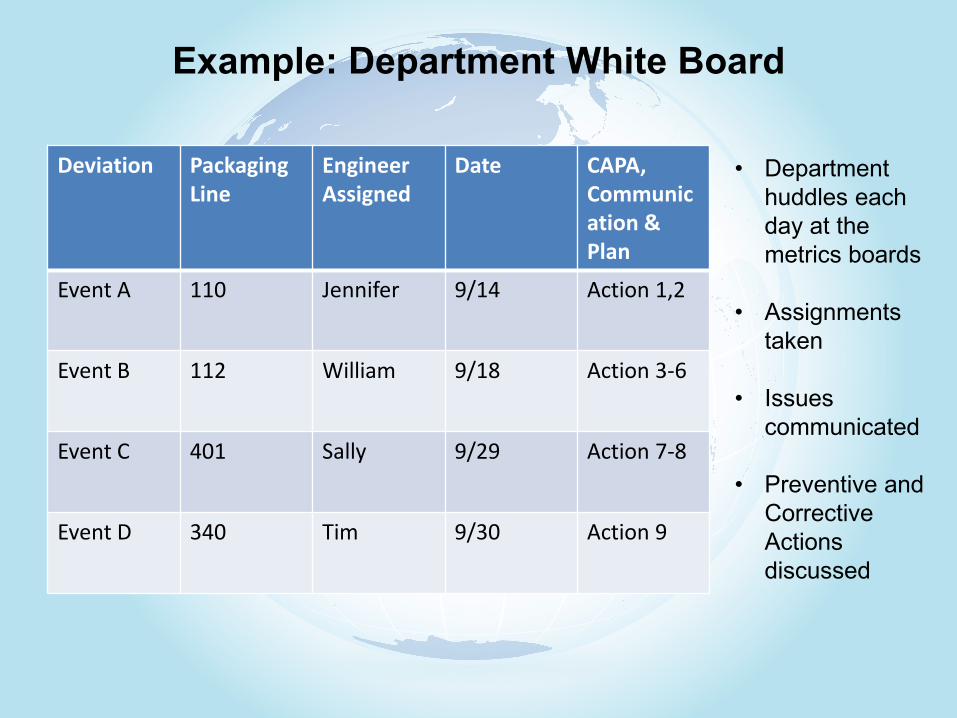
Example: Department White Board
Deviation Packaging Line
Engineer Assigned
Date CAPA, Communication & Plan
Event A
110 Jennifer 9/14 Action 1,2
Event B 112 William 9/18 Action 3-6
Event C
401 Sally 9/29 Action 7-8
Event D 340 Tim 9/30 Action 9
• Department huddles each day at the metrics boards
• Assignments taken
• Issues communicated
• Preventive and Corrective Actions discussed
Product Level Metrics
• Control and trend charts • Complaint trends – (review top/significant
changes) • APR (note – definition nuances)
– Complaints – Process Capability – OOS – Rejects
• APR Reporting cycle staggered through year (effective resource utilization)
• Shifts or trends trigger CI project

Product Metric Examples Product Assessment
Capability Analysis
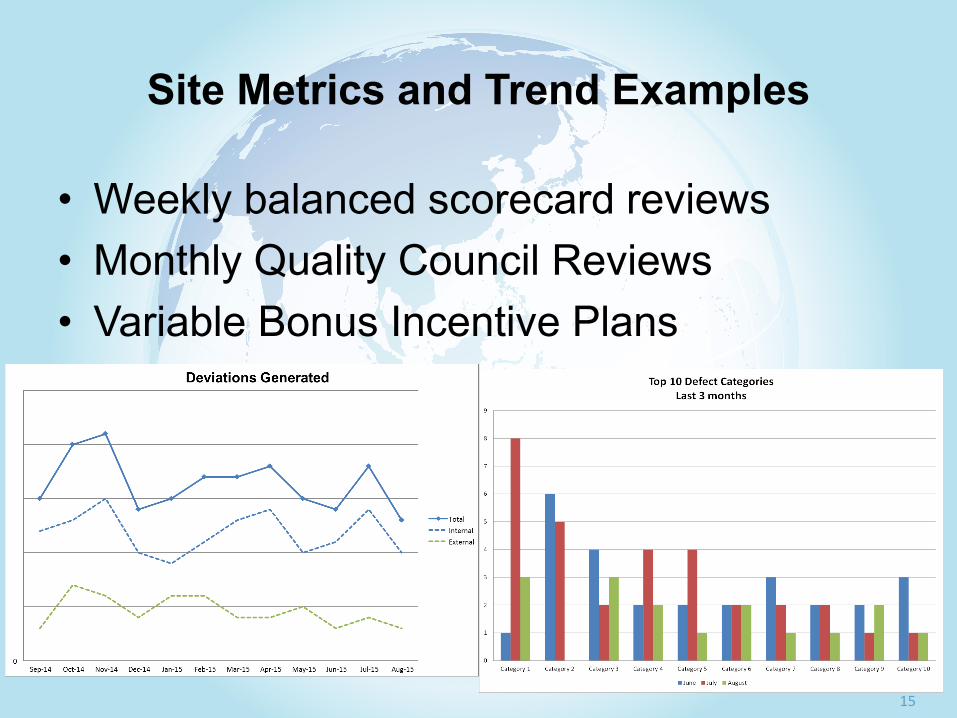
Site Metrics and Trend Examples
15 15
• Weekly balanced scorecard reviews • Monthly Quality Council Reviews • Variable Bonus Incentive Plans

Weekly Site Balanced Scorecard Period / Week #: x Met or exceeded Target Met or exceeded Target
Weeks in Period: y Missed Target for the Week Missed Target for Period-to-DateMissed Target for 2 consecutive Weeks Missed Target for 2 consecutive Periods
Topics / Agenda Items CommentsQuality:Service:Volumes:People:Cost:Inventory/Capital/Other:
Weekly Metrics Weekly Actual
Plan/Flex Weekly Target
Weekly % Diff vs. Target
Weekly Status
PTD Actual
Plan/Flex PTD Target
Plan/Flex Period Target
PTD % Diff vs. Target
PTD Status
Quality# of Deviations Generated 100.0% 100.0%
# of Deviations Open 100.0% 100.0%
Inventory $ on Quality Hold (000's) 100.0% 100.0%
Quality related rejects 100.0% 100.0%
# Quality Events 100.0% 100.0%
Service% of Service to Customer - CHC 100.0% 100.0%
VolumesPlant 5 - Brite Stock Produced 100.0% 100.0%
ALC - Finished Goods DZ (000's) 100.0% 100.0%
PeopleSafety - OSHA Recordable Incidents 100.0% 100.0%
Training compliance 100.0% 100.0%
Near Misses 1 100.0%
Minor Incidents - - 100.0% 100.0%
CostConversion Cost Bulk 100.0% 100.0%
Conversion Cost FG 100.0% 100.0%
h
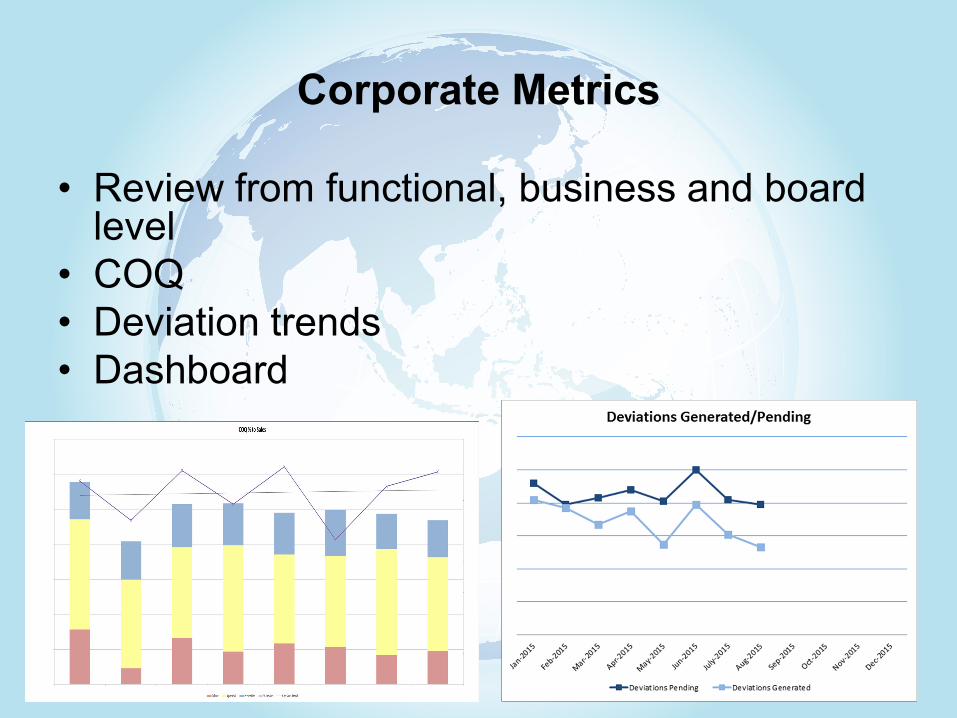
Corporate Metrics
• Review from functional, business and board level
• COQ • Deviation trends • Dashboard
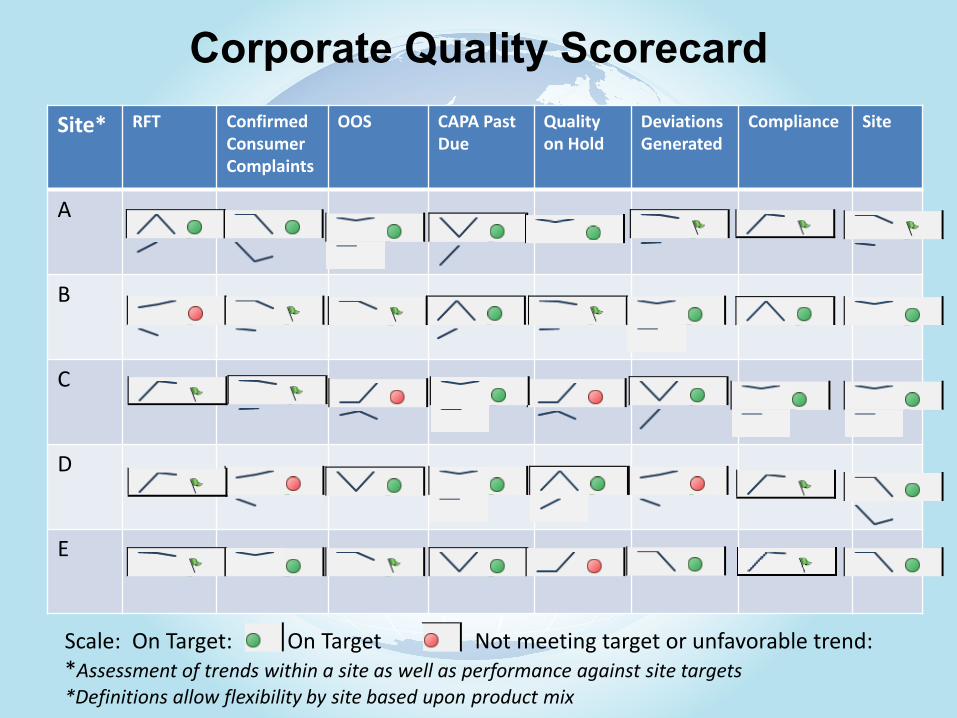
Corporate Quality Scorecard Site* RFT Confirmed
Consumer Complaints
OOS CAPA Past Due
Quality on Hold
Deviations Generated
Compliance Site
A
B
C
D
E
Scale: On Target: On Target Not meeting target or unfavorable trend: *Assessment of trends within a site as well as performance against site targets *Definitions allow flexibility by site based upon product mix
0
0
0
0-1
-1
-1
-1
1 1
1
0
0
0
0
0
0
0
0
1 1
1
0
0
0
0
0
0
0
0
-1
-1
-1
-1
0
0
0
0
0 0
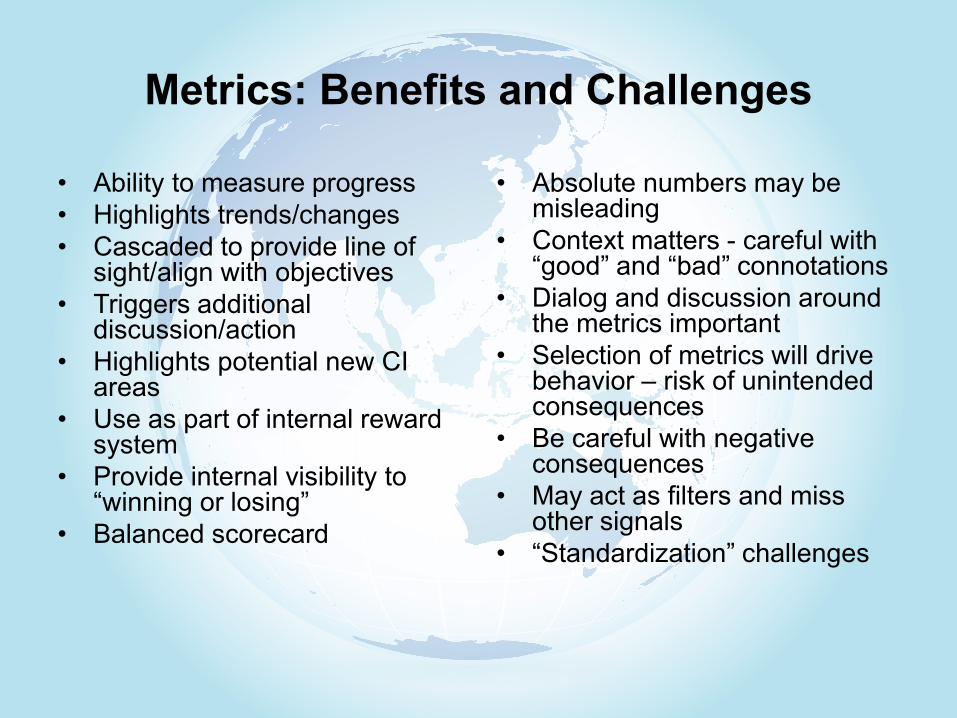
Metrics: Benefits and Challenges
• Ability to measure progress • Highlights trends/changes • Cascaded to provide line of
sight/align with objectives • Triggers additional
discussion/action • Highlights potential new CI
areas • Use as part of internal reward
system • Provide internal visibility to
“winning or losing” • Balanced scorecard
• Absolute numbers may be misleading
• Context matters - careful with “good” and “bad” connotations
• Dialog and discussion around the metrics important
• Selection of metrics will drive behavior – risk of unintended consequences
• Be careful with negative consequences
• May act as filters and miss other signals
• “Standardization” challenges

Considerations in regards to Draft Guidance

Observations on Process to Date
• FDA has engaged in extensive dialog/discussion on metrics
• Appreciate the transparency and conversation at multiple levels
• Clear communication that metrics only one component of assessment
• Draft guidance focused on relatively small set of metrics
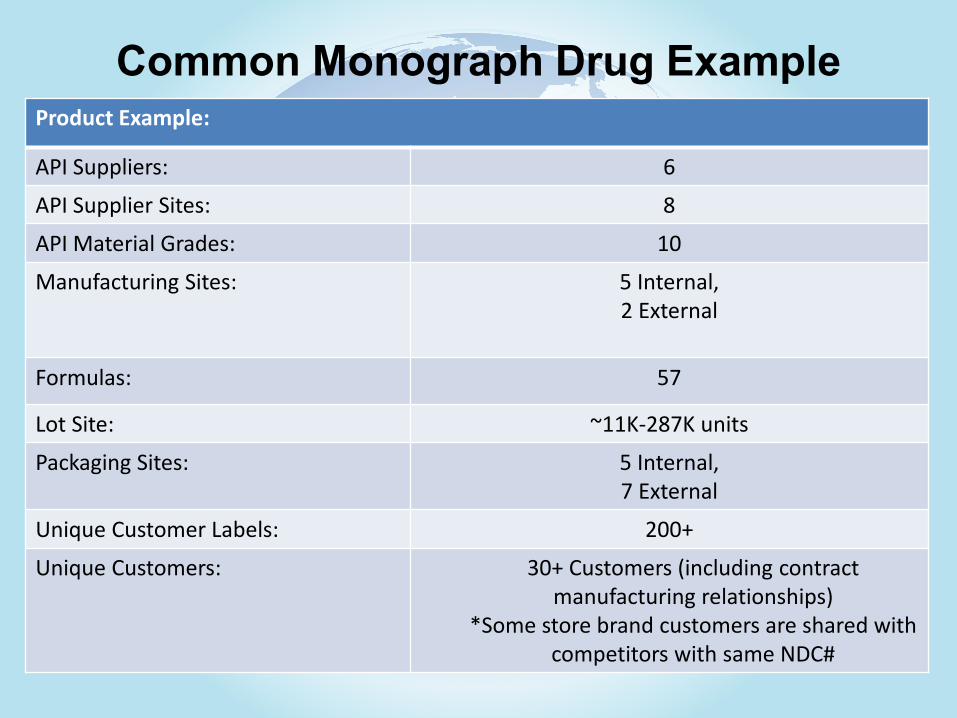
Common Monograph Drug Example Product Example:
API Suppliers: 6
API Supplier Sites: 8
API Material Grades: 10
Manufacturing Sites: 5 Internal, 2 External
Formulas: 57
Lot Site: ~11K-287K units
Packaging Sites: 5 Internal, 7 External
Unique Customer Labels: 200+
Unique Customers: 30+ Customers (including contract manufacturing relationships)
*Some store brand customers are shared with competitors with same NDC#
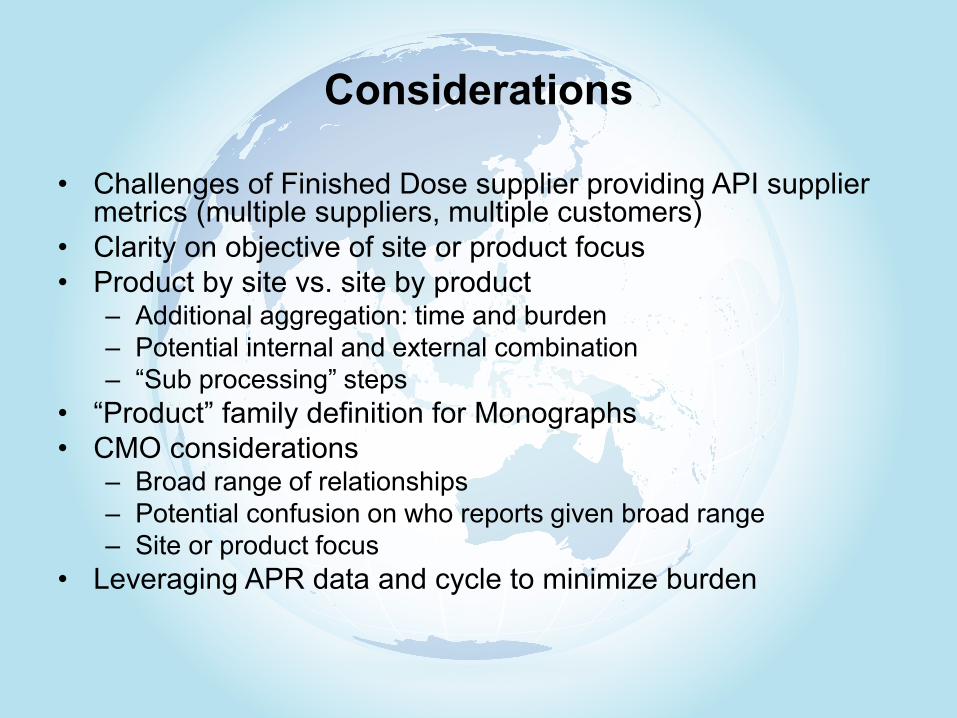
Considerations
• Challenges of Finished Dose supplier providing API supplier metrics (multiple suppliers, multiple customers)
• Clarity on objective of site or product focus • Product by site vs. site by product
– Additional aggregation: time and burden – Potential internal and external combination – “Sub processing” steps
• “Product” family definition for Monographs • CMO considerations
– Broad range of relationships – Potential confusion on who reports given broad range – Site or product focus
• Leveraging APR data and cycle to minimize burden
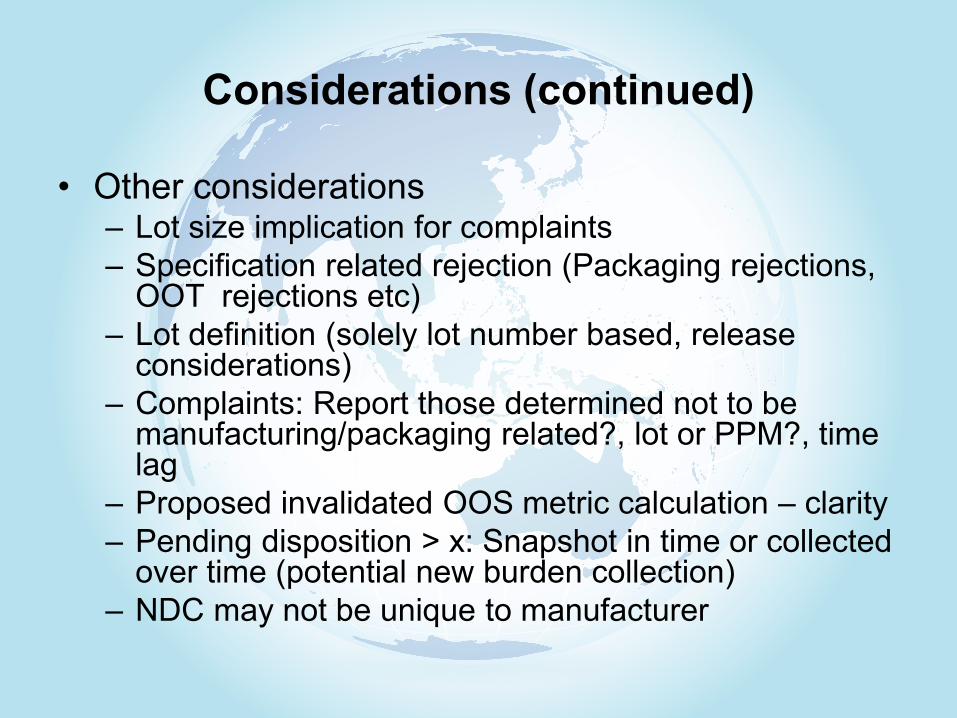
Considerations (continued)
• Other considerations – Lot size implication for complaints – Specification related rejection (Packaging rejections,
OOT rejections etc) – Lot definition (solely lot number based, release
considerations) – Complaints: Report those determined not to be
manufacturing/packaging related?, lot or PPM?, time lag
– Proposed invalidated OOS metric calculation – clarity – Pending disposition > x: Snapshot in time or collected
over time (potential new burden collection) – NDC may not be unique to manufacturer

Broader OTC Industry Comments
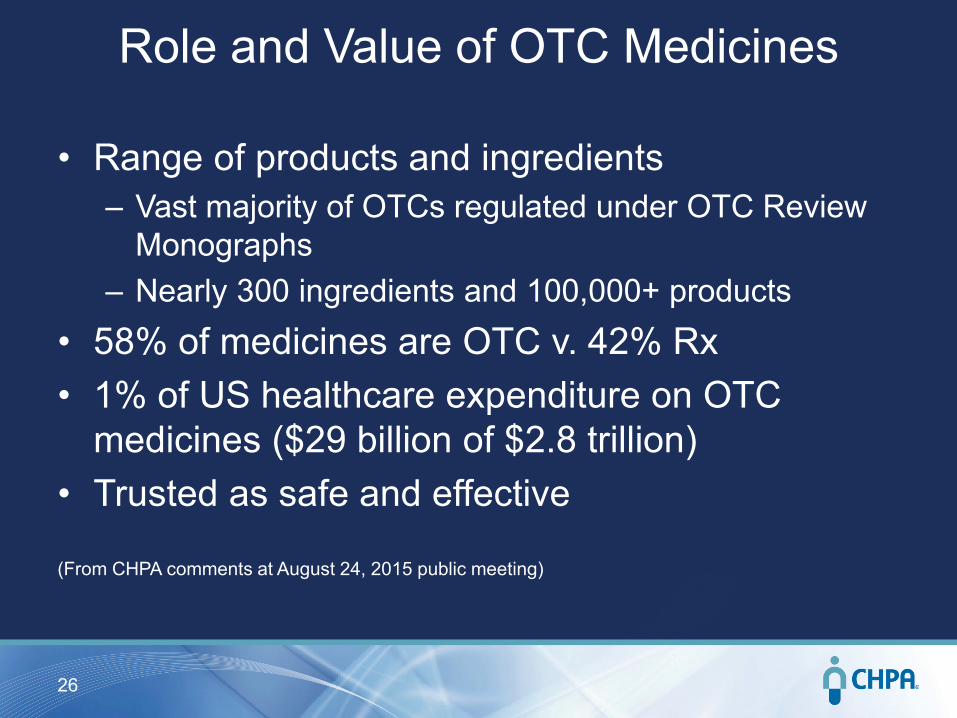
Role and Value of OTC Medicines
• Range of products and ingredients – Vast majority of OTCs regulated under OTC Review
Monographs – Nearly 300 ingredients and 100,000+ products
• 58% of medicines are OTC v. 42% Rx • 1% of US healthcare expenditure on OTC
medicines ($29 billion of $2.8 trillion) • Trusted as safe and effective (From CHPA comments at August 24, 2015 public meeting)
26
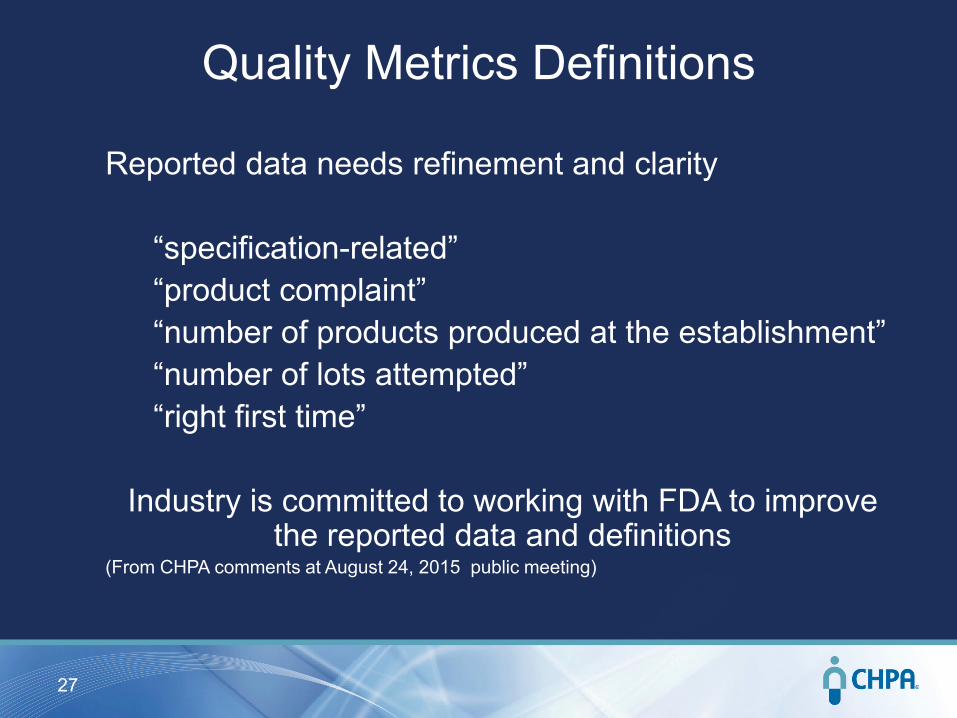
Quality Metrics Definitions
Reported data needs refinement and clarity “specification-related” “product complaint” “number of products produced at the establishment” “number of lots attempted” “right first time”
Industry is committed to working with FDA to improve the reported data and definitions
(From CHPA comments at August 24, 2015 public meeting)
27
CHPA Recommendations
Data reported needs refinement and clarification Quality Metrics implementation should begin with high risk facilities/products Reporting timed to Annual Product Review cycle and site level reporting Consider that the limited text field can be of substantial value (From CHPA comments at August 24, 2015 public meeting)
28
Generic Industry Considerations Proposed Metrics Guidance
• Start Small, Learn, Evolve – Importance of translating large volume of data into
information/knowledge – Significant time investment by both Industry and FDA on
metrics • Collection per definition, reporting, validating • Focus on small/limited set of metrics
– Focus on higher risk • High risk products and/or potential drug shortage
– Potential initial voluntary approach to work out details – Opportunity to build FDA/Industry collaboration through
positive benefits of program – Weigh value/benefit of data collected vs. burden of
collecting/reporting and unintended consequences – Definition clarity and technical details pending