Quality Enhancement Plan A Plan for Student Success in ...sacs.fgc.edu/5thYear/qep.pdf · 2.2.1...
13
Quality Enhancement Plan A Plan for Student Success in Mathematics Fifth-Year Interim Report Impact Report of the QEP
Transcript of Quality Enhancement Plan A Plan for Student Success in ...sacs.fgc.edu/5thYear/qep.pdf · 2.2.1...

Quality Enhancement Plan
A Plan for Student Success in Mathematics
Fifth-Year Interim Report Impact Report of the QEP
Part V: The Impact Report of the Quality Enhancement Plan
Executive Summary .................................................................................... i Goals and Outcomes ................................................................................. 1 Changes to the QEP .................................................................................. 3 Impact on Student Learning ....................................................................... 6 Reflection on What FGC Learned .............................................................. 9

i
MΔth Uρ at FGC
Florida Gateway College Fifth-Year QEP Impact Report
September 2015
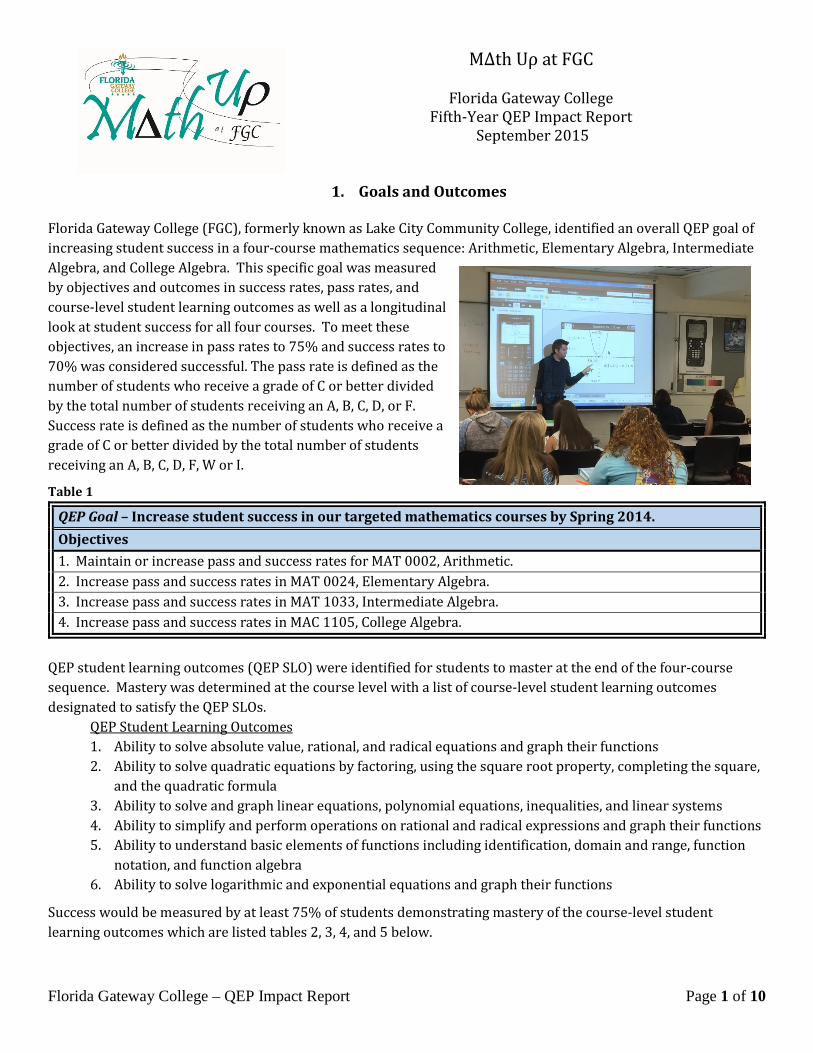
1. Goals and Outcomes Florida Gateway College (FGC), formerly known as Lake City Community College, identified an overall QEP goal of increasing student success in a four-course mathematics sequence: Arithmetic, Elementary Algebra, Intermediate Algebra, and College Algebra. This specific goal was measured by objectives and outcomes in success rates, pass rates, and course-level student learning outcomes as well as a longitudinal look at student success for all four courses. To meet these objectives, an increase in pass rates to 75% and success rates to 70% was considered successful. The pass rate is defined as the number of students who receive a grade of C or better divided by the total number of students receiving an A, B, C, D, or F. Success rate is defined as the number of students who receive a grade of C or better divided by the total number of students receiving an A, B, C, D, F, W or I.
Table 1
QEP student learning outcomes (QEP SLO) were identified for students to master at the end of the four-course sequence. Mastery was determined at the course level with a list of course-level student learning outcomes designated to satisfy the QEP SLOs.
QEP Student Learning Outcomes 1. Ability to solve absolute value, rational, and radical equations and graph their functions 2. Ability to solve quadratic equations by factoring, using the square root property, completing the square,
and the quadratic formula 3. Ability to solve and graph linear equations, polynomial equations, inequalities, and linear systems 4. Ability to simplify and perform operations on rational and radical expressions and graph their functions 5. Ability to understand basic elements of functions including identification, domain and range, function
notation, and function algebra 6. Ability to solve logarithmic and exponential equations and graph their functions
Success would be measured by at least 75% of students demonstrating mastery of the course-level student learning outcomes which are listed tables 2, 3, 4, and 5 below.
QEP Goal – Increase student success in our targeted mathematics courses by Spring 2014. Objectives 1. Maintain or increase pass and success rates for MAT 0002, Arithmetic. 2. Increase pass and success rates in MAT 0024, Elementary Algebra. 3. Increase pass and success rates in MAT 1033, Intermediate Algebra. 4. Increase pass and success rates in MAC 1105, College Algebra.
Florida Gateway College – QEP Impact Report Page 1 of 10
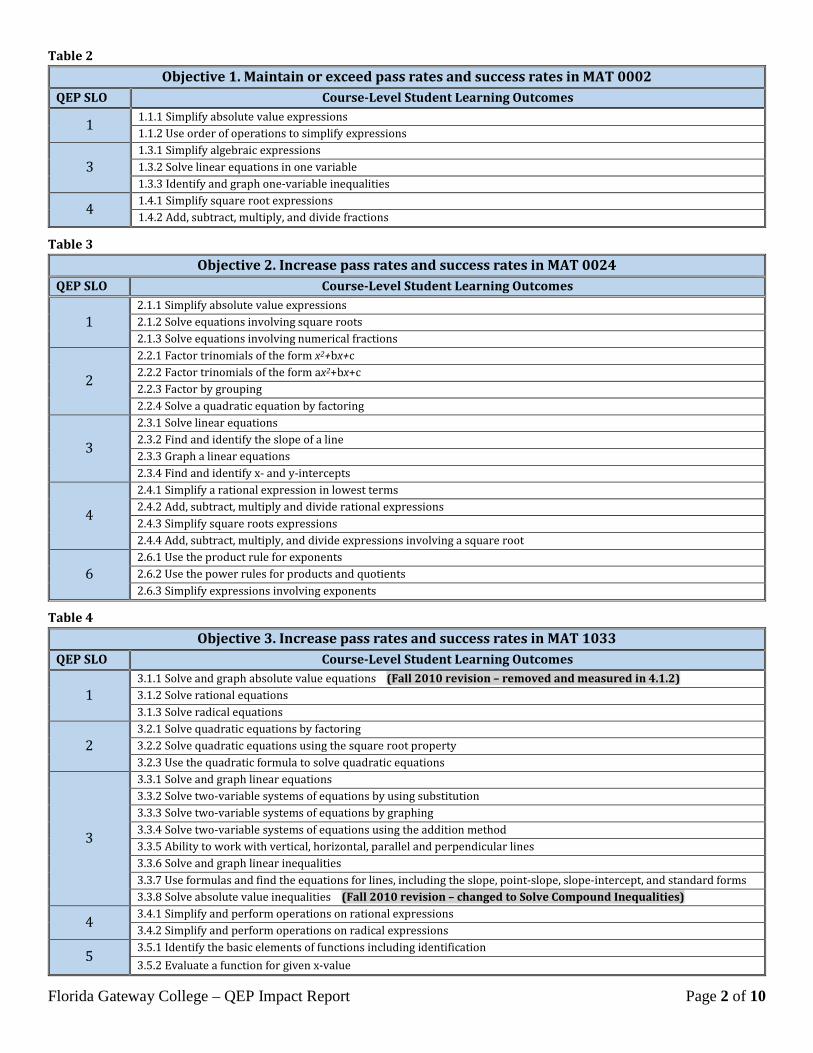
Table 2 Objective 1. Maintain or exceed pass rates and success rates in MAT 0002
QEP SLO Course-Level Student Learning Outcomes
1 1.1.1 Simplify absolute value expressions 1.1.2 Use order of operations to simplify expressions
3 1.3.1 Simplify algebraic expressions 1.3.2 Solve linear equations in one variable 1.3.3 Identify and graph one-variable inequalities
4 1.4.1 Simplify square root expressions 1.4.2 Add, subtract, multiply, and divide fractions
Table 3 Objective 2. Increase pass rates and success rates in MAT 0024
QEP SLO Course-Level Student Learning Outcomes
1 2.1.1 Simplify absolute value expressions 2.1.2 Solve equations involving square roots 2.1.3 Solve equations involving numerical fractions
2
2.2.1 Factor trinomials of the form x2+bx+c 2.2.2 Factor trinomials of the form ax2+bx+c 2.2.3 Factor by grouping 2.2.4 Solve a quadratic equation by factoring
3
2.3.1 Solve linear equations 2.3.2 Find and identify the slope of a line 2.3.3 Graph a linear equations 2.3.4 Find and identify x- and y-intercepts
4
2.4.1 Simplify a rational expression in lowest terms 2.4.2 Add, subtract, multiply and divide rational expressions 2.4.3 Simplify square roots expressions 2.4.4 Add, subtract, multiply, and divide expressions involving a square root
6 2.6.1 Use the product rule for exponents 2.6.2 Use the power rules for products and quotients 2.6.3 Simplify expressions involving exponents
Table 4 Objective 3. Increase pass rates and success rates in MAT 1033
QEP SLO Course-Level Student Learning Outcomes
1 3.1.1 Solve and graph absolute value equations (Fall 2010 revision – removed and measured in 4.1.2) 3.1.2 Solve rational equations 3.1.3 Solve radical equations
2 3.2.1 Solve quadratic equations by factoring 3.2.2 Solve quadratic equations using the square root property 3.2.3 Use the quadratic formula to solve quadratic equations
3
3.3.1 Solve and graph linear equations 3.3.2 Solve two-variable systems of equations by using substitution 3.3.3 Solve two-variable systems of equations by graphing 3.3.4 Solve two-variable systems of equations using the addition method 3.3.5 Ability to work with vertical, horizontal, parallel and perpendicular lines 3.3.6 Solve and graph linear inequalities 3.3.7 Use formulas and find the equations for lines, including the slope, point-slope, slope-intercept, and standard forms 3.3.8 Solve absolute value inequalities (Fall 2010 revision – changed to Solve Compound Inequalities)
4 3.4.1 Simplify and perform operations on rational expressions 3.4.2 Simplify and perform operations on radical expressions
5 3.5.1 Identify the basic elements of functions including identification 3.5.2 Evaluate a function for given x-value
Florida Gateway College – QEP Impact Report Page 2 of 10
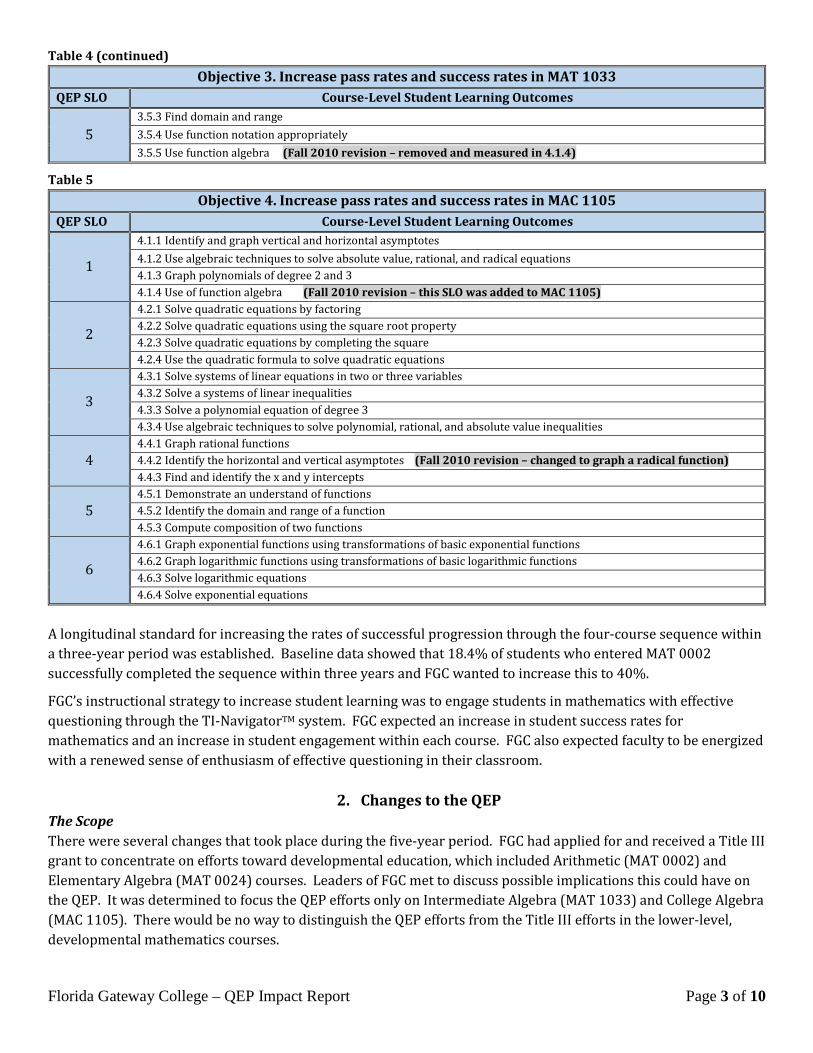
Table 4 (continued) Objective 3. Increase pass rates and success rates in MAT 1033
QEP SLO Course-Level Student Learning Outcomes
5 3.5.3 Find domain and range 3.5.4 Use function notation appropriately 3.5.5 Use function algebra (Fall 2010 revision – removed and measured in 4.1.4)
Table 5 Objective 4. Increase pass rates and success rates in MAC 1105
QEP SLO Course-Level Student Learning Outcomes
1
4.1.1 Identify and graph vertical and horizontal asymptotes 4.1.2 Use algebraic techniques to solve absolute value, rational, and radical equations 4.1.3 Graph polynomials of degree 2 and 3 4.1.4 Use of function algebra (Fall 2010 revision – this SLO was added to MAC 1105)
2
4.2.1 Solve quadratic equations by factoring 4.2.2 Solve quadratic equations using the square root property 4.2.3 Solve quadratic equations by completing the square 4.2.4 Use the quadratic formula to solve quadratic equations
3
4.3.1 Solve systems of linear equations in two or three variables 4.3.2 Solve a systems of linear inequalities 4.3.3 Solve a polynomial equation of degree 3 4.3.4 Use algebraic techniques to solve polynomial, rational, and absolute value inequalities
4 4.4.1 Graph rational functions 4.4.2 Identify the horizontal and vertical asymptotes (Fall 2010 revision – changed to graph a radical function) 4.4.3 Find and identify the x and y intercepts
5 4.5.1 Demonstrate an understand of functions 4.5.2 Identify the domain and range of a function 4.5.3 Compute composition of two functions
6
4.6.1 Graph exponential functions using transformations of basic exponential functions 4.6.2 Graph logarithmic functions using transformations of basic logarithmic functions 4.6.3 Solve logarithmic equations 4.6.4 Solve exponential equations
A longitudinal standard for increasing the rates of successful progression through the four-course sequence within a three-year period was established. Baseline data showed that 18.4% of students who entered MAT 0002 successfully completed the sequence within three years and FGC wanted to increase this to 40%.
FGC’s instructional strategy to increase student learning was to engage students in mathematics with effective questioning through the TI-NavigatorTM system. FGC expected an increase in student success rates for mathematics and an increase in student engagement within each course. FGC also expected faculty to be energized with a renewed sense of enthusiasm of effective questioning in their classroom.
2. Changes to the QEP The Scope There were several changes that took place during the five-year period. FGC had applied for and received a Title III grant to concentrate on efforts toward developmental education, which included Arithmetic (MAT 0002) and Elementary Algebra (MAT 0024) courses. Leaders of FGC met to discuss possible implications this could have on the QEP. It was determined to focus the QEP efforts only on Intermediate Algebra (MAT 1033) and College Algebra (MAC 1105). There would be no way to distinguish the QEP efforts from the Title III efforts in the lower-level, developmental mathematics courses.
Florida Gateway College – QEP Impact Report Page 3 of 10
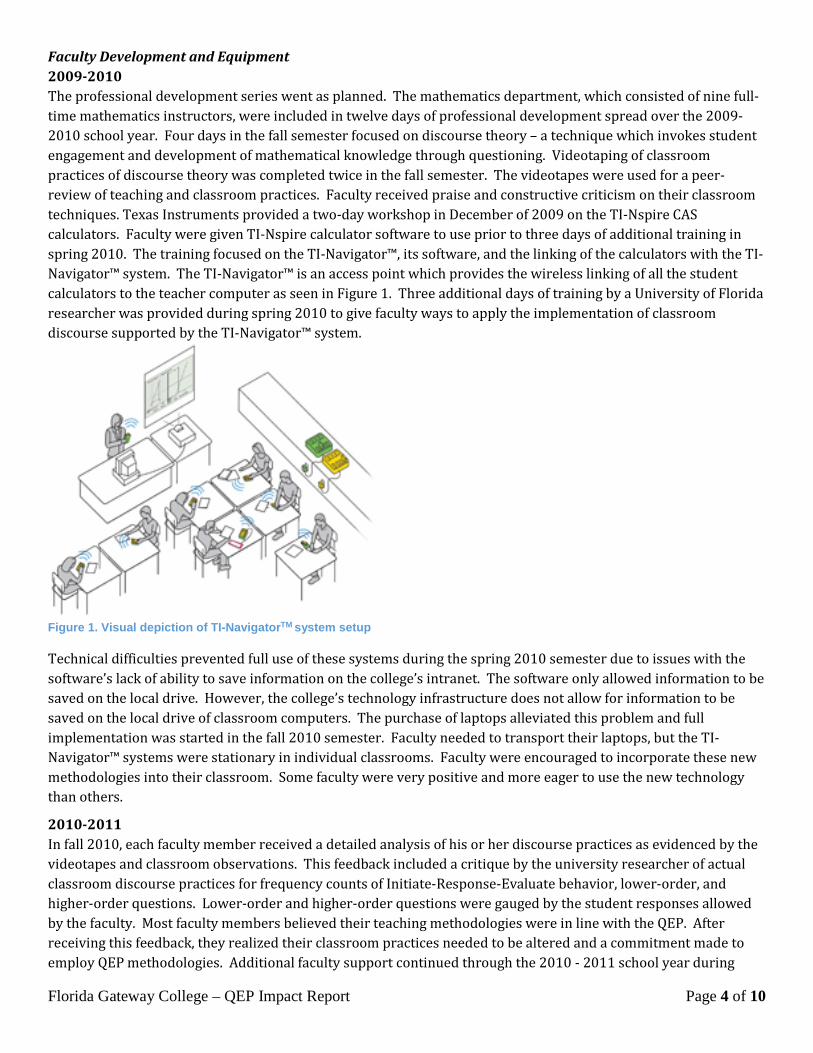
Faculty Development and Equipment 2009-2010 The professional development series went as planned. The mathematics department, which consisted of nine full-time mathematics instructors, were included in twelve days of professional development spread over the 2009-2010 school year. Four days in the fall semester focused on discourse theory – a technique which invokes student engagement and development of mathematical knowledge through questioning. Videotaping of classroom practices of discourse theory was completed twice in the fall semester. The videotapes were used for a peer-review of teaching and classroom practices. Faculty received praise and constructive criticism on their classroom techniques. Texas Instruments provided a two-day workshop in December of 2009 on the TI-Nspire CAS calculators. Faculty were given TI-Nspire calculator software to use prior to three days of additional training in spring 2010. The training focused on the TI-Navigator™, its software, and the linking of the calculators with the TI-Navigator™ system. The TI-Navigator™ is an access point which provides the wireless linking of all the student calculators to the teacher computer as seen in Figure 1. Three additional days of training by a University of Florida researcher was provided during spring 2010 to give faculty ways to apply the implementation of classroom discourse supported by the TI-Navigator™ system.
Figure 1. Visual depiction of TI-NavigatorTM system setup
Technical difficulties prevented full use of these systems during the spring 2010 semester due to issues with the software’s lack of ability to save information on the college’s intranet. The software only allowed information to be saved on the local drive. However, the college’s technology infrastructure does not allow for information to be saved on the local drive of classroom computers. The purchase of laptops alleviated this problem and full implementation was started in the fall 2010 semester. Faculty needed to transport their laptops, but the TI-Navigator™ systems were stationary in individual classrooms. Faculty were encouraged to incorporate these new methodologies into their classroom. Some faculty were very positive and more eager to use the new technology than others.
2010-2011 In fall 2010, each faculty member received a detailed analysis of his or her discourse practices as evidenced by the videotapes and classroom observations. This feedback included a critique by the university researcher of actual classroom discourse practices for frequency counts of Initiate-Response-Evaluate behavior, lower-order, and higher-order questions. Lower-order and higher-order questions were gauged by the student responses allowed by the faculty. Most faculty members believed their teaching methodologies were in line with the QEP. After receiving this feedback, they realized their classroom practices needed to be altered and a commitment made to employ QEP methodologies. Additional faculty support continued through the 2010 - 2011 school year during
Florida Gateway College – QEP Impact Report Page 4 of 10

which graduate students assisted faculty members in their implementation of the TI-Navigator™ system. These graduate students provided insight into classroom opportunities for questioning and suggested changes in lesson plans to enhance student learning. Improvements in implementation of the QEP teaching methodologies were evident throughout the year. 2011-2012 Faculty received three days of professional development in the beginning of the fall 2011 semester. Texas Instruments provided a two-day workshop for additional training on a software update. Initially there were two software packages. One software package was for creating documents to use on the calculators for content development or assessments. The other software package was for the TI-Navigator™ system to connect the student calculators for quick polls, screen captures, assessments and document collections. Major changes combined these two software packages, making the use of the system seamless. Faculty needed to become familiar with these changes to make adjustments to their lesson plans. On day three the university researcher followed up on classroom practices from additional videotapes. Faculty members were asked to present clips of their own classroom practices. These clips were to highlight their best practices and to receive critiques on how to implement classroom discourse that was supported by the TI-Navigator™ system. Faculty members were also asked to create a document to use for the TI-Navigator™ that would support student content development in the classroom.
There were seven additional days of faculty development in the 2011-2012 academic year. These were set aside for individualized help. The university researcher observed faculty and students in the classroom. He provided
detailed comments, suggestions, and areas of growth for each faculty member.
Of the nine original faculty members who began the professional development in 2009, three remained after the five-year period. One faculty member passed away, three found positions at other institutions, one changed career paths, and one moved into administration at FGC. There have been additional faculty members joining the department, but those faculty have not received the level of intense professional development as the original nine. FGC has held several internal faculty development sessions for those individual faculty members joining the
department. This has caused a significant disadvantage for those faculty entering the department after the initial three years of intensive professional development.
The Outcomes and Measurement Instrument The department met annually to discuss course-level student learning outcomes and the departmental final exam which measured these outcomes. Adjustments to the departmental final were made during the fall 2010 semester to better reflect conceptual understanding in our course-specific student learning outcomes. For example, instead of giving a quadratic function to graph, the department gave a graph of a quadratic function and asked students to state the function. Instead of students plotting points and connecting the points, they had to conceptually understand the graph and how that affects the function itself.
Florida Gateway College – QEP Impact Report Page 5 of 10
3. Impact on Student Learning Focus Group Analysis
Focus groups were conducted with an overwhelming majority of students expressing their appreciation over the change in teaching methodology. Students also commented that using the technology provided instant feedback that helped them to know where they understood the material or where they had misconceptions. The synopsis was summed by one student who stated, “What I liked was the fact that you are able to put your answers in and get feedback immediately and you were also able to kind of see what your fellow students were doing. If you’re on task, little mistakes that you may have made, it’s all right before the entire class and you were able to communicate and it kind of brought a little unison as to where the entire class could have input.”
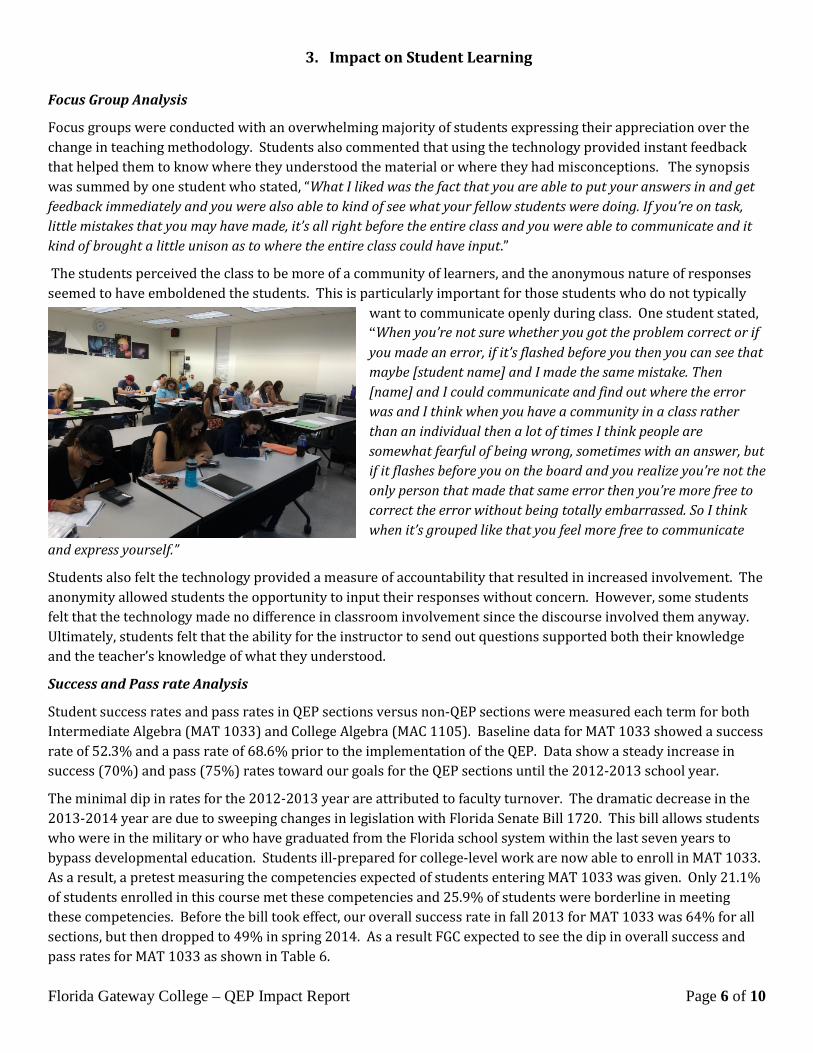
The students perceived the class to be more of a community of learners, and the anonymous nature of responses seemed to have emboldened the students. This is particularly important for those students who do not typically
want to communicate openly during class. One student stated, “When you’re not sure whether you got the problem correct or if you made an error, if it’s flashed before you then you can see that maybe [student name] and I made the same mistake. Then [name] and I could communicate and find out where the error was and I think when you have a community in a class rather than an individual then a lot of times I think people are somewhat fearful of being wrong, sometimes with an answer, but if it flashes before you on the board and you realize you’re not the only person that made that same error then you’re more free to correct the error without being totally embarrassed. So I think when it’s grouped like that you feel more free to communicate
and express yourself.”
Students also felt the technology provided a measure of accountability that resulted in increased involvement. The anonymity allowed students the opportunity to input their responses without concern. However, some students felt that the technology made no difference in classroom involvement since the discourse involved them anyway. Ultimately, students felt that the ability for the instructor to send out questions supported both their knowledge and the teacher’s knowledge of what they understood.
Success and Pass rate Analysis
Student success rates and pass rates in QEP sections versus non-QEP sections were measured each term for both Intermediate Algebra (MAT 1033) and College Algebra (MAC 1105). Baseline data for MAT 1033 showed a success rate of 52.3% and a pass rate of 68.6% prior to the implementation of the QEP. Data show a steady increase in success (70%) and pass (75%) rates toward our goals for the QEP sections until the 2012-2013 school year.
The minimal dip in rates for the 2012-2013 year are attributed to faculty turnover. The dramatic decrease in the 2013-2014 year are due to sweeping changes in legislation with Florida Senate Bill 1720. This bill allows students who were in the military or who have graduated from the Florida school system within the last seven years to bypass developmental education. Students ill-prepared for college-level work are now able to enroll in MAT 1033. As a result, a pretest measuring the competencies expected of students entering MAT 1033 was given. Only 21.1% of students enrolled in this course met these competencies and 25.9% of students were borderline in meeting these competencies. Before the bill took effect, our overall success rate in fall 2013 for MAT 1033 was 64% for all sections, but then dropped to 49% in spring 2014. As a result FGC expected to see the dip in overall success and pass rates for MAT 1033 as shown in Table 6. Florida Gateway College – QEP Impact Report Page 6 of 10

Table 6
MAT 1033 Intermediate Algebra
Fall 06 –
Spring 08 Fall 09 –
Spring 10 Fall 10 –
Spring 11 Fall 11 –
Spring 12 Fall 12 –
Spring 13 Fall 13 –
Spring 14 Success Rates
Baseline 52.3% QEP Sections 57.7% 64.1% 68.3% 65.7% 55.4% Non-QEP Sections 46.8% 53.3% 54.0% 51.6% 47.4% Pass Rates Baseline 68.6% QEP Sections 63.5% 66.3% 73.7% 68.8% 61.3% Non-QEP Sections 54.7% 56.3% 59.2% 56.3% 52.6%
As shown in Table 7, there was a marked improvement in success and pass rates in MAC 1105. There was an overall 10% increase in success rates as compared to our baseline data of 56.7%. Pass rates also showed improvement over the five-year period.
Table 7
MAC 1105 College Algebra
Fall 06 –
Spring 08 Fall 09 –
Spring 10 Fall 10 –
Spring 11 Fall 11 –
Spring 12 Fall 12 –
Spring 13 Fall 13 –
Spring 14 Success Rates
Baseline 56.7% QEP Sections 61.4% 62.5% 69.5% 69.3% 66.5% Non-QEP Sections 47.7% 58.4% 50.4% 52.2% 60.2% Pass Rates Baseline 71.9% QEP Sections 69.1% 65.2% 74.5% 74.9% 74.0% Non-QEP Sections 59.0% 62.5% 65.9% 59.0% 65.9%
The steady nature of success and pass rates for the last three years is due to several factors. The rate at which new faculty could be fully trained of the new technology and teaching methodology was one. Changes in the variability of instructors teaching MAC 1105 was another. There was also a high turnover rate of instructors during this period. All these factors contributed to the success and pass rates shown in Table 7.
As shown in Tables 6 and 7, all QEP sections displayed a higher success and pass rate than the non-QEP sections for every year of implementation. This is evidence that the methods used in the QEP had a positive impact on successful completion of MAT 1033 and MAC 1105.
Course-specific student learning outcomes analysis FGC measured course-level student learning outcomes in MAT 1033 and MAC 1105 from the departmental final exam for each course. At the end of each academic year, mathematics faculty met to review and revise the departmental final exams and/or course content. During spring 2010, an intensive revision of course content was completed and it was determined that several course-level student learning outcomes in MAT 1033 and MAC 1105 needed to be revised or removed. These changes took place for the fall 2010 semester. Table 8 shows the decision type and the reasoning behind it.
Table 8 Course-level SLO Reasoning Final Action 3.1.1 Solve and graph absolute value equations
Absolute value equations are not listed in Florida’s Statewide Course Numbering System; therefore, it is not covered in MAT 1033
Removed 3.1.1 from QEP SLO and now measured in 4.1.2 Use algebraic techniques to solve absolute value, rational, and radical equations
Florida Gateway College – QEP Impact Report Page 7 of 10
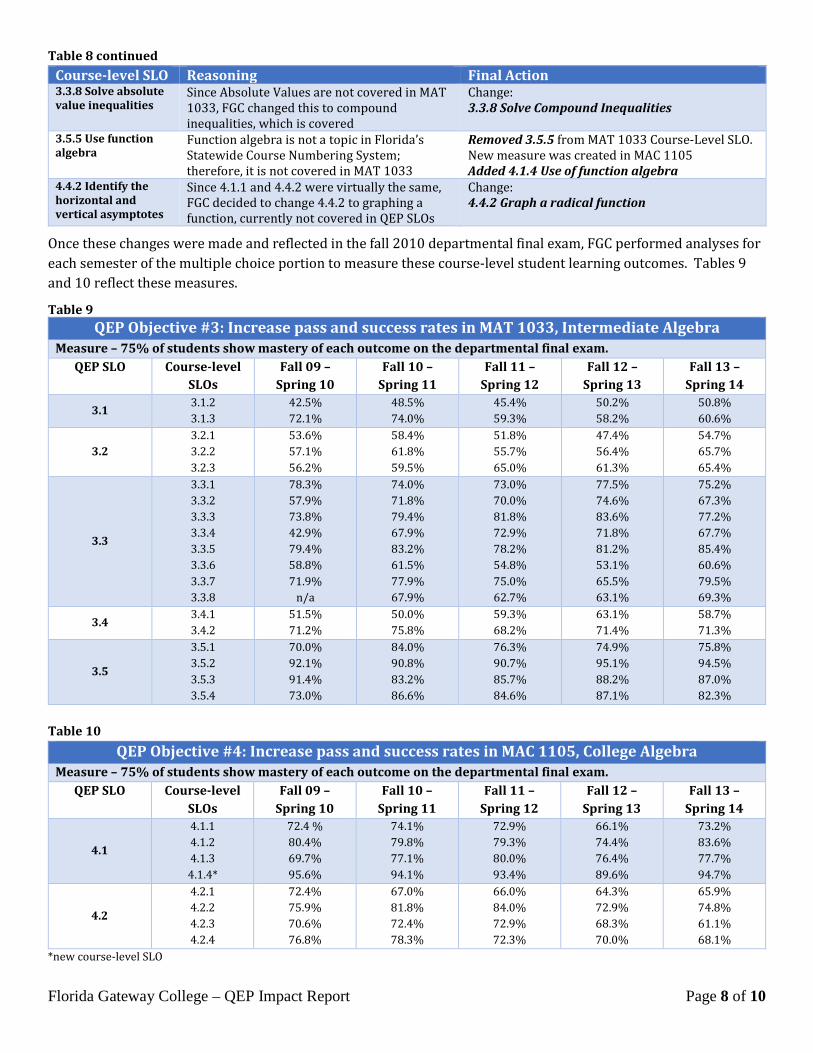
Table 8 continued Course-level SLO Reasoning Final Action 3.3.8 Solve absolute value inequalities
Since Absolute Values are not covered in MAT 1033, FGC changed this to compound inequalities, which is covered
Change: 3.3.8 Solve Compound Inequalities
3.5.5 Use function algebra
Function algebra is not a topic in Florida’s Statewide Course Numbering System; therefore, it is not covered in MAT 1033
Removed 3.5.5 from MAT 1033 Course-Level SLO. New measure was created in MAC 1105 Added 4.1.4 Use of function algebra
4.4.2 Identify the horizontal and vertical asymptotes
Since 4.1.1 and 4.4.2 were virtually the same, FGC decided to change 4.4.2 to graphing a function, currently not covered in QEP SLOs
Change: 4.4.2 Graph a radical function
Once these changes were made and reflected in the fall 2010 departmental final exam, FGC performed analyses for each semester of the multiple choice portion to measure these course-level student learning outcomes. Tables 9 and 10 reflect these measures.
Table 9 QEP Objective #3: Increase pass and success rates in MAT 1033, Intermediate Algebra
Measure – 75% of students show mastery of each outcome on the departmental final exam. QEP SLO Course-level
SLOs Fall 09 –
Spring 10 Fall 10 –
Spring 11 Fall 11 –
Spring 12 Fall 12 –
Spring 13 Fall 13 –
Spring 14
3.1 3.1.2 3.1.3
42.5% 72.1%
48.5% 74.0%
45.4% 59.3%
50.2% 58.2%
50.8% 60.6%
3.2 3.2.1 3.2.2 3.2.3
53.6% 57.1% 56.2%
58.4% 61.8% 59.5%
51.8% 55.7% 65.0%
47.4% 56.4% 61.3%
54.7% 65.7% 65.4%
3.3
3.3.1 3.3.2 3.3.3 3.3.4 3.3.5 3.3.6 3.3.7 3.3.8
78.3% 57.9% 73.8% 42.9% 79.4% 58.8% 71.9%
n/a
74.0% 71.8% 79.4% 67.9% 83.2% 61.5% 77.9% 67.9%
73.0% 70.0% 81.8% 72.9% 78.2% 54.8% 75.0% 62.7%
77.5% 74.6% 83.6% 71.8% 81.2% 53.1% 65.5% 63.1%
75.2% 67.3% 77.2% 67.7% 85.4% 60.6% 79.5% 69.3%
3.4 3.4.1 3.4.2
51.5% 71.2%
50.0% 75.8%
59.3% 68.2%
63.1% 71.4%
58.7% 71.3%
3.5
3.5.1 3.5.2 3.5.3 3.5.4
70.0% 92.1% 91.4% 73.0%
84.0% 90.8% 83.2% 86.6%
76.3% 90.7% 85.7% 84.6%
74.9% 95.1% 88.2% 87.1%
75.8% 94.5% 87.0% 82.3%
Table 10
QEP Objective #4: Increase pass and success rates in MAC 1105, College Algebra Measure – 75% of students show mastery of each outcome on the departmental final exam.
QEP SLO Course-level SLOs
Fall 09 – Spring 10
Fall 10 – Spring 11
Fall 11 – Spring 12
Fall 12 – Spring 13
Fall 13 – Spring 14
4.1
4.1.1 4.1.2 4.1.3 4.1.4*
72.4 % 80.4% 69.7% 95.6%
74.1% 79.8% 77.1% 94.1%
72.9% 79.3% 80.0% 93.4%
66.1% 74.4% 76.4% 89.6%
73.2% 83.6% 77.7% 94.7%
4.2
4.2.1 4.2.2 4.2.3 4.2.4
72.4% 75.9% 70.6% 76.8%
67.0% 81.8% 72.4% 78.3%
66.0% 84.0% 72.9% 72.3%
64.3% 72.9% 68.3% 70.0%
65.9% 74.8% 61.1% 68.1%
*new course-level SLO
Florida Gateway College – QEP Impact Report Page 8 of 10
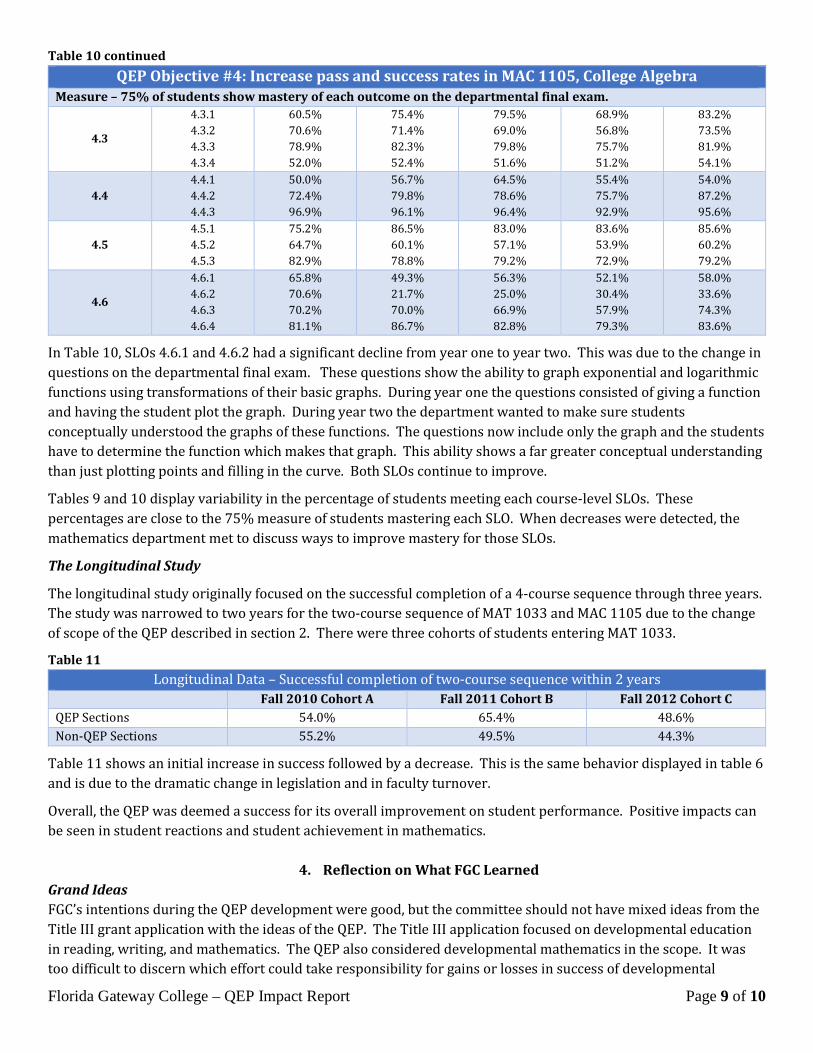
Table 10 continued QEP Objective #4: Increase pass and success rates in MAC 1105, College Algebra
Measure – 75% of students show mastery of each outcome on the departmental final exam.
4.3
4.3.1 4.3.2 4.3.3 4.3.4
60.5% 70.6% 78.9% 52.0%
75.4% 71.4% 82.3% 52.4%
79.5% 69.0% 79.8% 51.6%
68.9% 56.8% 75.7% 51.2%
83.2% 73.5% 81.9% 54.1%
4.4 4.4.1 4.4.2 4.4.3
50.0% 72.4% 96.9%
56.7% 79.8% 96.1%
64.5% 78.6% 96.4%
55.4% 75.7% 92.9%
54.0% 87.2% 95.6%
4.5 4.5.1 4.5.2 4.5.3
75.2% 64.7% 82.9%
86.5% 60.1% 78.8%
83.0% 57.1% 79.2%
83.6% 53.9% 72.9%
85.6% 60.2% 79.2%
4.6
4.6.1 4.6.2 4.6.3 4.6.4
65.8% 70.6% 70.2% 81.1%
49.3% 21.7% 70.0% 86.7%
56.3% 25.0% 66.9% 82.8%
52.1% 30.4% 57.9% 79.3%
58.0% 33.6% 74.3% 83.6%
In Table 10, SLOs 4.6.1 and 4.6.2 had a significant decline from year one to year two. This was due to the change in questions on the departmental final exam. These questions show the ability to graph exponential and logarithmic functions using transformations of their basic graphs. During year one the questions consisted of giving a function and having the student plot the graph. During year two the department wanted to make sure students conceptually understood the graphs of these functions. The questions now include only the graph and the students have to determine the function which makes that graph. This ability shows a far greater conceptual understanding than just plotting points and filling in the curve. Both SLOs continue to improve.
Tables 9 and 10 display variability in the percentage of students meeting each course-level SLOs. These percentages are close to the 75% measure of students mastering each SLO. When decreases were detected, the mathematics department met to discuss ways to improve mastery for those SLOs.
The Longitudinal Study
The longitudinal study originally focused on the successful completion of a 4-course sequence through three years. The study was narrowed to two years for the two-course sequence of MAT 1033 and MAC 1105 due to the change of scope of the QEP described in section 2. There were three cohorts of students entering MAT 1033.
Table 11 Longitudinal Data – Successful completion of two-course sequence within 2 years
Fall 2010 Cohort A Fall 2011 Cohort B Fall 2012 Cohort C QEP Sections 54.0% 65.4% 48.6% Non-QEP Sections 55.2% 49.5% 44.3%
Table 11 shows an initial increase in success followed by a decrease. This is the same behavior displayed in table 6 and is due to the dramatic change in legislation and in faculty turnover.
Overall, the QEP was deemed a success for its overall improvement on student performance. Positive impacts can be seen in student reactions and student achievement in mathematics.
4. Reflection on What FGC Learned Grand Ideas FGC’s intentions during the QEP development were good, but the committee should not have mixed ideas from the Title III grant application with the ideas of the QEP. The Title III application focused on developmental education in reading, writing, and mathematics. The QEP also considered developmental mathematics in the scope. It was too difficult to discern which effort could take responsibility for gains or losses in success of developmental
Florida Gateway College – QEP Impact Report Page 9 of 10
mathematics courses. Once the Title III award notification was received, FGC had to refocus QEP efforts and remove developmental mathematics courses from the plan.
Faculty and Professional Development FGC realized that the professional development received during year one was more theoretical than practical. During the first four days of professional development, the university researcher that presented the discourse theory approached it in a theoretical manner, which was not well received from some faculty members. These faculty members have a background strictly in mathematics and not mathematics education, so faculty were not buying into the process. The researcher’s approach was educational in nature and faculty wanted more concrete examples of discourse theory. When Texas Instruments provided their professional development of the TI-Navigator™ system, faculty could grasp onto this content much more easily due to its practical nature. Once the university researcher started fusing the two ideas together, faculty were able to fully appreciate the methodology. Making the training more practical was definitely needed from the onset to ensure faculty buy-in.
FGC also needed to budget more dollars for professional development of new faculty members throughout the life of the QEP. When new faculty members were hired, FGC tried to train new members in the QEP methodologies. These efforts should have been more formalized with external trainers. Most current faculty members were too busy to help train new faculty so sustainability of training was impossible without external trainers. The three faculty members who went through the original training still use the methodologies today.
The faculty development had a positive effect on departmental camaraderie. FGC invited area high school teachers to join in the professional development series the first year. Those high school teachers who participated were also given a TI-Navigator™ system to use in their classroom. In working with these teachers, college faculty and secondary school educators were able to open their dialogue on college expectations and high school efforts. Both sides have a new appreciation of each other and continue this relationship today.
Faculty and Student FGC also learned that faculty buy-in was also extremely important. Some faculty had been set in their teaching routine for many years. Getting them to teach outside their comfort zone was problematic at times. Without buy-in, any frustrations from faculty bled into student reaction. Some students pushed back regarding the calculators, which seemed to correlate with faculty buy-in. This mainly happened in the first two weeks due to the time it took them to log into the calculators. Once they became familiar with the login procedure, it became routine for students to pick up the calculators and login before class started. Students were then able to enjoy the classroom engagement along with the autonomy of the system.
Faculty believed they needed more time in the classroom for student orientation to the calculators for successful implementation. The introduction of numerous methodologies required time away from course material the first two weeks of class. FGC should have added some additional class time for students to get acquainted with the equipment at the beginning of each semester to make the transition smooth.
Final Thoughts There were so many outside factors that affected the success of the QEP. FGC could not have planned effectively for high faculty turnover rates, equipment malfunctions, legislative changes, and professional development challenges. All of these factors presented some barriers to the success of the QEP. Overall, FGC believes the QEP was successful and will continue to use the teaching methodologies and the equipment. The college was extremely pleased to receive a nationally renowned award for the 2010 Best Practices from the National Council of Instructional Administrators for the efforts in the QEP.
Florida Gateway College – QEP Impact Report Page 10 of 10