Quality Control of Synthetic Oligonucleotides with On-Line ... A system suitability test was...
6
INTRODUCTION Current methods of DNA synthesis can routinely produce high quality oligonucleotides, provided that automated synthesizers are in optimal operating condition. While suboptimal synthesis may still yield acceptable and usable oligonucleotides, diagnostic and therapeutic applications require high purity oligonucleotide probes. A method utilizing ion-pair reversed-phase high performance liquid chromatography with mass spectrometric detection has been applied for the routine quality control (QC) of oligonucleotides up to 76 nucleotides (76-mer) in length. The 15 min per sample duty cycle allows for fast diagnosis of the performance of DNA synthesizers. EXPERIMENTAL All experiments were performed on an Alliance ® Separations Module using an XTerra ® C18 5 cm x 2.1 mm, 2.5 μm column operated at 60 °C and the Hans Vissers 1 , Per-Åke Hynning 2 , Johan Watz 3 , Brian Green 1 and Ashley Sage 1 1 Waters Corporation, Manchester, United Kingdom, 3 Waters Corporation, Sollentuna, Sweden, 3 Scandinavian Gene Synthesis, Köping,Sweden. QUALITY CONTROL OF SYNTHETIC OLIGONUCLEOTIDES WITH ON-LINE DESALTING USING LC oa-ToF MASS SPECTROMETRY column outlet directly connected to the source of the LCT Premier TM mass spectrometer. The LC method is similar as described previously by Gilar et al. (Oligonucleotides13:229–243 (2003)) with minor modifications. Mobile phase A comprised of 5% methanol (MeOH) in 16.3 mM triethylamine (TEA) and 400 mM1,1,1,3,3,3-hexafluoroisopropanol (HFIP) aqueous buffer. Mobile phase B comprised of 60% MeOH in 16.3 mMTEA:400 mM HFIP aqueous buffer. A gradient of 5 - 60% B in 10 min was used at a flow rate of 0.250 mL/min. Subsequent re-equilibration of the column was performed for 5 min with 5% mobile phase B, resulting in a total duty cycle time of about 15 min per sample. MS data was acquired on an LCT Premier mass spectrometer operating in electrospray negative ion mode, with 10,000 resolution (W- Optics TM ). The mass scale of the ToF analyzer was externally calibrated with a sodium formate solution. The Waters ® Micromass ® LCT Premier™ Mass Spectrometer.
Transcript of Quality Control of Synthetic Oligonucleotides with On-Line ... A system suitability test was...

INTRODUCTIONCurrent methods of DNA synthesis can routinely produce high quality oligonucleotides, provided that automated synthesizers are in optimal operating condition. While suboptimal synthesis may still yield acceptable and usable oligonucleotides, diagnostic and therapeutic applications require high purity oligonucleotide probes. A method utilizing ion-pair reversed-phase high performance liquid chromatography with mass spectrometric detection has been applied for the routine quality control (QC) of oligonucleotides up to 76 nucleotides (76-mer) in length. The 15 min per sample duty cycle allows for fast diagnosis of the performance of DNA synthesizers.
EXPERIMENTALAll experiments were performed on an Alliance®
Separations Module using an XTerra®C18 5 cm x 2.1 mm, 2.5 µm column operated at 60 °C and the
Hans Vissers1, Per-Åke Hynning2, Johan Watz3, Brian Green1 and Ashley Sage1
1Waters Corporation, Manchester, United Kingdom, 3Waters Corporation, Sollentuna, Sweden, 3Scandinavian Gene Synthesis, Köping,Sweden.
QUALITY CONTROL OF SYNTHETIC OLIGONUCLEOTIDES WITH ON-LINE DESALTING
USING LC oa-ToF MASS SPECTROMETRY
column outlet directly connected to the source of the LCT PremierTM mass spectrometer. The LC method is similar as described previously by Gilar et al. (Oligonucleotides13:229–243 (2003)) with minor modifications. Mobile phase A comprised of 5% methanol (MeOH) in 16.3 mM triethylamine (TEA) and 400 mM1,1,1,3,3,3-hexafluoroisopropanol (HFIP) aqueous buffer. Mobile phase B comprised of 60% MeOH in 16.3 mMTEA:400 mM HFIP aqueous buffer. A gradient of 5 - 60% B in 10 min was used at a flow rate of 0.250 mL/min. Subsequent re-equilibration of the column was performed for 5 min with 5% mobile phase B, resulting in a total duty cycle time of about 15 min per sample. MS data was acquired on an LCT Premier mass spectrometer operating in electrospraynegative ion mode, with 10,000 resolution (W-OpticsTM). The mass scale of the ToF analyzer was externally calibrated with a sodium formate solution.
The Waters® Micromass® LCT Premier™ Mass Spectrometer.

RESULTSA system suitability test was conducted with an equimolar mixture (approx. 40 pmol each) of three synthetic oligonucleotide standards comprising 16, 18 and 19 nucleotides in length. Figure 1 illustrates the separation of the three components, which are nearly chromatographically resolved. Shown are the mass extracted chromatograms of the most abundant component of the individual ESI (-) distributions of the standards. All spectra across the three peaks were combined and the multiply charged distributions annotated with the charge state as shown in Figure 2a. The combined spectrum was processed by means of MaxEntTM1, which allows for the deconvolution of multiply charged, non-resolved electrospray data that is typical for proteins and oligonucleotides. MaxEnt1 automatically identifies the average masses of components present in a mixture. Furthermore, MaxEnt1 is quantitative, which means that the algorithm provides a spectrum in which the areas
underneath the peaks are a measure of the sum of the intensities of the peaks in the original multiply charged data. The deconvoluted spectrum is shown in Figure 2b, confirming equal amounts of the three oligonucleotide standards to be present in the sample. All three standards were mass measured with an external calibration of the mass scale of the ToFanalyzer of the LCT Premier within the specified tolerance of ±0.5 Da. The results of the experiment are summarized in Table 1.
#bases Theoretical average mass (Da)
Measured average mass (Da)
16 4805.1 4804.9 18 5413.6 5413.1 19 5717.8 5717.3
Table 1. Results summary for the LC/MS analysis of an equimolar mixture of three synthetic oligonucleotides. The conditions are described in the Experimental section.
Figure 1. Separation of 16, 18, and 19-mer oligonucleotides by ion-paring reversed phase chromatography. The chromatographic conditions are described in the Experimental section.
Time3.60 3.80 4.00 4.20 4.40 4.60 4.80 5.00 5.20 5.40 5.60 5.80 6.00 6.20 6.40 6.60 6.80 7.00 7.20 7.40
%
0
100
3.60 3.80 4.00 4.20 4.40 4.60 4.80 5.00 5.20 5.40 5.60 5.80 6.00 6.20 6.40 6.60 6.80 7.00 7.20 7.40
%
0
100
3.60 3.80 4.00 4.20 4.40 4.60 4.80 5.00 5.20 5.40 5.60 5.80 6.00 6.20 6.40 6.60 6.80 7.00 7.20 7.40
%
0
100 1599.9
772.1
1428.0

Figure 2a. ESI (-) oa-ToF MS spectrum of 16, 18, and 19-mer oligonucleotides after on-line desalting. The MS spectrum was obtained by combining the spectra across the three chromatographic peaks (Figure 1).
Figure 2b.The MaxEnt 1 deconvoluted, average mass spectrum for the three oligonucleotides.
mass4500 4600 4700 4800 4900 5000 5100 5200 5300 5400 5500 5600 5700 5800 5900 6000
%
0
100C
5717.3
A4804.9 B
5413.1
4827.0
4973.1
5435.3
5581.4
5739.5
5885.65761.2
m/z600 700 800 900 1000 1100 1200 1300 1400 1500 1600 1700 1800 1900
%
0
100A3
1599.9
A6799.6
A7685.3
B8675.6
675.5
634.2
599.6
B7772.1
685.4
C8713.6
713.7
713.9772.0
714.0
734.6
A41199.9
A5959.8
799.8
C7815.6
B6901.0
815.7
815.9
816.0
900.8
827.8
C6951.6
901.1
901.3
901.5
951.5
911.2
960.0
1081.4960.2
960.4
1081.2
960.6
1199.7
C51142.2
1081.8
1082.0
1142.6
1142.8
C41428.0
1428.0
B41351.9
1200.2
1200.5
1351.81200.7
1205.7
1352.2
1352.5
1352.8
1357.8
1428.2
1428.5
1428.8
1433.8
C31904.3
1607.9
B31802.6
1608.3
1608.6
1615.3
1615.6
1622.6
1904.0
1810.7
1811.0
1818.0
1904.6
1912.3
1920.9
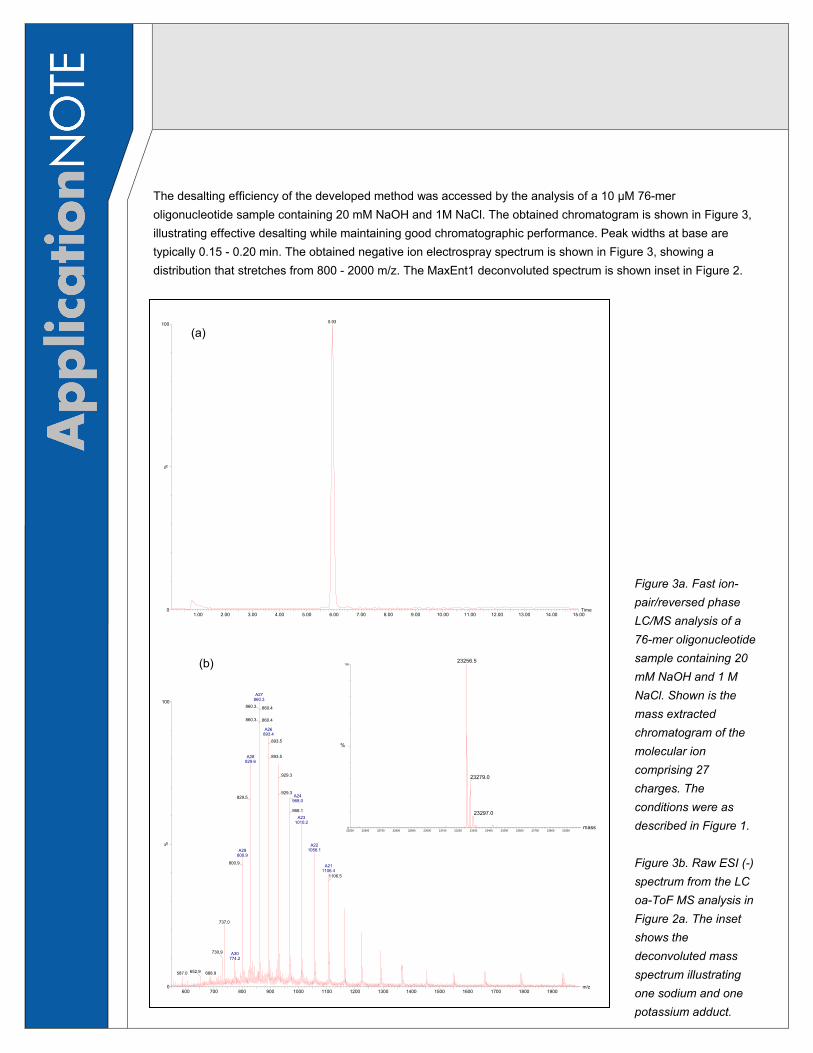
The desalting efficiency of the developed method was accessed by the analysis of a 10 µM 76-mer oligonucleotide sample containing 20 mM NaOH and 1M NaCl. The obtained chromatogram is shown in Figure 3, illustrating effective desalting while maintaining good chromatographic performance. Peak widths at base are typically 0.15 - 0.20 min. The obtained negative ion electrospray spectrum is shown in Figure 3, showing a distribution that stretches from 800 - 2000 m/z. The MaxEnt1 deconvoluted spectrum is shown inset in Figure 2.
Figure 3a. Fast ion-pair/reversed phase LC/MS analysis of a 76-mer oligonucleotide sample containing 20 mM NaOH and 1 M NaCl. Shown is the mass extracted chromatogram of the molecular ion comprising 27 charges. The conditions were as described in Figure 1.
Figure 3b. Raw ESI (-) spectrum from the LC oa-ToF MS analysis in Figure 2a. The inset shows the deconvoluted mass spectrum illustrating one sodium and one potassium adduct.
Time1.00 2.00 3.00 4.00 5.00 6.00 7.00 8.00 9.00 10.00 11.00 12.00 13.00 14.00 15.00
%
0
100 5.93
m/z600 700 800 900 1000 1100 1200 1300 1400 1500 1600 1700 1800 1900
%
0
100A27
860.3860.3
860.3
A28829.6
829.5
A29800.9
800.9
737.0
730.9
688.9587.0 652.9
A30774.2
860.4
860.4
A26893.4
893.5
893.5
929.3
929.3A24
968.0
968.1A23
1010.2
A221056.1
A211106.4
1106.5
mass22500 22600 22700 22800 22900 23000 23100 23200 23300 23400 23500 23600 23700 23800 23900
%
0
100A
23256.5
23279.0
23297.0
(a)
(b) 23256.5
23279.0
23297.0
mass
%
Besides the average mass of the 76-mer, a sodiated and a potasiated component can be observed. The theoretical mass of the oligonucleotide equals 23256.2 Da, to which the obtained value of 23256.5 Da agrees well (-0.3 Da/-12.9 ppm).
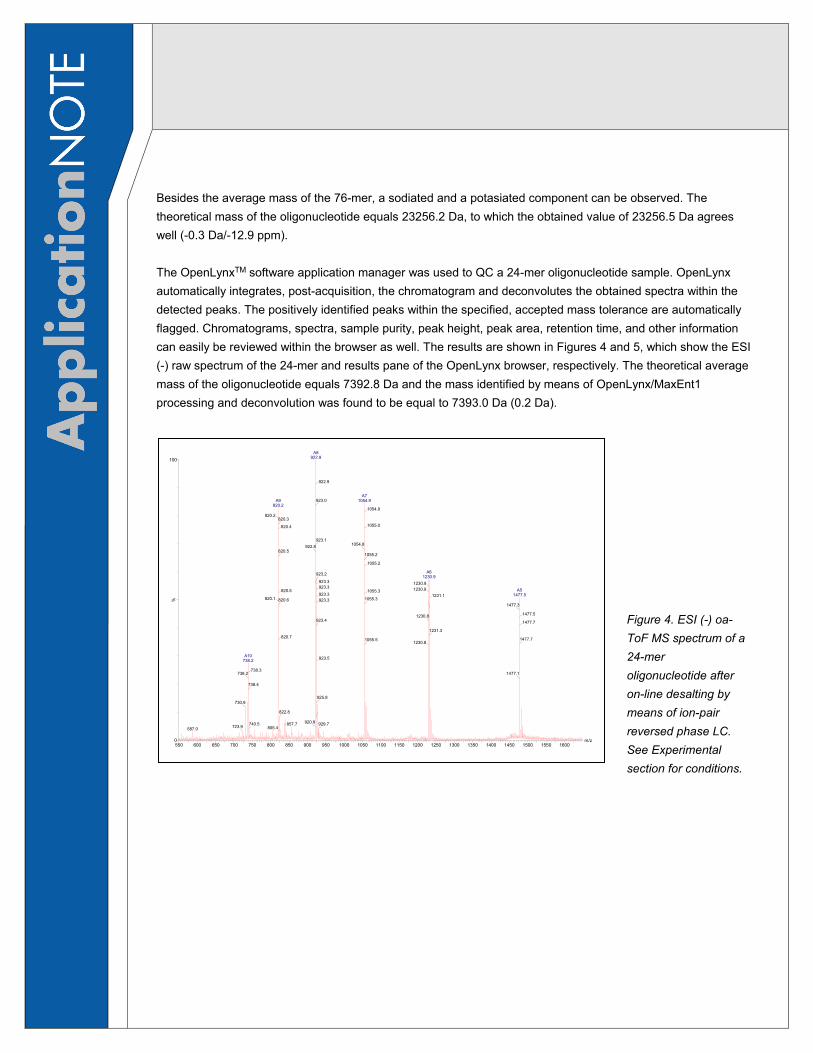
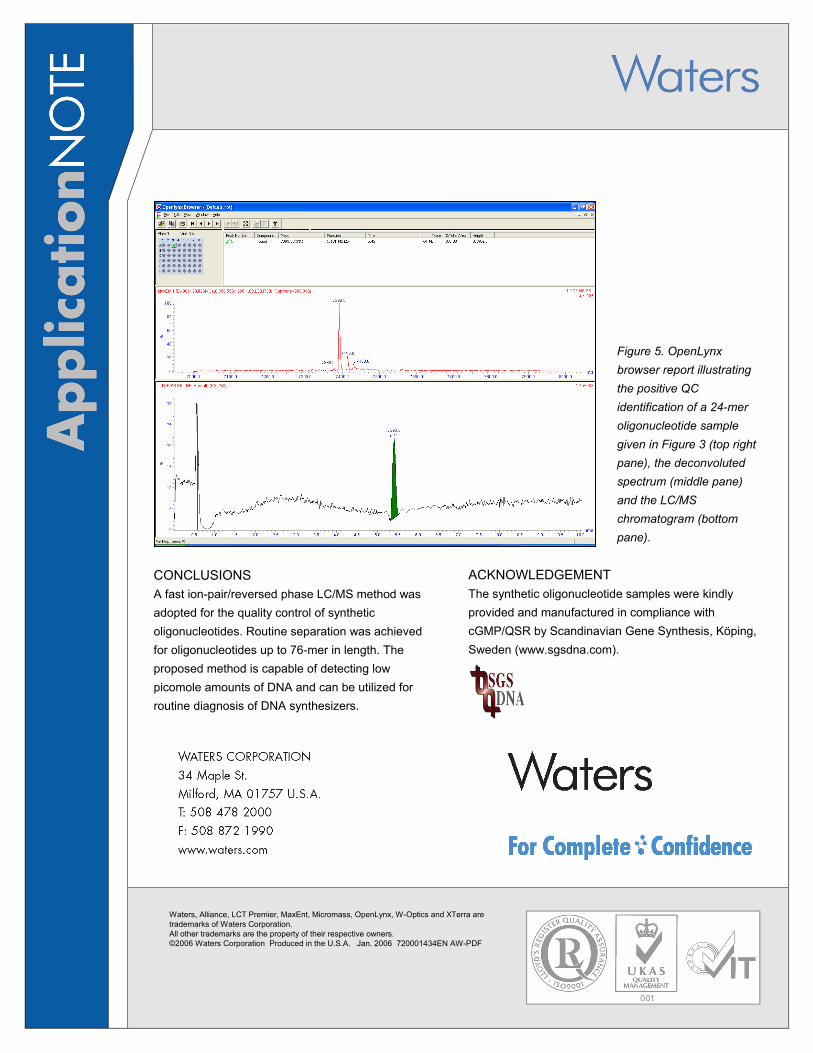
The OpenLynxTM software application manager was used to QC a 24-mer oligonucleotide sample. OpenLynxautomatically integrates, post-acquisition, the chromatogram and deconvolutes the obtained spectra within the detected peaks. The positively identified peaks within the specified, accepted mass tolerance are automatically flagged. Chromatograms, spectra, sample purity, peak height, peak area, retention time, and other information can easily be reviewed within the browser as well. The results are shown in Figures 4 and 5, which show the ESI (-) raw spectrum of the 24-mer and results pane of the OpenLynx browser, respectively. The theoretical average mass of the oligonucleotide equals 7392.8 Da and the mass identified by means of OpenLynx/MaxEnt1 processing and deconvolution was found to be equal to 7393.0 Da (0.2 Da).
Figure 4. ESI (-) oa-ToF MS spectrum of a 24-mer oligonucleotide after on-line desalting by means of ion-pair reversed phase LC. See Experimental section for conditions.
m/z550 600 650 700 750 800 850 900 950 1000 1050 1100 1150 1200 1250 1300 1350 1400 1450 1500 1550 1600
%
0
100A8
922.9
A9820.2
820.2
820.1
A10738.2
738.2
730.9
587.0 723.9
738.3
738.4
740.5805.4
820.3
820.4
922.8820.5
820.5
820.6
820.7
822.8
857.7 920.9
922.9
A71054.9923.0
923.11054.8
923.2
923.3923.3
923.3923.3
923.4
923.5
925.8
929.7
1054.9
1055.0
1055.2
1055.2
A61230.9
1230.91230.91055.3
1055.3
1230.8
1055.5 1230.8
A51477.51231.1
1477.3
1231.3
1477.1
1477.5
1477.7
1477.7
Waters, Alliance, LCT Premier, MaxEnt, Micromass, OpenLynx, W-Optics and XTerra are trademarks of Waters Corporation.All other trademarks are the property of their respective owners.©2006 Waters Corporation Produced in the U.S.A. Jan. 2006 720001434EN AW-PDF
CONCLUSIONSA fast ion-pair/reversed phase LC/MS method was adopted for the quality control of synthetic oligonucleotides. Routine separation was achieved for oligonucleotides up to 76-mer in length. The proposed method is capable of detecting low picomole amounts of DNA and can be utilized for routine diagnosis of DNA synthesizers.
ACKNOWLEDGEMENTThe synthetic oligonucleotide samples were kindly provided and manufactured in compliance with cGMP/QSR by Scandinavian Gene Synthesis, Köping, Sweden (www.sgsdna.com).
Figure 5. OpenLynxbrowser report illustrating the positive QC identification of a 24-mer oligonucleotide sample given in Figure 3 (top right pane), the deconvoluted spectrum (middle pane) and the LC/MS chromatogram (bottom pane).